INTRODUCTION
Leptospirosis is a zoonosis of worldwide distribution. The disease is caused by infection with pathogenic Gram-negative bacteria of the genus Leptospira. The incidence is highest during rainy seasons in tropical regions and during summer and autumn in temperate regions [Reference Levett1, Reference Vinetz2]. Humans and animals are most commonly infected by Leptospira through contact with the urine or birth products (e.g. foetus, placenta, amniotic fluids) of an infected animal or contact with Leptospira-contaminated surface waters, mud, or soil [Reference Vinetz2]. Its presence has been demonstrated serologically in a wide variety of livestock that includes cattle, sheep and goats [Reference Adler and de la Pena Moctezuma3–Reference Levett5]. Acute infections in livestock may result in abortion, stillbirth, decreased milk production, infertility, and death [Reference Faine6] but most leptospiral infections are subclinical and infection is more common than clinical disease. Mastitis can also occur and there may be a disturbance in milk flow and quality, during which time leptospires may be found in the milk [Reference Radostits7]. Chronic leptospirosis and carrier status with colonization of the renal tubules by leptospires for extended periods of time and intermittent shedding of leptospires in urine commonly occur in livestock [Reference Radostits7].
A variety of species are maintenance hosts for particular serovars, e.g. dairy cattle in Europe and USA for L. interrogans serovars Hardjo, Pomona, and Grippotyphosa; pigs for Pomona, Tarassovi, or Bratislava; sheep for Hardjo and Pomona; and dogs for Canicola [Reference Levett1]. Cattle are a reservoir host for L. interrogans serovar Hardjo but are susceptible to infection by other strains for which several wild animal species such as rodents are reservoir hosts [Reference Adler and de la Pena Moctezuma3, Reference Black8–Reference Espi10].
The number of reported cases of human leptospirosis during 1982–1995 in Thailand ranged from 55 to 272 per year. This equates to an average annual incidence of 0·3 cases/100 000 persons [Reference Waraluk11]. The incidence of reported cases then increased markedly from 398 in 1996 to 14 285 in 2000 [12]. There was a decrease during 2001–2003 but levels were still high at 10217 in 2001, 6846 in 2002 and 4958 in 2003 [Reference Tangkanakul13]. Analysis of case data from 1996 to 2002 showed the highest incidence of leptospirosis was in the rainy season, from September to October. Most (90%) of those cases occurred in northeast Thailand [Reference Waraluk and Suthep14].
Domestic cattle and buffaloes in Thailand live in close contact with householders in rural villages and are considered to be important carriers of Leptospira organisms in these ecological settings. The Thailand Department of Livestock Development (DLD) reported in 2002 that the proportion of domestic cattle in the northeast region during 1995–2000 was 34·5–49·8% of the total cattle population of Thailand and the proportion of domestic buffaloes in the same region was 81·1–83·5% of the total buffaloes in Thailand [15]. Wildlife are also affected and the prevalence of positive Leptospira serovar sera from 1664 rodents and shrews trapped in urban and rural settings in low- and high-risk areas in Thailand was 5·6% [95% confidence interval (CI) 4·6–6·8] [Reference Kositanont16].
A basic knowledge of which serovars are present and what their maintenance hosts are is required to understand the epidemiology of leptospirosis in a region. However, the ecological settings for the disease and the epidemiology that apply to one country do not necessarily pertain to another and variations in maintenance hosts and the serovars they sustain feature differently in different locations throughout the world [Reference Levett17].
Since leptospirosis is an important zoonosis that can inflict economic losses in livestock and cause disease in humans, particularly in developing countries, this study was conducted to determine the prevalence of Leptospira serovars in livestock in Thailand and to assess associations between seropositivity and species, sex, age and geographical region.
MATERIALS AND METHODS
Study design and population
A cross-sectional study was conducted to investigate the prevalences of Leptospira serovars in cattle, buffaloes, pigs, sheep, and goats in 36 provinces in Thailand and to assess associations between the risk of seropositivity and species, age, sex and regional location. The inclusion criteria for sampling were (a) that livestock were present in each selected location and (b) owners' consent for enrolment of their animals in the study. A multistage sampling strategy, with stratification by province, district, subdistrict, and village, was used and study areas were randomly selected in each of the nine livestock administrative regions delineated by the DLD. The nine regions in which the study areas were located were the central, east, upper and lower northeast, upper and lower north, west, and upper and lower south regions (Fig. 1). Four provinces were selected from each region and two districts from each province. A sampling frame was prepared by field veterinarians who listed all subdistricts in the selected districts and total numbers of livestock within each village. Six villages from each subdistrict were selected using probability proportional to size sampling and from this sampling frame, ten livestock per village were selected for the study. Thirty-six of the 76 provinces were randomly selected for the study.
[colour online]. Map of Thailand showing the nine Department of Livestock administrative areas and boundaries of provinces. The location of the 36 provinces where animals were sampled are indicated by a solid circular symbol (•).

Sample collection and examination
Blood samples were collected by venepuncture into 10 ml vacuum tubes without additives. Blood was allowed to clot at room temperature and centrifuged at 1500 g for 15 min. Sera were separated and stored at −20 °C.
The microscopic agglutination test (MAT) was performed with a panel of 24 reference serovars based on the standard method [Reference Cole18, Reference Cumberland19] described by the WHO/FAO/OIE Collaborating Centre for Reference and Research on Leptospirosis, Western Pacific Region, Brisbane, Queensland, Australia, in the Manual for the International Training on Laboratory Methods for the Diagnosis of Leptospirosis (2000). The panel of antigens was representative of 23 pathogenic serogroups and one non-pathogenic serogroup. The serovars used in the study were L. interrogans serovars Bratislava (serogroup Australis), Autumnalis, Ballum, Bataviae, Canicola, Celledoni, Cynopteri, Djasiman, Grippotyphosa, Hebdomadis, Icterohaemorrhagiae, Javanica, Louisiana, Manhao, Mini, Panama, Pomona, Pyrogenes, Ranarum, Sarmin, Sejroe, Shermani, Tarassovi, and L. biflexa serovar Patoc. The panel of antigens was obtained from the WHO/FAO/OIE Collaborating Centre for Reference and Research on Leptospirosis. A MAT-positive result was set at a titre of ⩾1:50.
Data analysis
Epi Info version 6 (CDC, USA) was used to test for associations between seropositivity and species, age and sex. Standardized prevalences and prevalence ratios for each region were calculated in EpiSheet [Reference Rothman20] using standardized populations based on the proportions of all species from which blood samples were taken. Unless stated otherwise, prevalences are reported throughout the paper as test-positive percentages with exact 95% CIs in parentheses.
RESULTS
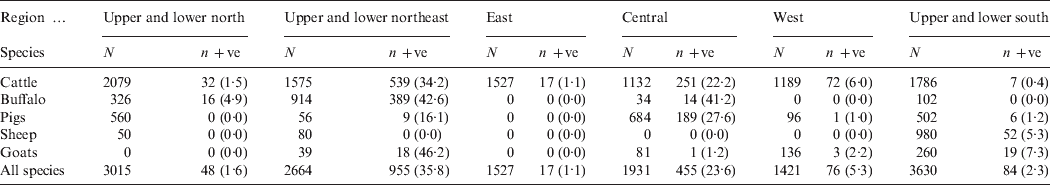
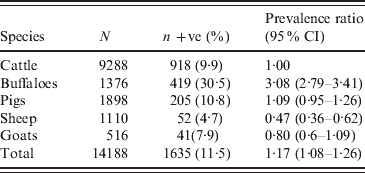
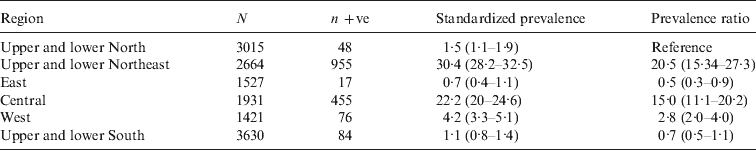
A total of 14188 sera, of which 1635 were positive by MAT were collected between January and August 2001 from cattle, buffaloes, pigs, sheep and goats in 36 provinces in the six main DLD administrative regions (Fig. 1) The apparent prevalence of leptospirosis seropositivity in all livestock was 11·5% (95% CI 11·0–12·0). Numbers of sera from each species which were tested by the MAT and numbers and percentages of test-positives and prevalence ratios for which cattle were the reference species with a value of 1·00 are shown in Table 1. It can be seen that buffaloes were 3·08 times (95% CI 2·79–3·41) more likely to test positive than cattle. Standardized prevalences and prevalence ratios for each species in each of the six main DLD administrative regions are shown in Table 2. The highest prevalence (30·4%, 95% CI 28·2–32·5) was in the northeast region and the next highest was in the central region (22·2%, 95% CI 20–24·6). The prevalence ratios show the prevalence in the northeast and central regions to be 20·5 and 15 times higher, respectively, than in the north reference region. The prevalence in the west region was 2·8 times higher and the prevalences in the east and south regions were lower at 0·5 and 0·7, respectively, than the in the north.
Numbers of each species of animal tested (N), number MAT positive (n +ve) with percentage in parentheses (%) and prevalence ratios with 95% confidence intervals (CI) in parentheses
MAT, Microscopic agglutination test.
Numbers of animals tested (N), number MAT positive (n +ve), standardized prevalences and prevalence ratios for the six main Department of Livestock administrative regions. The standardized prevalences and prevalence ratios are shown as estimates with 95% confidence intervals in parentheses
MAT, Microscopic agglutination test.
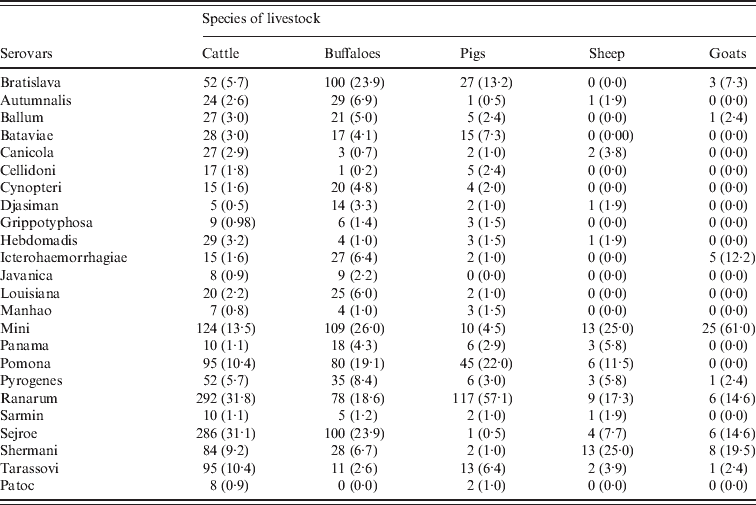
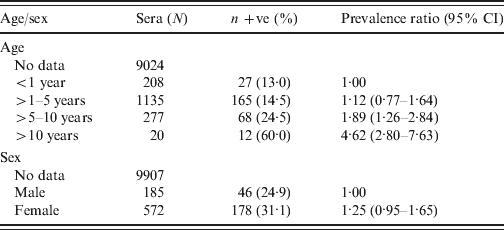
The numbers of each species of livestock tested by MAT and the numbers which were positive in the six main DLD administrative regions are shown in Table 3. The highest prevalences were recorded in cattle and buffaloes in the northeast region. Of the 1575 cattle which were tested in this region 539 (34·2%, 95% CI 32–36·6) were positive and of the 914 buffaloes which were tested 389 (42·6%, 95% CI 39·4–45·8) were positive. Table 4 shows the distributions of positive MAT results by serovar for 918 cattle, 419 buffaloes, 205 pigs, 52 sheep and 41 goats. The serovars Ranarum (31·8%), Sejroe (31·1%), and Mini (13·5%), were the most common in cattle and Mini (26·0%), Sejroe (23·9%), and Bratislava (23·9%), the most common in buffaloes, In the other species Ranarum (57·1%), Pomona (22·0%), and Bratislava (13·2%) occurred most commonly in pigs, Mini (25·0%), Shermani (25·0%), and Ranarum (17·3%) in sheep, and Mini (61·0%), Shermani (19·5%), Ranarum and Sejroe (14·6%) in goats. Associations between age and sex and seropositivity in cattle and buffaloes considered together and expressed as prevalence ratios for four age groups and separately for sex are shown in Table 5. The risk of seropositivity increased with increasing age and there was no significant difference in seropositivity between male and female buffaloes and cattle.
Numbers of each species tested (N), number MAT positive (n +ve) and percent positive in parentheses in the six main Department of Livestock administrative regions
MAT, Microscopic agglutination test.
Serovar prevalences of MAT-positive animals and percentages (in parentheses)* in each livestock species
MAT, Microscopic agglutination test.
* The denominators used for calculation of the percentages were the total number of seropositive animals recorded for each species.
Prevalence ratio and age and sex breakdown for MAT-positive cattle and buffalo sera with age (N = 1640) and sex (N = 757) recorded
MAT, Microscopic agglutination test; CI, confidence interval.
DISCUSSION
This study provides baseline information about the prevalence of serological evidence of infection by 24 reference serovars of leptospirosis in cattle, buffaloes, pigs, sheep and goats in the six main DLD administrative regions of Thailand in 2001. All sera were tested by MAT, which is the most widely used reference diagnostic test because of its high sensitivity and specificity and its ability to identify to serogroup or serovar level [Reference Adler and de la Pena Moctezuma3, Reference Cole18, Reference Cumberland19, 21]. The sensitivity and specificity of the MAT, reported in a recent study by Dassanayake et al. [Reference Dassanayake22] were 92·0% and 73·8%, respectively. A low initial serum dilution was used to increase sensitivity of the MAT for detection of evidence of exposure to leptospires. Low cut-off points have been used in other studies, e.g. 1:10 in a serosurvey of cattle in Asturias northern Spain [Reference Espi10], 1:24 in a serosurvey of meat inspectors in New Zealand [Reference Blackmore and Schollum23], 1:30 in a serosurvey of leptospiral infections in dairy cows in Galicia, Spain [Reference Guitian24], 1:40 in a serosurvey of domestic animals in West Malaysia [Reference Bahaman4], and 1:50 in a serosurvey of beef cattle in central Queensland [Reference Black8] and in a serosurvey of buffalo herds in Italy [Reference Ciceroni25]. Comparison of results between studies is difficult because of the variation in the choices of cut-points.
In our study, the seroprevalence of leptospirosis in cattle and buffalo recorded in the northeast region of Thailand in 2001 was 34·2% (95% CI 32–36·6) for cattle and 42·6 (95% CI 39·4–45·8) for buffaloes. The seroprevalence in buffaloes was significantly higher than in cattle in our study which was conducted in 2001 and similar to a study of livestock in five northeast provinces of Thailand conducted during August–September 1999 [Reference Suwancharoen26]. High seroprevalence of leptospirosis in buffaloes was also found in other studies: 67% (293 sera) in Italy [Reference Ciceroni25] and 14·6% (226 sera) in Trinidad [Reference Adesiyun27]. The most likely explanation for the high prevalence in buffaloes in the Thailand studies is that most of the buffaloes in Thailand are swamp buffaloes (Bubalus bubalis) which live in close proximity to swamps, ponds and muddy places. Similar wet and aquatic environments were identified as risky for humans in a study on human exposure to leptospires by Tangkanakul et al. [Reference Waraluk11, Reference Tangkanakul28]. They found that walking through water (OR 4·9, 95% CI 1·7–14·1), applying fertilizer in wet fields for more than 6 h a day (OR 3·4, 95% CI 1·5–7·8), ploughing in wet fields for more than 6 h a day (OR 3·5, 95% CI 1·1–11·6), and pulling out rice plant sprouts in wet fields for more than 6 h a day (OR 3·1, 95% CI 1·0–9·3) were all risk factors associated with leptospirosis infection in northeast Thai villagers.
The prevalence of seropositive cattle increased with age in our study and gives support to similar findings in other studies by Ciceroni et al. [Reference Ciceroni25] and Black et al. [Reference Black8], although our results should be considered with caution because of the high proportion of unrecorded data for this exposure variable. The most plausible explanation for increases in levels of prevalence with increasing age is more opportunities for exposure over longer periods of time. The longer the period of exposure, the greater the probability that animals will become infected and, as a consequence, become chronic carriers and shedders of leptospires into the environment. Shedding may continue for months or even years, thereby constituting a serious long-term health hazard [Reference Farrington and Sulzer29].
The most common serovars found in cattle in this study were Ranarum, Sejroe, and Mini, and in buffaloes Mini, Sejroe, Bratislava (serogroup Australis) and Ranarum, suggesting common sources of infection for both species or inter-species transmission of infection. Studies in other countries have shown that leptospiral infection is common in cattle populations with the most common antibodies detected being against serogroup Sejroe (serovars Hardjo and Sejroe) in Zimbabwe [Reference Feresu30] and Malaysia [Reference Bahaman4] and the serogroups Sejroe (serovar Sejroe) and Ranarum (serovar Ranarum) in Portugal [Reference Collares-Pereira31]. Our results for cattle, buffaloes and pigs are similar to those reported from a previous serological survey of leptospiral antibodies in livestock in five northeast provinces of Thailand [Reference Suwancharoen26]. However, serogroup Mini (serovar Mini), which was common in our study, has not been previously reported in cattle and buffaloes in Thailand.
The epidemiology of transmission patterns between hosts of different species in Thailand has not been determined. However, distributions of serovars previously reported in humans and other species in Thailand provide some basis for comparing the distributions in our study with those involving different species. Panaphut et al. [Reference Panaphut32] reported a prospective cohort study of patients in Khon Kaen in northeast Thailand in which L. interrogans serovars Sejroe and Bratislava were the two most frequent serovars detected in a subsample of 35 patients, although historically L. interrogans serovars Bataviae and Icterohemorrhagiae were the most common isolates in affected patients in that area. Waraluk & Suthep [Reference Waraluk and Suthep14] reported seropositivity in patients in Nakhon Ratchasima in 1998 for serovars Bratislava, Icterohaemorrhagiae and Mini and positivity for serovars Ranarum, Sarmin and Bratislava in patients in Sakon Nakhon in 2000–2001. Wimol et al. [Reference Wimol33] tested a total of 1763 sera from patients using the MAT in 2005 and found the distribution of serovars detected was Bratislava (28·7%), Sejroe (17·7%), Australis (9·4%), Shermani (8·5%), Panama (7·9%), Javanica (6·7%), Cynopteri (5·5%), Mini (5·5%), Bataviae (3·0%), Grippotyphosa (3·0%) and Autumnalis (2·0%). Of 211 dogs which were tested by MAT, 27 (12·8%) were positive with a distribution of serogroups among the positives of Bataviae (24·4%), Canicola (18·5%), Australis (11·1%) and Icterohaemorrhagiae (11·1%). Of 145 rodents, three were positive for serogroups Autumnalis, one for Panama and one for Pyrogenes. Since 2002, the most prevalent serogroup has been Australis (serovar Bratislava) followed by Sejroe, Bataviae, and Javanica. The most commonly detected antibodies in rodents and shrews trapped in Thailand were against serovars Pyrogenes (39·1%), Sejroe (19·1%), Bataviae (10·0%), Pomona (6·4%), Autumnalis (5·5%), Copenhageni (3·6%), and Javanica (3·6%) [Reference Kositanont16]. Further, Oni et al. [Reference Oni34] found a 58·0% seroprevalence of leptospirosis in domesticated Asian elephants (Elephas maximus) in northern Thailand, with the most prevalent serovars being Sejroe, Tarassovi, Ranarum, and Shermani. A similar prevalence of 57% was found in west Thailand where the prevalent serovars were Tarassovi, Sejroe, Ranarum, Bataviae, and Shermani.
These studies indicate common occurrence of the same serovars in different species; Ranarum in bovines, buffaloes, pigs, sheep, goats, humans and elephants, Sejroe in bovines, buffaloes, humans, goats and rodents, Mini in bovines, buffaloes, sheep, goats and humans, Bratislava in bovines, buffaloes, pigs, goats and humans, and Shermani in sheep, goats, bovines, buffaloes, humans and elephants. As shown in Table 3, cattle, buffaloes and pigs had antibodies against most of the panel of antigens. In contrast, sheep and goats were infected by only a few serovars. This may be due to the fewer numbers of animals examined and lower positivity in sheep and goats. Another explanation may be different husbandry systems for sheep and goats than for cattle and buffaloes and different exposure risks because of different habitats. Sheep and goats are not normally kept in locations where weather conditions are wet. However, the narrow spectrum of serovars observed here may reflect species difference of host susceptibility to certain serovars. This suggests two possibilities of infection source or infection cycle: (1) livestock are a source of infection to humans and (2) both humans and livestock are infected from the same source, e.g. rodents. A longitudinal incidence study in a relatively high prevalence district would be useful for determining which of these two possibilities is the more likely and for investigating the role of different species in inter-species transmission of infection.
ACKNOWLEDGEMENTS
The authors thank the staff of the Regional Veterinary Research and Development Center for their cooperation and technical help during the study period. We also thank Dr Lee D. Smythe and Dr Sharon Y. A. M. Villanueva for their critical discussion regarding the manuscript, the Japan Society for the Promotion of Science RONPAKU (Dissertation Ph.D.) programme and Dr Ron Jackson for assistance in the preparation of the paper for publication.
DECLARATION OF INTEREST
None.