


Nomenclature
- ${A_b}$
-
surface area at bluff-body [m
${^2}$
] -
${A_\alpha }$
-
flame angle tangent
-
${A_{geo}}$
-
surface area at swirler [m
${^2}$
] -
$d$
-
injector outer diameter [m]
-
${{\mathcal{L}}_b}$
-
Markstein length [m]
-
${l_t}$
-
turbulence integral length scale [m]
- Ka
-
Karlovitz number
- Le
-
Lewis number
-
${\dot m_{air}}$
-
air mass flow rate [kg s
${^{ - 1}}$
] -
${\dot m_{{H_2}}}$
-
hydrogen mass flow rate [kg s
${^{ - 1}}$
] -
${\mathbf{n}}$
-
flame front unit normal vector
- Pe
-
Péclet number
-
$S$
-
swirl velocity ratio at the bluff-body
-
${S_{geo}}$
-
swirler geometric swirl number
-
${S_{geo,b}}$
-
-geometric swirl number at the bluff-body
-
${s_a}$
-
stoichiometric ratio
-
$S_L^0$
-
unstretched laminar flame speed [m s
${^{ - 1}}$
] -
${S_L}$
-
stretched laminar flame speed [m s
${^{ - 1}}$
] -
${S_d}$
-
local flame displacement speed [m s
${^{ - 1}}$
] -
${T_b}$
-
burnt gas temperature [K]
-
${T_u}$
-
unburnt gas temperature [K]
-
${T^0}$
-
inner flame temperature [K]
-
${U_b}$
-
mixture axial bulk velocity at the bluff-body [m s
${^{ - 1}}$
] -
$u^{\prime}$
-
turbulent velocity fluctuation [m s
${^{ - 1}}$
] -
${v_{r,0}}$
-
radial steady velocity component [m s
${^{ - 1}}$
] -
${v_{\theta, 0}}$
-
azimuthal steady velocity component [m s
${^{ - 1}}$
] -
${v_{z,0}}$
-
Axial steady velocity component [m s
${^{ - 1}}$
] -
${\mathbf{v}}$
-
Velocity vector at the flame front [m s
${^{ - 1}}$
] -
${{\mathbf{w}}_s}$
-
flame front surface velocity vector [m s
${^{ - 1}}$
] - Ze
-
Zeldovitch number


Greek symbol
-
$\alpha $
-
base angle between vertical axis and flame front [deg]
-
$\beta $
-
local ratio of azimuthal flow speed to flame displacement speed
-
$\varepsilon $
-
mass flow rate reading uncertainty
-
$\eta $
-
Kolmogorov scale [m]
-
$\delta $
-
flame thickness [m]
-
${{{\Delta }}_s}$
-
flame stabilisation criterion
-
$\kappa $
-
flame stretch [s
${^{ - 1}}$
] -
$\phi $
-
equivalence ratio
-
$\mu $
-
dynamic viscosity [Pa s]
-
$\nu $
-
kinematic viscosity [m
${^2}$
s
${^{ - 1}}$
] -
${\rho _b}$
-
burnt gas density [kg m
${^{ - 3}}$
] -
${\rho _m}$
-
mixture reactant density [kg m
${^{ - 3}}$
] -
${\rho _u}$
-
unburnt mixture gas density [kg m
${^{ - 3}}$
] -
${\tau _{cv}}$
-
through flame front convective characteristic time [s]
-
${\tau _b}$
-
burning characteristic time [s]


1.0 Introduction
The hydrogen economy has been proposed [1] to replace the fossil-fuel economy in order to address energy security, air quality and global warming. Towards this goal, hydrogen extraction and production methods, production site locations or transport modes and utilisation methods are critical. Among utilisation methods, there are two main foreseen paths: fuel-cells and thermal-powered technologies. The latter, based on the combustion of hydrogen fuel has been limited, with applications including rockets and ground-based gas turbines to date because of the following challenges: (i) safety concerns associated with autoignition, flashback, flammability and explosion limits, and minimum ignition energy, and (ii) generation of nitrogen oxides. The literature to date and the present study demonstrate that several of these challenges can be controlled, and the major identified flame stabilisation knowledge gap filled. Highly swirled hydrogen lean fully premixed flame associates a carbon-free fuel, a low adiabatic flame temperature reducing the thermal-induced nitrogen oxides formation occurring through the Zeldovich mechanism [Reference Zeldovich2], and a highly swirled flow inducing an inner recirculation zone [Reference Beér and Chigier3, Reference Gupta4] characterised by a reversal axial flow. This latter feature contributes ensuring scaling for a range of inlet air mass flow rates in combustors.
Flame stabilisation has been investigated in several studies for various combustion systems [Reference Karagozian5–Reference Ballal and Lefebvre7]. It can be defined as the branch of reacting fluid mechanics focused on understanding, describing and predicting flame position, shape and speed for thermal-powered applications. It also includes flashback [Reference Kalantari and McDonell8] and blowout [Reference Shanbhogue, Husain and Lieuwen9]. For swirling flames, a few major flow features are relevant to flame stabilisation or combustion dynamics. Among the known features for swirling flows are: the vortex breakdown [Reference Sarpkaya10, Reference Sarpkaya11] either axisymmetric or spiral, the characteristic flow shear layers [Reference O’Connor12], the inner recirculation zone resulting from the vortex breakdown [Reference Beér and Chigier3], and the global spiral mode also referred as helical mode documented in literature [Reference Oberleithner, Sieber, Nayeri, Paschereit, Petz, Hege, Noack and Wygnanski13]. The vortex breakdown [Reference Sarpkaya11] occurs when the ratio of tangential momentum flux to axial momentum flux, most often defined with a swirl number or swirl to axial velocities ratio, reaches a critical value. This induces a flowfield change charactersed by a stagnation point followed by a reversal velocity region: the inner recirculation zone. Low swirl flames do not have this feature whereas highly swirled flames do. This zone is used in gas turbine combustors to anchor swirling flames. To date understanding is highly swirled flame are stabilised because this reverse flow has a favourable low speed region of hot burnt gases continuously igniting the upstream fresh mixture. A precessing vortex core [Reference Syred14, Reference An, Kwong, Geraedts and Steinberg15] (PVC) can be superimposed on the inner recirculation zone (IRZ) induced by the axisymmetric vortex breakdown and both the PVC and IRZ can exhibit precessing motions of the vortex core and of the stagnation point, respectively.
Whereas flame stabilisation processes have been studied for low swirl flames at atmospheric conditions and at high swirl for several fuels blended with hydrogen, there is no prior research for the high swirl 100 ${{\% }}$
hydrogen-air premixed fully regime because of flashback [Reference Novoselov, Ebi and Noiray16] and no general stabilisation criterion available for these flames. The present experimental and analytical research leads to a criterion for lean fully premixed highly swirled flames in the near unity Karlovitz number turbulent premixed combustion regime. In this regime, referred to the flamelet regime [Reference Veynante and Vervisch17, Reference Veynante18], the local flame displacement speed is the so-called stretched laminar flame displacement speed S
${{\% }}$
hydrogen-air premixed fully regime because of flashback [Reference Novoselov, Ebi and Noiray16] and no general stabilisation criterion available for these flames. The present experimental and analytical research leads to a criterion for lean fully premixed highly swirled flames in the near unity Karlovitz number turbulent premixed combustion regime. In this regime, referred to the flamelet regime [Reference Veynante and Vervisch17, Reference Veynante18], the local flame displacement speed is the so-called stretched laminar flame displacement speed S ${_L}$
[Reference Giannakopoulos, Gatzoulis, Frouzakis, Matalon and Tomboulides19–Reference Chen and Im21]. This quantity has been classically measured with the spherical expanding flame configuration for hydrogen/air premixed flames in several studies [Reference Beeckmann, Hesse, Kruse, Berens, Peters, Pitsch and Matalon22, Reference Shu, Xue, Liang and Ren23]. Lean premixed hydrogen-air flames can exhibit cellular structures on the flame front surface associated to preferential diffusion [Reference Wang, Elbaz, Wang, Wang and Roberts24–Reference Bell, Cheng, Day, Beckner and Lijewski26]. When swirl is added, competing effects between the cellular structures and the swirler-induced turbulence impact the flame sheet wrinkling. Whereas those effects are yet to be delineated in highly swirled configurations, literature to-date [Reference Day, Tachibana, Bell, Lijewski, Beckner and Cheng25, Reference Aspden, Day and Bell27–Reference Xiao and Palies29] indicates that the flame front remains in the flamelet or corrugated regime where the stretched laminar flame displacement speed is relevant, yet with significant variations across the flame surface.
${_L}$
[Reference Giannakopoulos, Gatzoulis, Frouzakis, Matalon and Tomboulides19–Reference Chen and Im21]. This quantity has been classically measured with the spherical expanding flame configuration for hydrogen/air premixed flames in several studies [Reference Beeckmann, Hesse, Kruse, Berens, Peters, Pitsch and Matalon22, Reference Shu, Xue, Liang and Ren23]. Lean premixed hydrogen-air flames can exhibit cellular structures on the flame front surface associated to preferential diffusion [Reference Wang, Elbaz, Wang, Wang and Roberts24–Reference Bell, Cheng, Day, Beckner and Lijewski26]. When swirl is added, competing effects between the cellular structures and the swirler-induced turbulence impact the flame sheet wrinkling. Whereas those effects are yet to be delineated in highly swirled configurations, literature to-date [Reference Day, Tachibana, Bell, Lijewski, Beckner and Cheng25, Reference Aspden, Day and Bell27–Reference Xiao and Palies29] indicates that the flame front remains in the flamelet or corrugated regime where the stretched laminar flame displacement speed is relevant, yet with significant variations across the flame surface.
Von Elbe and Lewis [Reference Von Elbe and Lewis30] documented initial work on laminar premixed flames with the development of a theory for stabilisation based on the representation of the flame front as a single surface inclined at a given angle with respect to the unburned premixed stream. The flashback of this flame front was shown to be controlled by thermal quenching on the rim of the burner by comparing theoretical results with experimental data. Cheng et al. [Reference Yegian and Cheng31] researched turbulent low swirled premixed flames. To stabilise the turbulent premixed flame fixed in the laboratory frame of reference, the low-swirl burner [Reference Cheng, Littlejohn, Strakey and Sidwell32] (or injector) employs a flow that lower the swirl level so that vortex breakdown, a precursor to the formation of flow reversal and recirculation zone, does not occur, yielding a different flowfield and flow regime than high swirl. Those pioneering studies [Reference Von Elbe and Lewis30, Reference Cheng, Littlejohn, Strakey and Sidwell32] emphasised respectively the role of the laminar flame displacement speed S $_L^0$
and the turbulent flame speed, versus the local flow speed in flame stabilisation, and thus the link to kinematic. Demonstrations of turbulent highly swirled fully premixed methane/air flames have been made by Williams et al. [Reference Williams, Schefer, Oefelein and Shaddix33], Thumuluru and Lieuwen [Reference Thumuluru and Lieuwen34] and Palies et al. [Reference Palies, Durox, Schuller, Morenton and Candel35]. In the former study [Reference Williams, Schefer, Oefelein and Shaddix33], the operating envelope of the combustor was experimentally assessed to map region of combustion instabilities, blowout and stabilised flame. All near flame components were water-cooled in this system. In Refs. (Reference Thumuluru and Lieuwen34, Reference Palies, Durox, Schuller, Morenton and Candel35) the focus was on flame response measurements. Low swirled flames with mixture of blended H
$_L^0$
and the turbulent flame speed, versus the local flow speed in flame stabilisation, and thus the link to kinematic. Demonstrations of turbulent highly swirled fully premixed methane/air flames have been made by Williams et al. [Reference Williams, Schefer, Oefelein and Shaddix33], Thumuluru and Lieuwen [Reference Thumuluru and Lieuwen34] and Palies et al. [Reference Palies, Durox, Schuller, Morenton and Candel35]. In the former study [Reference Williams, Schefer, Oefelein and Shaddix33], the operating envelope of the combustor was experimentally assessed to map region of combustion instabilities, blowout and stabilised flame. All near flame components were water-cooled in this system. In Refs. (Reference Thumuluru and Lieuwen34, Reference Palies, Durox, Schuller, Morenton and Candel35) the focus was on flame response measurements. Low swirled flames with mixture of blended H ${_2}$
-CH
${_2}$
-CH ${_4}$
-Air gases have been investigated by Davis et al. [Reference Davis, Therkelsen, Littlejohn and Cheng36], Therkelsen et al. [Reference Therkelsen, Portillo, Littlejohn, Martin and Cheng37] and Palies et al. [Reference Palies, Ilak and Cheng38] with respect to thermoacoustic instability. These studies pioneered H
${_4}$
-Air gases have been investigated by Davis et al. [Reference Davis, Therkelsen, Littlejohn and Cheng36], Therkelsen et al. [Reference Therkelsen, Portillo, Littlejohn, Martin and Cheng37] and Palies et al. [Reference Palies, Ilak and Cheng38] with respect to thermoacoustic instability. These studies pioneered H ${_2}$
-CH
${_2}$
-CH ${_4}$
-Air low swirl flames and demonstrated that both low swirled and high swirled flames obey to identical combustion instabilities mechanisms.
${_4}$
-Air low swirl flames and demonstrated that both low swirled and high swirled flames obey to identical combustion instabilities mechanisms.
The turbulent highly swirled premixed flame regime with hydrogen enrichment of methane-air premixtures have been investigated by Schefer et al. [Reference Schefer, Wicksall and Agrawal39] and Burguburu et al. [Reference Burguburu, Cabot, Renou, Boukhalfa and Cazalens40] initially. The addition of hydrogen to a premixture of methane-air in low swirl flames [Reference Therkelsen, Portillo, Littlejohn, Martin and Cheng37] was shown to change the flame shape significantly, an observation also reported for highly swirled flames [Reference Schefer, Wicksall and Agrawal39]. The investigation of two injections strategies (partially premixed versus fully premixed enrichment of aviation jet fuel) in Ref. [Reference Burguburu, Cabot, Renou, Boukhalfa and Cazalens40] showed that the partially premixed regime yields higher nitrogen oxides that can be attributed to the occurrence of regions of both lean and richer mixtures compared to the fully premixed case. The study of Taamallah et al. [Reference Taamallah, Shanbhogue and Ghoniem41] focused on the effects of the CH ${_4}$
to H
${_4}$
to H ${_2}$
mass fraction ratio of the premixture, flow Reynolds number, swirler blade angle and heat loss with respect to the presence or not of the outer flame branch. The authors [Reference Taamallah, Shanbhogue and Ghoniem41] proposed that the flame transition from inner only branch to inner/outer branches was driven by a flow and flame times associated respectively with an unsteady process on the outer branch and an extinction strain rate characteristic time. Guiberti et al. [Reference Guiberti, Durox, Scouflaire and Schuller42] investigated high swirl for H
${_2}$
mass fraction ratio of the premixture, flow Reynolds number, swirler blade angle and heat loss with respect to the presence or not of the outer flame branch. The authors [Reference Taamallah, Shanbhogue and Ghoniem41] proposed that the flame transition from inner only branch to inner/outer branches was driven by a flow and flame times associated respectively with an unsteady process on the outer branch and an extinction strain rate characteristic time. Guiberti et al. [Reference Guiberti, Durox, Scouflaire and Schuller42] investigated high swirl for H ${_2}$
-CH
${_2}$
-CH ${_4}$
-Air mixture with particular attention to the combustor’s wall heat transfer. This heat transfer was shown to induce either a flame stabilised with an inner only or both an inner plus outer branches. Chterev and Boxx [Reference Chterev and Boxx43] conducted experiments to observe the flame shape at various operating pressures (1, 3 and 5 atm) up to 50
${_4}$
-Air mixture with particular attention to the combustor’s wall heat transfer. This heat transfer was shown to induce either a flame stabilised with an inner only or both an inner plus outer branches. Chterev and Boxx [Reference Chterev and Boxx43] conducted experiments to observe the flame shape at various operating pressures (1, 3 and 5 atm) up to 50 ${{\% }}$
hydrogen content in volume of the fuel blend. Experiments were complemented with computational studies by Agostinelli et al. [Reference Agostinelli, Laera, Chterev, Boxx, Gicquel and Poinsot44] for stabilisation understanding in the partially premixed regime. It was experimentally shown [Reference Chterev and Boxx43] that a flame with both inner and outer branches stabilised at atmospheric pressure for low hydrogen enrichment content. When increasing the hydrogen content, a transition was shown towards a flame stabilised with only the inner branch depending upon the hydrodynamic strain in the shear layer. Both regimes were observed in between low and high hydrogen content cases. It was also concluded that increasing both operating pressure and hydrogen enrichment decreased the flame length. Highly swirled flames in the partially premixed flame regime has been studied in a configuration without center-body by Reichel et al. [Reference Reichel, Terhaar and Paschereit45, Reference Reichel, Goeckeler and Paschereit46] with preheated inlet air. Sattelmayer et al. [Reference Sattelmayer, Mayer and Sangl47] and Mayer et al. [Reference Mayer, Sangl, Sattelmayer, Lachaux and Bernero48] investigated technically premixed hydrogen-air swirled flames stabilisation and flashback mechanisms with preheated air. In these configurations, the fuel is injected respectively through multiple holes [Reference Reichel, Terhaar and Paschereit45] or tangential slits [Reference Mayer, Sangl, Sattelmayer, Lachaux and Bernero48, Reference Sattelmayer, Mayer and Sangl47] to mix with air without a premixing unit as undertaken in this article. The turbulent low swirled regime with 100
${{\% }}$
hydrogen content in volume of the fuel blend. Experiments were complemented with computational studies by Agostinelli et al. [Reference Agostinelli, Laera, Chterev, Boxx, Gicquel and Poinsot44] for stabilisation understanding in the partially premixed regime. It was experimentally shown [Reference Chterev and Boxx43] that a flame with both inner and outer branches stabilised at atmospheric pressure for low hydrogen enrichment content. When increasing the hydrogen content, a transition was shown towards a flame stabilised with only the inner branch depending upon the hydrodynamic strain in the shear layer. Both regimes were observed in between low and high hydrogen content cases. It was also concluded that increasing both operating pressure and hydrogen enrichment decreased the flame length. Highly swirled flames in the partially premixed flame regime has been studied in a configuration without center-body by Reichel et al. [Reference Reichel, Terhaar and Paschereit45, Reference Reichel, Goeckeler and Paschereit46] with preheated inlet air. Sattelmayer et al. [Reference Sattelmayer, Mayer and Sangl47] and Mayer et al. [Reference Mayer, Sangl, Sattelmayer, Lachaux and Bernero48] investigated technically premixed hydrogen-air swirled flames stabilisation and flashback mechanisms with preheated air. In these configurations, the fuel is injected respectively through multiple holes [Reference Reichel, Terhaar and Paschereit45] or tangential slits [Reference Mayer, Sangl, Sattelmayer, Lachaux and Bernero48, Reference Sattelmayer, Mayer and Sangl47] to mix with air without a premixing unit as undertaken in this article. The turbulent low swirled regime with 100 ${{\% }}$
hydrogen content was pioneered by Cheng et al. [Reference Cheng, Littlejohn, Strakey and Sidwell32]. The study [Reference Cheng, Littlejohn, Strakey and Sidwell32] demonstrated a similar stabilisation mechanism both at atmospheric and gas turbine operating conditions.
${{\% }}$
hydrogen content was pioneered by Cheng et al. [Reference Cheng, Littlejohn, Strakey and Sidwell32]. The study [Reference Cheng, Littlejohn, Strakey and Sidwell32] demonstrated a similar stabilisation mechanism both at atmospheric and gas turbine operating conditions.
The blowout, also known as flameout occurring when a flame exits the combustor, and the blowoff occurring when a flame extinguishes on itself in the lean flammability limit are also important processes relevant to flame stabilisation. Both mechanisms can occur together for premixed flames [Reference Palies and Acharya49]. For swirling flames in the fully premixed mode, this phenomenon arises mostly at the lowest equivalence ratios near the lean flammability limit. A few articles have investigated the transient to blowoff/blowout and the underlying mechanisms in fully premixed regime. For bluff-body flames, the mechanisms have been established as a sequence of three steps [Reference Shanbhogue, Husain and Lieuwen9]. During the first step, local extinctions occur on the flame front, whereas in a second step, large scale features are at work and ultimately lead to blowoff onset, the last step. This onset is due to the inner recirculation zone cooling and its size reduction. The effect of turbulence has also been researched [Reference Chowdhury and Cetegen50] with the observation of a broken reaction zone prior the blowoff onset. Experimental velocity measurements confirmed the reactants motion towards the recirculation zone. This process has been investigated on swirled premixed flames as well recently [Reference Kumar, Chterev, Stepien, Sirignano, Emerson, Fugger, Jiang, Roy and Lieuwen51] with laser diagnostics and analyses. Identification of extinction events on the flame sheet were associated with the likelihood of unburnt mixture flowing throughout the subsequent flame holes [Reference Kumar, Chterev, Stepien, Sirignano, Emerson, Fugger, Jiang, Roy and Lieuwen51] caused by local extinction. In Ref. [Reference Palies and Acharya49], computations were conducted to describe the mechanisms of transition to lean blowout initially observed on the experiment of Cavaliere et al. [Reference Cavaliere, Kariuki and Mastorakos52]. Whereas extinction events were not observed on the flame sheet, the simulations demonstrated the entrainment of unburnt premixture towards the inner recirculation zone. Limited work to date has been undertaken for premixed hydrogen-air swirled flames to confirm those mechanisms.
The flashback of premixed highly swirled flames has been the topic of several works. Fully premixed methane and H ${_2}$
-CH
${_2}$
-CH ${_4}$
blend [Reference Ebi and Clemens53, Reference Ranjan, Ebi and Clemens54] flames have been studied to describe basic mechanistic behaviour with advanced high-speed particle image velocimetry and chemiluminescence flame imaging. Transient sequences of flame flashing back in the upstream tube demonstrated the existence of large-scale flow feature creating a local negative axial velocity sustaining the upstream propagation. These works also support a kinematic flow-flame front description. Research on flashback with 100
${_4}$
blend [Reference Ebi and Clemens53, Reference Ranjan, Ebi and Clemens54] flames have been studied to describe basic mechanistic behaviour with advanced high-speed particle image velocimetry and chemiluminescence flame imaging. Transient sequences of flame flashing back in the upstream tube demonstrated the existence of large-scale flow feature creating a local negative axial velocity sustaining the upstream propagation. These works also support a kinematic flow-flame front description. Research on flashback with 100 ${{\% }}$
H
${{\% }}$
H ${_2}$
/Air highly swirled flames have been made as well [Reference Novoselov, Ebi and Noiray16, Reference Novoselov, Ebi and Noiray55] with emphasis on the boundary-layer flashback process and the derivation of correlation based on the axial non-reacting velocity of the mixture upstream the flame.
${_2}$
/Air highly swirled flames have been made as well [Reference Novoselov, Ebi and Noiray16, Reference Novoselov, Ebi and Noiray55] with emphasis on the boundary-layer flashback process and the derivation of correlation based on the axial non-reacting velocity of the mixture upstream the flame.
The goals of this article are to describe an experiment enabling stabilisation of 100 ${{\% }}$
H
${{\% }}$
H ${_2}$
/Air highly swirled fully premixed flames along with theoretical development to form a general stabilisation map for these flames. After the introduction of the state of the art, the first section of the paper describes the experiment and the methodology. The second section presents the detailed burner geometry and the operating conditions. The third section documents the experimental measurements. The fourth section discusses the flame stabilisation criterion theory. The last section compares the analytically derived stabilisation map with the experimental data. The conclusion summarises the main outcomes of the paper and provides scaling considerations.
${_2}$
/Air highly swirled fully premixed flames along with theoretical development to form a general stabilisation map for these flames. After the introduction of the state of the art, the first section of the paper describes the experiment and the methodology. The second section presents the detailed burner geometry and the operating conditions. The third section documents the experimental measurements. The fourth section discusses the flame stabilisation criterion theory. The last section compares the analytically derived stabilisation map with the experimental data. The conclusion summarises the main outcomes of the paper and provides scaling considerations.
2.0 Laboratory scale experimental setup description
The laboratory scale experimental setup is depicted in this section. Four key components are described: the fuel storage and dispensing unit, the premixing unit, the burner unit (defined as ‘the experiment’), and the exhaust unit. The experiment is an evolution of the premixed swirled flame experiment documented in Ref. (Reference Palies, Durox, Schuller, Morenton and Candel35).
The fuel storage and dispensing units are now described. High-pressure 350 bar cylinders of hydrogen (industrial-grade hydrogen, size 200 high-pressure steel cylinder, CGA 350), methane and nitrogen gases are stored into a vented cabinet located outside of the laboratory. A pipe connects one of the selected cylinders to the experiment in the lab. A relief valve is located outside the laboratory on that gas line. Nitrogen is used to purge fuel from the gas line after each experimental campaign. Both hard (stainless steel) and flexible gas pipes are employed for the flows of hydrogen, nitrogen, air (onsite compressed air) gases and water used for burner’s cooling. Ball valves, regulators, pressure gauges and check valves are utilised on the air and fuel lines. The fuel and air mass flow rates are measured and controlled through Labview. Omega flow rate controllers’ devices are utilised of respectively 500 SLPM (model FMA-2612A) and 2000 SLPM (model FMA-2622A) maximum volumetric flow rates. The instruments reading error ( $ \pm 0.8{{\% }}$
) and full-scale error (
$ \pm 0.8{{\% }}$
) and full-scale error ( $ \pm 0.2{{\% }}$
) are discussed in Section 4. The corresponding fuel and air lines are connected to the inlet of the premixing unit described next.
$ \pm 0.2{{\% }}$
) are discussed in Section 4. The corresponding fuel and air lines are connected to the inlet of the premixing unit described next.
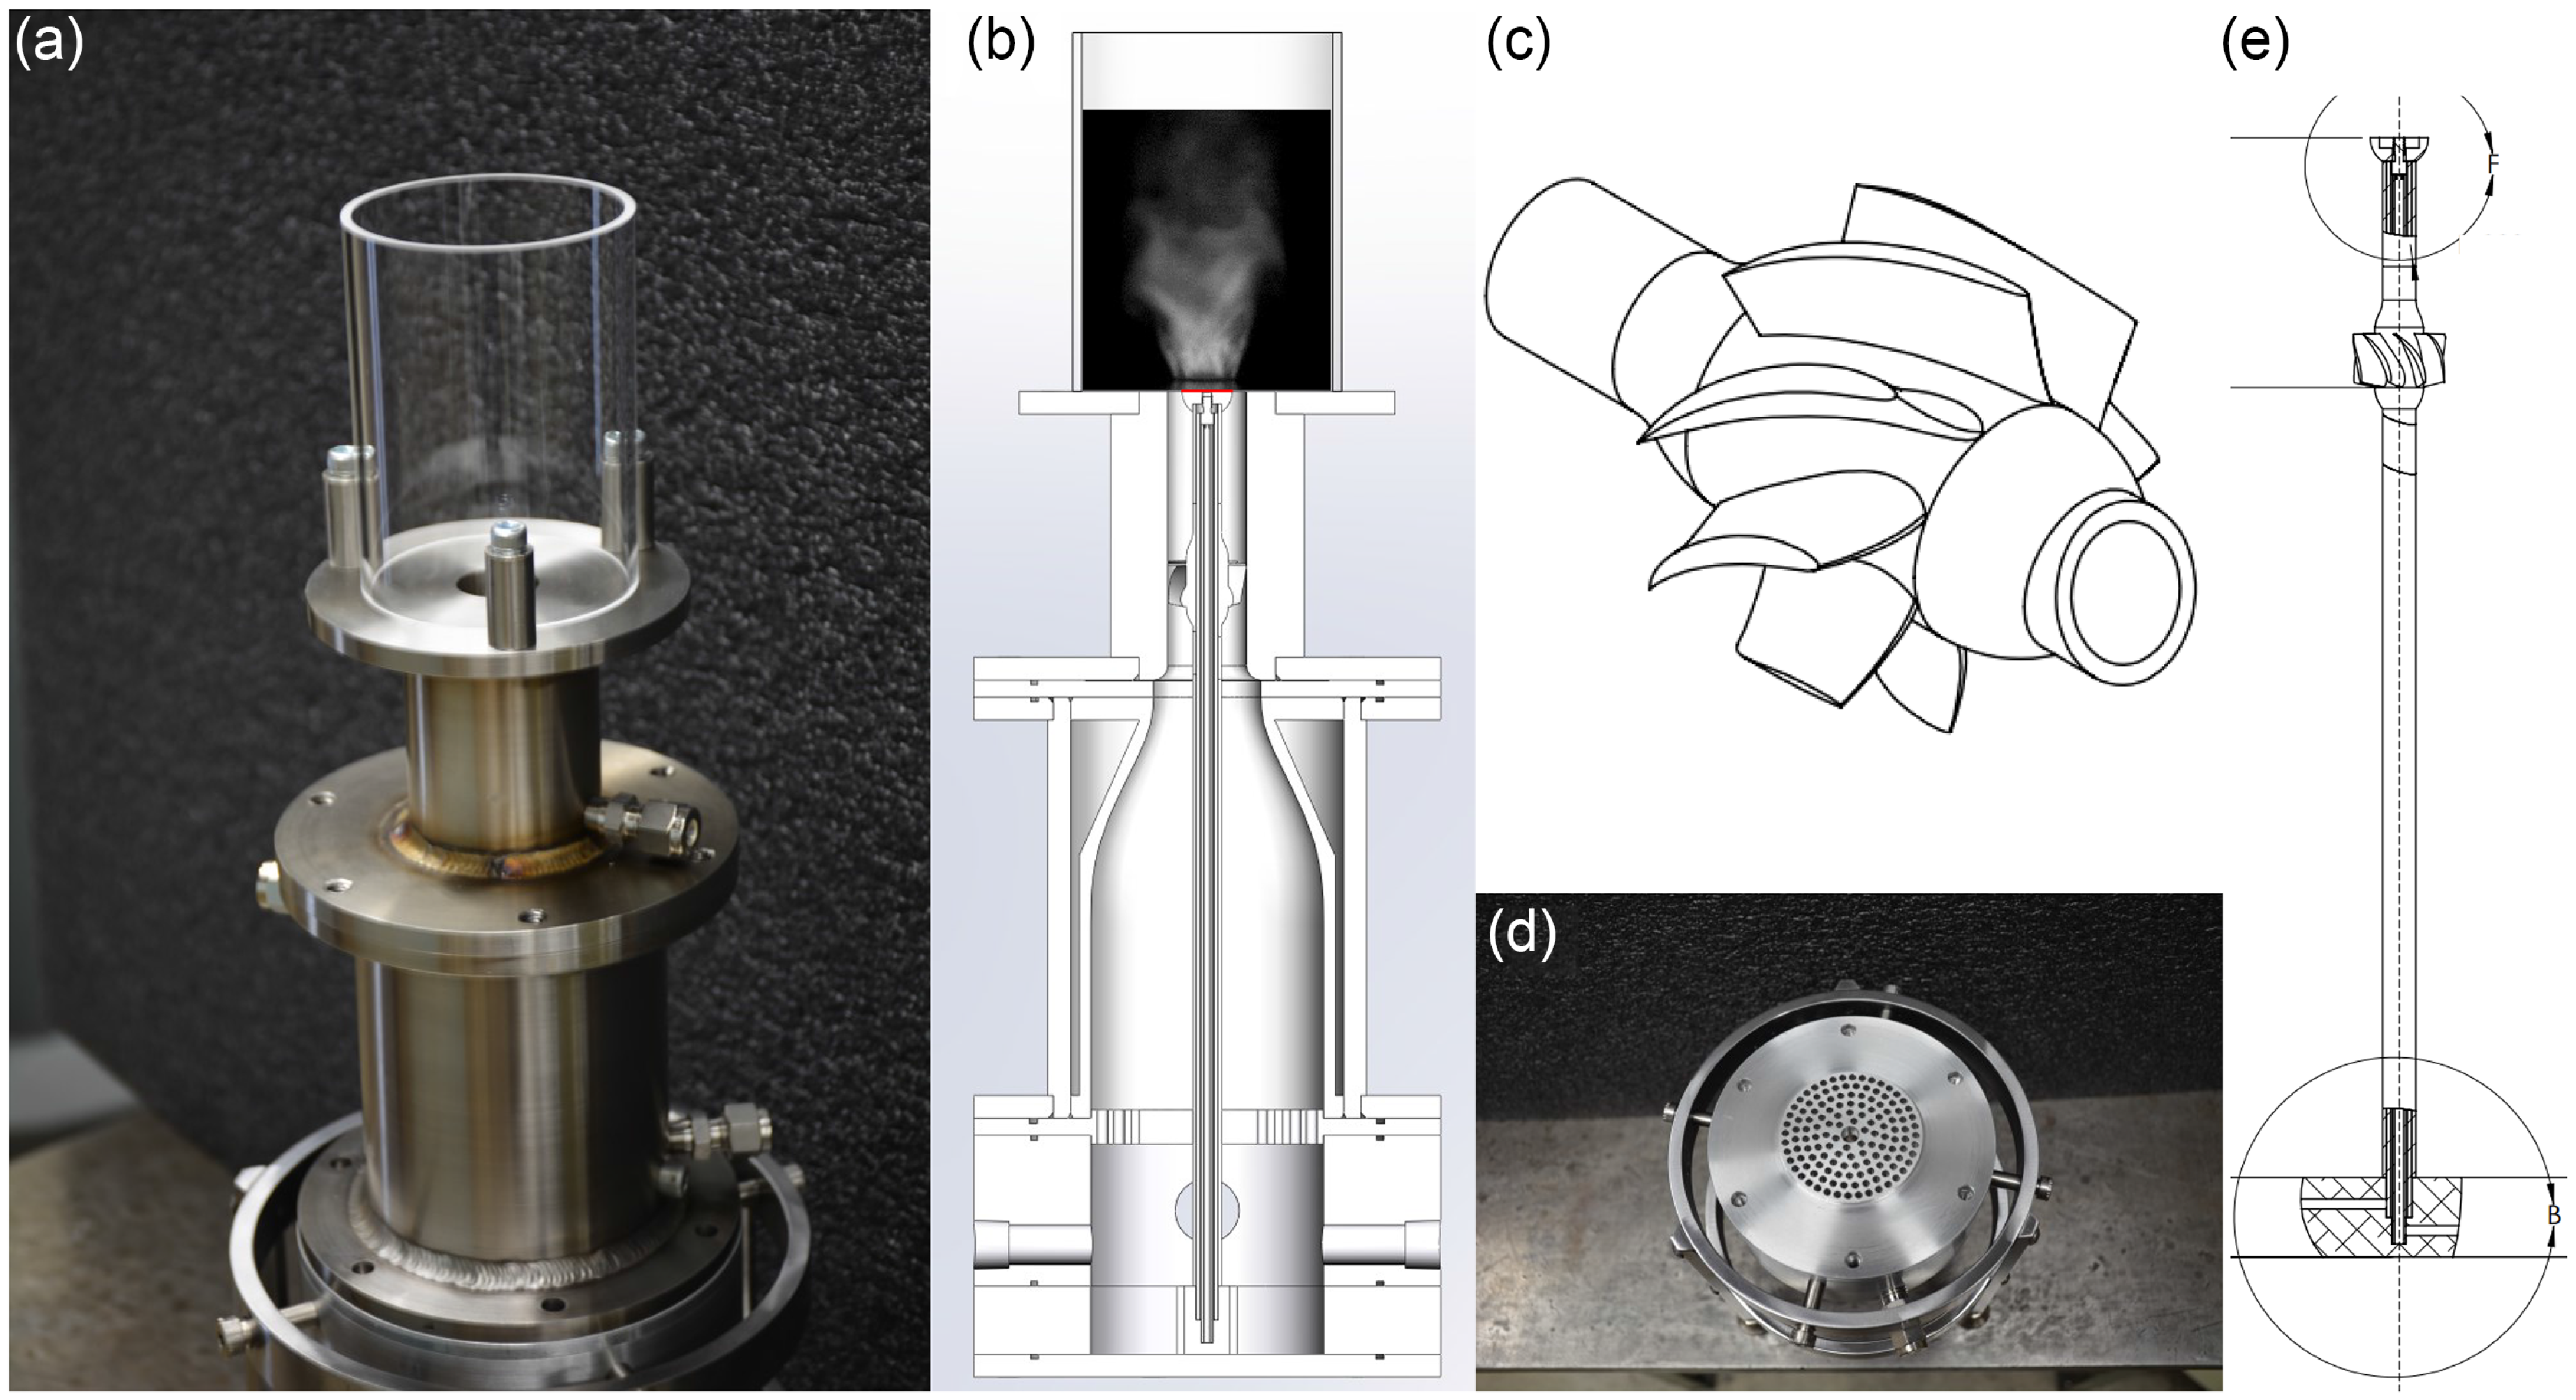
The premixing unit consists of a cylinder part with two inlets: one for the fuel (methane or hydrogen) and one for the air on its upstream side; and two outlets on its downstream side where the resulting premixture exits. Schematic and photos are displayed in Fig. 1. This premixing unit consists of a 40 cm in length and 22 mm diameter metal cylinder with a coaxial central rod. On this rod, coaxially to the outer cylinder, a series of four successive, fixed and evenly distributed co-rotating directions swirlers are mounted to mix the air and the fuel. At the two outlets of the outer cylinder, flexible gas pipes connect the formed premixture to the burner base. For the present study, only one gas pipe is necessary. This pipe is equipped with two commercial inline flame flashback arresters.
Premixing unit. (a) 3D schematic with separate air and fuel inlets on the left and the two premixture outlets on the right. (b) Photography. (c) Cutaway enabling to visualise the four successive swirlers inducing the mixing. (d) Detailed schematic (version with three swirlers shown).

Schematic and photos of the experiment are shown in Fig. 2. The premixed flow passes through a perforated plate positioned at the base of the burner to mitigate large-scale turbulence.
Experimental setup components. (a) Photo of the semi-assembled burner. (b) Schematic with the red line indicating the 13.6 mm bluff-body diameter. (c) Swirler. (d) Perforated plate. (e) Water-cooled rod equipped with an unfilled, unflushed bluff-body.
The mixture is then convected in the converging unit (water-cooled component) where the flow is accelerated. A set of O-rings are used to seal joints between separate parts and prevent leaking of gases. The mixture next passes through a flame arrester made of three layers of stainless steel of five micrometer opening size, which is below the Kolmogorov scale in the present study. This flame arrester sizing was selected based on the model by Hong and Song [Reference Hong and Song56] applied to hydrogen and air mixtures. A conservative choice was made for safety purpose. The premixture is then set into rotation by the swirler. The swirler is made of eight blades based on NACA 8411 twisted profiles. The cylindrical clear fused quartz tube allows optical access (70 mm inner diameter and 100 mm in length), and it is situated on the backplane of the burner. A bluff-body is tied at the top of the central rod where the flames are stabilised. The water flow rate in the cooled converging unit and the central rod is set to one gallon per minute (minimum flow rate) and measured with a clear-in line panel mount flow Omega meter device with an uncertainty of $ \pm 5{{\% }}$
full scale.
$ \pm 5{{\% }}$
full scale.
The experiment can be setup for methane-air or hydrogen-air fully premixed flames with or without swirler for several bluff-body shapes and diameters as well as two central rod diameters. In this article, a single bluff-body model is utilised: the filled baseline shape of 13.6 mm diameter which shape is shown in both Figs. 2(b) and A1(b) in Appendix B. The present bluff-body is flush- with the backplane of the combustor, green coloured in Fig. 3(c). Initial non-reacting numerical simulations of the experiment equipped with identical geometry (swirler and baseline bluff-body) without perforated plate nor flame arrester have shown the formation of a strong inner recirculation zone [Reference Caulfield, Patil, Arguinzoni, Ansari and Palies57].
(a) Swirl number curves. (b) Swirler geometry with angles at the trailing edges shown on both sides of the blade. (c) Swirler blade trailing edges are located 47 mm upstream of the injector backplane (green-coloured surface).
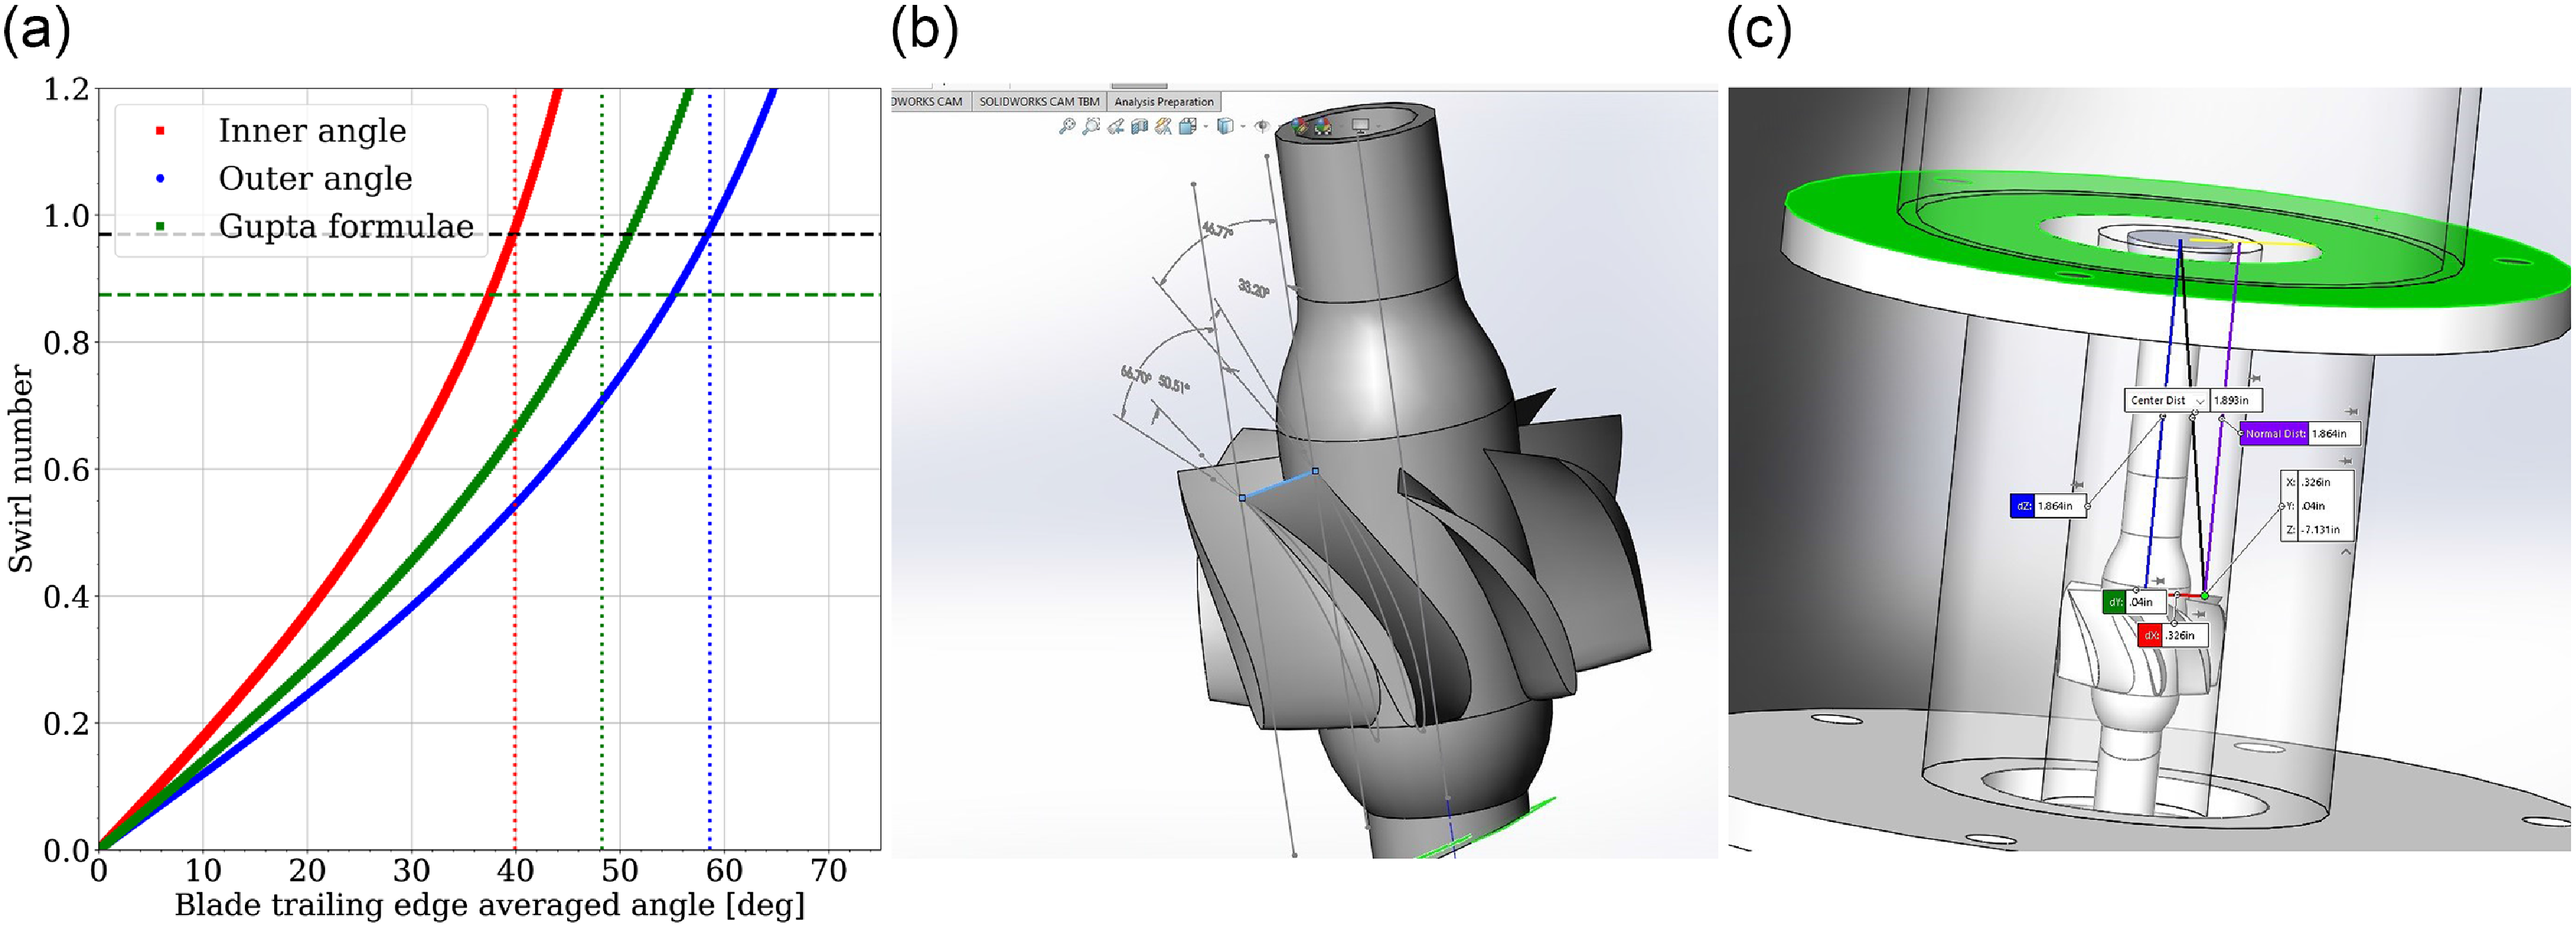
The swirler part drives the flow rotation. It has eight blades periodically spaced around the central rod. The trailing edge pressure side blade angle with respect to the vertical is non-constant. A radial dependent profile for the angle between the inner diameter (hub) and the outer diameter (tip) is used. Taking into account this radial evolution of the angle, chapter 1 of Ref. (Reference Palies58), and the classical Gupta formulae [Reference Gupta4] for swirl number calculations, an averaged geometrical swirl number from both formulae is determined. One obtains ${S_{geo}}$
= 0.92, see Fig. 3(a).
${S_{geo}}$
= 0.92, see Fig. 3(a).
As the mixture evolves downstream along the cylindrical component and reaches the bluff-body, the flow surface area reduces due to the bluff-body diameter larger than the swirler inner diameter. It induces a swirl number reduction as shown in Appendix C of Ref. (Reference Palies58). This change can be estimated as follows:
 \begin{align}{S_{geo,b}} = {S_{geo}}A_b^2/A_{geo}^2\end{align}
and the numerical value is 0.68 at the bluff-body tip.
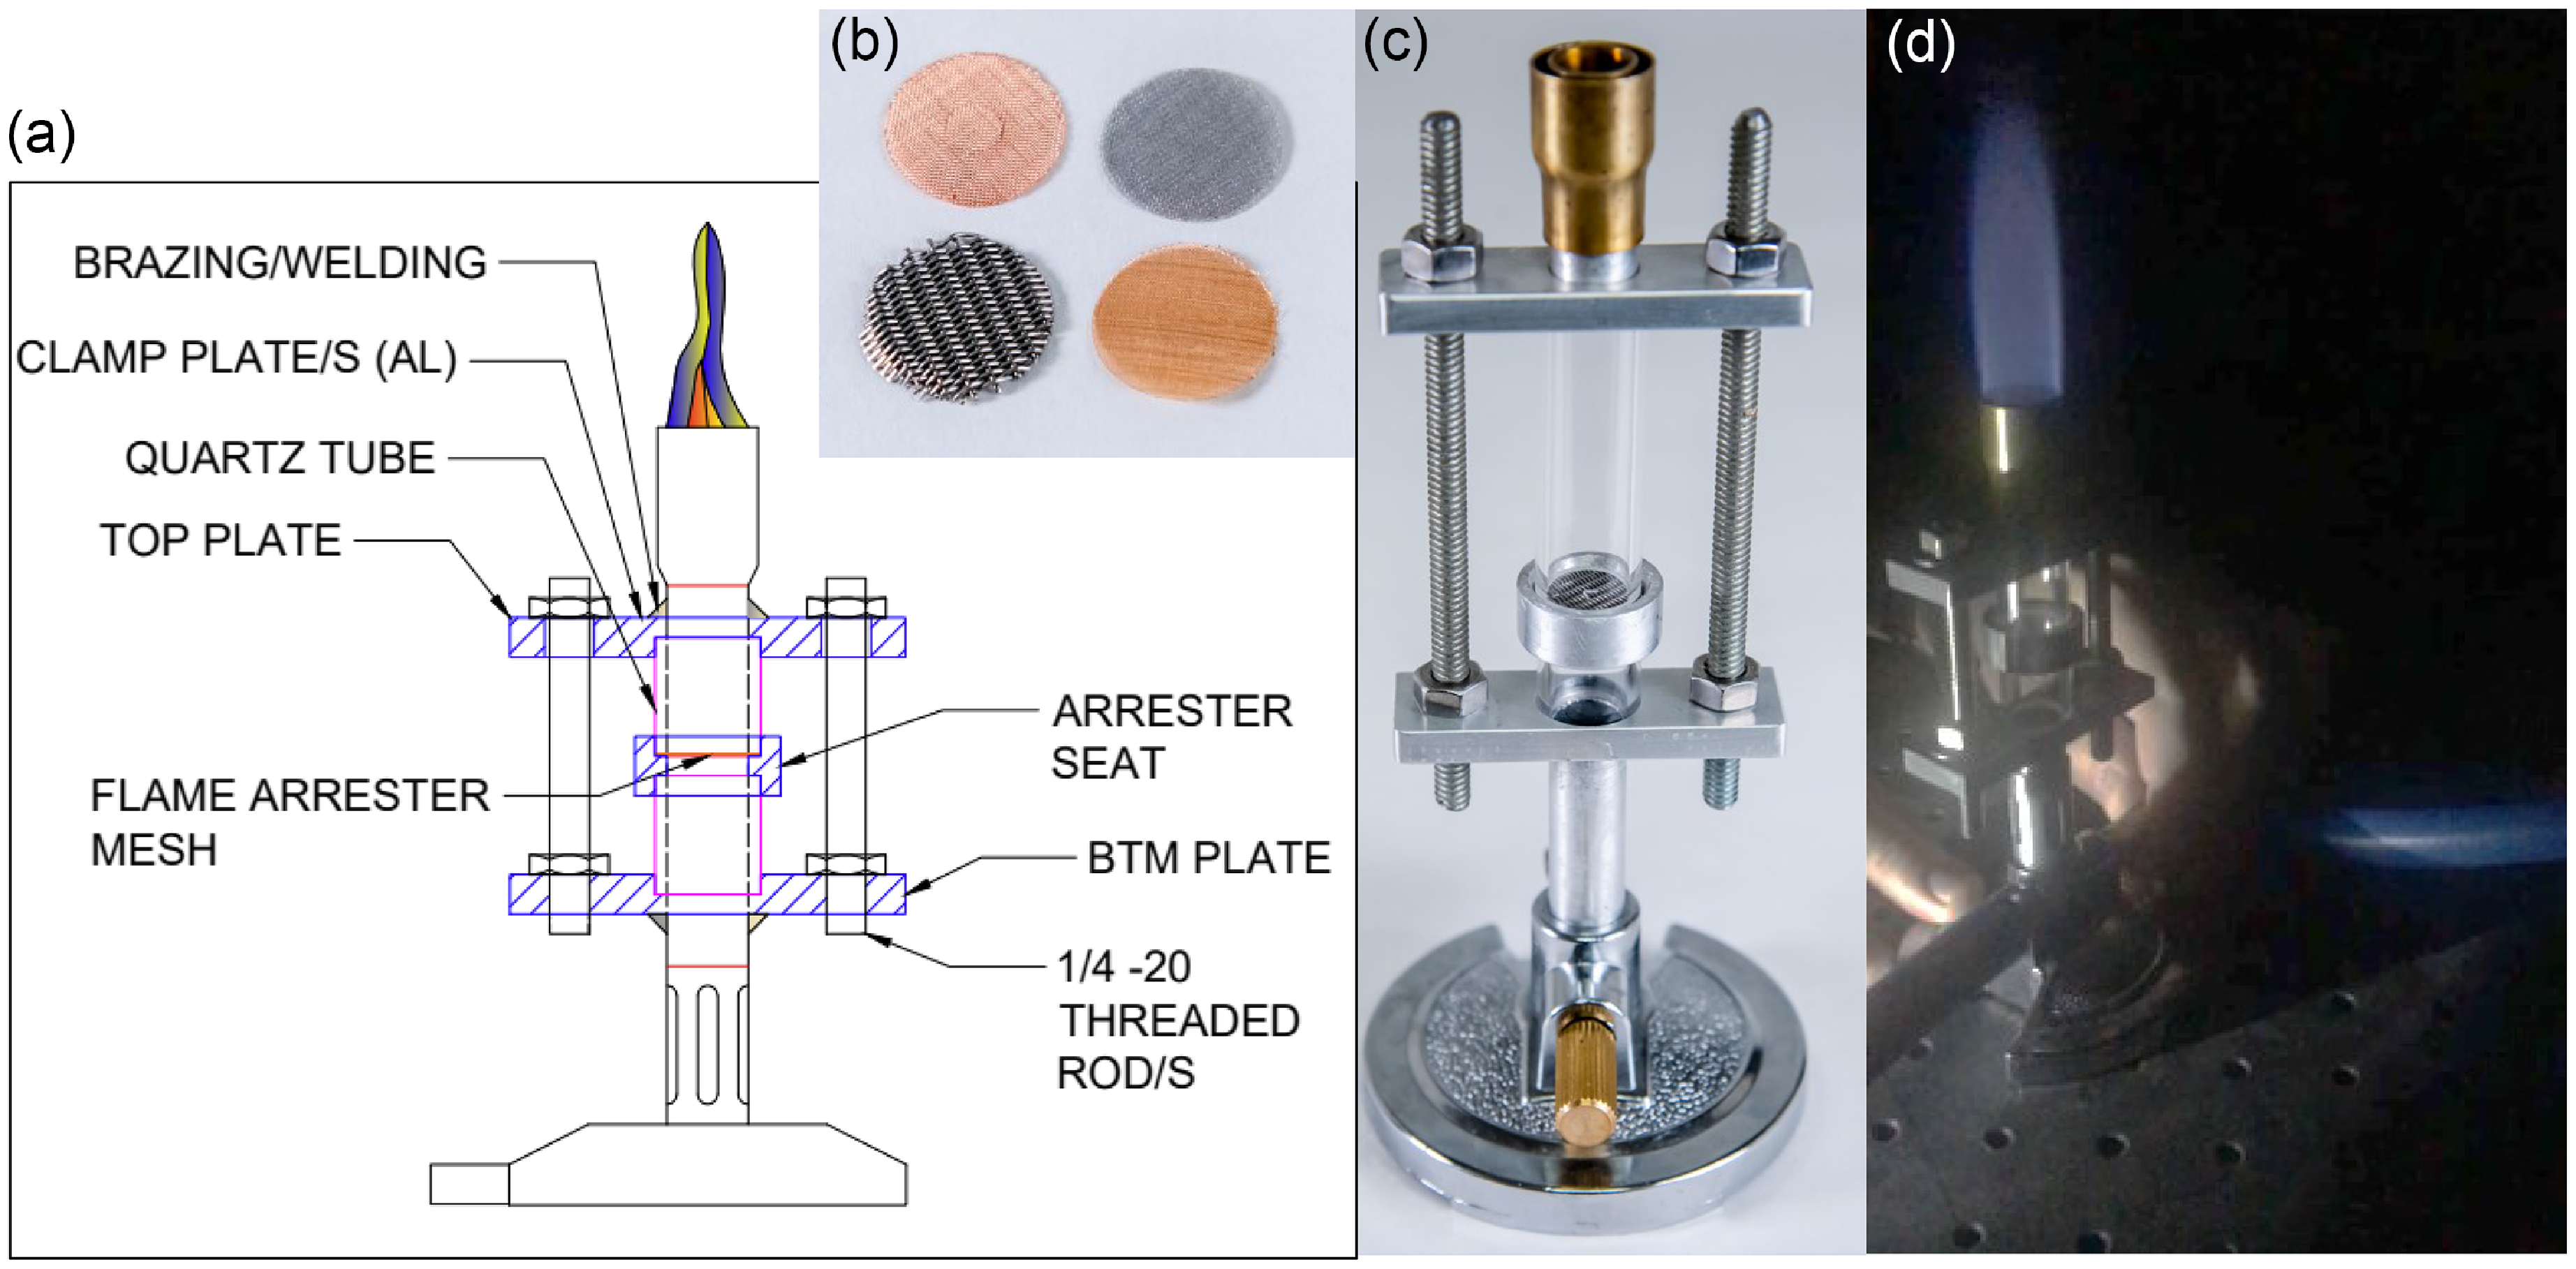
Experiments were first conducted to assess the flame arresters capability to stop flashback on a modified Bunsen burner, see Fig. 4, where the characteristic cylindrical metal component of the burner was made optically accessible. In addition, a ring was added at mid-height of this cylindrical component to hold a flame arrester sample. It allowed to test multiple flame arrester materials and their opening sizes. Those tests led to select a commercially available mesh made of a five-micron twill dutch weave stainless steel screen opening size (T316 micronic stainless UNS S31603 with wire diameters of 0.0508 and of 0.03048 mm). This mesh meets the standard specification ASTM E2814-18. The thickness is 0.1118 mm and the surface density is 0.78 kg m ${^{ - 2}}$
. Both methane/air and hydrogen/air flames flashing back were tested. Flashback was triggered by reducing the mixture bulk flow rate from the stabilised points.
${^{ - 2}}$
. Both methane/air and hydrogen/air flames flashing back were tested. Flashback was triggered by reducing the mixture bulk flow rate from the stabilised points.
Modified Bunsen burner for flame arresters assessment. (a) Schematic. (b) Samples of flame arresters made of different materials and opening sizes. (c) Photo of the modified Bunsen burner prior operation. The ring that holds the flame arrester sample is seen. (d) Photo of the system operating (CH ${_4}$
/Air) prior to flashback.
${_4}$
/Air) prior to flashback.
The experiment and measurement diagnostics are located under an exhaust unit made of a hood connected to an approximately 15 meters, 10-inch diameter pipe ended by an extracting fan (rated at 1275 SCFM) for the extraction of gases of multiple experiments. A level of 450 SCFM at the exhaust duct above the present experiment was measured at maximum fan speed for the present setup. Two sensors (model HIC 822, Indtl. Test Equipment) are used to detect any accumulation of hydrogen fuel. It is calibrated to alarm at 200 ppm of hydrogen content (0.5 ${{\% }}$
of low explosive limit). One sensor is mounted inside the exhaust hood whereas the other one is located outside, near the fuel valve. The experiment is installed on an optics table. Four panels allow to operate the experiment in an enclosure between the optics table and the exhaust hood. The shadowgraphs were obtained with two panels opened whereas chemiluminescence data were obtained with all panels closed. The exhaust gas hood was specifically designed to cover all major components located underneath and to direct all burnt gases outside. The approximate dimensions of the hood are 4 ft. in length, 2 ft. in width and 1 ft. in height. The exhaust fan has a maximum continuous temperature of 450 K which is expected to be higher than the temperature reached by the burnt gas mixed with ambient air at that location.
${{\% }}$
of low explosive limit). One sensor is mounted inside the exhaust hood whereas the other one is located outside, near the fuel valve. The experiment is installed on an optics table. Four panels allow to operate the experiment in an enclosure between the optics table and the exhaust hood. The shadowgraphs were obtained with two panels opened whereas chemiluminescence data were obtained with all panels closed. The exhaust gas hood was specifically designed to cover all major components located underneath and to direct all burnt gases outside. The approximate dimensions of the hood are 4 ft. in length, 2 ft. in width and 1 ft. in height. The exhaust fan has a maximum continuous temperature of 450 K which is expected to be higher than the temperature reached by the burnt gas mixed with ambient air at that location.
The ignition and subsequent stabilisation of highly swirled flames presented in this article have been made through an increasing level of complexity and verification steps. Firstly, conical diffusion flames were ignited and stabilised on the Bunsen burner. Next, this burner was modified to be directly connected to the premixing unit described above. This allowed to control precisely the equivalence ratio and to operate the modified Bunsen burner in fully premixed mode. Ignitions were then triggered on ultra-lean equivalence ratio mixtures (equivalence ratio $\phi $
= 0.3) at low bulk velocity (near or below 2 m s
$\phi $
= 0.3) at low bulk velocity (near or below 2 m s ${^{ - 1}}$
) successfully. A parametric study for equivalence ratio and bulk velocities demonstrated smooth ignition for low values of both parameters. Secondly, the swirl experiment documented in this article was utilised without the swirler to demonstrate both smooth ignition of ‘V’ flames and stabilisation. In both the Bunsen and swirl burners, methane fuel was used to test the setup prior to use hydrogen. During those series of tests of increasing level of complexity, a robust approach for ignition, flame arrester assessment and operation were made. The ignition was triggered with a commercial lighter (brand name VEHHE) based on plasma flameless arc technology.
${^{ - 1}}$
) successfully. A parametric study for equivalence ratio and bulk velocities demonstrated smooth ignition for low values of both parameters. Secondly, the swirl experiment documented in this article was utilised without the swirler to demonstrate both smooth ignition of ‘V’ flames and stabilisation. In both the Bunsen and swirl burners, methane fuel was used to test the setup prior to use hydrogen. During those series of tests of increasing level of complexity, a robust approach for ignition, flame arrester assessment and operation were made. The ignition was triggered with a commercial lighter (brand name VEHHE) based on plasma flameless arc technology.
3.0 Geometry and operating conditions
The geometry of the experiment described in the above section is depicted in Fig. 5(a,b). All major elements of the burner are sketched. The operating conditions are given in the unstretched laminar flame speed $S_L^0$
map of Fig. 5(c) where the H
$S_L^0$
map of Fig. 5(c) where the H ${_2}$
/Air mixture equivalence ratio
${_2}$
/Air mixture equivalence ratio $\phi $
ranges from 0.3 to 1 along the
$\phi $
ranges from 0.3 to 1 along the $x$
-axis and the bulk mixture axial velocity at the bluff-body
$x$
-axis and the bulk mixture axial velocity at the bluff-body ${U_b}$
ranges from 0 to 14 m s
${U_b}$
ranges from 0 to 14 m s ${^{ - 1}}$
along
${^{ - 1}}$
along $y$
-axis. The bulk flow velocity remained below 7.5 m s
$y$
-axis. The bulk flow velocity remained below 7.5 m s ${^{ - 1}}$
to limit the thermal power of the undertaken set of experiments. Experiments were conducted for thermal power ranging from 0.46 kW (equivalence ratio 0.3 and bulk mixture velocity of 1.7 m s
${^{ - 1}}$
to limit the thermal power of the undertaken set of experiments. Experiments were conducted for thermal power ranging from 0.46 kW (equivalence ratio 0.3 and bulk mixture velocity of 1.7 m s ${^{ - 1}}$
) to 3.1 kW (equivalence ratio of 0.5 and bulk mixture velocity of 7.41 m s
${^{ - 1}}$
) to 3.1 kW (equivalence ratio of 0.5 and bulk mixture velocity of 7.41 m s ${^{ - 1}}$
). The thermal power is defined as
${^{ - 1}}$
). The thermal power is defined as ${P_{th}} = {\dot m_f}{{\Delta }}h$
where
${P_{th}} = {\dot m_f}{{\Delta }}h$
where ${\dot m_f}$
is the fuel flow rate and
${\dot m_f}$
is the fuel flow rate and ${{\Delta }}h$
is the energy released by combustion of hydrogen fuel and is equal to 120 MJ kg
${{\Delta }}h$
is the energy released by combustion of hydrogen fuel and is equal to 120 MJ kg ${^{ - 1}}$
(lower heating value). Higher thermal powers were not tested to avoid overheating of the burner as well as allow safe operations within the current laboratory settings.
${^{ - 1}}$
(lower heating value). Higher thermal powers were not tested to avoid overheating of the burner as well as allow safe operations within the current laboratory settings.
Geometry and operating conditions map of the experiment. Cutaway (a) and isometric view (b) of burner unit. The swirler, the bluff-body, the water-cooled converging unit and the central rod are shown. Operating conditions map (c) of the experiment with Kolmogorov scales, Lewis and Karlovitz numbers isolines superimposed on the unstretched laminar flame displacement speed S $_L^0$
(m s
$_L^0$
(m s ${^{ - 1}}$
) contour. Symbols represent experimentally assessed points on the operating conditions map: whites squares are ignition points, green dots are stabilised flames, red dots are flashback data points, cyan dots are additional stabilised data points and blue triangles are stabilised points that include high-speed transient sequences.
${^{ - 1}}$
) contour. Symbols represent experimentally assessed points on the operating conditions map: whites squares are ignition points, green dots are stabilised flames, red dots are flashback data points, cyan dots are additional stabilised data points and blue triangles are stabilised points that include high-speed transient sequences.
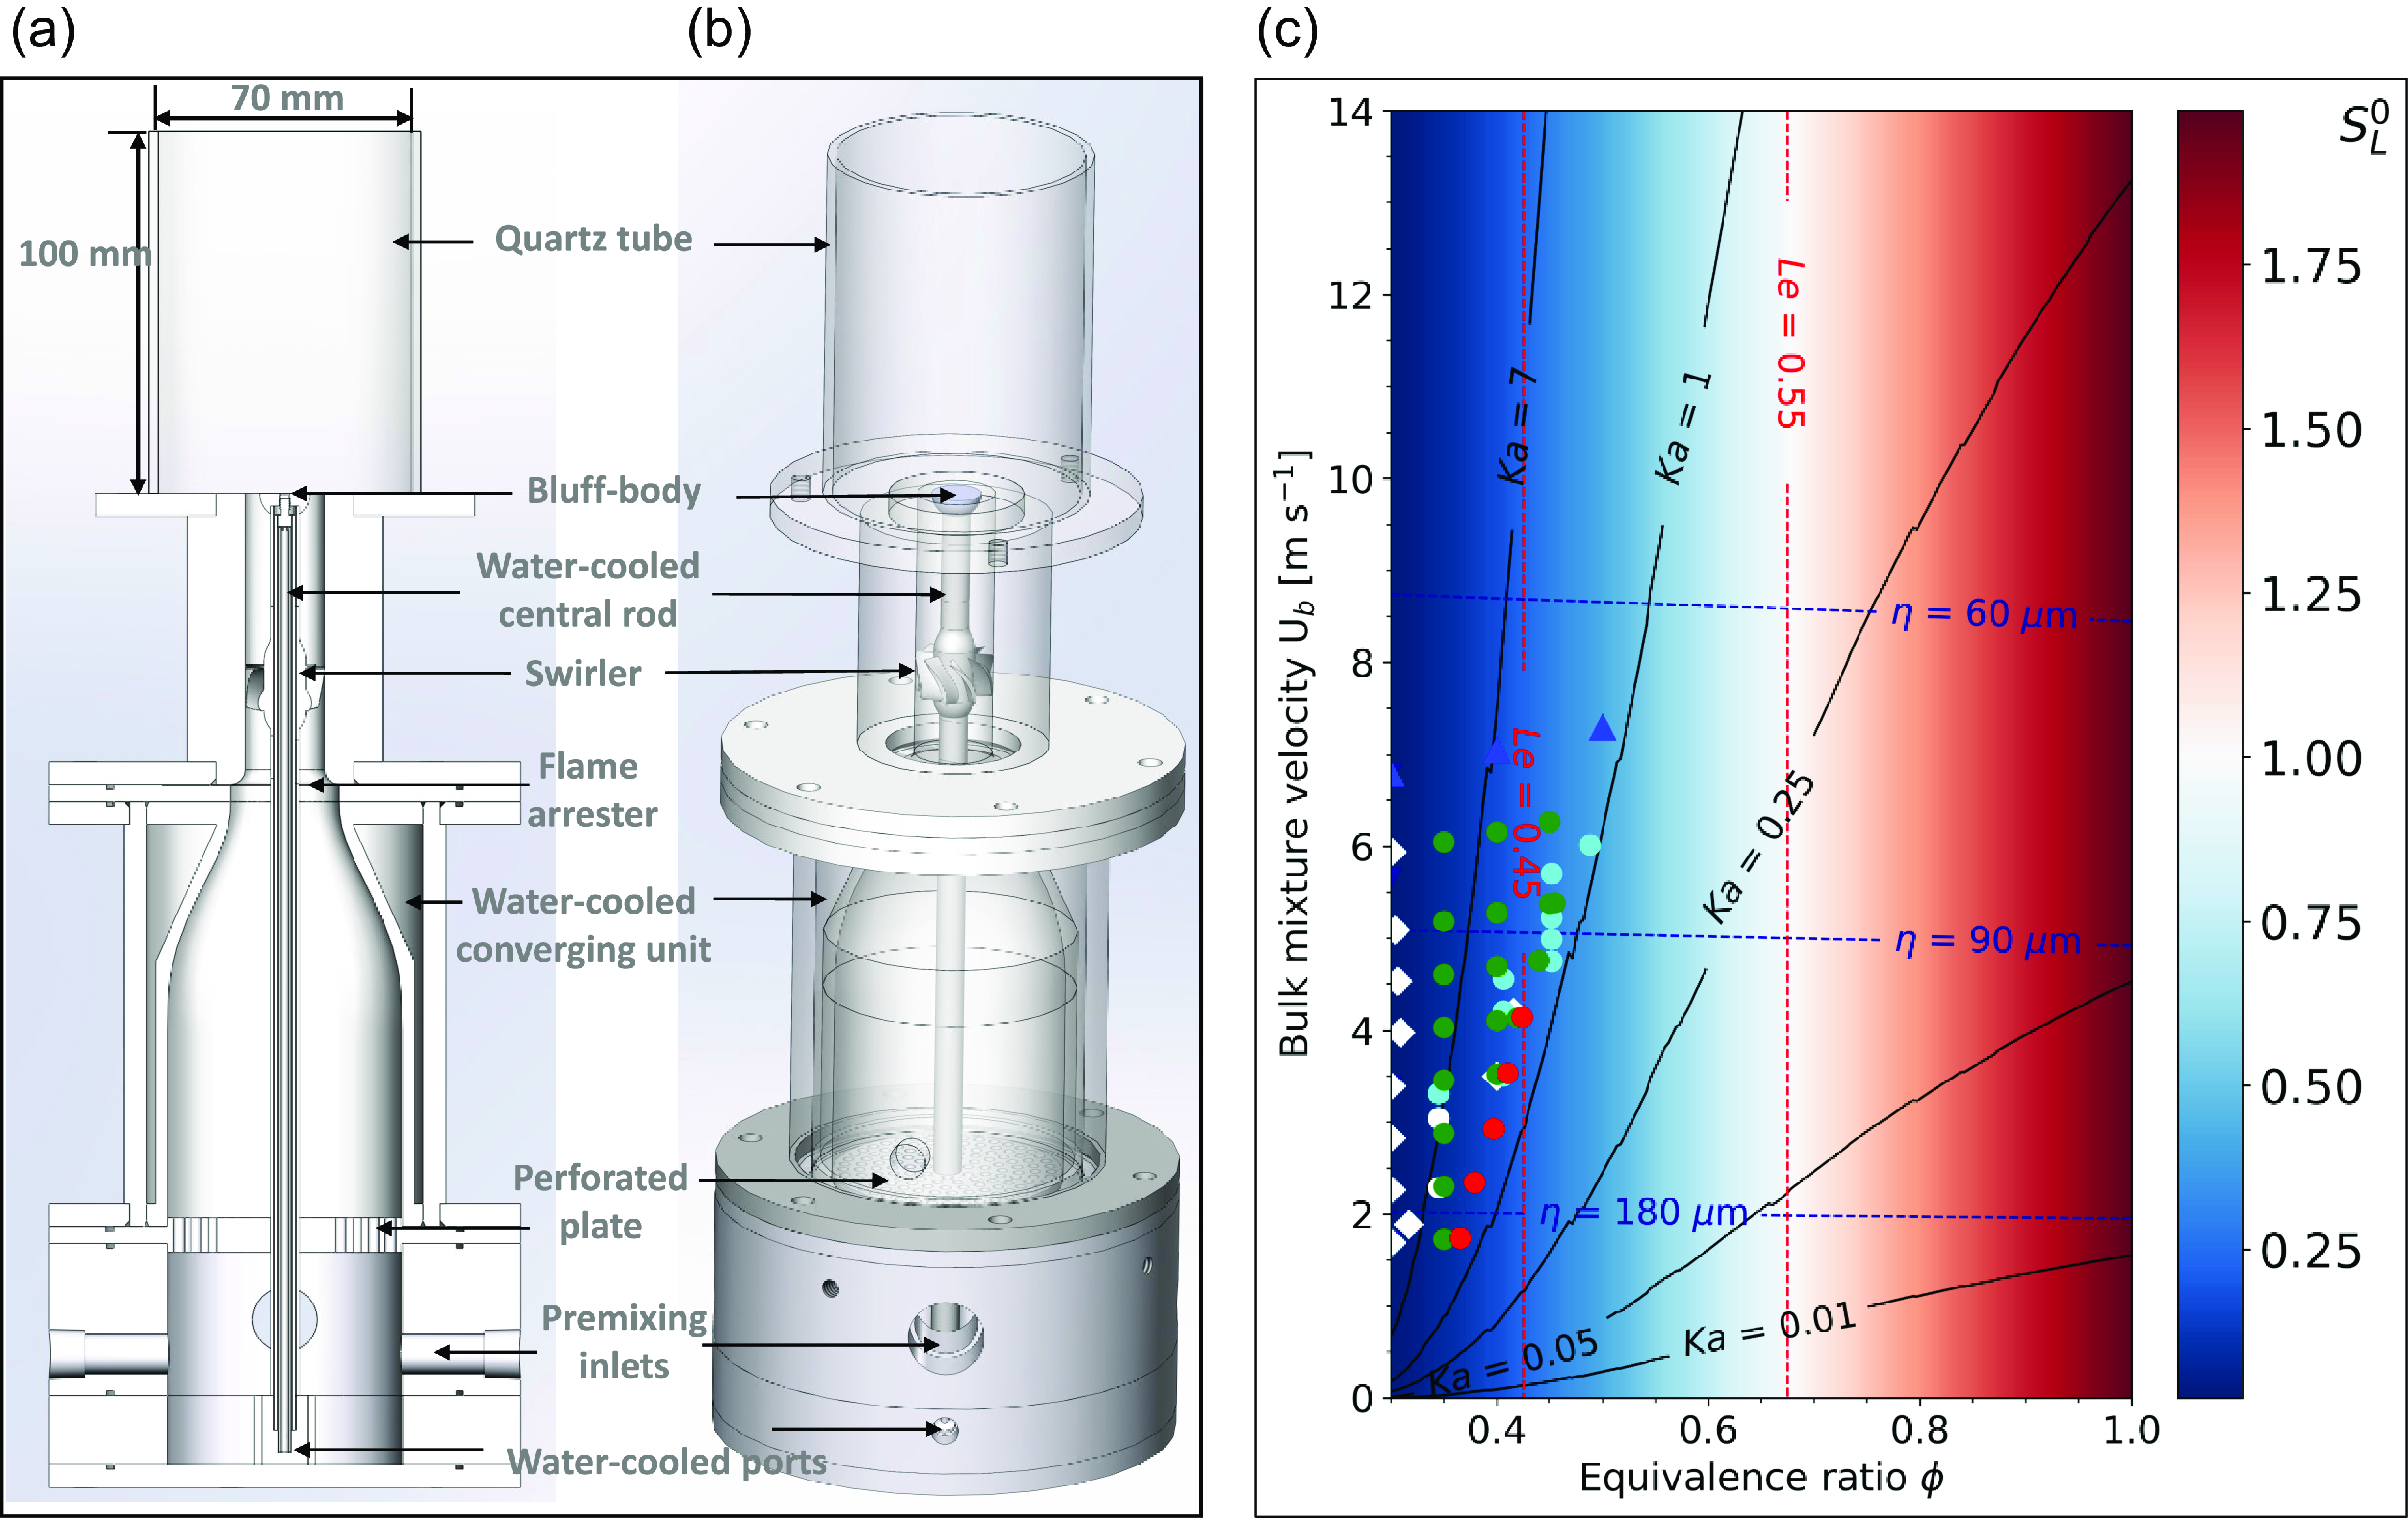
Each coloured symbols on the map of Fig. 5(c) represents a measurement point. Superimposed to the map are: Karlovitz number isovalue lines for levels of 0.01, 0.25, 1 and 7; Lewis number isovalue lines for levels 0.45 and 0.55; as well as Kolmogorov scales values of 60, 90 and 180 micrometers. The values for all isolines superimposed on the flame operating conditions map were selected to include representative’s levels across their entire respective ranges (evenly distributed spatially). The white symbols correspond to ignition points, green dots correspond to stabilised flames, red dots to flashback points, cyan dots to additional stabilised points and blue triangles-up to stabilised points that include high-speed transient sequences. The symbols and their colour indicate different experimental campaign. Fig. 5(a–c) comprehensively characterises the geometry of the experiment and the operating conditions of this study. This setup, the measurement techniques, the operating conditions and the experimental procedure are described in the next sections.
The operating condition map parameters depicted in Fig. 5(c) are defined now. The Kolmogorov scale is defined with:
 \begin{align}\eta = {l_t}{\bigg(\frac{{{\rho _m}u^{\prime}{l_t}}}{\mu }\bigg)^{ - 3/4}}\end{align}
The turbulence integral length scale is taken as ${l_t}$
= 0.9
${l_t}$
= 0.9 $d$
where
$d$
where $d$
is the injector outer diameter (22 mm) in the present study. The turbulent velocity fluctuation is
$d$
is the injector outer diameter (22 mm) in the present study. The turbulent velocity fluctuation is $u^{\prime}$
= 0.2 U
$u^{\prime}$
= 0.2 U ${_b}$
. The factor 0.2 is an estimate deduced from a scaling reported and used in previous works [Reference Xiao and Palies29, Reference Palies and Acharya49, Reference Palies, Schuller, Durox, Gicquel and Candel59]. The mixture density
${_b}$
. The factor 0.2 is an estimate deduced from a scaling reported and used in previous works [Reference Xiao and Palies29, Reference Palies and Acharya49, Reference Palies, Schuller, Durox, Gicquel and Candel59]. The mixture density ${\rho _m}$
and its dynamic viscosity
${\rho _m}$
and its dynamic viscosity $\mu $
are obtained from the open-source software cantera [Reference Goodwin, Speth, Moffat and Weber60]. The Karlovitz number defined as Ka =
$\mu $
are obtained from the open-source software cantera [Reference Goodwin, Speth, Moffat and Weber60]. The Karlovitz number defined as Ka = ${(\delta /\eta )^2}$
is used to generate the isolines values in Fig. 5(c) where
${(\delta /\eta )^2}$
is used to generate the isolines values in Fig. 5(c) where $\delta $
is the thermal diffusive flame thickness. The Lewis number is computed as Le = D
$\delta $
is the thermal diffusive flame thickness. The Lewis number is computed as Le = D ${_T}$
/D
${_T}$
/D ${_{{H_2}}}$
. The thermal diffusion coefficients D
${_{{H_2}}}$
. The thermal diffusion coefficients D ${_T}$
, the mixture-averaged diffusion coefficient for hydrogen D
${_T}$
, the mixture-averaged diffusion coefficient for hydrogen D ${_{{H_2}}}$
, the unstretched laminar flame speeds S
${_{{H_2}}}$
, the unstretched laminar flame speeds S $_L^0$
, the species binary diffusion coefficients used to compute D
$_L^0$
, the species binary diffusion coefficients used to compute D ${_{{H_2}}}$
, and the composition data are obtained from cantera one-dimensional flame simulations. Those calculations are based on the state of the art [Reference Palies61, Reference Xiao and Palies29, Reference Palies and Acharya49].
${_{{H_2}}}$
, and the composition data are obtained from cantera one-dimensional flame simulations. Those calculations are based on the state of the art [Reference Palies61, Reference Xiao and Palies29, Reference Palies and Acharya49].
4.0 Measurement techniques and experimental results
In this section, the experimental measurement techniques and the results obtained are described. The measurement techniques used for the visualisation of the flame for all operating conditions and the geometry include: (i) chemiluminescence imaging, and (ii) shadowgraph imaging. The chemiluminescence flame imaging technique is used to capture the flame front position (time-averaged and transient evolution). The flame position data inform subsequently on the flame stabilisation. The shadowgraph imaging technique is used to capture the flame location as well. It especially informs on the presence of inner or inner/outer branches. Images of spatial distribution of flame light emissions for the H ${_2}$
/Air premixed flames are obtained using a high-speed camera that captures ultraviolet (UV), visible light and near IR wavelengths, a key enabler for hydrogen-air flames. A high-speed Phantom T2410UV-VIS monochrome camera capturing wavelengths ranging from 200 nm to 1100 nm is utilised. The camera is equipped with a CMOS back side illuminated sensor with fused silica and a global shutter. Based on the manufacturer camera’s spectral response, at 308 nm (which corresponds to OH
${_2}$
/Air premixed flames are obtained using a high-speed camera that captures ultraviolet (UV), visible light and near IR wavelengths, a key enabler for hydrogen-air flames. A high-speed Phantom T2410UV-VIS monochrome camera capturing wavelengths ranging from 200 nm to 1100 nm is utilised. The camera is equipped with a CMOS back side illuminated sensor with fused silica and a global shutter. Based on the manufacturer camera’s spectral response, at 308 nm (which corresponds to OH ${^{{*}}}$
flame emission), the quantum efficiency of the camera is superior to 70
${^{{*}}}$
flame emission), the quantum efficiency of the camera is superior to 70 ${{\% }}$
. The maximum resolution is 1280 by 800 pixels at 24,270 frames per second (fps) with a minimum exposure time of one microsecond. The maximum frame rate is 558,330 fps on a reduced window size of 1280 by 32 pixels.
${{\% }}$
. The maximum resolution is 1280 by 800 pixels at 24,270 frames per second (fps) with a minimum exposure time of one microsecond. The maximum frame rate is 558,330 fps on a reduced window size of 1280 by 32 pixels.
Two F-mounted lenses are utilised with the camera: a Nikon 50 mm F/1.8 E for chemiluminescence imaging and a Tokina AT-X SD 300 mm F/2.8 MF for shadowgraph. A Fotodiox macro extension tube set (Nikon F-mounts for both camera body and lens sides) is employed to increase the spatial resolution (defined as the number of pixels per millimeters of field of view) for chemiluminescence imaging. The tube employed consists of the mount body and mount lens part only that corresponds to a 15 mm extension tube. All flame electromagnetic waves radiations emitted (UV or not) are directly collected on the high-speed camera CMOS sensor.
The shadowgraph optical arrangement is now described. A 150W Halogen bulb light source is connected to an optic fiber. This fiber is placed upstream of a condenser lens (Edmund optics 50 mm diameter and 44 mm focal length) converging the non-monochromatic light onto a slit acting as the point source of the optical system. This light source is then transmitted to the first parabolic mirror (25 cm in diameter), crosses the flame, and reflects on the second mirror. The light is then collected on the Tokina 300 mm focal lens optic to capture the transient flame data that are recorded as .cine files in the PCC software and post-processed with the SDK13.8.804 suite of tools.
It is worth pointing out that the time-averaged fields obtained are slightly dissymmetric because of (i) location of the swirler blades with respect to the field of view of the camera, (ii) slight deviation of concentricity between central rod and burner injector and (iii) non-spatial averaging of data. Variance fields are computed as the average of the squared differences between each time instant value with the mean value.
Inverse Abel transforms were applied to the chemiluminescence images. This mathematical transformation takes a line-of-sight integrated time-averaged chemiluminescence image and reconstructs it as a slice through the three-dimensional distribution. This corresponds to (d ${_2}$
, e
${_2}$
, e ${_2}$
, f
${_2}$
, f ${_2}$
) panels in Fig. 8. The algorithm implementation by Hickstein et al. is used [Reference Hickstein, Gibson, Yurchak, Das and Ryazanov62] in the present study.
${_2}$
) panels in Fig. 8. The algorithm implementation by Hickstein et al. is used [Reference Hickstein, Gibson, Yurchak, Das and Ryazanov62] in the present study.
The spatial and temporal resolutions for both measurement techniques are now discussed. For the chemiluminescence imaging, the high-speed camera was operated at 1000 fps. The exposure time was set to 990 microseconds to maximise photons collection. The characteristic time associated with the flame front propagation at an equivalence ratio of 0.4 is below one millisecond. In the present case, the exposure time is nearly equal to the flame burning propagation time. This characteristic time was determined as the ratio of the flame thickness to the flame displacement speed ( $\tau = \delta /S_L^0$
). For an equivalence ratio of 0.4, the thermal diffusive flame thickness is 0.174 mm and the laminar unstretched flame speed is 0.176 m s
$\tau = \delta /S_L^0$
). For an equivalence ratio of 0.4, the thermal diffusive flame thickness is 0.174 mm and the laminar unstretched flame speed is 0.176 m s ${^{ - 1}}$
(making use of Conaire et al. [Reference Conaire, Curran, Simmie, Pitz and Westbrook63]). This yields a characteristic time of 0.98 ms. In other words, during the acquisition, the flame propagation due to burning is essentially occurring over a distance equals to the flame thickness. When considering the flame surface velocity vector
${^{ - 1}}$
(making use of Conaire et al. [Reference Conaire, Curran, Simmie, Pitz and Westbrook63]). This yields a characteristic time of 0.98 ms. In other words, during the acquisition, the flame propagation due to burning is essentially occurring over a distance equals to the flame thickness. When considering the flame surface velocity vector ${{\mathbf{w}}_s}$
, additional blurring effects are at stake as the flame front propagates over larger zones due to convective transport of the flame surface. This selected setting allows to record sufficient signal for each frame in this lean regime that is known as a low light regime, especially for hydrogen flames. It does not avoid blurring effect of the flame front. Shorter exposure times and higher fuel flow rates will be required for instantaneous descriptions based on chemiluminescence data. The field of view is a rectangle window of 75.3 mm (1280 pix) by 47 mm (800 pix) and the corresponding spatial resolution is 17 pixels per mm. As the thermal diffusive flame thickness is 174 micrometers at an equivalence ratio of 0.4, this corresponds to three pixels per flame thickness. Graph sheets are used to set the field of view and determine the spatial resolution. Prior each experimental video acquisition, a photo was taken for background subtraction on the subsequent transient sequence. For the shadowgraph transient sequences, the camera acquisition rate is set to 35 000 fps and the exposure time to one microsecond. The field of view is 71.2 mm (768 pix) by 47.4 mm (512 pix) corresponding to 10.7 pixels per millimeters. An object of known size is used to determine the spatial resolution.
${{\mathbf{w}}_s}$
, additional blurring effects are at stake as the flame front propagates over larger zones due to convective transport of the flame surface. This selected setting allows to record sufficient signal for each frame in this lean regime that is known as a low light regime, especially for hydrogen flames. It does not avoid blurring effect of the flame front. Shorter exposure times and higher fuel flow rates will be required for instantaneous descriptions based on chemiluminescence data. The field of view is a rectangle window of 75.3 mm (1280 pix) by 47 mm (800 pix) and the corresponding spatial resolution is 17 pixels per mm. As the thermal diffusive flame thickness is 174 micrometers at an equivalence ratio of 0.4, this corresponds to three pixels per flame thickness. Graph sheets are used to set the field of view and determine the spatial resolution. Prior each experimental video acquisition, a photo was taken for background subtraction on the subsequent transient sequence. For the shadowgraph transient sequences, the camera acquisition rate is set to 35 000 fps and the exposure time to one microsecond. The field of view is 71.2 mm (768 pix) by 47.4 mm (512 pix) corresponding to 10.7 pixels per millimeters. An object of known size is used to determine the spatial resolution.
The optimal frame rate and exposure time result from the balance between capturing sufficient light to determine the flame position for a given flow condition and avoiding blurring effect. As the equivalence ratio is reduced, the intensity from chemiluminescence naturally reduces. In addition, at a given equivalence ratio, the reduction or increase of mixture velocity respectively reduces or increases the intensity because the fuel flow rate changes. This effect is shown with the time-averaged fields shown in Fig. 6 with corresponding integrated light signals in Fig. 7. For the present research, the methodology consisted of selecting the shortest exposure time possible at the highest frame rate per second (fps). Above 1000 fps, the exposure time was too short and thus the flame was not well seen. Below 1000 fps, the blurring effects were too strong, and the flame appears fully laminar or the camera sensor saturated because of too strong flame emission’s signal. Higher frames rates can be obtained if brightness, gamma, and tone settings are changed or the signals intensities post-processed. In this article, no modifications, either in the camera software or a posteriori, are made to the signals measured.
Time-averaged flame images at constant equivalence ratio 0.3 for several increasing mixture velocities from 1.7 m s ${^{ - 1}}$
(a) to 6.79 m s
${^{ - 1}}$
(a) to 6.79 m s ${^{ - 1}}$
(f).
${^{ - 1}}$
(f).
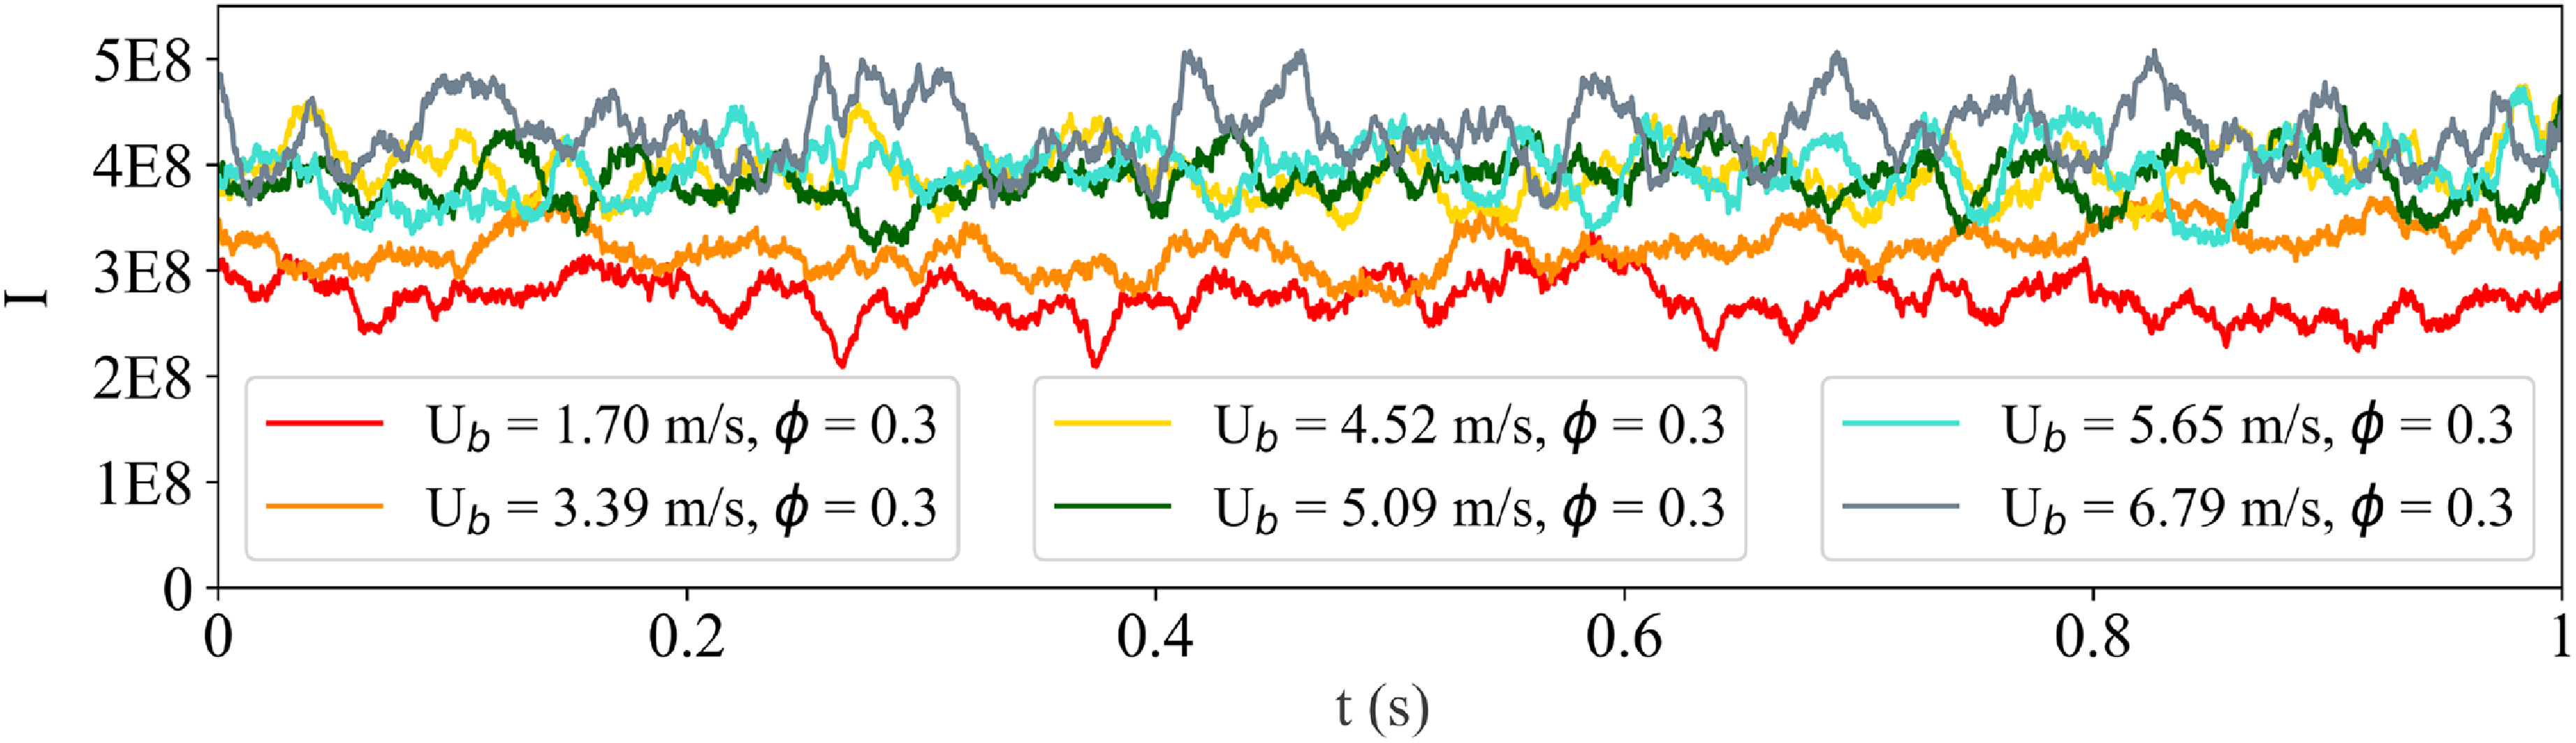
Timeseries of integrated chemiluminescence signals at constant 0.3 equivalence ratio for several increasing mixture velocities from 1.7 m s ${^{ - 1}}$
(a) to 6.79 m s
${^{ - 1}}$
(a) to 6.79 m s ${^{ - 1}}$
(f).
${^{ - 1}}$
(f).
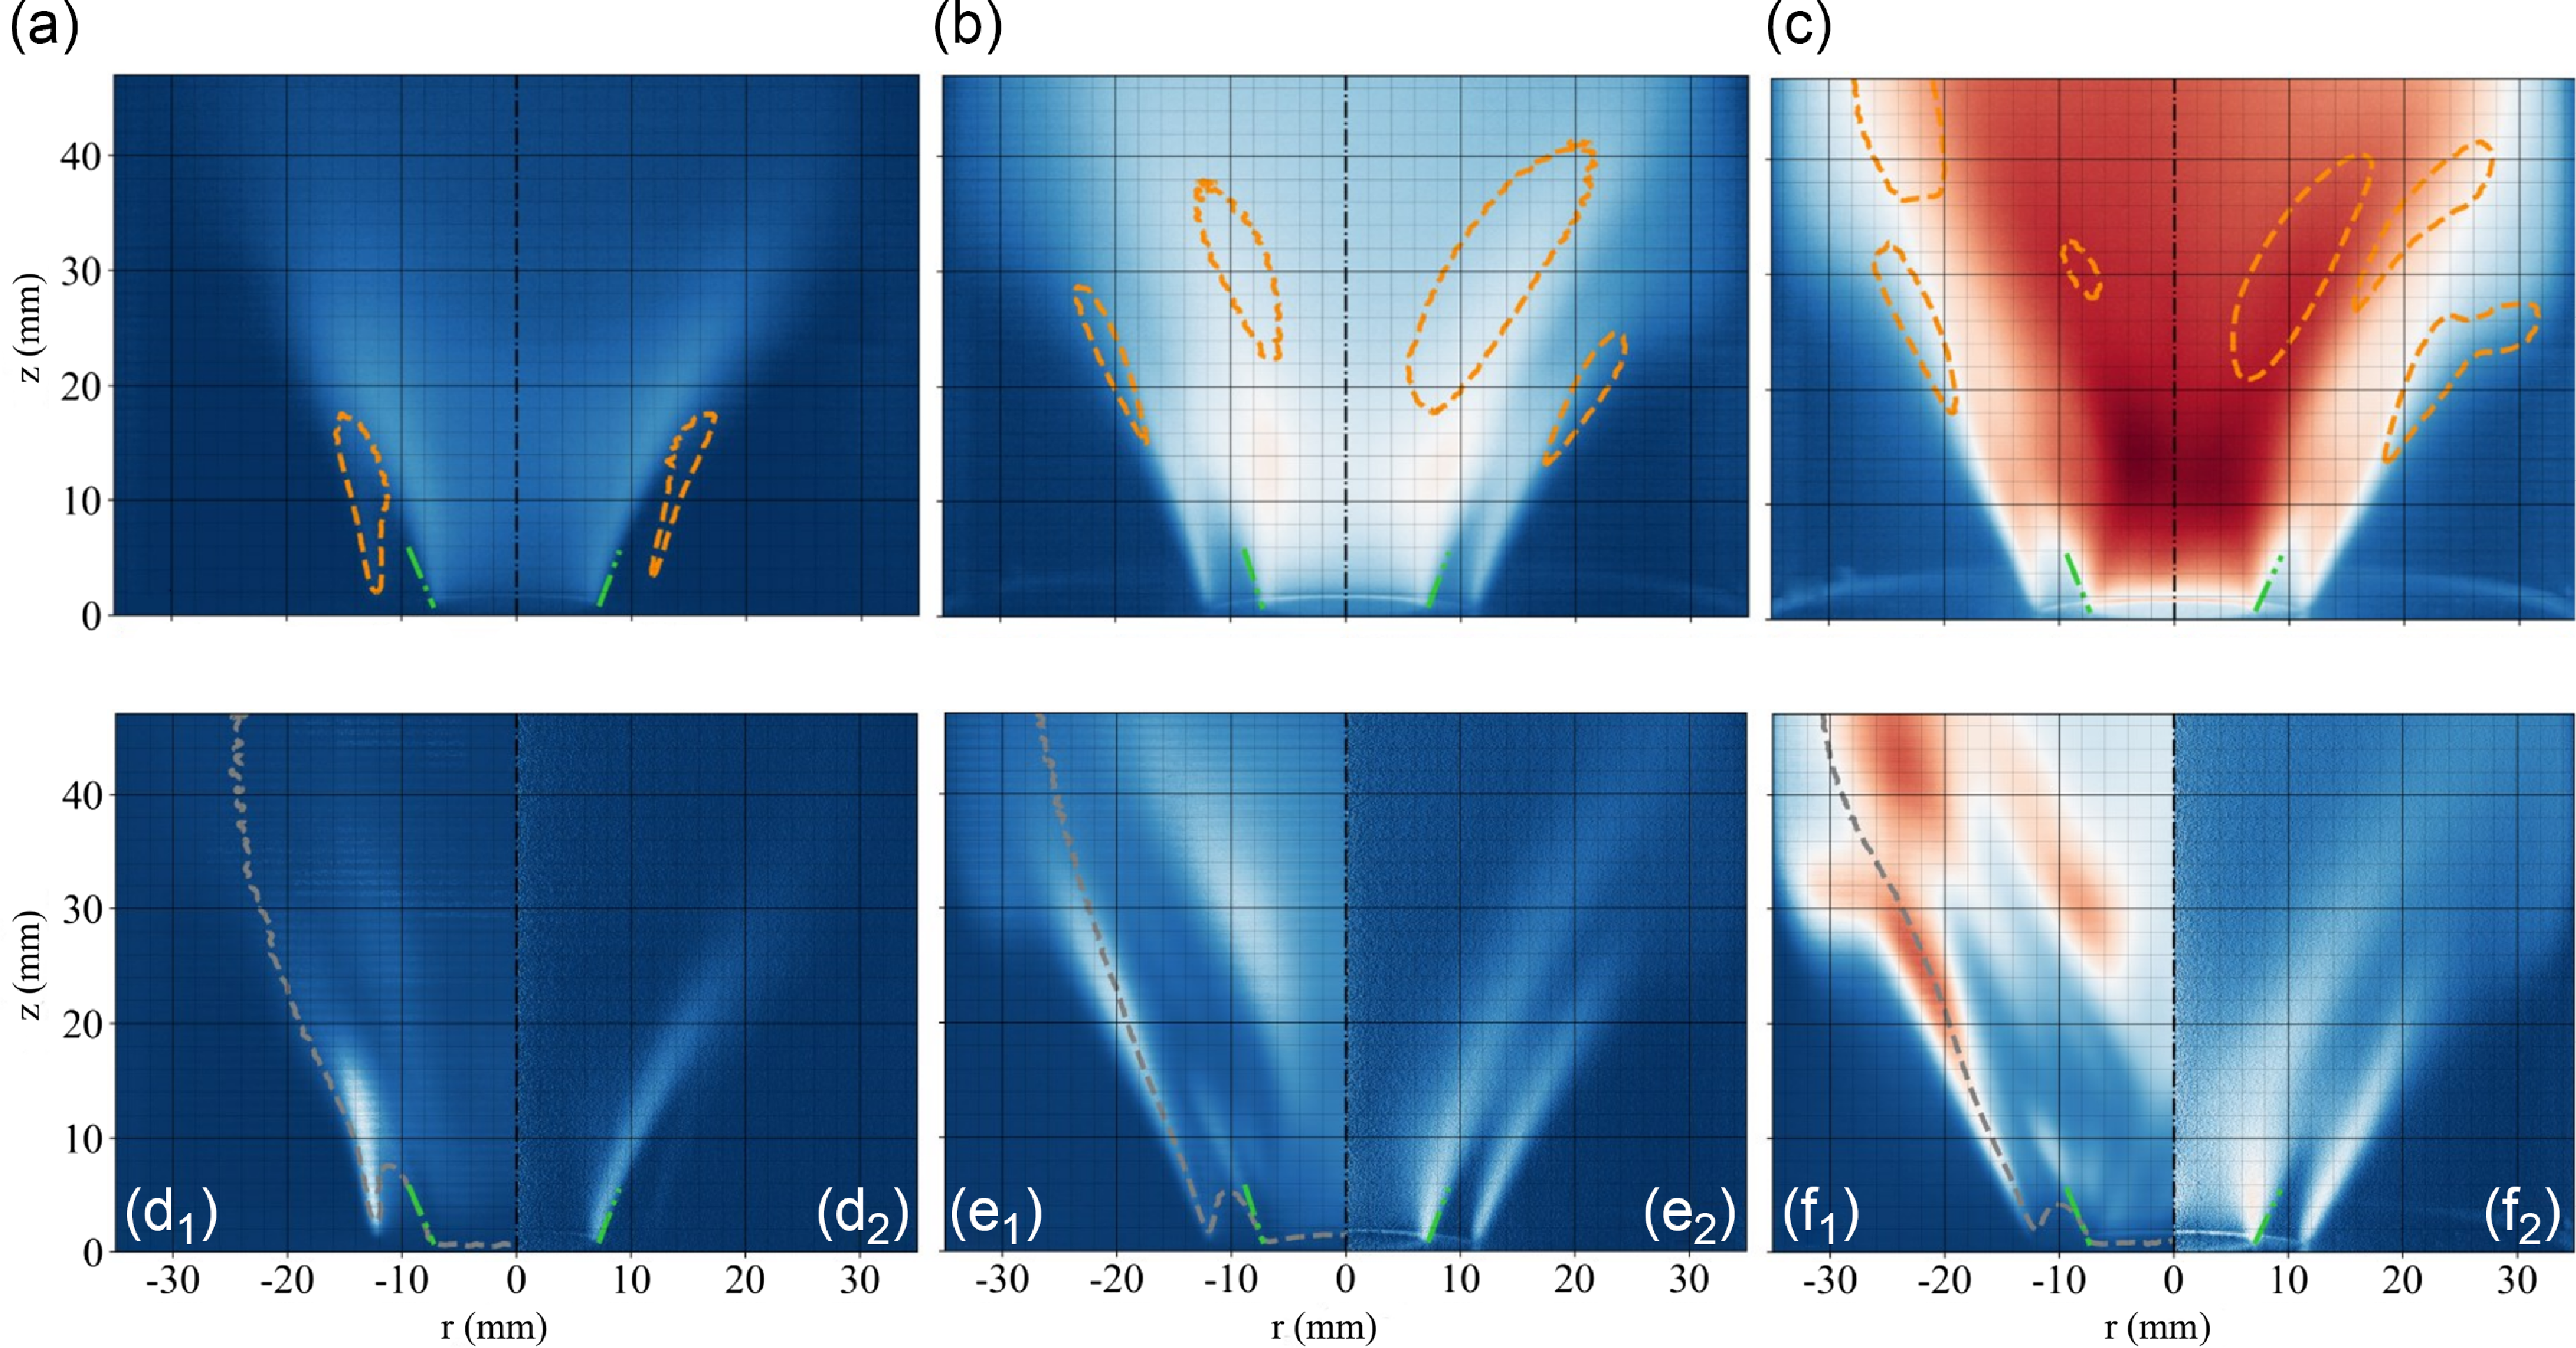
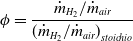
Experimental flame imaging for equivalence ratio 0.3, 0.4 and 0.5 from left to right at constant air bulk velocity 6 m s ${^{ - 1}}$
. Measured time-averaged chemiluminescence emission fields are shown on panels (a, b, c) with constant variance isolines (orange dashed line) overlaid. Chemiluminescence emission variance fields are shown in panels (d
${^{ - 1}}$
. Measured time-averaged chemiluminescence emission fields are shown on panels (a, b, c) with constant variance isolines (orange dashed line) overlaid. Chemiluminescence emission variance fields are shown in panels (d ${_1}$
,e
${_1}$
,e ${_1}$
,f
${_1}$
,f ${_1}$
) with superimposed time-averaged contours (grey dashed line). Inverse Abel transform of the time-averaged fields are shown in panels (d
${_1}$
) with superimposed time-averaged contours (grey dashed line). Inverse Abel transform of the time-averaged fields are shown in panels (d ${_2}$
,e
${_2}$
,e ${_2}$
,f
${_2}$
,f ${_2}$
). Data are scaled by maxima taken at the highest equivalence ratio.
${_2}$
). Data are scaled by maxima taken at the highest equivalence ratio.
The uncertainty for the mass flow rate controllers includes the reading error plus the full-scale error. The full-scale error ( $ \pm 0.2{{\% }}$
of full scale value), includes errors from: calibration, vibration and mechanical stress impacting the sensor accuracy, drift in accuracy over time, moisture level, flow direction and turbulence conditions at each test. In practice, for the present experiment all those contributions are low because the instruments are new and calibrated so without drift due to time. Also, these devices are utilised in an air-conditioned room (level of moisture and ambient conditions similar) and for a range of similar flow speeds between experiments. In addition, the instruments are not subject to mechanical vibrations or stress (they are attached to the optic table). Accordingly, the full-scale error was neglected for the present experimental dataset.
$ \pm 0.2{{\% }}$
of full scale value), includes errors from: calibration, vibration and mechanical stress impacting the sensor accuracy, drift in accuracy over time, moisture level, flow direction and turbulence conditions at each test. In practice, for the present experiment all those contributions are low because the instruments are new and calibrated so without drift due to time. Also, these devices are utilised in an air-conditioned room (level of moisture and ambient conditions similar) and for a range of similar flow speeds between experiments. In addition, the instruments are not subject to mechanical vibrations or stress (they are attached to the optic table). Accordingly, the full-scale error was neglected for the present experimental dataset.
The uncertainty $\varepsilon $
is
$\varepsilon $
is $ \pm 0.8{{\% }}$
of reading for fuel and air mass flow rates controller and is considered now. This uncertainty is assessed for both the equivalence ratio and the bulk flow mixture velocity, corresponding to
$ \pm 0.8{{\% }}$
of reading for fuel and air mass flow rates controller and is considered now. This uncertainty is assessed for both the equivalence ratio and the bulk flow mixture velocity, corresponding to $x$
-axis and
$x$
-axis and $y$
-axis respectively of Fig. 5(c), with a method described next. The equivalence ratio
$y$
-axis respectively of Fig. 5(c), with a method described next. The equivalence ratio $\phi $
is defined as the ratio of hydrogen and air mass flow rates of the mixture to the same quantity at the overall chemical reaction stoichiometry for hydrogen-air:
$\phi $
is defined as the ratio of hydrogen and air mass flow rates of the mixture to the same quantity at the overall chemical reaction stoichiometry for hydrogen-air:
 \begin{align}\phi = \frac{{{{\dot m}_{{H_2}}}/{{\dot m}_{air}}}}{{{{({{\dot m}_{{H_2}}}/{{\dot m}_{air}})}_{stoichio}}}}\end{align}
The denominator is referred to ${s_a}$
, the stoichiometric ratio which is equal to 0.029 for hydrogen-air. Maximum and minimum values of the equivalence ratio are obtained as a function of the manufacturer uncertainty
${s_a}$
, the stoichiometric ratio which is equal to 0.029 for hydrogen-air. Maximum and minimum values of the equivalence ratio are obtained as a function of the manufacturer uncertainty $\varepsilon $
. This yields to a minimum value
$\varepsilon $
. This yields to a minimum value ${\phi _{min}}$
for a given equivalence ratio
${\phi _{min}}$
for a given equivalence ratio $\phi $
defined with:
$\phi $
defined with:
 \begin{align}{\phi _{min}} = \phi \frac{{1 - \varepsilon }}{{1 + \varepsilon }}\end{align}
And for the maximum value ${\phi _{max}}$
:
${\phi _{max}}$
:
 \begin{align}{\phi _{max}} = \phi \frac{{1 + \varepsilon }}{{1 - \varepsilon }}\end{align}
The calculation of the uncertainty range corresponding to those two expressions was conducted and shown to be of low amplitude. For an equivalence ratio $\phi $
of 0.4, the range is
$\phi $
of 0.4, the range is $ \pm 0.006$
. An identical method to determine the uncertainty range was used for the bulk mixture velocity quantity,
$ \pm 0.006$
. An identical method to determine the uncertainty range was used for the bulk mixture velocity quantity, $y$
-axis of Fig. 5(c). The corresponding expression for the minimum bulk mixture velocity is:
$y$
-axis of Fig. 5(c). The corresponding expression for the minimum bulk mixture velocity is:
 \begin{align}{U_{b,min}} = {\dot m_{air}}\left( {1 - \varepsilon } \right)\left( {1 + {s_{air}}{\phi _{min}}} \right)/{\rho _m}A_b\end{align}
Where ${\rho _m}$
is the density of the premixture and
${\rho _m}$
is the density of the premixture and $A$
the section area where the bulk velocity is calculated (at the bluff-body tip in the present study). For the maximum value
$A$
the section area where the bulk velocity is calculated (at the bluff-body tip in the present study). For the maximum value ${U_{b,max}}$
the expression is:
${U_{b,max}}$
the expression is:
 \begin{align}{U_{b,max}} = {\dot m_{air}}\left( {1 + \varepsilon } \right)\left( {1 + {s_{air}}{\phi _{max}}} \right)/{\rho _m}A_b\end{align}
For an equivalence ratio $\phi $
of 0.4 and a bulk mixture velocity of 7.16 m s
$\phi $
of 0.4 and a bulk mixture velocity of 7.16 m s ${^{ - 1}}$
, the range is
${^{ - 1}}$
, the range is $ - 0.06$
and
$ - 0.06$
and $ + 0.06$
m s
$ + 0.06$
m s ${^{ - 1}}$
.
${^{ - 1}}$
.
The experimental results documented in this study were repeated several times (between two to ten times, one for flashback data points) on different days at different times.
Results corresponding to blue triangles-up in Fig. 5(c) are now discussed. Those points correspond to constant air flow rate and increasing hydrogen mass flow rate up to 3.1 kW thermal power, the maximum of this dataset. Data shown in Fig. 8 were obtained with axial bulk mixture velocity of 6.9 m s ${^{ - 1}}$
, 7.16 m s
${^{ - 1}}$
, 7.16 m s ${^{ - 1}}$
, and 7.41 m s
${^{ - 1}}$
, and 7.41 m s ${^{ - 1}}$
. For these three cases, the corresponding axial bulk air flow velocity is 6 m s
${^{ - 1}}$
. For these three cases, the corresponding axial bulk air flow velocity is 6 m s ${^{ - 1}}$
. The axial bulk mixture velocity is increased due to the equivalence ratio increasing from 0.3 to 0.5.
${^{ - 1}}$
. The axial bulk mixture velocity is increased due to the equivalence ratio increasing from 0.3 to 0.5.
Direct flame chemiluminescence imaging results are shown in Fig. 6 (top and central rows) along with instantaneous shadowgraphs (bottom row). Each column corresponds to one equivalence ratio, respectively 0.3, 0.4 and 0.5 from left to right at constant air bulk velocity 6 m s ${^{ - 1}}$
. Multiple observations can be made from Fig. 6. First, full premixed hydrogen-air swirling flames can be stabilised, and flashback avoided. This is shown both with the presence of the quartz tube for the chemiluminescence technique and without it for the shadowgraph. This is a central result of this study. Secondly, the flame shape evolves from a ‘V’ shape (inner branch only) at low equivalence ratio of 0.3 to a ‘M’ flame shape (inner plus outer branches) at 0.5. In the former, the chemical reactions sustaining the premixed flame front propagation are located on a single branch located at the interface of the swirling jet and the inner recirculation zone. In the latter, those are also located between the swirling jet and the outer recirculation zone located above the backplane and near the quartz tube when present. The transition of premixed flame shape has been documented in several articles with identified effects from the flame stretch [Reference Mao, Wang, Lin, Han, Zhang and Huang64], the precessing vortex core [Reference Stöhr, Oberleithner, Sieber, Yin and Meier65], the heat loss [Reference Guiberti, Durox, Scouflaire and Schuller42] or the outer rim flow/flame scales [Reference Taamallah, Shanbhogue and Ghoniem41, Reference Guiberti, Zimmer, Durox and Schuller66]. The inner branch is always present for a swirler plus bluff-body configuration whereas for the outer branch, it is not always the case.
${^{ - 1}}$
. Multiple observations can be made from Fig. 6. First, full premixed hydrogen-air swirling flames can be stabilised, and flashback avoided. This is shown both with the presence of the quartz tube for the chemiluminescence technique and without it for the shadowgraph. This is a central result of this study. Secondly, the flame shape evolves from a ‘V’ shape (inner branch only) at low equivalence ratio of 0.3 to a ‘M’ flame shape (inner plus outer branches) at 0.5. In the former, the chemical reactions sustaining the premixed flame front propagation are located on a single branch located at the interface of the swirling jet and the inner recirculation zone. In the latter, those are also located between the swirling jet and the outer recirculation zone located above the backplane and near the quartz tube when present. The transition of premixed flame shape has been documented in several articles with identified effects from the flame stretch [Reference Mao, Wang, Lin, Han, Zhang and Huang64], the precessing vortex core [Reference Stöhr, Oberleithner, Sieber, Yin and Meier65], the heat loss [Reference Guiberti, Durox, Scouflaire and Schuller42] or the outer rim flow/flame scales [Reference Taamallah, Shanbhogue and Ghoniem41, Reference Guiberti, Zimmer, Durox and Schuller66]. The inner branch is always present for a swirler plus bluff-body configuration whereas for the outer branch, it is not always the case.
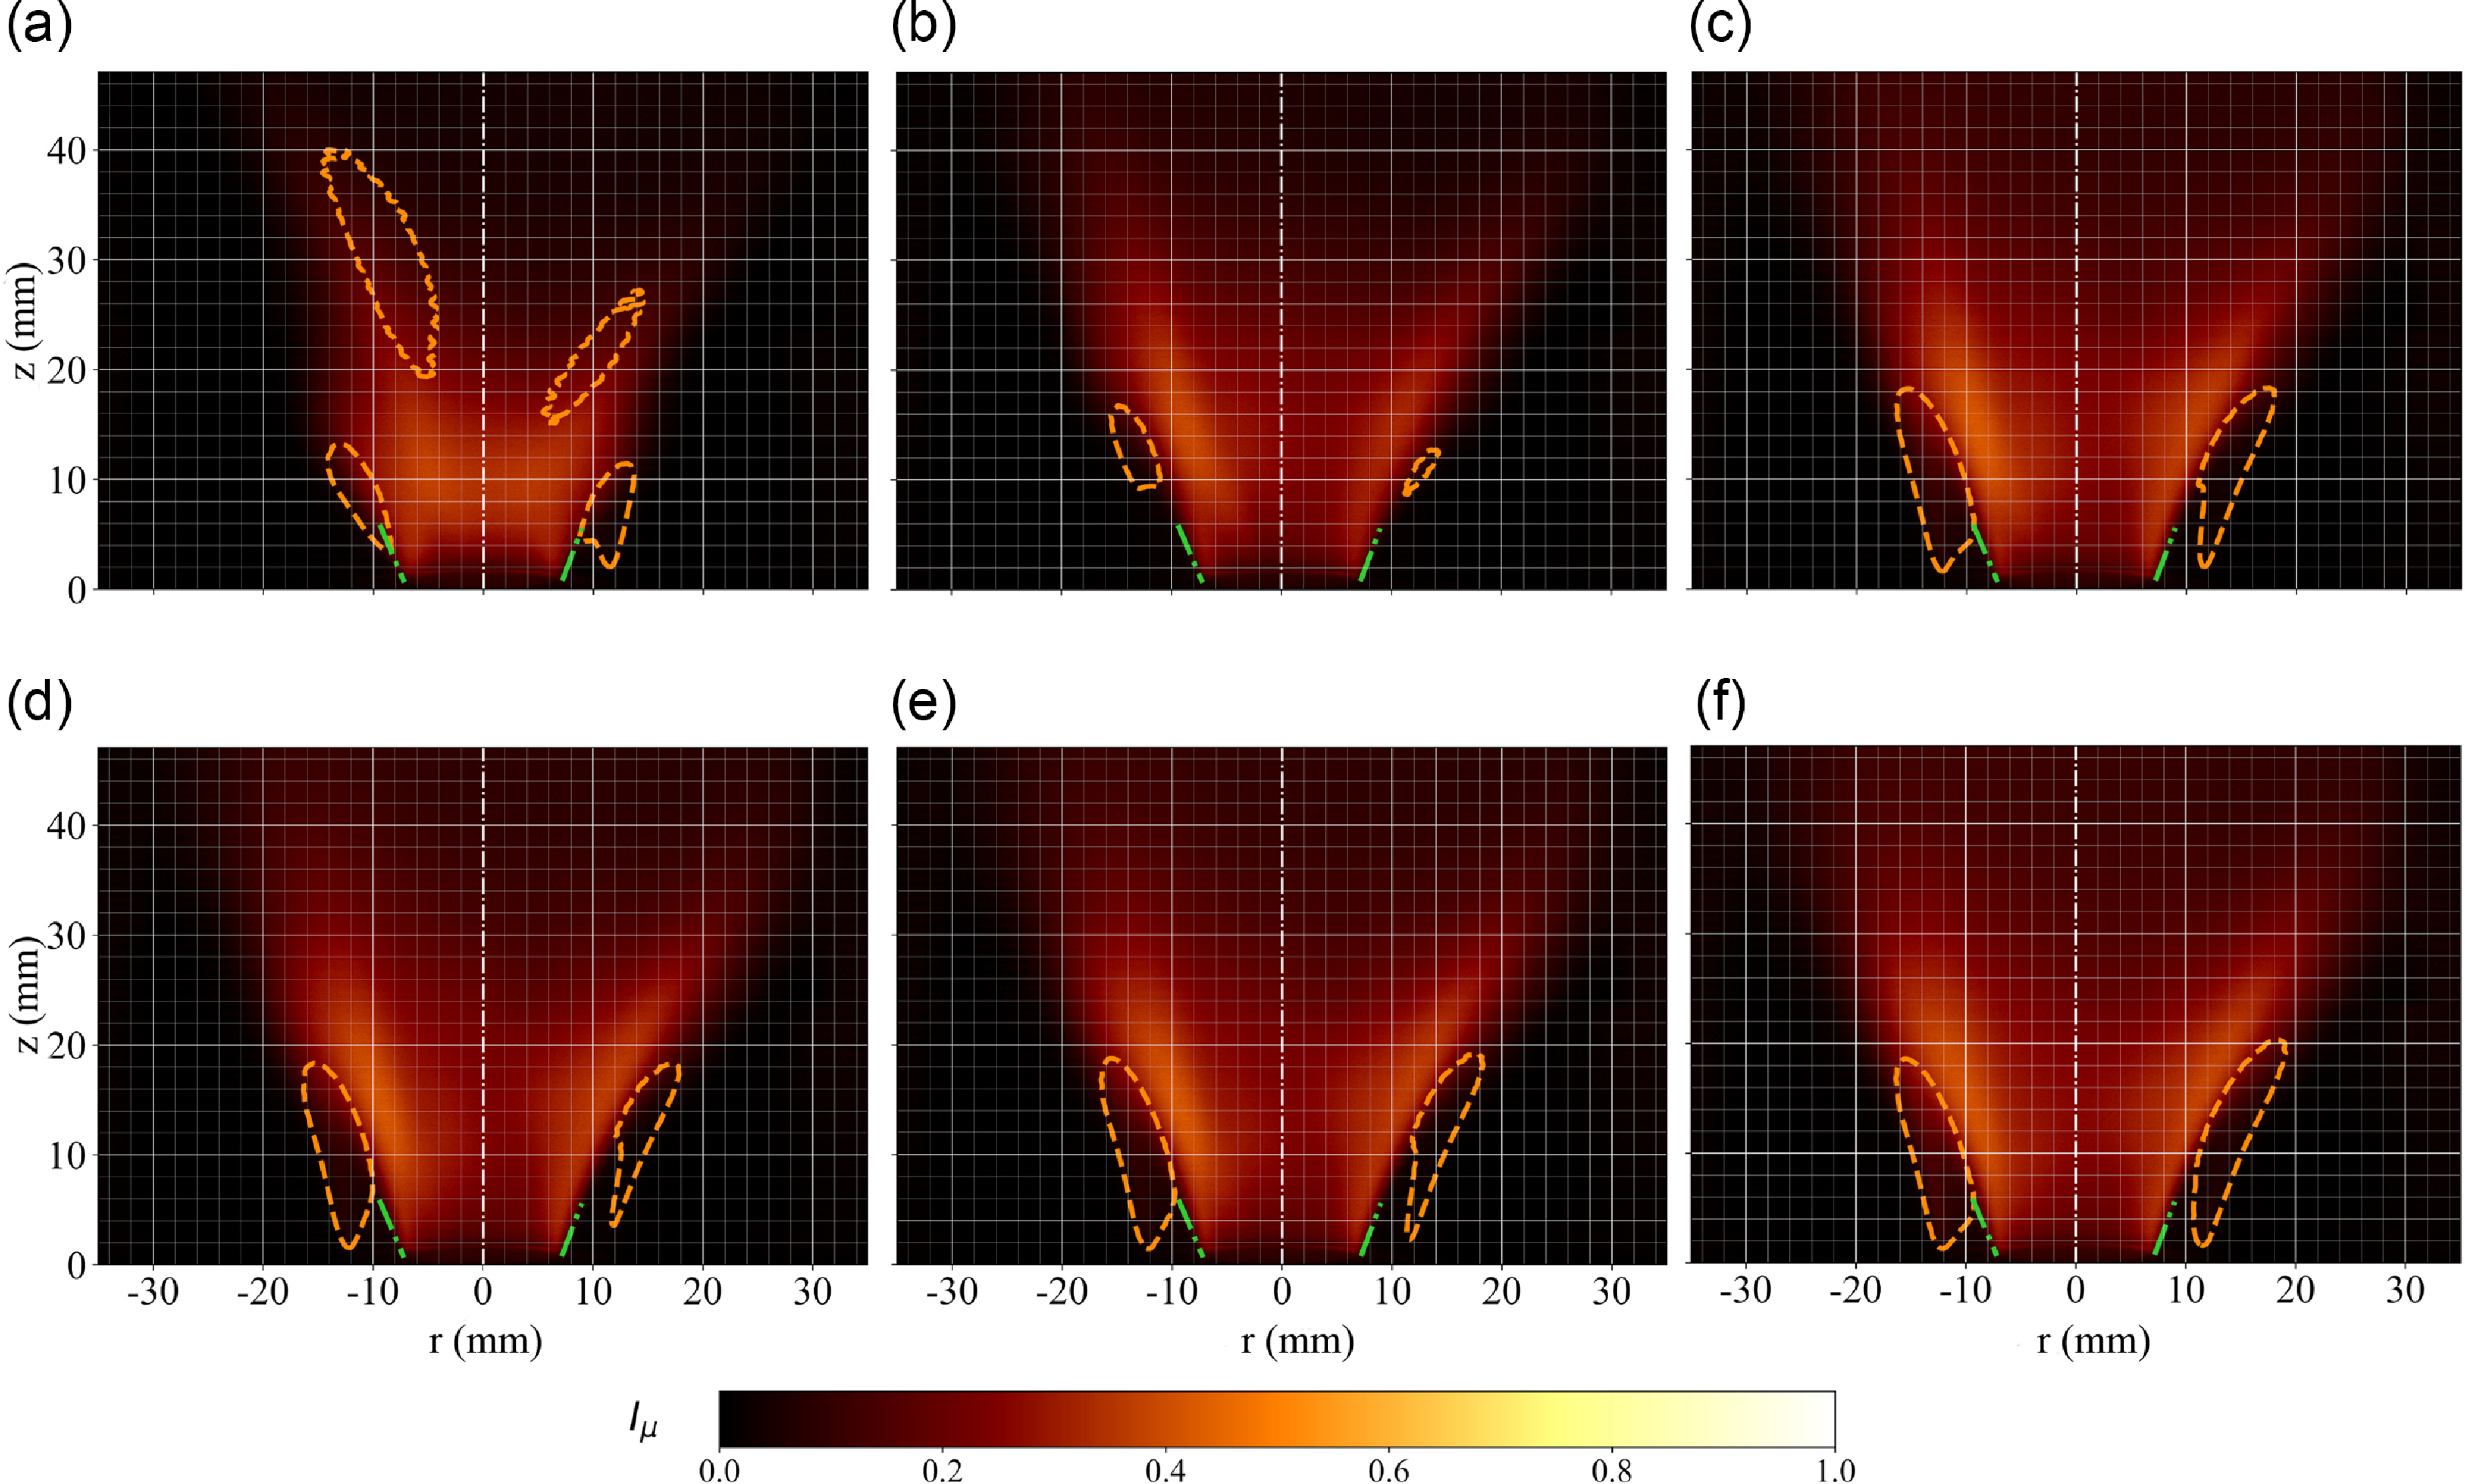
Post-processed estimates indicate an averaged 21 degrees flame angle as defined between the vertical axis and the inner time-averaged flame branch. This value holds across equivalence ratios at constant inlet air bulk velocity. A green dashed line marking the angle at the base of the flame front is shown on each panel. The emitted light signal intensity naturally increases as the equivalence ratio rises from 0.3 to 0.5 as more photons resulting from chemical reactions are released. A similar observation holds at constant equivalence ratio and increasing inlet air velocity as previously discussed. Whereas the mean inner flame branch position is weakly affected by the operating condition because the swirl level is constant, one observes the regions of maximum heat release unsteadiness shifting downstream the swirling jets as the equivalence ratio increases. The instantaneous flame images are shown in Fig. 9(a–c) for each equivalence ratio. Thirdly, from the shadowgraphs in Fig. 9(d–f), one can distinguish instantaneous features such as the flame front reaction zones regions and turbulence induced flame wrinkling, without delineating though the preferential diffusion role. A shift from ‘V’ to ‘M’ flame is observed between equivalence ratio 0.4 in Fig. 9(e) and 0.5 in Fig. 9(f). This flame shape change is occurring at a different equivalence ratio compared to the chemiluminescence data because of the absence of the quartz tube when employing the shadowgraph technique. The ‘M’ flame length is considerably reduced compared to the ‘V’ flame. This feature is attributed to the addition of the outer branch in that case to compensate for the flame surface area modification.
Instantaneous chemiluminescence flame and shadowgraphs images for equivalence ratio 0.3 (left), 0.4 (center), and 0.5 (right) at constant air bulk velocity of 6 m s ${^{ - 1}}$
are depicted.
${^{ - 1}}$
are depicted.
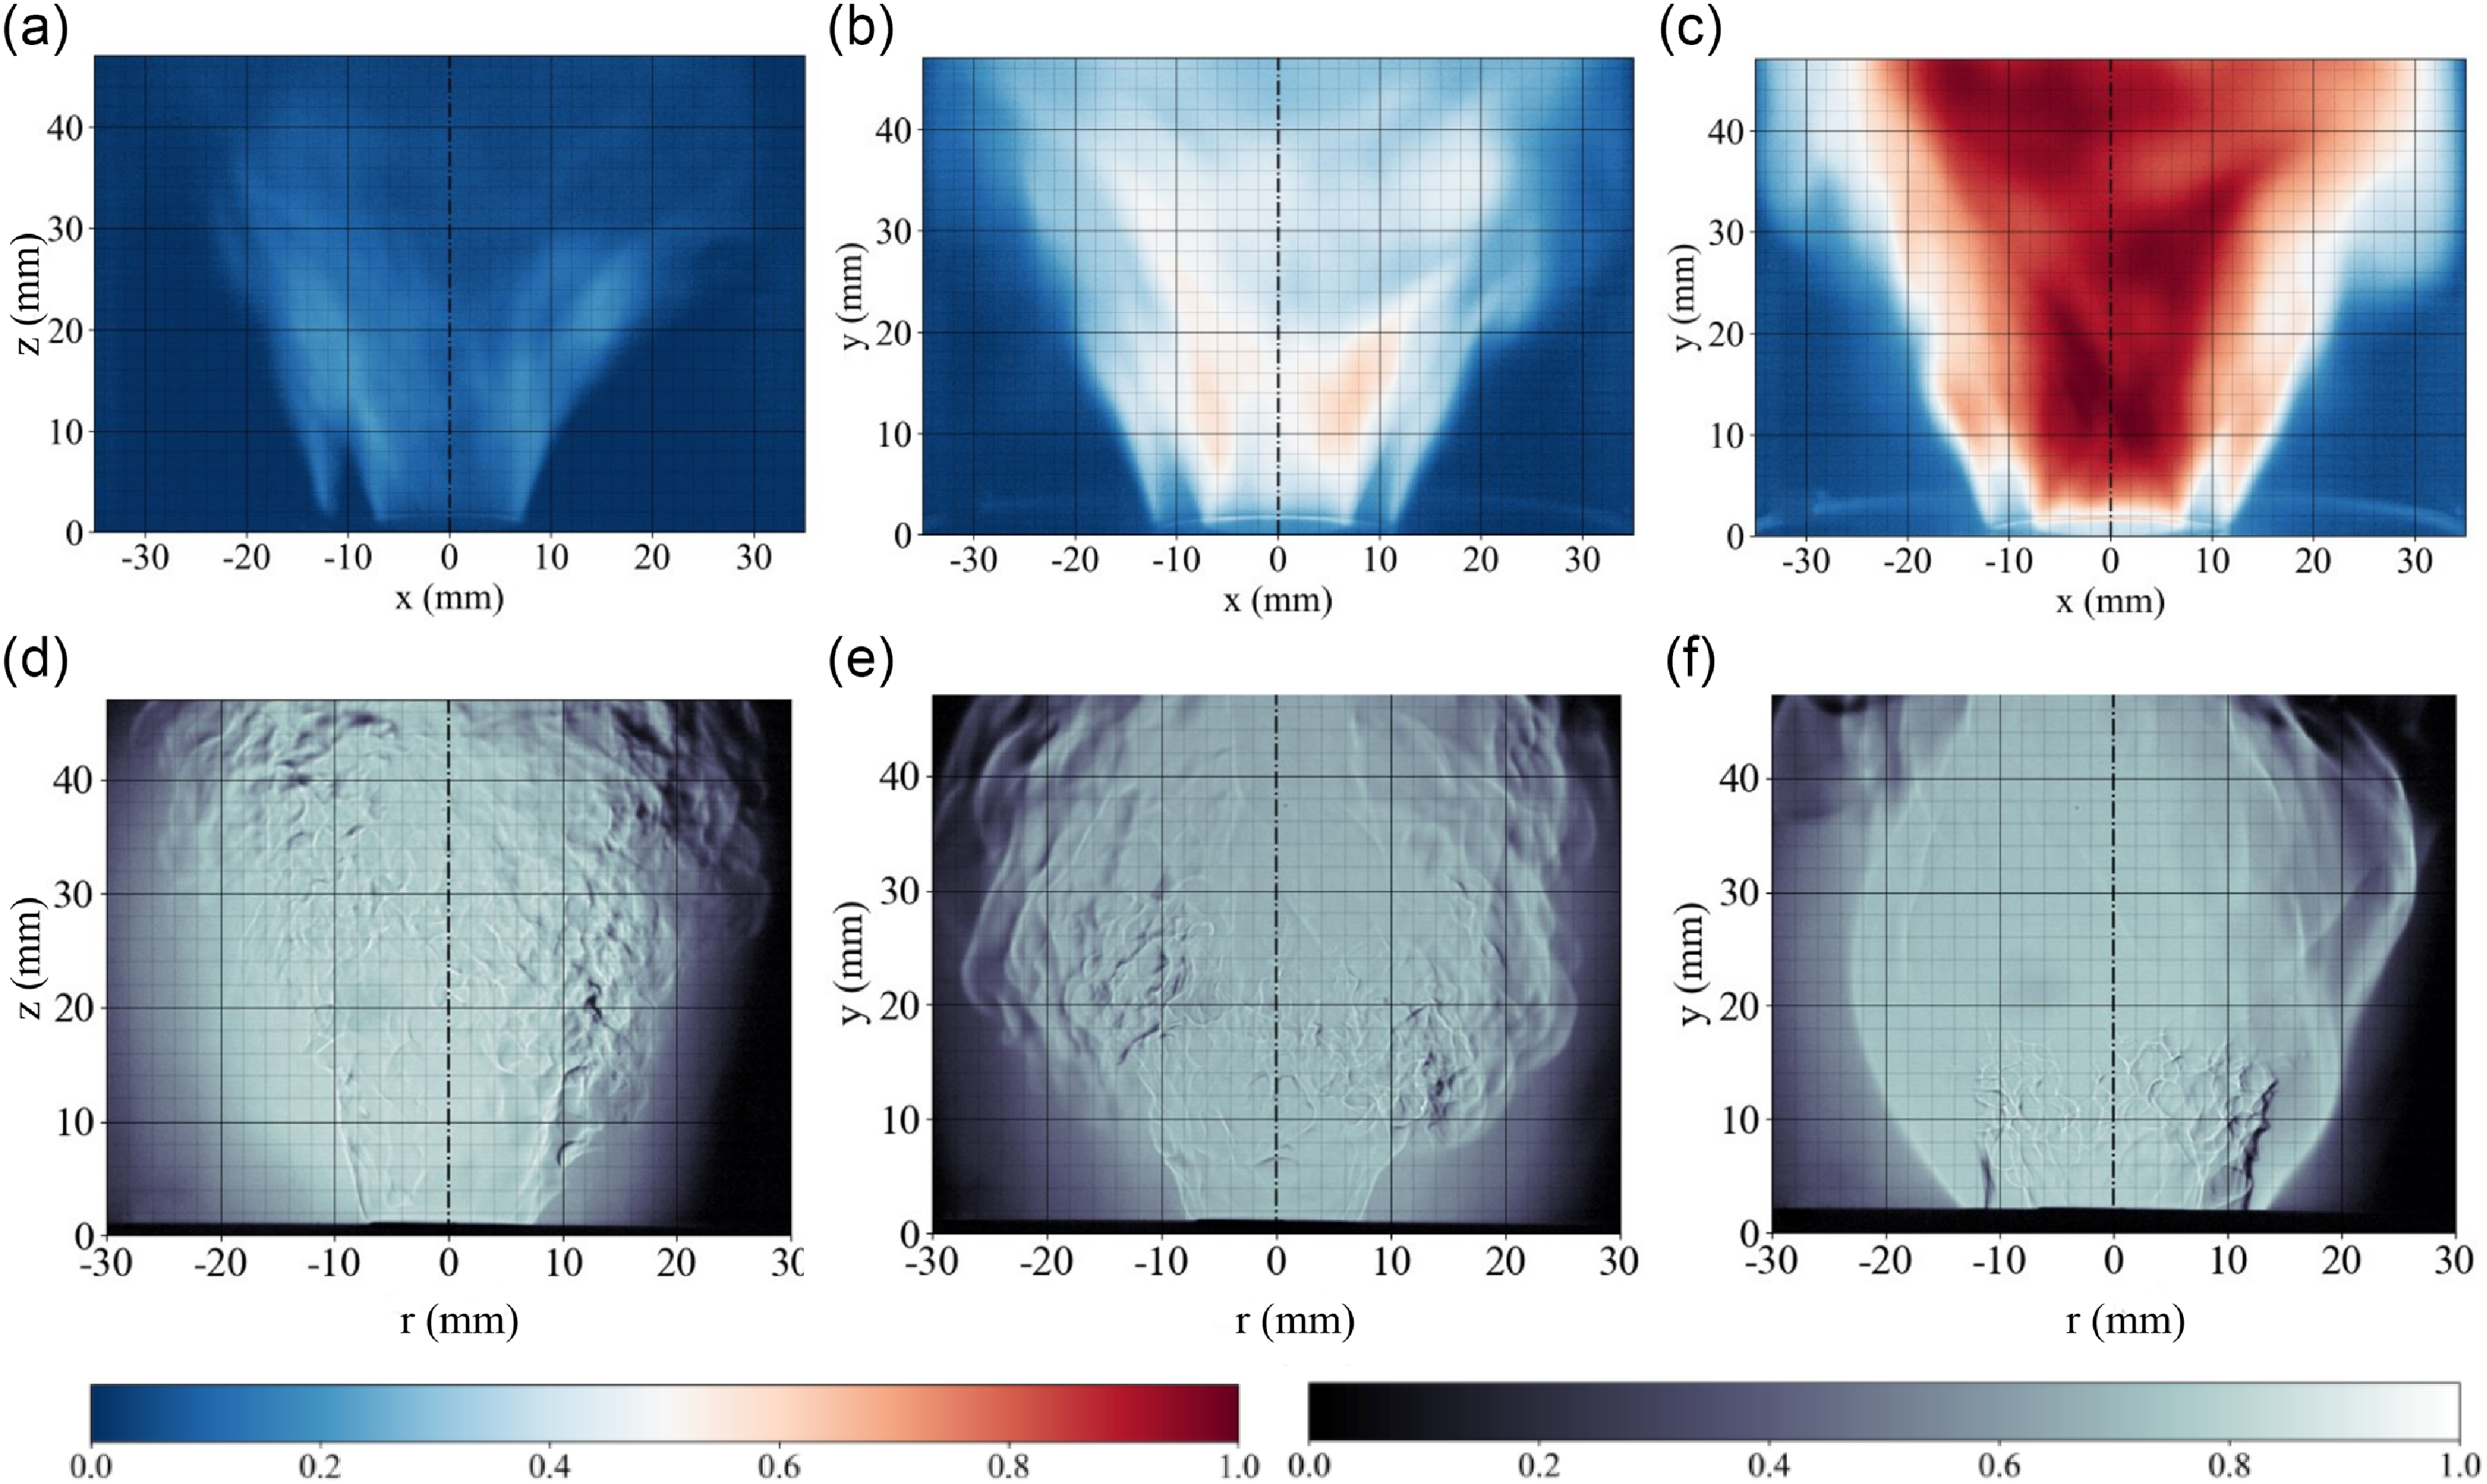
The extraction of profiles of time-averaged, minimum and maximum chemiluminescence intensity downstream the bluff-body is documented in Fig. 10(a–c). These profiles show the line-of-sight integrated intensities and inform on the variations amplitudes in absolute values around the mean. The minimum and maximum values of the profile are taken as the minimum and maximum intensities at a given location (all $r$
and
$r$
and $z$
= 13 mm) for the entire time sequence. As the equivalence ratio is increased, the amplitude increases as well as the difference between maximum and minimum levels. This is observed for example on the centerline (
$z$
= 13 mm) for the entire time sequence. As the equivalence ratio is increased, the amplitude increases as well as the difference between maximum and minimum levels. This is observed for example on the centerline ( $r$
= 0). The variances computed are documented as profiles in Fig. 11(a–c). These profiles qualitatively indicate the level of unsteadiness of the flame and confirms this trend as the variance is increased overall at high equivalence ratio. The variance peaks in the outer flame branch for all cases. It is worth pointing out that the variance level taken at this one diameter length corresponds to the lower levels regions compared to other locations as seen in Fig. 8(d
$r$
= 0). The variances computed are documented as profiles in Fig. 11(a–c). These profiles qualitatively indicate the level of unsteadiness of the flame and confirms this trend as the variance is increased overall at high equivalence ratio. The variance peaks in the outer flame branch for all cases. It is worth pointing out that the variance level taken at this one diameter length corresponds to the lower levels regions compared to other locations as seen in Fig. 8(d ${_1}$
,e
${_1}$
,e ${_1}$
,f
${_1}$
,f ${_1}$
). These are important observations for the model developed and presented next. Indeed, the steady (coined static in Ref. (Reference Palies67)) and time-averaged flame fields can be assumed similar if the unsteadiness levels are low such as in the present case (see Ref. (Reference Palies, Ilak and Cheng38) for analytical comparison steady vs time-averaged). Accordingly, the flame angle processed from the time-averaged can be compared to the steady flame angle.
${_1}$
). These are important observations for the model developed and presented next. Indeed, the steady (coined static in Ref. (Reference Palies67)) and time-averaged flame fields can be assumed similar if the unsteadiness levels are low such as in the present case (see Ref. (Reference Palies, Ilak and Cheng38) for analytical comparison steady vs time-averaged). Accordingly, the flame angle processed from the time-averaged can be compared to the steady flame angle.
Profiles of time-averaged, minimum and maximum chemiluminescence intensity extracted downstream the bluff-body.
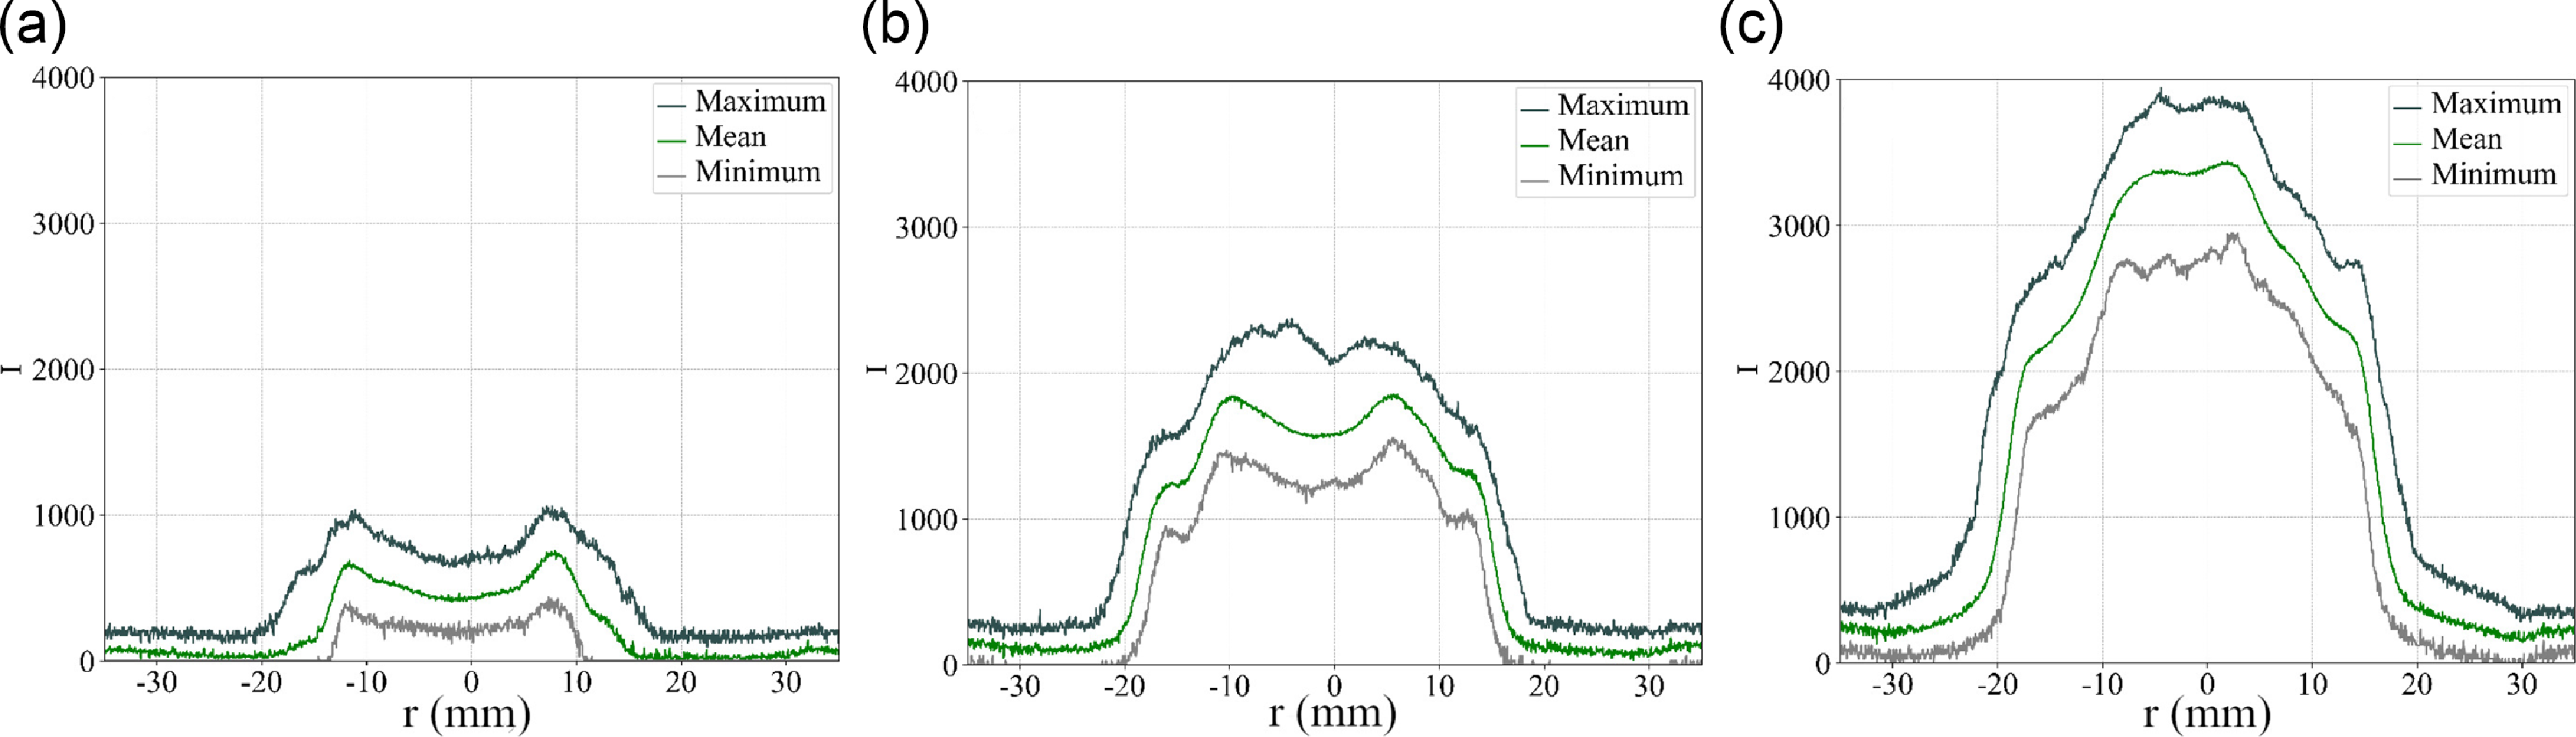
Profiles of variance of chemiluminescence intensity extracted at one bluff-body diameter downstream the bluff-body.
5.0 Theory for highly swirled lean fully premixed flame stabilisation
The demonstrations made and reported in the previous section have been driven by recent theoretical results indicating that premixed flame front stabilisation can be analysed with steady, unsteady, and instantaneous budgets [Reference Palies67] of the kinematic flame front condition [Reference Candel and Poinsot68]. This condition is defined as the balance between the flame surface vector ${{\mathbf{w}}_s}$
, the flow velocity vector
${{\mathbf{w}}_s}$
, the flow velocity vector ${\mathbf{v}}$
and the local flame displacement speed
${\mathbf{v}}$
and the local flame displacement speed ${S_d}$
along the flame front normal vector
${S_d}$
along the flame front normal vector ${\mathbf{n}}$
. It is expressed as:
${\mathbf{n}}$
. It is expressed as:
 \begin{align}{{\mathbf{w}}_s} = {\mathbf{v}} + {S_d}{\mathbf{n}}\end{align}
A concise stabilisation expression is obtained with the steady budget for this kinematic condition that results in:
 \begin{align}v_{r,0}^2 + v_{\theta, 0}^2 + v_{z,0}^2 = S_{d,0}^2\end{align}
where ${v_{r,0}}$
,
${v_{r,0}}$
, ${v_{\theta, 0}}$
, and
${v_{\theta, 0}}$
, and ${v_{z,0}}$
are the local radial, azimuthal and axial steady velocity components whereas
${v_{z,0}}$
are the local radial, azimuthal and axial steady velocity components whereas ${S_{d,0}}$
is the local flame displacement speed. In reacting swirling flows, at the interface of the inner recirculation zone and the swirling jets, by definition, there is a low, nearly zero velocity region where the left-hand side of this expression matches the local flame displacement speed. Based on this observation, this expression was developed and explored to lead to stabilisation of fully premixed hydrogen-air highly swirled flames. The criterion, noted
${S_{d,0}}$
is the local flame displacement speed. In reacting swirling flows, at the interface of the inner recirculation zone and the swirling jets, by definition, there is a low, nearly zero velocity region where the left-hand side of this expression matches the local flame displacement speed. Based on this observation, this expression was developed and explored to lead to stabilisation of fully premixed hydrogen-air highly swirled flames. The criterion, noted ${{{\Delta }}_s}$
, is derived from the above expression. An azimuthal velocity scaling through a swirl velocity ratio is firstly introduced:
${{{\Delta }}_s}$
, is derived from the above expression. An azimuthal velocity scaling through a swirl velocity ratio is firstly introduced:
 \begin{align}S = {v_{\theta, 0}}/{v_{z,0}}\end{align}
The swirl velocity ratio selected value is a trade-off between the geometrical swirl number defined based on geometry, see the calculation corresponding to Fig. 3(a) in Section 2 and Equation (1), and the condition imposed by Equation (13). A value of 0.74 is selected for $S$
. A radial velocity scaling through the flame angle
$S$
. A radial velocity scaling through the flame angle $\alpha $
as defined between the vertical axis and the local flame front surface is utilised as well:
$\alpha $
as defined between the vertical axis and the local flame front surface is utilised as well:
 \begin{align}{\tan \alpha} = {v_{r,0}}/{v_{z,0}}\end{align}
This angle is obtained at the bluff-body tip assuming that the swirling jet drives the flame angle. Combining Equations (9), (10) and (11) leads to the concise criterion:
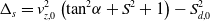 \begin{align}{{{\Delta }}_s} = v_{z,0}^2\left( {{\mathrm{ta}}{{\mathrm{n}}^2}\alpha + {S^2} + 1} \right) - S_{d,0}^2\end{align}
Whereas the normal vector ${{\mathbf{n}}_0}$
of the steady flame front is perpendicular to the steady azimuthal velocity component
${{\mathbf{n}}_0}$
of the steady flame front is perpendicular to the steady azimuthal velocity component ${v_{\theta, 0}}{{\mathbf{e}}_\theta }$
, the velocity
${v_{\theta, 0}}{{\mathbf{e}}_\theta }$
, the velocity ${v_{\theta, 0}}$
is not zero. Additionally, the radial velocity ratio can be expressed as:
${v_{\theta, 0}}$
is not zero. Additionally, the radial velocity ratio can be expressed as:
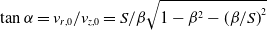 \begin{align}{\tan \alpha} = {v_{r,0}}/{v_{z,0}} = S/\beta \sqrt {1 - {\beta ^2} - {{(\beta /S)}^2}} \end{align}
where the parameter $\beta = 0.57$
is the ratio of azimuthal velocity component to the local flame speed [Reference Palies67].
$\beta = 0.57$
is the ratio of azimuthal velocity component to the local flame speed [Reference Palies67].
The stabilisation criterion ${{{\Delta }}_s}$
defined by Equation (12), requires: a steady axial velocity radial profile
${{{\Delta }}_s}$
defined by Equation (12), requires: a steady axial velocity radial profile ${v_{z,0}}\left( r \right)$
at the bluff-body tip, and the stretched flame speed
${v_{z,0}}\left( r \right)$
at the bluff-body tip, and the stretched flame speed ${S_{d,0}}$
. These are defined and documented next.
${S_{d,0}}$
. These are defined and documented next.
Firstly, the profile of steady axial velocity ${v_{z,0}}\left( r \right)$
(see Appendix A) is defined with:
${v_{z,0}}\left( r \right)$
(see Appendix A) is defined with:
 \begin{align}{v_{z,0}}\left( r \right) = \frac{3}{2}{U_b}\left[1 - \left( \frac{{2r - {r_o} - {r_i}}}{{{r_o} - {r_i}}}\right)^2 \right]\end{align}
Secondly, the stretched flame speed data are obtained as follows. In a first step, the flame stretch is derived analytically for the steady flame. The flame stretch $\kappa $
[Reference Candel and Poinsot68, Reference Matalon69] of an elemental flame front surface area is defined as:
$\kappa $
[Reference Candel and Poinsot68, Reference Matalon69] of an elemental flame front surface area is defined as:
 \begin{align}\kappa = {\mathbf{nn}}:\nabla {\mathbf{v}} + \nabla \cdot {\mathbf{v}} + {S_d}\nabla \cdot {\mathbf{n}}\end{align}
Equation (15) includes three distinct terms: the flow strain at the flame front, the flow dilatation at the flame front, and the flame front curvature term. Accordingly, the explicit formulae of the flame stretch in cylindrical coordinates for the present flame can be derived. Neglecting the axial velocity gradient $\partial {v_z}/\partial z$
in the obtained flame stretch expression, assuming symmetry in the azimuthal direction of the steady flow
$\partial {v_z}/\partial z$
in the obtained flame stretch expression, assuming symmetry in the azimuthal direction of the steady flow $\partial /\partial \theta = 0$
, and because the azimuthal normal steady flame front vector component
$\partial /\partial \theta = 0$
, and because the azimuthal normal steady flame front vector component ${n_{\theta, 0}}$
is zero, the derivation in cylindrical coordinates yields to:
${n_{\theta, 0}}$
is zero, the derivation in cylindrical coordinates yields to:
 \begin{align}\kappa = \frac{{\partial {v_{z,0}}}}{{\partial r}}{\cos \alpha} \left[ {\sin\alpha - {A_\alpha }\cos \alpha} \right] + \frac{{{A_\alpha }}}{r}\frac{\partial }{{\partial r}}\left( {r{v_{z,0}}} \right) + {\cos \alpha} \frac{{S_L^0}}{r}\end{align}
The first term, associated with the flow strain cancels out because ${A_\alpha }$
is equal to
${A_\alpha }$
is equal to $\tan \alpha$
as the radial and axial velocity components are linked with:
$\tan \alpha$
as the radial and axial velocity components are linked with:
 \begin{align}{v_{r,0}}\left( r \right) = {A_\alpha }{v_{z,0}}\left( r \right)\end{align}
The second term due to the flow dilation, associated to local flow divergence, is neglected here because the flame stretch is evaluated on the unburnt gases side where the density is constant. The third expression represents the curvature of the steady highly swirled flame front. This expression of the flame stretch $\kappa $
, Equation (16), is computed prior to determining the stretched laminar flame displacement speeds discussed now. The second step consists of computing the stretched flame speed
$\kappa $
, Equation (16), is computed prior to determining the stretched laminar flame displacement speeds discussed now. The second step consists of computing the stretched flame speed ${S_{d,0}}$
.
${S_{d,0}}$
.
The stretched laminar flame displacement speed quantity ${S_L}$
is identical to
${S_L}$
is identical to ${S_{d,0}}$
in the criterion
${S_{d,0}}$
in the criterion ${{{\Delta }}_s}$
of Equation (12). It is worth pointing out that the steady flame front is laminar in nature here and thus the equality holds between
${{{\Delta }}_s}$
of Equation (12). It is worth pointing out that the steady flame front is laminar in nature here and thus the equality holds between ${S_L}$
and
${S_L}$
and ${S_{d,0}}$
. The flame speed
${S_{d,0}}$
. The flame speed ${S_L}$
is calculated considering a linear dependency on the flame stretch
${S_L}$
is calculated considering a linear dependency on the flame stretch $\kappa $
for the steady flow considered here. The unburnt stretched laminar flame speed is expressed as a function of the burnt gases Markstein length
$\kappa $
for the steady flow considered here. The unburnt stretched laminar flame speed is expressed as a function of the burnt gases Markstein length ${{\mathcal{L}}_b}$
[Reference Beeckmann, Hesse, Kruse, Berens, Peters, Pitsch and Matalon22] with:
${{\mathcal{L}}_b}$
[Reference Beeckmann, Hesse, Kruse, Berens, Peters, Pitsch and Matalon22] with:
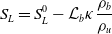 \begin{align}{S_L} = S_L^0 - {{\mathcal{L}}_b}\kappa \frac{{{\rho _b}}}{{{\rho _u}}}\end{align}
Where ${\rho _u}$
and
${\rho _u}$
and ${\rho _b}$
are the unburnt and burnt gas densities. The modified linear curvature model from Shu et al. [Reference Shu, Xue, Liang and Ren23] is used to get the stretched flame speed in this study. The Markstein length
${\rho _b}$
are the unburnt and burnt gas densities. The modified linear curvature model from Shu et al. [Reference Shu, Xue, Liang and Ren23] is used to get the stretched flame speed in this study. The Markstein length ${{\mathcal{L}}_b}$
is computed with the definition [Reference Shu, Xue, Liang and Ren23]:
${{\mathcal{L}}_b}$
is computed with the definition [Reference Shu, Xue, Liang and Ren23]:
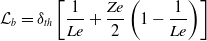 \begin{align}{{\mathcal{L}}_b} = {\delta _{th}}\left[ {\frac{1}{{Le}} + \frac{{Ze}}{2}\left( {1 - \frac{1}{{Le}}} \right)} \right]\end{align}
Where the thermal flame thickness is defined following Sun et al. [Reference Sun, Sung, He and Law70]:
 \begin{align}{\delta _{th}} = \frac{{{T_b} - {T_u}}}{{|\nabla T{|_{max}}}}\end{align}
The Lewis number Le is defined as the ratio of thermal diffusivity and mixture-averaged hydrogen species diffusion coefficient [Reference Chen, Choudhary, De Supinski, DeVries, Hawkes, Klasky, Liao, Ma, Mellor-Crummey and Podhorszki71]. The Zeldovitch number is defined [Reference Shu, Xue, Liang and Ren23] with:
 \begin{align}Ze = 4\frac{{{T_b} - {T_u}}}{{{T_b} - {T^0}}}\end{align}
where ${T^0}$
is the inner flame temperature corresponding to the highest heat release location in the flame front. This temperature is computed with:
${T^0}$
is the inner flame temperature corresponding to the highest heat release location in the flame front. This temperature is computed with:
 \begin{align}{T_0} = {T_u} + 0.7\left( {{T_b} - {T_u}} \right)\end{align}
where 0.7 is the non-dimensional temperature value used for identification of the reaction zone. In addition to the Markstein lengths and the flame stretch in Equation (18), the unstretched $S_L^0$
laminar flame displacement speeds were next extracted from experimental and chemical kinetic literature data, see Appendix B. Inserting the above expressions with the Markstein length Equation (19) yields the unburnt side stretched laminar flame displacements speeds
$S_L^0$
laminar flame displacement speeds were next extracted from experimental and chemical kinetic literature data, see Appendix B. Inserting the above expressions with the Markstein length Equation (19) yields the unburnt side stretched laminar flame displacements speeds ${S_L}$
in Equation (18) for each equivalence ratio ranging from 0.3 to unity.
${S_L}$
in Equation (18) for each equivalence ratio ranging from 0.3 to unity.
All quantities computed to calculate the criterion ${{{\Delta }}_s}$
are taken on the unburnt side of the flame (stretched flame speed, non-dimensional numbers, transport and thermodynamics data, Markstein lengths, and parabolic velocity profile) so that the constant density flow (non-reacting) assumption is valid. This ensures consistency throughout the data and models taken from literature or derived here. The same approach is taken in von Elbe and Lewis [Reference Von Elbe and Lewis30] or in Cheng et al. [Reference Cheng, Littlejohn, Strakey and Sidwell32]. The criterion
${{{\Delta }}_s}$
are taken on the unburnt side of the flame (stretched flame speed, non-dimensional numbers, transport and thermodynamics data, Markstein lengths, and parabolic velocity profile) so that the constant density flow (non-reacting) assumption is valid. This ensures consistency throughout the data and models taken from literature or derived here. The same approach is taken in von Elbe and Lewis [Reference Von Elbe and Lewis30] or in Cheng et al. [Reference Cheng, Littlejohn, Strakey and Sidwell32]. The criterion ${{{\Delta }}_s}$
can be assessed at any points of the flame surface. Its application to the bluff-body tip location where the wall no-slip condition induces the lowest flow speeds is particularly of interest because the flame front can propagate through flashback [Reference Novoselov, Ebi and Noiray16, Reference Ebi and Clemens53]. In this near wall region, it is known that a strong heat transfer occurs from the flame to the walls inducing local extinction. The minimum distance between the wall (the bluff-body here) and the flame front location (defined by its maximum chemical heat release) is known as the quenching distance over which a flame front cannot propagate because the wall induces a cooling effect on the flame. This quenching distance must thus be considered to include the flashback propensity in the criterion
${{{\Delta }}_s}$
can be assessed at any points of the flame surface. Its application to the bluff-body tip location where the wall no-slip condition induces the lowest flow speeds is particularly of interest because the flame front can propagate through flashback [Reference Novoselov, Ebi and Noiray16, Reference Ebi and Clemens53]. In this near wall region, it is known that a strong heat transfer occurs from the flame to the walls inducing local extinction. The minimum distance between the wall (the bluff-body here) and the flame front location (defined by its maximum chemical heat release) is known as the quenching distance over which a flame front cannot propagate because the wall induces a cooling effect on the flame. This quenching distance must thus be considered to include the flashback propensity in the criterion ${{{\Delta }}_s}$
.
${{{\Delta }}_s}$
.
There are two distinct set of research in literature focusing on quenching distances: (i) studies focusing on wall boundary layer flashback, and (ii) studies focusing on flame-wall interactions. In the former, the flame quenching distance and the critical velocity gradient in the boundary layer are at work [Reference Kalantari and McDonell8, Reference Von Elbe and Lewis30, Reference Novoselov, Ebi and Noiray55] to balance the local flame speed and the local axial flow speed. In the latter, a Peclet number Pe ${_Q} = {y_Q}/\delta = {y_Q}/\delta $
is introduced to define the quenching distance
${_Q} = {y_Q}/\delta = {y_Q}/\delta $
is introduced to define the quenching distance ${y_Q}$
for a given flame-wall interaction [Reference Kalantari and McDonell8, Reference Poinsot, Haworth and Bruneaux72, Reference Enomoto73] with respect to the thermal laminar flame thickness
${y_Q}$
for a given flame-wall interaction [Reference Kalantari and McDonell8, Reference Poinsot, Haworth and Bruneaux72, Reference Enomoto73] with respect to the thermal laminar flame thickness $\delta $
. Several configurations have been studied in the literature indicating that the Peclet number can vary from 0.38 [Reference Gruber, Sankaran, Hawkes and Chen74] to 1.4 [Reference Lai, Ahmed, Klein and Chakraborty75] on head-on quenching, and up to 3 on side-wall quenching [Reference Enomoto73] for hydrogen/air premixed flames. A value of unity leads to matching both research areas conditions and it is selected here so that Pe
$\delta $
. Several configurations have been studied in the literature indicating that the Peclet number can vary from 0.38 [Reference Gruber, Sankaran, Hawkes and Chen74] to 1.4 [Reference Lai, Ahmed, Klein and Chakraborty75] on head-on quenching, and up to 3 on side-wall quenching [Reference Enomoto73] for hydrogen/air premixed flames. A value of unity leads to matching both research areas conditions and it is selected here so that Pe ${_Q}$
= 1. The thermal diffusive flame thickness
${_Q}$
= 1. The thermal diffusive flame thickness $\delta = \lambda /\left( {\rho {c_p}S_L^0} \right)$
in quiet mixture [Reference Ballal and Lefebvre76, Reference Williams77] is introduced and used, and the criterion
$\delta = \lambda /\left( {\rho {c_p}S_L^0} \right)$
in quiet mixture [Reference Ballal and Lefebvre76, Reference Williams77] is introduced and used, and the criterion ${{{\Delta }}_s}$
is assessed at a radius equal to the quenching distance. The quantity
${{{\Delta }}_s}$
is assessed at a radius equal to the quenching distance. The quantity ${{{\Delta }}_s}$
is assessed carefully and compared to experimental measurements obtained from the experiment in the next section.
${{{\Delta }}_s}$
is assessed carefully and compared to experimental measurements obtained from the experiment in the next section.
In Fig. 12, all the notations including vectors, flame angle $\alpha $
, quenching distance
$\alpha $
, quenching distance ${y_Q}$
, relevant to the kinematic description are depicted.
${y_Q}$
, relevant to the kinematic description are depicted.
Premixed swirling flame stabilisation kinematic descriptive schematic.
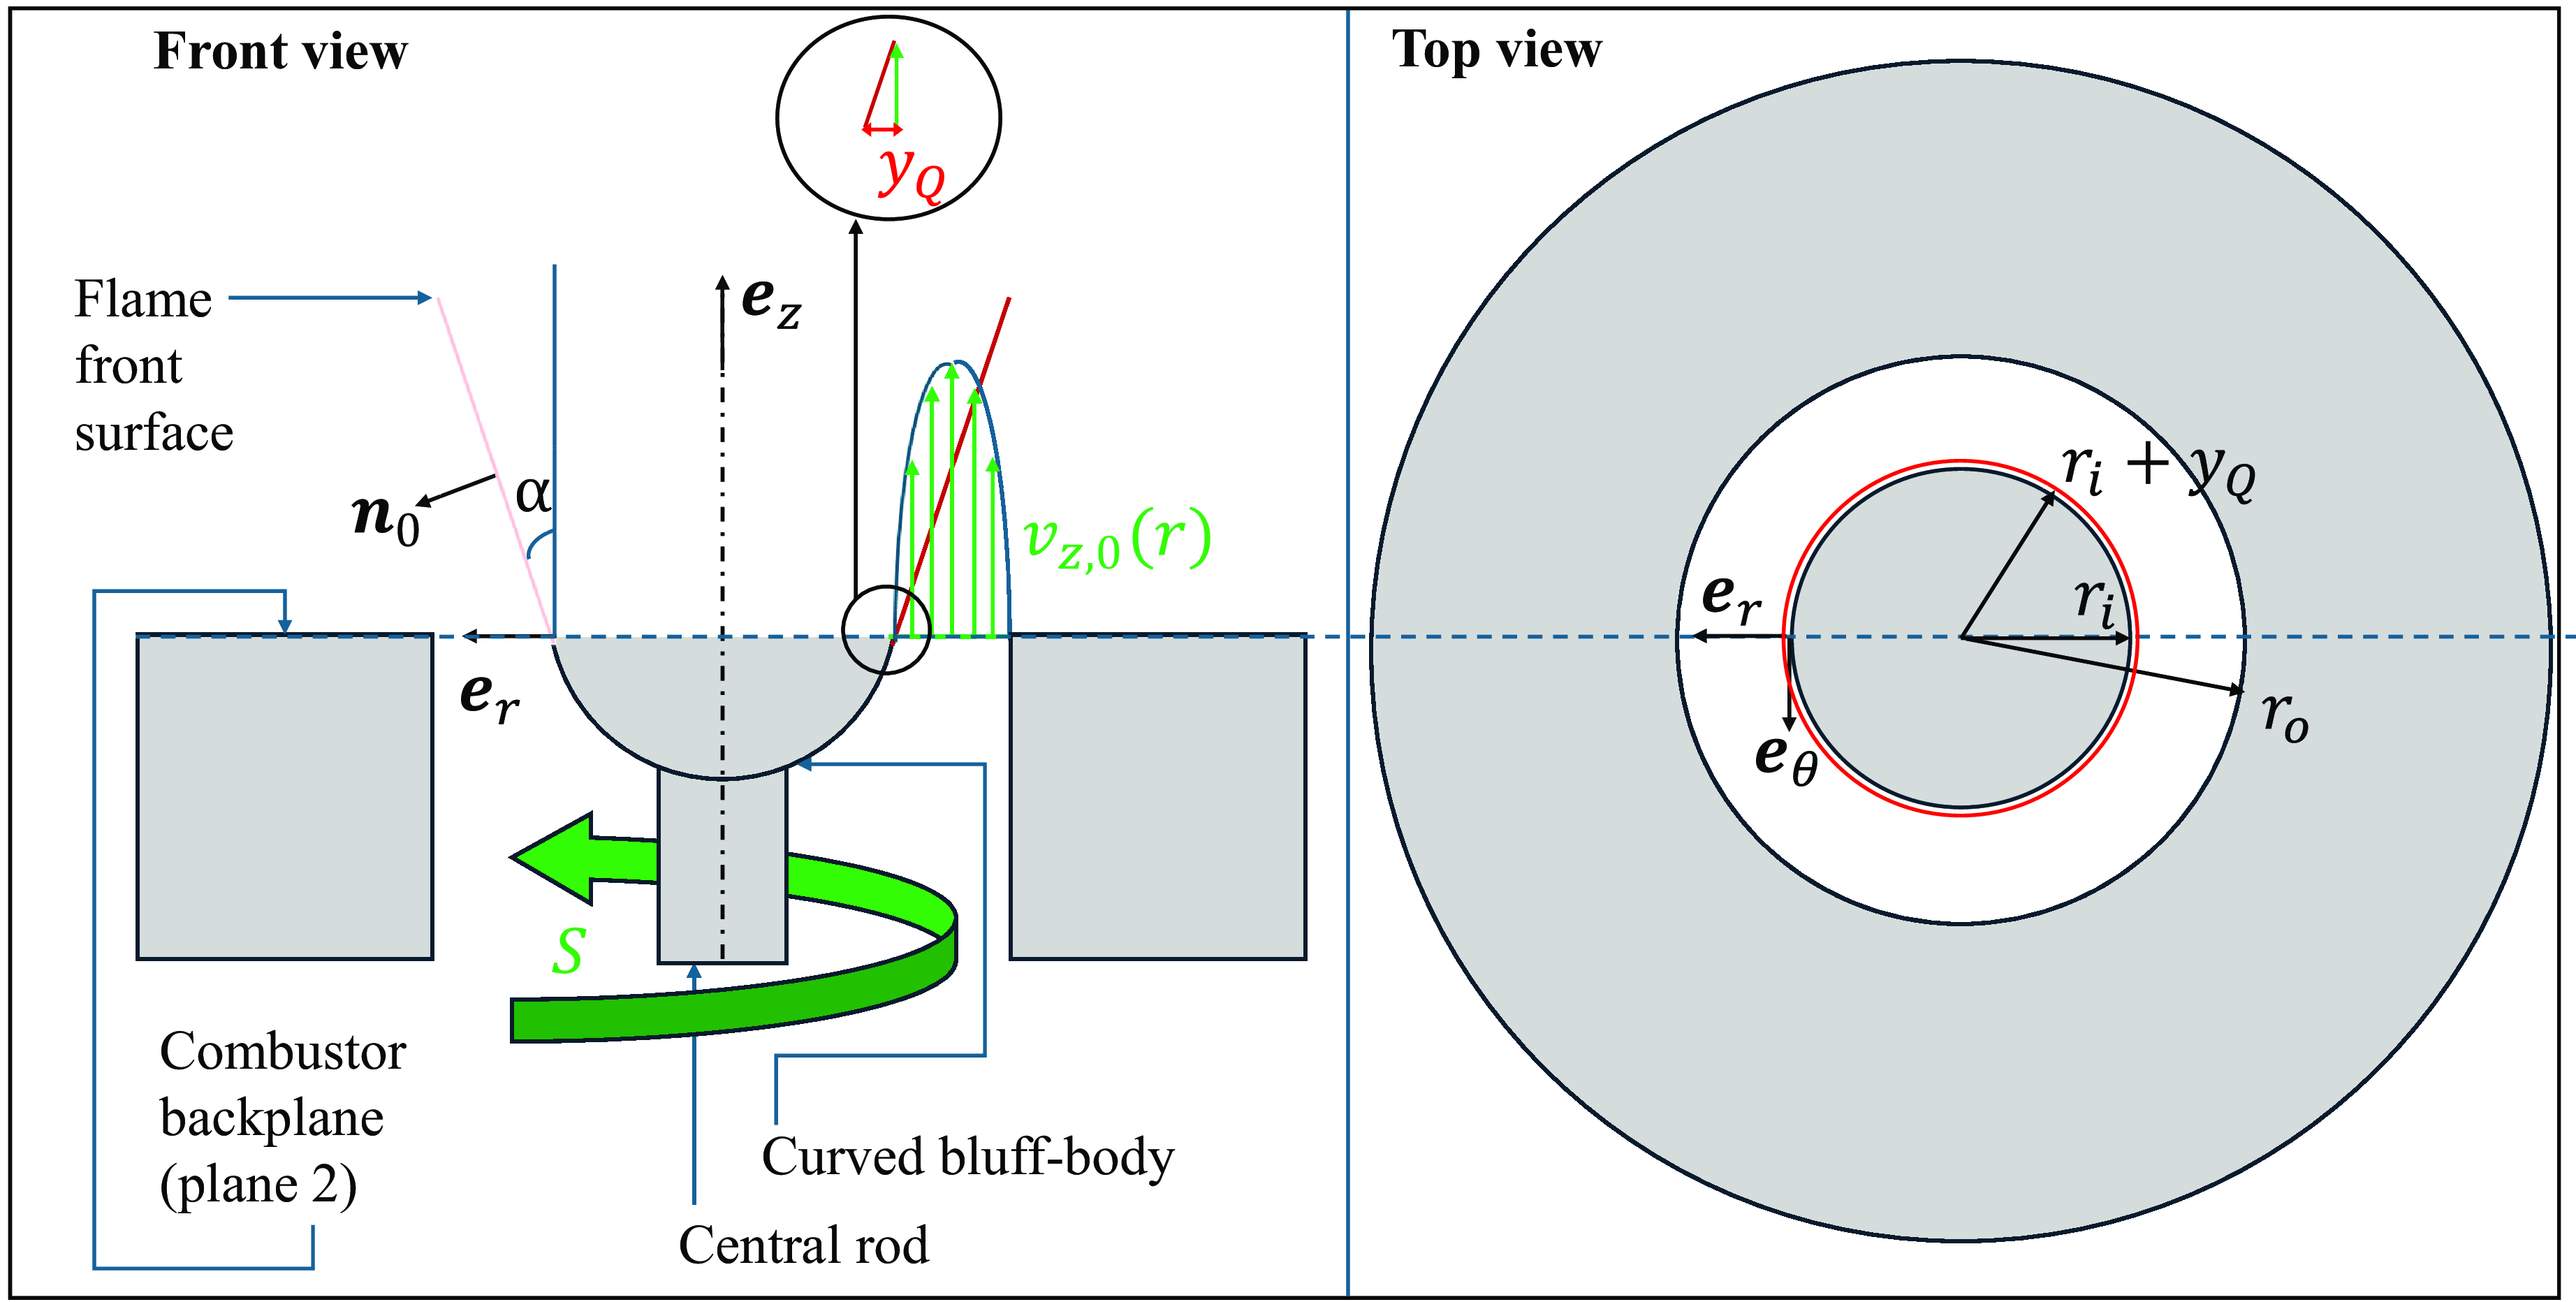
6.0 Comparison between theory versus experimental data: results and regimes
Experimental measurements are reported in Fig. 13 as symbols on a colourmap that represents the value of the criterion ${{{\Delta }}_s}$
defined by Equation (12), with the Conaire et al. chemical kinetic mechanism [Reference Conaire, Curran, Simmie, Pitz and Westbrook63]. The inlet temperature is 295 K and the operating pressure is one atmosphere. A value of zero for
${{{\Delta }}_s}$
defined by Equation (12), with the Conaire et al. chemical kinetic mechanism [Reference Conaire, Curran, Simmie, Pitz and Westbrook63]. The inlet temperature is 295 K and the operating pressure is one atmosphere. A value of zero for ${{{\Delta }}_s}$
indicates an equal balance between squared steady flame front speed and flow velocity terms when the steady flame surface speed
${{{\Delta }}_s}$
indicates an equal balance between squared steady flame front speed and flow velocity terms when the steady flame surface speed ${\mathbf{w}}_0^s$
is zero. A positive value of
${\mathbf{w}}_0^s$
is zero. A positive value of ${{{\Delta }}_s}$
indicates that the flame front surface is propagating downstream, and a negative value indicates it is propagating upstream. This latter case is directly associated with flashback as the criterion is evaluated along the radius at a height located at the tip of the bluff-body. The natural blowout and blowoff data were not characterised in the present study as the minimum equivalence ratio investigated was 0.3, which is above the lean flammability limit. Yet, the proposed criterion is valid, and a particular value of that criterion may exist for blowoff/blowout when reached. This will require an instantaneous quantitative study of the kinematic budget. The superimposed grid (
${{{\Delta }}_s}$
indicates that the flame front surface is propagating downstream, and a negative value indicates it is propagating upstream. This latter case is directly associated with flashback as the criterion is evaluated along the radius at a height located at the tip of the bluff-body. The natural blowout and blowoff data were not characterised in the present study as the minimum equivalence ratio investigated was 0.3, which is above the lean flammability limit. Yet, the proposed criterion is valid, and a particular value of that criterion may exist for blowoff/blowout when reached. This will require an instantaneous quantitative study of the kinematic budget. The superimposed grid ( $x$
and
$x$
and $y$
directions) in Fig. 13 represents the uncertainty range associated with laminar flame speed measurement introduced in previous section. The grey line represents the swirled flame solution line.
$y$
directions) in Fig. 13 represents the uncertainty range associated with laminar flame speed measurement introduced in previous section. The grey line represents the swirled flame solution line.
Premixed swirling flame stabilisation map. The criterion value ${{{\Delta }}_s}$
map is represented as a function of the equivalence ratio
${{{\Delta }}_s}$
map is represented as a function of the equivalence ratio $\phi $
and the inlet bulk mixture axial velocity
$\phi $
and the inlet bulk mixture axial velocity ${U_b}$
. Symbols represent experimental data points. Experimental ignition points (white squares), flashback (red dots) and stabilised flame points (green, cyan dots, blue triangles-down and triangles-up) are superimposed. Red, white and cyan curves correspond to isolines of the criterion
${U_b}$
. Symbols represent experimental data points. Experimental ignition points (white squares), flashback (red dots) and stabilised flame points (green, cyan dots, blue triangles-down and triangles-up) are superimposed. Red, white and cyan curves correspond to isolines of the criterion ${{{\Delta }}_s} = $
0 made with experimental flame speed data (maximum, mean and minimum values of
${{{\Delta }}_s} = $
0 made with experimental flame speed data (maximum, mean and minimum values of $S_L^0$
taken from Han et al.) whereas green and blue curves correspond to chemical kinetic models.
$S_L^0$
taken from Han et al.) whereas green and blue curves correspond to chemical kinetic models.
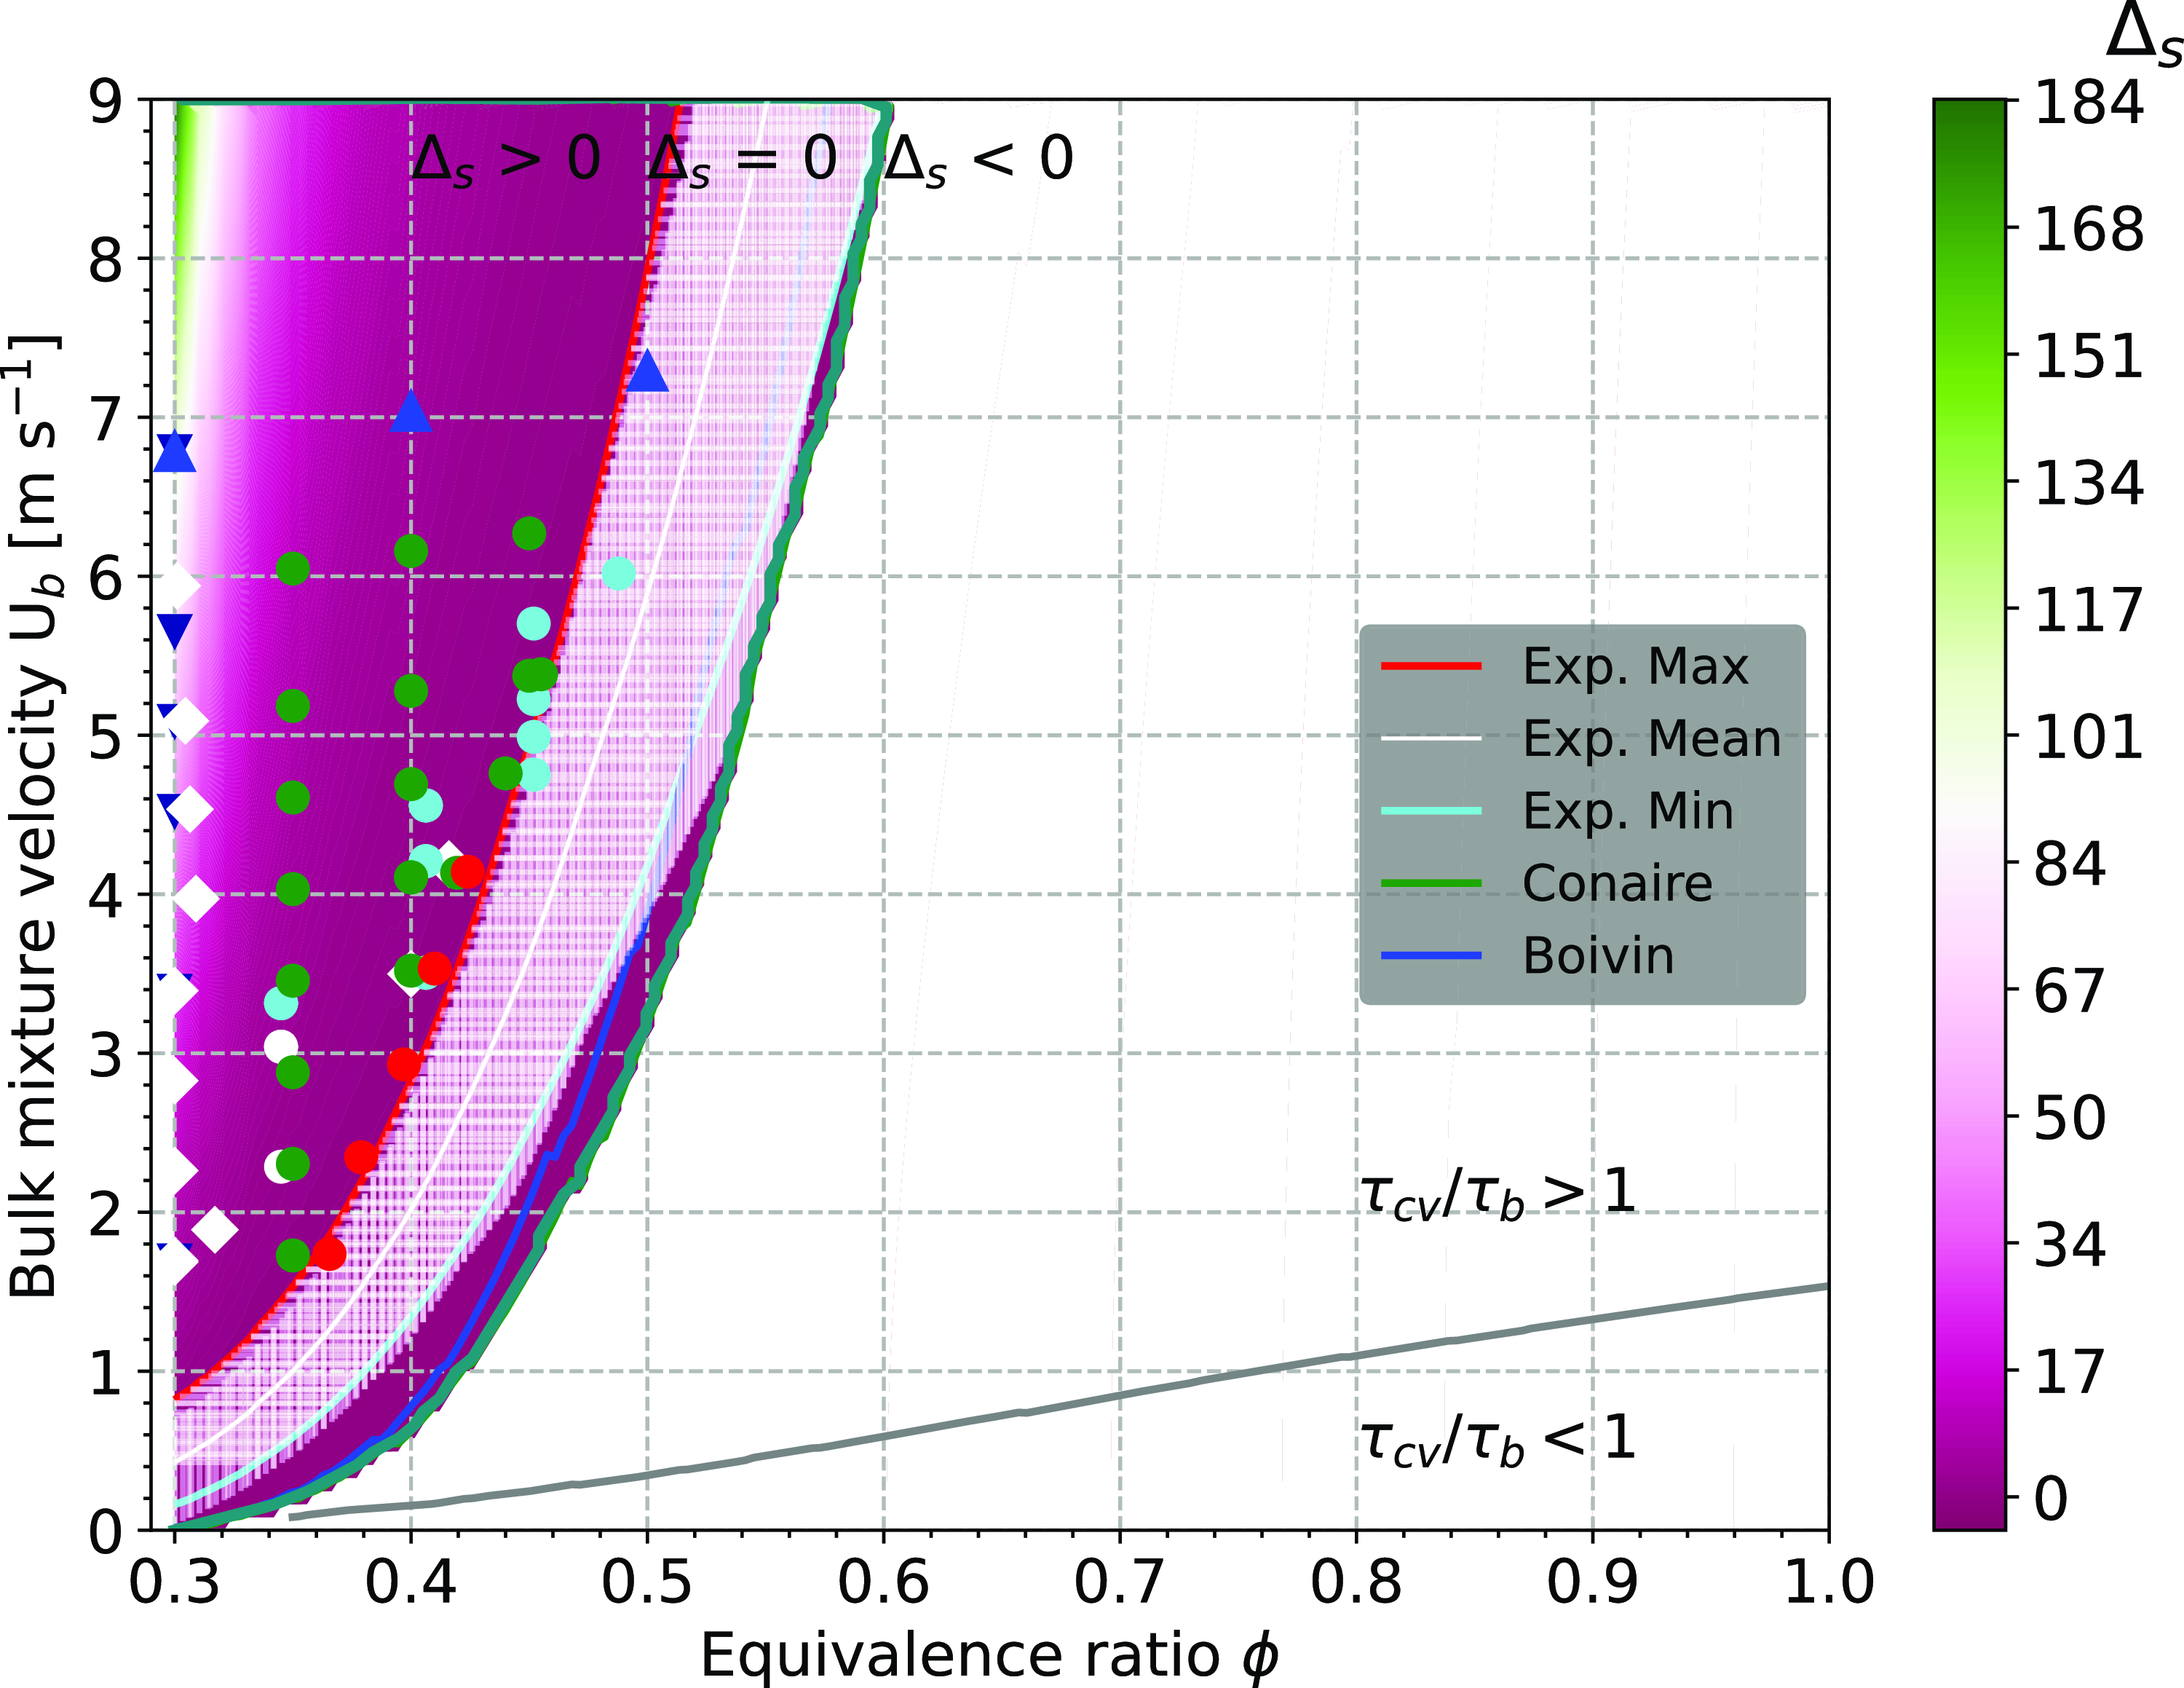
The premixed swirling flame stabilisation map plotted in Fig. 13 enables to distinguish key regimes and their boundaries:
-
1. Flashbacked flame regime as
${{{\Delta }}_s} \lt $
0. -
2. Stabilised flame regime as
${{{\Delta }}_s} \gt $
0. -
3. Stabilisation criterion line
${{{\Delta }}_s} = $
0. -
4. Swirled flame solution line
${\tau _{cv}}/{\tau _b} = $
1.


The swirled flame solution line is defined as the ratio of the characteristic flame convective time ${\tau _{cv}}$
that is equal to
${\tau _{cv}}$
that is equal to $\delta /\left[ {2/3{v_{z,0}}} \right]$
to the flame propagation characteristic time
$\delta /\left[ {2/3{v_{z,0}}} \right]$
to the flame propagation characteristic time ${\tau _b}$
defined with
${\tau _b}$
defined with $\delta /{S_d}$
. This line results from the kinematic flame front condition estimated with its instantaneous budget form. When this ratio is below unity, it is expected that no flame can be sustained on the burner where the flow velocity profile is imposed, unlike when this ratio is above unity. This line is in the region where
$\delta /{S_d}$
. This line results from the kinematic flame front condition estimated with its instantaneous budget form. When this ratio is below unity, it is expected that no flame can be sustained on the burner where the flow velocity profile is imposed, unlike when this ratio is above unity. This line is in the region where ${{{\Delta }}_s} \lt $
0 for the present case. In other words, the flashback region overlaps and encompasses this line.
${{{\Delta }}_s} \lt $
0 for the present case. In other words, the flashback region overlaps and encompasses this line.
It is striking to observe how the stabilisation criterion lines (red, white, cyan) in Fig. 13 delineate the experimental flashback (red dots) and stabilised flame points (green dots and blue triangles) within the uncertainty range defined as the superimposed grid. The criterion lines (red and white) follow the trend of the experimental data and the theoretical values agree within the range of uncertainties defined in the previous section and it is thus considered to be satisfactory. At an equivalence ratio $\phi $
of 0.5 and a bulk flow velocity of 6 m s
$\phi $
of 0.5 and a bulk flow velocity of 6 m s ${^{ - 1}}$
, the range varies between 0.45 and 0.55, which corresponds to
${^{ - 1}}$
, the range varies between 0.45 and 0.55, which corresponds to $ \pm 10{{\% }}$
variation of 0.5. Whereas the theoretical predictions made are based on the steady kinematic condition and the experiments include all unsteady processes at work, the criterion delineates well the stabilised regime.
$ \pm 10{{\% }}$
variation of 0.5. Whereas the theoretical predictions made are based on the steady kinematic condition and the experiments include all unsteady processes at work, the criterion delineates well the stabilised regime.
7.0 Conclusion
This article presents an experiment that demonstrated, experimentally and for the first time, combustion in the fully lean premixed highly swirled turbulent regime for hydrogen-air mixtures. A mechanistic model for flame stabilisation is presented and validated with the experimental data points obtained. The model relies on the steady form of the kinematic balance between the flame and the flow taking into account the three-dimensionality of the swirling flowfield (all velocity components). The role of the quenching distance at the bluff-body tip is folded into the model. This model delineates the region of flashback versus the stabilised flames region. The uncertainty about the unstretched laminar flame displacement speed dominates the total theoretical model uncertainty in this study. The perspectives of this research work include assessing the scalability of highly swirled lean fully premixed H ${_2}$
/Air flames to industrial configurations and operating conditions along with detailed quantitative analysis of the instantaneous kinematic budget. The associated challenges for this scaling can be associated with three groups of parameters: (1) the flow and flame conditions (inlet temperature, density and operating pressure) modified between atmospheric laboratory scale and engine relevant operation impacting the quenching distance
${_2}$
/Air flames to industrial configurations and operating conditions along with detailed quantitative analysis of the instantaneous kinematic budget. The associated challenges for this scaling can be associated with three groups of parameters: (1) the flow and flame conditions (inlet temperature, density and operating pressure) modified between atmospheric laboratory scale and engine relevant operation impacting the quenching distance ${y_Q}$
significantly; (2) the flame speed
${y_Q}$
significantly; (2) the flame speed ${S_L}$
value and the axial flow speed profile along the radius
${S_L}$
value and the axial flow speed profile along the radius ${v_{z,0}}\left( r \right)$
impacting the value of
${v_{z,0}}\left( r \right)$
impacting the value of ${{{\Delta }}_s}$
; and (3) the mode of stabilisation that is presently supported by steady flow-flame kinematic budget but can be driven by the unsteady budget too. Parametric studies at preheated and high-pressure plus high-temperature conditions could be conducted in future work. The experiment described, the measurements conducted, and the theoretical model developed in this article can contribute to achieve future zero-carbon and low nitrogen oxides emission aviation based on hydrogen combustion.
${{{\Delta }}_s}$
; and (3) the mode of stabilisation that is presently supported by steady flow-flame kinematic budget but can be driven by the unsteady budget too. Parametric studies at preheated and high-pressure plus high-temperature conditions could be conducted in future work. The experiment described, the measurements conducted, and the theoretical model developed in this article can contribute to achieve future zero-carbon and low nitrogen oxides emission aviation based on hydrogen combustion.
Competing interests
The authors declare none.
Acknowledgments
Technical support for the project on design and operation by Sagar Godse, Jonathan Kolwyck, Joel Davenport and Larry Alexander is sincerely acknowledged. The authors would also like to thank Sunil Patil and Carlo Arguinzoni for the computational data.
Appendix
Appendix A. Velocity profile and CFD validation
The axial velocity ${v_{z,0}}\left( r \right)$
radial profile model derivation utilised for the criterion Equation (12) is outlined in this section. The derivation begins with the axial momentum governing equation expressed in cylindrical coordinates:
${v_{z,0}}\left( r \right)$
radial profile model derivation utilised for the criterion Equation (12) is outlined in this section. The derivation begins with the axial momentum governing equation expressed in cylindrical coordinates:
 \begin{align}\frac{{\partial {v_z}}}{{\partial t}} + {v_r}\frac{{\partial {v_z}}}{{\partial r}} + \frac{{{v_\theta }}}{r}\frac{{\partial {v_z}}}{{\partial \theta }} + {v_z}\frac{{\partial {v_z}}}{{\partial z}} = - \frac{1}{\rho }\frac{{\partial p}}{{\partial z}} + \nu \left( {\frac{1}{r}\frac{\partial }{{\partial r}}\left( {r\frac{{\partial {v_z}}}{{\partial r}}} \right) + \frac{1}{{{r^2}}}\frac{{{\partial ^2}{v_z}}}{{\partial {z^2}}}} \right) - g\end{align}
Comparison between CFD data and modeled parabolic profile. (a) Isometric view of the computational domain with location of velocity profile extraction (vertical black line). (b) Cutplane of the time-averaged axial velocity field for ${U_b}$
of 12 m s
${U_b}$
of 12 m s ${^{ - 1}}$
. (c) Comparison of non-dimensional axial velocity profiles taken from computational data and parabolic model used in the present study.
${^{ - 1}}$
. (c) Comparison of non-dimensional axial velocity profiles taken from computational data and parabolic model used in the present study.
Next, the flow inside the injector, from the outlet of the swirler to the bluff-body tip, is assumed steady and azimuthaly symmetric. Two additional assumptions are made: the axial flow velocity is dependent on the radius only and the radial velocity is of lower amplitude compared to the axial flow velocity and thus it is neglected. This yields to:
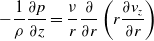 \begin{align} - \frac{1}{\rho }\frac{{\partial p}}{{\partial z}} = \frac{\nu }{r}\frac{\partial }{{\partial r}}\left( {r\frac{{\partial {v_z}}}{{\partial r}}} \right)\end{align}
Which is expressed as follows by expanding the right-hand side term:
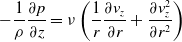 \begin{align} - \frac{1}{\rho }\frac{{\partial p}}{{\partial z}} = \nu \left( {\frac{1}{r}\frac{{\partial {v_z}}}{{\partial r}} + \frac{{\partial v_z^2}}{{\partial {r^2}}}} \right)\end{align}
One observes that Equation (A3) is almost identical to the equation used for the classical derivation of the parabolic velocity profile in steady laminar pipe. Based on this observation, the solution proposed for the steady axial velocity ${v_{z,0}}\left( r \right)$
is:
${v_{z,0}}\left( r \right)$
is:
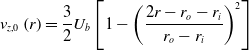 \begin{align}{v_{z,0}}\left( r \right) = \frac{3}{2}{U_b}\left[1 - \left( \frac{{2r - {r_o} - {r_i}}}{{{r_o} - {r_i}}}\right)^2 \right]\end{align}
The axial velocity radial profile Equation (A4) is adopted for the present work.
A comparison of the resulting profile with time-averaged non-dimensional numerical simulations data is documented in Fig. A1. Swirling flow axial velocity time-averaged profiles experimentally measured in literature indicate a parabolic dependency as well as a function of the radius [Reference Lobasov, Alekseenko, Markovich and Dulin78–Reference Palies, Durox, Schuller and Candel80]. Acknowledging the differences between the steady and the time-averaged fields, such observations support the use of a parabolic profile here.
Appendix B. Unstretched laminar flame speed data
The unstretched flame speeds calculations required to evaluate the stretched laminar flame speeds in Equation (12) are now documented. The quantity $S_L^0$
is first computed based on literature chemical kinetic data by Boivin et al. and Conaire et al. [Reference Conaire, Curran, Simmie, Pitz and Westbrook63, Reference Boivin, Sánchez and Williams81, Reference Boivin82] as well as experimental data from Han et al. [Reference Han, Dai, Gou and Chen83]. Table A1 lists the laminar flame displacement speeds
$S_L^0$
is first computed based on literature chemical kinetic data by Boivin et al. and Conaire et al. [Reference Conaire, Curran, Simmie, Pitz and Westbrook63, Reference Boivin, Sánchez and Williams81, Reference Boivin82] as well as experimental data from Han et al. [Reference Han, Dai, Gou and Chen83]. Table A1 lists the laminar flame displacement speeds $S_L^0$
computed with these two chemical kinetic mechanisms and those measured experimentally [Reference Han, Dai, Gou and Chen83].
$S_L^0$
computed with these two chemical kinetic mechanisms and those measured experimentally [Reference Han, Dai, Gou and Chen83].
Flame speed data. Experimental and chemical kinetic unstretched laminar flame displacement speeds data utilised in this study are listed. Data reported are function of the equivalence ratio $\phi $
and are expressed in m s
$\phi $
and are expressed in m s ${^{ - 1}}$
.
${^{ - 1}}$
.
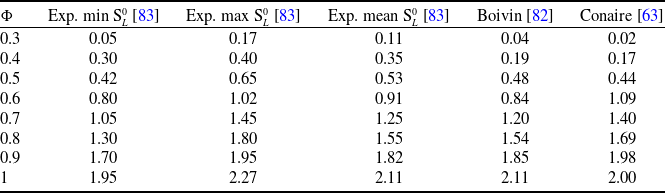
The computed flame speed data are extracted from one-dimensional hydrogen-air premixed flame simulations conducted with the open-source chemical kinetic software cantera [Reference Goodwin, Speth, Moffat and Weber60] with multicomponent transport, Soret and Dufour effects taken into account. The experimental data minimum and maximum values (corresponding to columns 2 and 3 of Table A1) for each equivalence ratio are used to determine uncertainty ranges.


 Open access