


Motivation and Theory
In 2022, the US economy experienced significant inflation for the first time in forty years. The inflation rate started to rise in 2021 and peaked at 9.1 per cent in June 2022, far exceeding the Federal Reserve’s target of 2 per cent. Inflation topped the list of voters’ concerns in a Pew Research Center poll conducted in April/May 2022: 70 per cent considered it a very big problem.Footnote 1 Yet, although President Biden’s approval rating hovered at around 40 per cent in the run-up to the mid-term elections,Footnote 2 Republican candidates underperformed relative to historical averages, surprising many.
Inflation, defined as a broad increase in the prices of goods and services, can spark political unrest by eroding the purchasing power of consumers and businesses. When faced with rising production costs, businesses often pass these increases onto consumers. A rise in the cost of everyday necessities is particularly significant, as it diminishes individuals’ ability to buy the same amount with their money, which can lead to increased difficulty in household decision making (Binetti, Nuzzi and Stantcheva Reference Binetti, Nuzzi and Stantcheva2024), potentially resulting in significant voter backlash (Hibbs Reference Hibbs1979). Additionally, policy measures aimed at controlling inflation, such as higher interest rates or fiscal austerity, can potentially increase unemployment (Hibbs Reference Hibbs1977) and prompt further backlash (Baccini and Sattler Reference Baccini and Sattlerforthcoming). Polling during previous periods of high inflation indicates that rising prices can significantly damage the popularity of political incumbents (Fischer and Huizinga Reference Fischer and Huizinga1982; Hibbs Reference Hibbs1979; MacKuen Reference MacKuen1983).
This paper examines how inflation influenced voting in the 2022 mid-terms. We developed an original, pre-registered survey and administered it prior to the 2022 mid-term elections to examine if higher personal inflation burdens were associated with voting intentions. In an experiment embedded in the survey, we identify how partisan messaging about the sources of inflation influenced support for Democrats and Republicans. Our analysis draws insights from the economic voting literature, which suggests that inflation may jeopardize incumbents’ electoral prospects as voters hold them accountable for poor economic performance (Lewis-Beck and Stegmaier Reference Lewis-Beck and Stegmaier2000). High inflation in previous periods led to support for conservatives and dramatic shifts in economic policy (Frieden Reference Frieden2007, 366–369). It is therefore plausible that the high inflation period could have weakened support for the Democrats in the 2022 US congressional elections, considering the Democrats’ control over the presidency, the House, and the Senate during this time. This is the first hypothesis that we explore below.
However, inflation’s impact on voting might not solely operate through objective economic conditions. One, the most important issues in polling do not always directly influence vote choice (Sides, Tesler and Vavreck Reference Sides, Tesler and Vavreck2019; Mutz Reference Mutz2022; Wlezien Reference Wlezien2005). Two, numerous studies have indicated that economic grievances do not tend to factor heavily in voting decisions (Kinder and Kiewiet Reference Kinder and Kiewiet1979; Kiewiet Reference Kiewiet1983; Anderson Reference Anderson2007; Feigenbaum and Hall Reference Feigenbaum and Hall2015 a; Mutz Reference Mutz2018). Three, some voters may absolve elected leaders altogether, instead attributing inflation to the monetary policy decisions of unelected central bankers (Bodea and Hicks Reference Bodea and Hicks2015 a, Reference Bodea and Raymond Hicks2015 b; Bodea and Higashijima Reference Bodea and Higashijima2017).
It is also possible that candidates can shape voters’ understanding of the causes of economic shocks. Politicians may offer partisan attribution narratives to deflect blame from their party and cast it on their opponents. This paper examines whether voters’ responses to inflation depend on the messaging they receive about its causes, building on literature demonstrating politicians’ ability to frame economic phenomena to their advantage (Albertson and Gadarian Reference Albertson and Gadarian2015; Ballard-Rosa, Goldstein and Rudra Reference Ballard-Rosa, Goldstein and Rudra2024; Guisinger Reference Guisinger2017; De Vries, Hobolt and Walter Reference De Vries, Hobolt and Walter2021; Naoi Reference Naoi2020; Tobin, Schneider and Leblang Reference Tobin, Schneider and Leblang2022). For instance, in her foundational study on American public opinion on international trade, Guisinger (Reference Guisinger2017) shows that individuals’ views are shaped by messaging from politicians rather than a deep understanding of the specific details of trade policy or its distributional consequences. This literature highlights the power of political messaging and communication strategies in shaping public opinion on complex policy issues and economic conditions.
In the run-up to the 2022 mid-term elections, political elites sought to link responsibility for rising inflation to traditional ideological divisions over the size of government and the influence of business, blaming either government spending or corporate greed.Footnote 3 Although the increase in US government spending began during the Trump Administration, Republicans blamed President Biden and congressional Democrats’ spending programs for inflation. Our second hypothesis is that attributing rising inflation to government spending will weaken support for Democratic candidates.
Conversely, Democrats attributed rising inflation to corporate greed rather than government spending.Footnote 4 They argued that companies’ price hikes, which some Democrats labeled greedflation, were responsible for inflation. Democrats, in turn, blamed these corporate price hikes on the Trump Administration’s anti-regulatory approach and, more broadly, on Republican support of corporate interests. As a third hypothesis, we propose that attributing inflation to corporate profits will weaken support for Republican candidates.
This paper evaluates how inflation and competing attribution messages shaped voting behaviour in the 2022 mid-terms. Our survey reveals that higher reported inflation burdens correlate with less support for Democratic candidates. Additionally, our survey experiment randomly assigned treatments emphasizing either government spending or corporate greed as inflation causes, assessing their impact on voter preferences. Our experimental findings reveal that partisan messaging about inflation affects perceptions and vote intentions. Government spending attributions weakened support for Democrats, while corporate greed attributions undermined confidence in Republicans’ ability to tackle inflation. These offsetting effects may help explain why the 2022 mid-terms did not result in a significant Republican advantage despite high inflation.
Our study contributes to the existing literature on the influence of economic conditions on voting behaviour (for example, Fair Reference Fair1978; Abramowitz Reference Abramowitz1985; Kiewiet Reference Kiewiet1983; Lewis-Beck and Stegmaier Reference Lewis-Beck and Stegmaier2000; Powell and Whitten Reference Powell and Whitten1993; Feigenbaum and Hall Reference Feigenbaum and Hall2015 b; Mutz Reference Mutz2018; Owen Reference Owen2019; Jardina Reference Jardina2019; Rickard Reference Rickard2022; Baccini and Weymouth Reference Baccini and Weymouth2021; Broz, Frieden and Weymouth Reference Broz, Frieden and Weymouth2021; Wu and Huber Reference Wu and Huber2021). While most recent economic voting research has focused on international economic shocks (Ballard-Rosa, Jensen and Scheve Reference Ballard-Rosa, Jensen and Scheve2022; Jensen, Quinn and Weymouth Reference Jensen, Quinn and Weymouth2017; Rickard Reference Rickard2022), our paper examines the role of inflation, a topic receiving less attention due to a multi-decade period of low rates in major economies. Earlier work explored the links between inflation, public opinion, and voting (Hibbs Reference Hibbs1979; Erikson, MacKuen and Stimson Reference Erikson, MacKuen and Stimson2002; MacKuen Reference MacKuen1983), but empirical analyses yielded mixed and inconclusive results (for example, Kramer Reference Kramer1971; Powell and Whitten Reference Powell and Whitten1993).
Our paper contributes two significant insights to the study of the politics of inflation. First, we find a detrimental impact of inflation on electoral support for Democrats. Second, our analysis shows that attributing inflation to either government spending or corporate greed influences voter attitudes in contrasting ways. Democrats are vulnerable to criticisms that their fiscal programs contribute to inflation, as anticipated by Hibbs (Reference Hibbs1977). Conversely, Republicans’ close ties to business interests can become a liability if voters attribute rising prices to corporate actions. Our approach illuminates the impact of inflation on political behaviour through the channel of partisan attribution. Consequently, it extends the economic voting literature by emphasizing the significant role of subjective political framing in shaping electoral outcomes.
Hypotheses
We examine three hypotheses regarding the possible effects of inflation on voting.
Hypothesis 1 Higher perceived inflation in an individual’s consumption basket will be associated with weaker support for Democratic candidates.
Hypothesis 2 Attributing inflation to government spending will weaken support for Democratic candidates.
Hypothesis 3 Attributing inflation to increasing corporate profits will weaken support for Republican candidates.
Original Survey on Inflation and Voting
In late October 2022, we conducted an original survey of approximately 2,000 US adults on Forthright. The platform recruits respondents representative of the population on a variety of demographic characteristics, including gender, age, education, party identification, and household income.Footnote 5 To summarize our approach, the survey first asked respondents about their perceptions of inflation. Respondents were then randomly assigned to a treatment group attributing inflation to either government spending or corporate greed or to a control group. Following the experiment, we asked questions regarding the respondents’ voting intentions and approval of Democrats and Republicans in Congress.
To capture the inflation burden for respondents, we use both objective and subjective measures. This approach helps us understand how different aspects of inflation impact voting behaviour while addressing potential endogeneity concerns, as objective measures are potentially less likely to be endogenous to vote choice. We include two objective measures: dummy variables coded as ‘1’ for respondents who commute to work to assess the burden of higher gas prices and for those who rent, given the notably high rent inflation in 2022. Both gas prices and shelter costs significantly contributed to the overall rise in inflation in the USA.Footnote
6
We also include two subjective indices: Inflation (personal), which captures personal experiences of inflation,Footnote
7
and Inflation (community), which captures respondents’ perceptions of inflation’s impact on their community and the country.Footnote
8
The correlation between these objective measures (Rent and Commuting) and the subjective measures (Inflation [personal] and Inflation [community]) is quite low (that is, $\rho = 0.1$
), indicating that they capture different aspects of the inflation burden.
$\rho = 0.1$
), indicating that they capture different aspects of the inflation burden.
Before introducing our model and the estimation results, we recognize some limitations of our approach. Most importantly, inflation cannot be randomly assigned, so measuring the causal effect of inflation on voting is impossible. In the individual surveys, self-reported inflation burdens may be contaminated by other correlates of vote choice, despite our efforts to control for underlying variation (Wlezien, Franklin and Twiggs Reference Wlezien, Franklin and Twiggs1997). Specifically, there may be concerns that perceptions of inflation at both the individual and community levels are endogenous to partisanship; for instance, Republicans may report higher inflation than Democrats when the Democrats are in power. Since partisanship is central to voting behaviour, this potential endogeneity poses some challenges to correctly identifying the effect of inflation using observational data. Acknowledging these shortcomings, we complement the observational analysis with an original survey experiment, which allows us to measure the causal effect of different attribution messaging on respondents’ vote intentions and their approval of Democrats and Republicans in Congress.
Our main model specification for the correlational analysis is the following:
 $${Y_i} = \alpha + {\gamma _c} + {\beta _1}Inflatio{n_i} + {\beta _2}{X_i} + {\varepsilon _i},$$
where ${Y_i}$
captures our dependent variable at the individual level i: the respondent’s stated intention to vote for a Democratic candidate in 2022. Inflation captures the inflation burden for respondents based on the following factors: Rent, Commuting, Inflation (personal), and Inflation (community). Our richest model specification includes a battery of individual-level controls, which are stored in the matrix
${Y_i}$
captures our dependent variable at the individual level i: the respondent’s stated intention to vote for a Democratic candidate in 2022. Inflation captures the inflation burden for respondents based on the following factors: Rent, Commuting, Inflation (personal), and Inflation (community). Our richest model specification includes a battery of individual-level controls, which are stored in the matrix ${X_i}$
: education, employment, gender, income, party identification, personal financial situation, assessment of the national unemployment rate, position on abortion, and approval of President Biden.
${X_i}$
: education, employment, gender, income, party identification, personal financial situation, assessment of the national unemployment rate, position on abortion, and approval of President Biden. ${\gamma _c}$
are county fixed effects,
${\gamma _c}$
are county fixed effects, $\alpha $
is the constant, and
$\alpha $
is the constant, and $\varepsilon $
are the residuals.Footnote
9
$\varepsilon $
are the residuals.Footnote
9
Figure 1 displays the results of the analysis at the individual level when the outcome variable measures the probability of voting for the Democrat. The coefficients of our measures of inflation burden (that is, Inflation [personal] and Inflation [community]) are always negative and significant, which indicates that respondents who feel the burden of inflation personally and observe it in their local economy are less likely to vote for the Democrats than those who do not. We find no evidence that renting and commuting reduce the probability of voting for a Democratic candidate.Footnote 10
Probability of Voting for the House Democratic Candidate (voting intention).
Note: Sample: 1,712 respondents. Outcome: If an election for the US Congress were being held today, who would you vote for in the district where you live? (1 = Democratic candidate, 0 = Republicans). Table B.1 (Model 2) reports the full results, including controls: 95 per cent C.I.

Table B.3 shows the results of the model in equation 1 by party identification. We estimate the model separately on the subsamples of Republicans, Democrats, and Independents. The standard errors in each subsample are larger due to the lower number of observations. That said, it seems that the results at the individual level are driven by Independents, especially for Inflation (personal).
Overall, our individual-level analysis suggests that inflation has a negative (though generally weak) effect on the probability of voting for a Democrat. In sum, we find evidence in support of H1.Footnote 11
Experimental Results: Inflation Attribution Channels
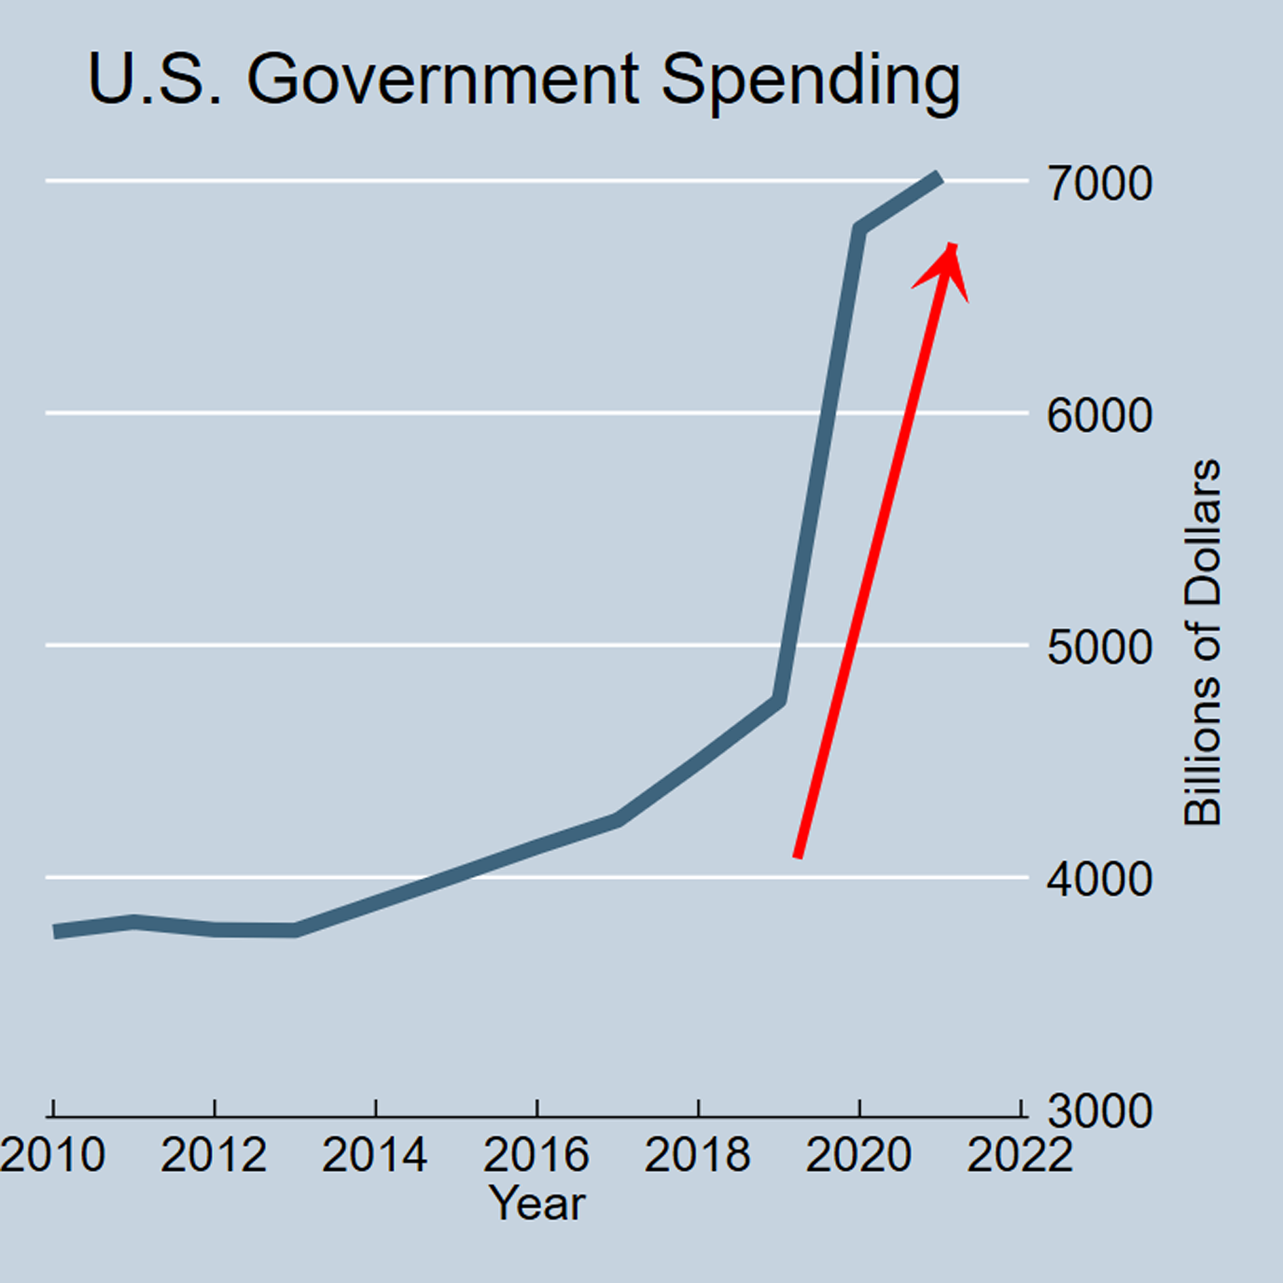
We embedded an experiment into our survey to estimate whether different blame attributions for rising inflation have a causal effect on voting behaviour and political attitudes. We first asked respondents several questions to assess the extent to which they felt personally affected by inflation, as noted above. We developed treatments to reflect the two main inflation attribution channels espoused by Republicans and Democrats, respectively, during the campaigns of 2022: one explaining that government spending caused inflation; the other attributing inflation to corporate greed (See Figures 2 and 3).Footnote 12 We then randomly assigned respondents into either the control group or one of two treatment groups.Footnote 13 We block-randomized the treatment assignment based on whether the respondent identified as a Republican, Democrat, or Independent.Footnote 14 The control group received no additional information.
Treatment 1: Government Spending.
Note: Respondents in the government spending treatment group were presented with the following statement and graph, including their party identification as provided in advance by Forthright: Government spending has skyrocketed. Many [OWN PARTY] agree that excessive government spending has caused inflation by increasing the national debt.
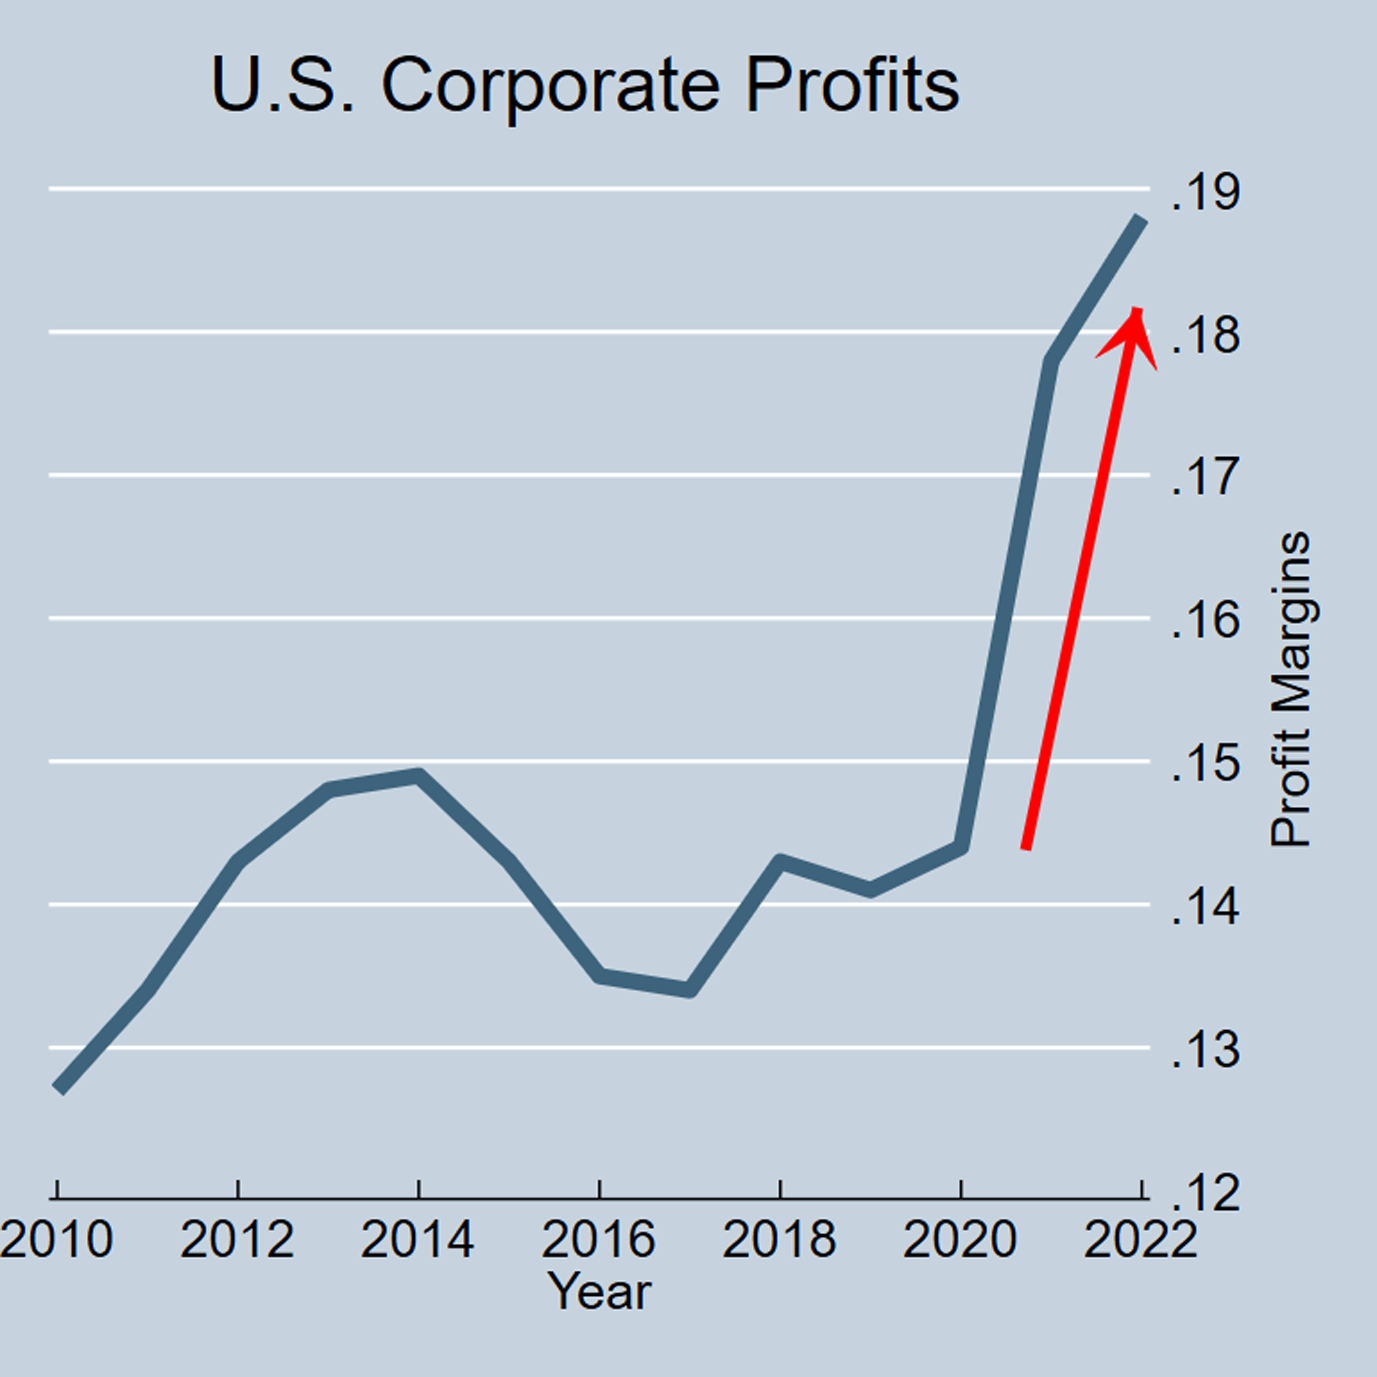
Treatment 2: Corporate Greed.
Note: Respondents in the corporate greed treatment group were presented with the following statement and graph, including their party identification as provided in advance by Forthright: Corporate profits have skyrocketed because corporations have raised prices. Many [OWN PARTY] agree that excessive corporate profits caused inflation.
Our survey contained four main outcome questions. One, If an election for US Congress were being held today, who would you vote for in the district where you live? (which we label Pr(Dem=1)).Footnote 15 Two, Do you approve or disapprove of the way Democrats in Congress are handling inflation? (Approve Dem). Three, Do you approve or disapprove of the way Republicans in Congress are handling inflation? (Approve Rep).Footnote 16 Four, Do you agree or disagree with the following statement: Republicans would be better at handling inflation than Democrats (Rep better).Footnote 17
Our model specification is the following:
 $${Y_i} = {\alpha _0} + {\beta _1}SPENDIN{G_i} + {\beta _2}GREE{D_i} + {\varepsilon _i},$$
where the dependent variable ${Y_i}$
is one of the four outcome questions that we observe for each respondent i.
${Y_i}$
is one of the four outcome questions that we observe for each respondent i. $SPENDIN{G_i}$
and
$SPENDIN{G_i}$
and $GREE{D_i}$
are the randomized treatments, which vary across respondents.
$GREE{D_i}$
are the randomized treatments, which vary across respondents. ${\beta _1}$
and
${\beta _1}$
and ${\beta _2}$
are the key coefficients, which we expect to have different effects on the outcomes. We expect that
${\beta _2}$
are the key coefficients, which we expect to have different effects on the outcomes. We expect that ${\beta _1}$
and
${\beta _1}$
and ${\beta _2}$
will be statistically significantly different from each other because the two narratives of inflation should pull respondents’ attitudes in opposing directions. The baseline category is the control group, which received no explanation on the source of inflation.
${\beta _2}$
will be statistically significantly different from each other because the two narratives of inflation should pull respondents’ attitudes in opposing directions. The baseline category is the control group, which received no explanation on the source of inflation. ${\alpha _0}$
is the constant, whereas
${\alpha _0}$
is the constant, whereas ${\varepsilon _i}$
are the residuals. We estimate OLS regressions with robust standard errors.
${\varepsilon _i}$
are the residuals. We estimate OLS regressions with robust standard errors.
The results appear in Table 1. There are three main takeaways.Footnote 18
Experimental Analysis
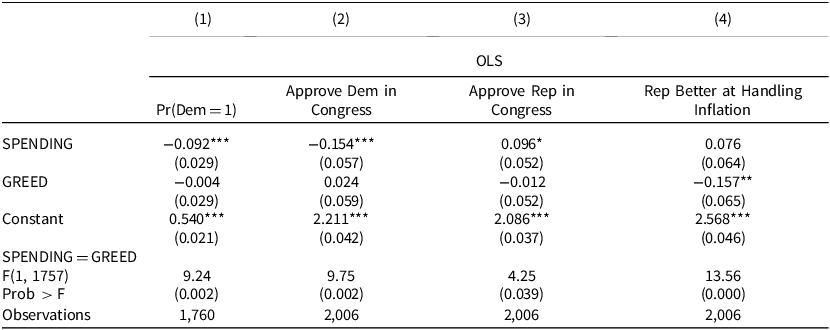
Robust standard errors in parentheses *** p<0.01, ** p<0.05, * p<0.1
Note: OLS regression with robust standard errors. The dependent variables capture voting behaviour, approval for Democrats and Republicans in Congress, and assessment of how parties handle inflation. SPENDING and GREED are the two treatments. Differences between the coefficients of the two treatments are assessed using the Wald test.
First, the coefficients of SPENDING and GREED are always significantly different from one another, according to the Wald test. This implies that the GREED narrative helped to offset the negative effects of inflation on support for Democratic candidates, which likely would have been more pronounced if voters had been exposed solely to the narrative blaming inflation on government spending.
Second, the SPENDING treatment has a negative effect on support for Democrats, in line with H2. It reduces the intention to vote for the Democratic candidate in 2022 and the approval of Democrats in Congress while increasing the approval of Republicans in Congress. In Model 4, the SPENDING treatment has no significant effect on voters’ assessments that Republicans would be better at handling inflation than Democrats. We note that in our sample, respondents generally believe that Republicans are better at handling inflation than Democrats, as evidenced by the positive coefficient of the constant term.
Third, our analysis indicates that the corporate greed narrative weakened the belief that Republicans would handle inflation better than Democrats, as shown in Model 4. In contrast, Model 1 shows that the GREED coefficient is essentially zero, indicating no significant impact on the intention to vote for a Democratic candidate. This suggests that while the GREED narrative affects perceptions of party competence in handling inflation, it does not directly influence voting intentions. Notably, however, 54 per cent of our sample intended to vote for a Democratic candidate (as indicated by the constant term), which is higher than the actual share in the 2022 elections (47 per cent). This higher baseline support for Democrats may have contributed to a ceiling effect, limiting the potential to further increase support for Democrats following the experimental manipulation. In sum, the support for H3 is limited.
Table C.1 in Appendix C shows the results by party identification. A caveat is that each subsample has a relatively low number of observations, raising concerns about limited statistical power, given that we have two treatments and one control group in each subsample. That said, our results seem to indicate that Independents drive the negative effect of SPENDING on the probability of voting for Democratic candidates and for the approval of the Democratic Party in Congress. The negative effect of GREED on the belief that Republicans would be better at handling inflation is driven by the Republican subsample, which is a striking result, given the level of polarization of American politics.
Taken together, our observational and experimental evidence indicates that inflation weakened electoral support for Democratic candidates in the 2022 congressional elections. The government spending attribution message weakened support for Democrats. However, while the corporate greed narrative did not significantly change voting intentions, it did undermine the belief that Republicans would handle inflation better than Democrats. This suggests that attributing inflation to corporate price hikes weakened the Republicans’ perceived advantage on the inflation issue, even though it may not have significantly impacted overall voting behaviour. More broadly, our findings indicate that politicians have considerable leeway to shape perceptions of complex issues, such as inflation, to their advantage.
Conclusion
This paper examines the impact of inflation and competing attribution messages on voting behaviour in the 2022 US mid-term election. Results from a pre-registered survey experiment revealed that information attributing inflation to government spending weakened support for Democrats, while attributions of corporate greed weakened some Republican advantages on the issue of inflation. The opposing effects may offer insight into why the 2022 mid-terms did not result in significant gains for Republicans, despite high inflation.
The analysis advances our understanding of the effects of economic shocks on political behaviour. Complex phenomena like inflation are rightfully attributable to multiple causes – economists have not reached a consensus on the primary sources of the recent bout of inflation. The ambiguity around the sources of shocks provides an opening for political messaging to influence mass public perceptions about economic conditions. This insight helps explain the conflicting findings in the economic voting literature: voting responses to economic shocks depend on the policymakers’ ability to shape perceptions about who is to blame.
Our study suggests new directions for research on economic voting. One path is to further examine the effects of monetary policy on voting. A common response to inflation is monetary policy tightening, which can lead to job losses and slower economic growth. The inflation-employment trade-off is likely to reemerge as a core political economy issue, one that will constrain policymaking and one that political parties will seek to exploit to their electoral advantage in the USA and other countries. Our key insight is that political parties have considerable leeway to shape perceptions of complex economic phenomena such as inflation to their advantage. Understanding how parties’ messaging strategies about future economic shocks affect voting behaviour will be of utmost importance.
Supplementary Material
For supplementary material accompanying this paper visit https://doi.org/10.1017/S0007123424000930
Data Availability Statement
Replication data for this paper can be found at https://doi.org/10.7910/DVN/1YJQGW.
Acknowledgements
We thank the participants at the CIREQ Political Economy Workshop in Montreal (September 19, 2022). Special thanks to Jeff Frieden for extensive comments. We also wish to express our gratitude to Diana Mutz, who gave valuable feedback on multiple drafts and offered helpful suggestions on the design of the survey experiment. We thank the Editor and three anonymous referees. All errors are our own.
Financial Support
This work was supported by the Canada SSHRC Insight Grant (grant number SSHRC 430-2023-00126).
Competing Interests
None.


 Open access