

1. Introduction
The United States and other advanced economies exhibit substantial productivity dispersion within narrowly defined industries (Syverson, Reference Syverson2011). This productivity dispersion varies across industries, geography, and time (Bartelsman and Doms, Reference Bartelsman and Doms2000; Cunningham et al., Reference Cunningham, Foster, Grim, Haltiwanger, Stewart and Wolf2023), but has been on the rise in the US in recent years according to most measures (Bils et al., Reference Bils, Klenow and Ruane2021; Decker et al., Reference Decker, Haltiwanger, Jarmin and Miranda2020). Such dispersion seemingly indicates there are gains to be had from reallocation—transferring inputs from less productive to more productive plants could increase aggregate productivity. For example, Hsieh and Klenow (Reference Hsieh and Klenow2009) show that, under certain assumptions, dispersion in revenue TFP (TFPR) is sufficient to characterize misallocation. And yet, the interpretation of productivity dispersion and the identification of its sources remains the subject of debate.Footnote 1 Financial frictions are one potential source, as credit frictions can inhibit reallocation and “distort” firm decisions (Gilchrist et al., Reference Gilchrist, Sim and Zakrajšek2013; Midrigan and Xu, Reference Midrigan and Xu2014; Gopinath et al., Reference Gopinath, Kalemli-Özcan, Karabarbounis and Villegas-Sanchez2017). Using a new productivity dispersion dataset from the US Census Bureau, I evaluate the relationship between productivity dispersion and leverage, a common proxy for financial constraints (Ottonello and Winberry, Reference Ottonello and Winberry2020). I compare my results to a theoretical model with financial frictions to shed light on the relationship between financial frictions, productivity dispersion, and misallocation.
Speculation over the relationship between finance and the allocation of resources to new, more productive activities dates back to at least Schumpeter (Reference Schumpeter1911). On the one hand, one could hold the view, as Schumpeter did, that finance aids in the reallocation of resources from less productive enterprises to new, more efficient methods through creative destruction. On the other hand, it could be that entrepreneurial activity attracts financial investment and thus generates financial development. As Robinson (Reference Robinson1952) put it, “where entrepreneurship goes, finance follows.”
More recently, economists have continued untangling the relationship between finance, growth, and resource allocation. Various papers have explored the implications of financial development for growth at the macro level both empirically and theoretically (Rajan and Zingales, Reference Rajan and Zingales1998; Amaral and Quintin, Reference Amaral and Quintin2010; Buera et al., Reference Buera, Kaboski and Shin2011; Greenwood et al., Reference Greenwood, Sanchez and Wang2010), finding potential for substantial gains in growth and efficiency from financial development. Recent studies suggest such frictions are substantial and important for aggregate outcomes. For example, Chodorow-Reich (Reference Chodorow-Reich2014) documents the importance of financial relationships in determining employment outcomes during the Great Recession. Likewise, recent findings on firm financing suggests that firm borrowing, terms of borrowing, and leverage depend greatly on firm characteristics, including size and age (Dinlersöz et al., Reference Dinlersöz, Hyatt, Kalemli-Özcan and Penciakova2018; Caglio et al., Reference Caglio, Darst and Kalemli-Özcan2021). Further, firm borrowing is largely secured by claims on assets and, more frequently, inventories and sales (Caglio et al., Reference Caglio, Darst and Kalemli-Özcan2021). State-dependent finance and the need for collateral could distort first order conditions, in theory, which standard models would interpret as misallocation.
However, research specifically focused on misallocation across plants within a country is less supportive of the idea that financial development generates greater allocative efficiency. Quantitative studies of the topic are mixed: Midrigan and Xu (Reference Midrigan and Xu2014) find only a minor role of finance for misallocation across plants, while Moll (Reference Moll2014) finds a larger role. Using Compustat data on finance pricing, Gilchrist et al. (Reference Gilchrist, Sim and Zakrajšek2013) find little variation in revenue productivity–and therefore misallocation—can be explained by heterogeneous interest rates. Gopinath et al. (Reference Gopinath, Kalemli-Özcan, Karabarbounis and Villegas-Sanchez2017) emphasizes that relaxing interest rate costs can lead to increased misallocation in the presence of financial frictions such as borrowing constraints—a theme I explore further in this paper.
This paper contributes by investigating the relationship between productivity dispersion and financial leverage—a proxy of financial constraints in recent literature.Footnote 2 To fix ideas about the relationship between leverage, constraints, and productivity dispersion, I introduce a simplified theoretical framework that connects the presence of financial frictions to dispersion in commonly used measures of revenue-based productivity. Financial frictions enter the firm’s problem through interest rates and a working capital constraint. In the absence of financial frictions, the model collapses to the undistorted model in Bils et al. (Reference Bils, Klenow and Ruane2021). Financial frictions can then be mapped directly to distortions in that model, generating observed productivity dispersion, and by extension measured misallocation. Further, I show measures of dispersion can be decomposed across firms facing different financial conditions. Firms range from unconstrained—those not reliant on external financing—to dependent on external financing and possibly bound by borrowing constraints. The resulting relationship between financial frictions, leverage, and productivity is complex. On one hand, more borrowing (higher leverage) leads to binding constraints, which creates productivity dispersion. On the other hand, access to credit can allow plants to expand (through higher borrowing and leverage) and reduce distortions, leading to a negative relationship between leverage and productivity dispersion.
What does the data say about this relationship? This paper brings additional evidence to bear on the question. I use the Dispersion Statistics on Productivity (DiSP), a new publicly available data product from the US Census Bureau (2001–2020a), and public data from the Quarterly Financial Report (QFR), also from the US Census Bureau (2001–2020b), from 2001–2020 to examine the relationship between financial characteristics of industries in the US manufacturing sector and corresponding measures of productivity dispersion. My findings generally indicate that leverage and dispersion are positively correlated. More specifically, I find short-term leverage is positively associated with higher TFPR and labor productivity dispersion, with statistically significant and economically meaningful correlations. Long-term leverage, however, is associated with higher dispersion in TFPR, but not labor productivity. On the asset side of the balance sheet, inventory accumulation is negatively associated with TFPR and labor productivity dispersion. These results imply that: 1. Short-term leverage affects labor in a similar manner to other inputs. 2. Long-term borrowing is not as tightly associated with labor input dispersion as with other inputs. 3. Inventories may serve as a source of collateral, consistent with evidence from Caglio et al. (Reference Caglio, Darst and Kalemli-Özcan2021).
To interpret the results, I extend the simple model, adding long-term (interperiod) financing alongside short-term (intraperiod) financing. The model has three inputs: capital, labor, and materials. Capital is subject to substantial intertemporal financial frictions, while labor is subject to short-term “working capital” constraints. Materials are not directly affected by financial frictions. This setup helps replicate several features of the data. First, the lack of frictions on materials—the largest share of costs—means TFPR is less dispersed than labor productivity. Second, long-term debt is closely associated with TFPR dispersion, while labor productivity dispersion responds to short-term leverage. Third, the relationship between leverage and dispersion is consistent with data, but only for some types of shocks. Shocks that impact firms’ demand for credit (e.g. interest rate shocks) cause leverage and dispersion to positively co-move. However, shocks that alter constraints (e.g. collateral constraint shocks) push productivity dispersion and leverage in opposite directions.
In what follows, I introduce the simple model in Section 2. I describe the data in Section 3, then the empirical methodology and results in Section 4. Finally, I explore quantitative implications of the full model in Section 5 before concluding.
2. Simple model
Consider a final good produced by a simple CES aggregator of intermediate goods:
 \begin{equation} Y = \left (\int _0^1 \left (\theta _i y_i\right )^{\rho }\right )^{\frac {1}{\rho }}, \end{equation}
where $y_i$
is the amount of intermediate good
$y_i$
is the amount of intermediate good $i$
and
$i$
and $\theta _i$
is a good-specific taste-shifter.
$\theta _i$
is a good-specific taste-shifter.
Each intermediate good is produced by an individual firm, also indexed by $i$
, that begins each period with net wealth
$i$
, that begins each period with net wealth $n_i$
. The firm faces an intratemporal “working capital” constraint–they must pay for inputs in advance with their wealth and through intratemporal borrowing at cost
$n_i$
. The firm faces an intratemporal “working capital” constraint–they must pay for inputs in advance with their wealth and through intratemporal borrowing at cost $r_i$
(which potentially varies across firms). Borrowing
$r_i$
(which potentially varies across firms). Borrowing $b_i$
is limited by projected revenue, so firm scale depends on wealth and potential sales.Footnote
3
The firm chooses inputs,
$b_i$
is limited by projected revenue, so firm scale depends on wealth and potential sales.Footnote
3
The firm chooses inputs, $b_i$
, and future net wealth
$b_i$
, and future net wealth $n_i'$
. Input choices and
$n_i'$
. Input choices and $b_i$
are static choices given state variables, and are not affected by
$b_i$
are static choices given state variables, and are not affected by $n_i'$
. Formally, we have:
$n_i'$
. Formally, we have:
 \begin{align} V\left (z_i, \theta _i, n_i\right )=\max _{b_i,n_i',\{X_{ij}\}_{j\in J}} p_i y_i -\sum _{j \in J} w_{j}X_{ij} - r_i b_i -\Delta n_i + \beta E\left [V\left (z_i', \theta _i', n_i'\right )\right ], \end{align}
 \begin{align} \text {s.t.} \quad \quad p_i = \theta _i^{\rho }\left (\frac {Y}{y_i}\right )^{1-\rho }, \quad \quad y_i = z_i \prod _{j\in J} X_{ij}^{\alpha _j}, \end{align}
 \begin{align} \sum _{j\in J} w_{j} X_{ij} \leq b_i + n_i, \quad \quad 0 \leq b_i \leq \overline {py}\left (z_i\right ), \end{align}
 \begin{align} \Delta n_i = n_i'-n_i. \end{align}
Equation (2) is the value function for firm owner that maximizes the present discounted value of consumption out of profits from operating technology $z_i$
, with taste parameter
$z_i$
, with taste parameter $\theta _i$
, and net wealth
$\theta _i$
, and net wealth $n_i$
.Footnote
4
The equations in (3) give the pricing function under CES demand (where
$n_i$
.Footnote
4
The equations in (3) give the pricing function under CES demand (where $\theta _i$
enters) and production under Cobb-Douglas (where productivity
$\theta _i$
enters) and production under Cobb-Douglas (where productivity $z_i$
enters). The equations in (4) describe financing. Input costs must be financed by internal funds
$z_i$
enters). The equations in (4) describe financing. Input costs must be financed by internal funds $n_i$
or borrowing
$n_i$
or borrowing $b_i$
, which is constrained by a function
$b_i$
, which is constrained by a function $\overline {py}$
(taken as given for now). This constraint may or may not bind, and I denote the associated multiplier as
$\overline {py}$
(taken as given for now). This constraint may or may not bind, and I denote the associated multiplier as $\lambda _i$
. Finally, wealth evolves according to the law of motion in (5).
$\lambda _i$
. Finally, wealth evolves according to the law of motion in (5).
I consider dynamic choices fully in Section 5, but focus on the static problem in this section. For now, note that if there is persistence in $\theta _i$
and
$\theta _i$
and $z_i$
, then wealth may be correlated with these fundamentals. Since
$z_i$
, then wealth may be correlated with these fundamentals. Since $\theta _i$
and
$\theta _i$
and $z_i$
are isomorphic, I simplify by assuming
$z_i$
are isomorphic, I simplify by assuming $z_i$
is persistent but
$z_i$
is persistent but $\theta _i$
is i.i.d.
$\theta _i$
is i.i.d.
2.1 Productivity
Consider the first order condition for the static input $j$
choice:Footnote
5
$j$
choice:Footnote
5
 \begin{equation} \rho \alpha _j p_i y_i = \left (1+\mathbf I\{b_i\gt 0\} r_i + \lambda _i\right ) w_{j}X_{ij}. \end{equation}
Note how financial frictions distort this margin. When borrowing $b_i$
is positive, this yields a difference in prices relative to firms that do not borrow. Further, variation in the price
$b_i$
is positive, this yields a difference in prices relative to firms that do not borrow. Further, variation in the price $r_i$
can distort the margin even among borrowing firms. Finally, the shadow value of relaxing the constraint
$r_i$
can distort the margin even among borrowing firms. Finally, the shadow value of relaxing the constraint $\lambda _i$
also distorts margins among constrained firms. Re-arranging for output per unit of input
$\lambda _i$
also distorts margins among constrained firms. Re-arranging for output per unit of input $j$
:
$j$
:
 \begin{equation} OPX_{ij} = \frac {p_i y_i}{X_{ij}} = \left (1+\mathbf I \{b_i\gt 0\} r_i + \lambda _i \right ) \left (\frac {w_j}{\rho \alpha _j}\right ). \end{equation}
Combining across inputs gives an expression for revenue TFP:
 \begin{equation} TFPR_i = \frac {p_i y_i}{\prod _j X_{ij}} = \left (1+\mathbf I \{b_i\gt 0\} r_i + \lambda _i \right ) \prod _j \left (\frac {w_j}{\rho \alpha _j}\right )^{\alpha _j}. \end{equation}
It is immediately clear that financial frictions impact productivity measures both via interest rates and through the constraint represented by the multiplier $\lambda _i$
. Consider the following four cases.
$\lambda _i$
. Consider the following four cases.
-
1. Unconstrained Firms: (denoted $unc$
)
$b_i=0$
and the desired expenditures are less than
$n_i$
. Then, there is no need to borrow, the constraint does not bind (
$\lambda _i=0$
), and there is no variation in TFPR or OPX with common input prices and production elasticities.(9)
\begin{equation} OPX_{ij}^{unc} = \frac {p_i y_i}{X_{ij}} = \left (\frac {w_j}{\rho \alpha _j}\right ), \end{equation}
(10)These are (7) and (8) with
\begin{equation} TFPR_i^{unc} = \frac {p_i y_i}{\prod _j X_{ij}} = \frac {1}{\rho } \prod _j \left (\frac {w_j}{\alpha _j}\right )^{\alpha _j}. \end{equation}
$b_i=0$
and
$\lambda _i=0$
. There is no borrowing or leverage.
$unc$
)
$b_i=0$
and the desired expenditures are less than
$n_i$
. Then, there is no need to borrow, the constraint does not bind (
$\lambda _i=0$
), and there is no variation in TFPR or OPX with common input prices and production elasticities.(9)
\begin{equation} OPX_{ij}^{unc} = \frac {p_i y_i}{X_{ij}} = \left (\frac {w_j}{\rho \alpha _j}\right ), \end{equation}
(10)These are (7) and (8) with
\begin{equation} TFPR_i^{unc} = \frac {p_i y_i}{\prod _j X_{ij}} = \frac {1}{\rho } \prod _j \left (\frac {w_j}{\alpha _j}\right )^{\alpha _j}. \end{equation}
$b_i=0$
and
$\lambda _i=0$
. There is no borrowing or leverage.
-
2. Internally Constrained Firms: (denoted
$ic$
) Faced with wages
$w_i$
, suppose desired expenditures are greater than
$n_i$
. However, when
$b_i\gt 0$
, the firm must also pay finance cost
$r_i$
. Inclusive of this cost, firms demand less than
$n_i$
. In this case, the wage bill is equal to its wealth and
$b_i=0$
(no leverage). So,
$\sum _j w_j X_{ij}=n_i$
, and productivity dispersion is(11)
\begin{equation} OPX_{ij}^{ic} = \frac {\left (\frac {w_j}{\alpha _j}\right ) Y^{1-\rho }z_i^{\rho }\theta _i^{\rho } \prod _k\left (\frac {\alpha _k}{w_k}\right )^{\rho \alpha _k}}{n_i^{1-\rho }}, \end{equation}
(12)I denote
\begin{equation} TFPR_i^{ic} = \frac {Y^{1-\rho }z_i^{\rho }\theta _i^{\rho } \prod _j \left (\frac {w_j}{\alpha _j}\right )^{\left (1-\rho \right )\alpha _j}}{n_i^{1-\rho }}. \end{equation}
$log(TFPR)$
as
$tfpr$
and
$log(OPX)$
as
$opx$
. Dispersion in (demeaned) log productivity among internally constrained firms is given by:(13)where
\begin{equation} \left (\sigma _{tfpr}^{ic}\right )^2=\left (\sigma _{opx}^{ic}\right )^2= \rho ^2 \left (\sigma _z^2 + \sigma _{\theta }^2\right ) +\left (\rho -1\right )^2 (\sigma _n^{ic})^2 -2\rho \left (1-\rho \right )cov\left (ln\left (z_i\right ),ln\left (n_i\right )\right ), \end{equation}
$\sigma _{z}^2$
is the variance of (log) productivity,
$\sigma _{\theta }^2$
is the variance of the (log) demand shifter,
$(\sigma _n^{ic})^2$
is the variance of (log) net wealth, and
$\rho$
is the demand elasticity parameter.
-
3. Externally Dependent Firms: (denoted
$dep$
) Input demand exceeds wealth
$n_i$
, so
$b_i\gt 0$
, but they borrow less than the constraint. So
$n_i \lt \sum _j w_j X_{ij} \lt \overline {py}(z)+ n_i$
. Here, TFPR and OPX are as in (7) and (8) with
$b_i\gt 0$
and
$\lambda _i=0$
since the constraint does not bind:(14)
\begin{equation} OPX_{ij}^{dep} = \frac {p_i y_i}{X_{ij}} = \left (1+r_i \right ) \left (\frac {w_j}{\alpha _j}\right ), \end{equation}
(15)Dispersion in (demeaned) log productivity among externally dependent firms is given by:
\begin{equation} TFPR_i^{dep} = \left (1+r_i\right )\prod _j \left (\frac {w_j}{\alpha _j}\right )^{\alpha _j}. \end{equation}
(16)where
\begin{equation} \left (\sigma _{tfpr}^{dep}\right )^2=\left (\sigma _{opx}^{dep}\right )^2 =\sigma _r^2, \end{equation}
$\sigma _r^2$
is the variance of the gross interest rate
$ln(1+r_i)\approx r_i$
. Leverage is given by:(17)Here, leverage is increasing in productivity and decreasing in the interest rate.
\begin{equation} \phi _i^{dep} = \frac {b_i}{n_i} = \frac {\sum _j w_jX_{ij}-n_i}{n_i}= \frac {\sum _j w_jX_{ij}}{n_i}-1= \frac {\frac {\left (\rho Y^{1-\rho } z_i^{\rho } \theta _i^{\rho } \prod _j \left (\frac {\alpha _j}{w_j}\right )^{\rho \alpha _j}\right )^{\frac {1}{1-\rho }}}{\left (1+r_i\right )^{\frac {1}{1-\rho }}}}{n_i}-1. \end{equation}
-
4. Externally Constrained Firms: (denoted
$ec$
) Suppose that
$b_i\gt 0$
, but now the constraint binds. In this case, productivity is given by:(18)
\begin{equation} OPX_{ij}^{ec} = \frac {w_j}{\alpha _j}\prod _k \left (\frac {\alpha _k}{w_k}\right )^{\rho \alpha _k}Y^{1-\rho } z_i^{\rho } \theta _i^{\rho } \left (\phi _i^{ec}+1\right )^{\rho -1}n_i^{\rho -1}, \end{equation}
(19)Thus one can write (demeaned) log productivity dispersion among these firms as:Footnote 6
\begin{equation} TFPR_i^{ec} = \prod _j \left (\frac {w_j}{\alpha _j}\right )^{\alpha _j \left (1-\rho \right )}Y^{1-\rho } z_i^{\rho } \theta _i^{\rho } \left (\phi _i^{ec}+1\right )^{\rho -1}n_i^{\rho -1}. \end{equation}
(20)where
\begin{align} \left (\sigma _{tfpr}^{ec}\right )^2&= \left (\sigma _{opx}^{ec}\right )^2= \rho ^2 \left (\sigma _z^2 + \sigma _{\theta }^2\right ) + \left (\rho -1\right )^2\left (\left (\sigma ^{ec}_{\phi }\right )^2 +\left (\sigma ^{ec}_n\right )^2\right ) \nonumber \\&\quad-2\rho \left (1-\rho \right )cov\left (ln\left (z_i\right ),ln\left (n_i\right )\right ) -2\rho \left (1-\rho \right )cov\left (ln\left (z_i\right ),ln\left (1+\phi _i^{ec}\right )\right ) \nonumber\\ &\quad-\left (\rho -1\right )^2 cov\left (ln\left (1+\phi _i^{ec}\right ),ln\left (n_i\right )\right ), \end{align}
$\sigma ^{ec}_{\phi }$
is the standard deviation of the leverage term
$1+\phi _i^{ed}$
and leverage is given by(21)
\begin{equation} \phi _i^{ec} = \frac {\overline {py}(z_i)}{n_i}. \end{equation}


2.2 Productivity dispersion decomposition
Given a distribution of firms across productivity and wealth dimensions, it is possible to show how variance in log productivity can be decomposed according to a standard within/between variance decomposition.Footnote
7
For example, variance in log TFPR $\sigma ^2_{tfpr}$
can be expressed as:
$\sigma ^2_{tfpr}$
can be expressed as:
 \begin{equation} \sigma ^2_{tfpr}= \underbrace {\mu _{unc} \left (\sigma ^{unc}_{tfpr}\right )^2}_{\text {unconstrained disp. }=0} + \underbrace {\mu _{ic}\left (\sigma _{tfpr}^{ic}\right )^2}_{\text {intern. const. disp.}}+ \underbrace {\mu _{dep}\left (\sigma _{tfpr}^{dep}\right )^2}_{\text {fin. dependent disp.}} +\underbrace {\mu _{con} \left (\sigma ^{con}_{tfpr}\right )^2}_{\text {ext. const. disp. }} \end{equation}
 \begin{equation*} + \underbrace {\mu _{unc}\left (\overline {tfpr}^{unc}-\overline {tfpr}\right )^2+\mu _{ic}\left (\overline {tfpr}^{ic}-\overline {tfpr}\right )^2+\mu _{dep}\left (\overline {tfpr}^{dep}-\overline {tfpr}\right )^2+\mu _{con}\left (\overline {tfpr}^{ec}-\overline {tfpr}\right )^2}_{\text {between-group dispersion}}. \end{equation*}
Defining $\mu _{s}$
as the mass of firms in group
$\mu _{s}$
as the mass of firms in group $s$
where
$s$
where $s\in \{unc, ic, dep, ec\}$
,
$s\in \{unc, ic, dep, ec\}$
, $\overline {tfpr}^{s}$
as the average log labor productivity dispersion among group
$\overline {tfpr}^{s}$
as the average log labor productivity dispersion among group $s$
, and
$s$
, and $\overline {tfpr}$
as the overall average log TFPR, (22) shows total dispersion is composed of two terms. First, there is the weighted average of log TFPR dispersion within groups that are defined by how financial constraints bind. This is the “within-group dispersion” contribution to overall productivity dispersion. Second, there is the weighted sum of squared differences between average group productivity and overall mean productivity. This represents the contribution of “between-group” differences to total dispersion.
$\overline {tfpr}$
as the overall average log TFPR, (22) shows total dispersion is composed of two terms. First, there is the weighted average of log TFPR dispersion within groups that are defined by how financial constraints bind. This is the “within-group dispersion” contribution to overall productivity dispersion. Second, there is the weighted sum of squared differences between average group productivity and overall mean productivity. This represents the contribution of “between-group” differences to total dispersion.
2.3 Leverage and dispersion: taking stock
Equation (22) summarizes the effect of financial frictions on dispersion, and presents a complex relationship between leverage and dispersion. First, note there is no $tfpr$
or
$tfpr$
or $opx$
dispersion without financial frictions in this simple model. If firms internally finance, then average revenue products are equal to marginal revenue products, which are in turn equalized across plants.Footnote
8
$opx$
dispersion without financial frictions in this simple model. If firms internally finance, then average revenue products are equal to marginal revenue products, which are in turn equalized across plants.Footnote
8
Nonetheless, the importance of financial frictions for dispersion does not imply a simple monotonic relationship between dispersion and leverage across the four categories discussed. Internally constrained firms have zero leverage, for example, but can exhibit substantial dispersion. On the other hand, both externally dependent and externally constrained firms exhibit more leverage than internally constrained firms, but may or may not exhibit more dispersion. Dispersion among externally dependent firms is dependent on interest rates, while externally dependent firms may not exhibit more dispersion than internally constrained firms.Footnote 9
Further, the relationship between productivity and leverage varies systematically only within the externally constrained firms. That is, if all firms were externally dependent, internally constrained, or unconstrained, there would be no relationship between leverage and dispersion. Furthermore, it is not clear that productivity dispersion increases with leverage among externally constrained firms. In fact, tighter constraints push dispersion and leverage in opposite directions.
In sum, it is not apparent that within-group dispersion, the focus of the first four terms in (22), are correlated with leverage in any systematic way. Likewise, comparing across firm types does not make plain the relationship between leverage and dispersion. So, it is an empirical and quantitative question. What does the relationship between leverage and dispersion look like in the data, and what modifications to the simple framework do we need to be consistent with the data?
3. Data
The Dispersion Statistics on Productivity (DiSP) dataset (US Census Bureau, 2001–2020a) is a new annual industry-level (4-digit NAICS) dataset from the US Census Bureau documenting within-industry productivity dispersion. The product is built primarily on the Annual Survey of Manufactures (ASM) which is an annual survey of manufacturing establishments that captures data on outputs and inputs, including production workers and hours. The DiSP data include both log labor and log total factor productivity statistics derived from these microdata. The former is the log of real revenue (output) per hour, henceforth OPH, and the latter is the log of the widely used “revenue total factor productivity,” henceforth TFPR. For TFPR, the numerator is sales adjusted for inventory investment and the denominator is the cost-share weighted input index.Footnote 10 The product includes measures of second moments, including standard deviations and interquartile ranges, as well as interdecile ranges and tail dispersion measures. These data are publicly available, and provide researchers with an opportunity to explore moments beyond central tendency measures without accessing restricted-access microdata.Footnote 11
Financial Indicators and Productivity Dispersion.
Notes: Leverage measures are asset (sales)-weighted averages across industries (Source: Quarterly Financial Report, US Census Bureau (2001–2020b)). Productivity dispersion measures are unweighted-averages of industries (Source: DiSP Product, US Census Bureau (2001–2020b)).

Additionally, I use the Quarterly Financial Report (QFR) data from the US Census Bureau (2001–2020b) to characterize industry-level financial conditions. These data are quarterly, and therefore averaged over the year to align with the DiSP, and cover primarily (but not solely) larger establishments. The manufacturing industry is covered well by the data, which are provided at the 3-digit NAICS level, with some coverage at the 4-digit level. I restrict the sample to the post-2000 period (through 2020) where both datasets use NAICS codes.Footnote 12 Crucially, these data include detailed asset and liability classes, including short- and long-term debt, bank debt, trade credit, fixed assets, accounts receivable, and inventories. I use these to construct a variety of financial leverage measures that are used to characterize financial conditions at the 3-digit (4-digit in some cases) industry level. The QFR microdata are available on a restricted basis, but can only be matched to other Census Bureau microdata in Census years. As a result, there are some limitations to using the microdata along the time dimension for this particular set of questions.
Figure 1, panel (a) shows measures of financial indicators under consideration, aggregated across the entire manufacturing sector. In general, short-term leverage declined moderately over the period under consideration, with a notable drop during the Great Recession. On the other hand, long-term debt has risen, and also exhibits a procyclical pattern. On the asset side, inventories have risen relative to sales, while cash holdings have increased notably (even excluding the increase in 2019). Further, it is notable that sales have declined substantially relative to assets, while assets are increasingly less concentrated in buildings and structures. Recent research has noted the relative importance of sales and inventory based constraints while also noting the disproportionate use of collateralized loans among smaller businesses (Caglio et al., Reference Caglio, Darst and Kalemli-Özcan2021).
During this period, there is a rise in productivity dispersion across various measures. In panels (c) and (d) of Figure 1, I plot cross-industry means of dispersion measures, where industries are weighted equally. In panel (c), dispersion in log TFPR rises by 3–8 log points, depending on the dispersion measure used, and log OPH dispersion rises by 6–10 log points. The interdecile range in panel (d) rises by roughly 20 log points for both measures.Footnote 13
Dispersion in Financial Indicators.
Notes: Cross-Industry dispersion in current liabilities (including trade credit) to assets, long-term debt to assets, inventory to sales, and cash (including treasuries and certain liquid assets) to assets. Data on financial indicators come from the Quarterly Financial Report US Census Bureau (2001–2020b), which report data primarily at the 3-digit level in manufacturing.

Figure 2 shows the variation in the measures used as explanatory variables. Across three-digit sectors, there is generally substantial variation in measures of financial leverage. For example, even though short-term leverage is relatively small, standard deviations and interquartile ranges still indicate meaningful variation across sectors relative to the level given in panel (a) of Figure 1. Likewise, long-term debt and asset-based financial indicators display substantial variation which I exploit to estimate the regressions below.
4. Empirics
The main concern of this paper is the relationship between financial conditions and misallocation. Previous literature has linked leverage with financial constraints (e.g. Ottonello and Winberry, Reference Ottonello and Winberry2020) and the relationship between TFPR dispersion and misallocation is well-documented in the literature (e.g. Hsieh and Klenow, Reference Hsieh and Klenow2009). I am particularly interested in liability heterogeneity, and so I focus on current liabilities (including trade credit) to assets as well as long-term debt to assets. Further, I consider both the contemporaneous relationship and the relationship with future realizations of dispersion to capture time-varying effects. My primary specification is therefore a fixed effect model:
 \begin{equation} \sigma _{i,t+h} = \beta _h lev_{s,t} + \Gamma _h' X_{s,t} + \gamma _{i,h} + \iota _{t,h} + \epsilon _{i,t}, \end{equation}
for $h=0,1,..,H$
. Here,
$h=0,1,..,H$
. Here, $\sigma _{i,t+h}$
is a dispersion measure (standard deviation or interquantile range) in log productivity (OPH or TFPR) for a 4-digit NAICS industry
$\sigma _{i,t+h}$
is a dispersion measure (standard deviation or interquantile range) in log productivity (OPH or TFPR) for a 4-digit NAICS industry $i$
at time
$i$
at time $t+h$
. The coefficient of interest
$t+h$
. The coefficient of interest $\beta _h$
reflects the change in log dispersion at horizon
$\beta _h$
reflects the change in log dispersion at horizon $h$
associated with a percentage point change in leverage
$h$
associated with a percentage point change in leverage $lev_{s,t}$
at the 3-digit NAICS level
$lev_{s,t}$
at the 3-digit NAICS level $s$
.
$s$
. $X_{s,t}$
is a matrix of additional financial variables at the 3-digit NAICS level
$X_{s,t}$
is a matrix of additional financial variables at the 3-digit NAICS level $s$
, and
$s$
, and $\Gamma _h$
is the associated coefficient vector. It is highly likely that industry-level characteristics unrelated to financial frictions may drive cross-industry differences in both dispersion and leverage, so industry-level dummies
$\Gamma _h$
is the associated coefficient vector. It is highly likely that industry-level characteristics unrelated to financial frictions may drive cross-industry differences in both dispersion and leverage, so industry-level dummies $\gamma _i$
are included to sweep out average cross-industry variation. Likewise, financial characteristics change over time and certainly over the business cycle, and there are well documented time-series patterns in misallocation and productivity dispersion as well (see Bils et al., Reference Bils, Klenow and Ruane2021; Decker et al., Reference Decker, Haltiwanger, Jarmin and Miranda2020), which are controlled by time effects
$\gamma _i$
are included to sweep out average cross-industry variation. Likewise, financial characteristics change over time and certainly over the business cycle, and there are well documented time-series patterns in misallocation and productivity dispersion as well (see Bils et al., Reference Bils, Klenow and Ruane2021; Decker et al., Reference Decker, Haltiwanger, Jarmin and Miranda2020), which are controlled by time effects $\iota _t$
.
$\iota _t$
.
Standard deviation of log TFPR

Standard errors in parentheses * $p\lt 0.10$
, **
$p\lt 0.10$
, ** $p\lt 0.05$
, ***
$p\lt 0.05$
, *** $p\lt 0.01$
Regression includes time and industry fixed effects and controls for
$p\lt 0.01$
Regression includes time and industry fixed effects and controls for $log(Sales)$
and
$log(Sales)$
and $log(Assets)$
. Annual data cover the period from 2001-2020. Financial Data Source: QFR US Census Bureau (2001–2020b). Productivity Data: DiSP database US Census Bureau (2001–2020b). Robust Standard Errors.
$log(Assets)$
. Annual data cover the period from 2001-2020. Financial Data Source: QFR US Census Bureau (2001–2020b). Productivity Data: DiSP database US Census Bureau (2001–2020b). Robust Standard Errors.
I also consider the composition of the asset side of the balance sheet. In particular, I consider inventories, which have a well-defined book value to the firm and are often used as collateral (Caglio et al., Reference Caglio, Darst and Kalemli-Özcan2021), as a share of sales. Further, I consider cash as a share of assets, which captures firm liquidity.Footnote 14 These are then included in a similar regression:
 \begin{equation} \sigma _{i,t+h} = \beta _h asset\_ratio_{s,t} + \Gamma _h' X_{s,t} + \gamma _{i,h} + \iota _{t,h} + \epsilon _{i,t}. \end{equation}
Here, the coefficient of interest captures how dispersion responds to changes in the prevalence of a particular asset. To the extent that such assets are “good collateral” and loosen financial constraints, one would generally expect to see a negative relationship between the prevalence of these assets and dispersion.
To summarize, the approach is a fixed effect model at the industry level, with the vector $\beta _h$
identified by within-industry variation over time. It is a projection of second moments in productivity on first moments of financial characteristics. Such a regression tests whether industry financial need, as captured through leverage, is associated with productivity dispersion.
$\beta _h$
identified by within-industry variation over time. It is a projection of second moments in productivity on first moments of financial characteristics. Such a regression tests whether industry financial need, as captured through leverage, is associated with productivity dispersion.
4.1 Empirical results
Table 1 presents a regression table with the financial indicators plotted in Figures 1 and 2 as the regressors in (23) for $h=0$
, and the standard deviation in log TFPR and log OPH as the outcome variable. These results show a robust relationship between current liabilities (including trade credit) and productivity dispersion. Quantitatively, a five percentage point increase (roughly the interquartile range across industries in Figure 2) is associated with about half a percentage point increase in dispersion, with a slightly higher point estimate for labor productivity.
$h=0$
, and the standard deviation in log TFPR and log OPH as the outcome variable. These results show a robust relationship between current liabilities (including trade credit) and productivity dispersion. Quantitatively, a five percentage point increase (roughly the interquartile range across industries in Figure 2) is associated with about half a percentage point increase in dispersion, with a slightly higher point estimate for labor productivity.
Further, the coefficient on inventories is generally significant and negative throughout the analysis. For log TFPR, the statistically significant coefficient implies a 2.2 percentage point decrease in dispersion for a 20 percentage point decline in inventories to sales (roughly the interquartile range across industries in Figure 2). On the one hand, this is perhaps a bit contrary to expectations, since industries with low turnover and higher inventories relative to sales are thought to be potentially more constrained. On the other hand, there are plausible reasons inventories might actually loosen financial constraints. First, the existence of substantial inventory management facilities and procedures allows plants in these industries to smooth production. The numerator in TFPR is adjusted for inventories and is therefore a measure of production and not necessarily sales. So, the presence of large inventories would have to correlate with production decisions that are less volatile. Second, inventories may be valuable as collateral in and of themselves, and therefore may help to reduce financial constraints and, as the model suggests, dispersion. Caglio et al. (Reference Caglio, Darst and Kalemli-Özcan2021) show the relative importance of “accounts receivable and inventories” (AR&I) lending, suggesting that inventories may serve an important role in securing credit.
Considering the significance of the results on short-term debt, it is puzzling that long-term debt does not show any statistically significant relationship with dispersion. While indicating a response of 1 percent for a 10 percentage point increase in long-term leverage (roughly in line with the typical interquartile range in Figure 2), the coefficient is not precisely estimated. As explored below, Figure 3 shows that alternative measures of dispersion, however, are responsive to long-term leverage. One explanation for the lack of significant results could be that changes in long-term debt (relative to the long-run industry mean) may take time to manifest in TFPR or OPH dispersion. For example, if debt increases as a result of capital expenditures that take time to build, then the resulting effects on productivity may not manifest until subsequent periods. A second explanation is that standard deviations are sensitive to outlier observations, while other measures like interquartile ranges are less sensitive. In Section 4.2 I explore the dynamic response by considering further lags of the outcome variable after the initial change in leverage, and in Section 4.3 and online Appendix C I explore the relationship between leverage and tail dispersion.
Finally, I note that cash holdings do not appear to be significantly related to productivity dispersion. This differs somewhat from recent literature exploring the role of leverage and liquidity in determining firm responsiveness (see Ottonello and Winberry, Reference Ottonello and Winberry2020; Jeenas, Reference Jeenas2024). There are potential explanations for this result. First, the previous literature generally uses publicly listed firms, while the DiSP data includes large and small, private and public. However, it is also possible that there are offsetting facts here: liquidity could be indicative of relaxed financial constraints, but it could also indicate additional uncertainty faced by firms. The general increase in cash holdings seen in Figure 1 (a) is consistent with increased liquidity needs in the face of higher uncertainty (Bloom, Reference Bloom2009). Still, it seems likely that leverage and liquidity interact in ways that are not picked up by this regression at this level of aggregation.
4.2 Empirical results: dynamic response
I now turn to the lagged relationship between changes in leverage and dispersion. In the simple model presented in Section 2, financial frictions can impact dispersion dynamically through the accumulation of net wealth. In other words, to the extent that financial frictions impact net wealth, this will interact with frictions in future periods and therefore create the potential for persistent effects. However,there is no distinction between dispersion in log TFPR and log output per unit input (OPH) in the model. This may not be the case. On the one hand, if financial constraints impact input margins uniformly, one would expect similar patterns to show up with log output per hour as an outcome variable. On the other hand, if other frictions or distortions (and even measurement issues) impact input margins differently, then there is no reason for these results to look the same. In what follows I consider the dynamic relationship between dispersion and leverage for each measure, exploring the differences across TFPR and OPH.
IRF: Productivity Dispersion correlation to change inlong-term leverage at year 0.
Notes: Lines indicate point estimates at each time horizon $h=0,\ldots 6$
, shaded areas represent
$h=0,\ldots 6$
, shaded areas represent $\pm 1.96*SE$
. Period zero corresponds to Table 1 (specifications 1–4). Regression includes time and industry fixed effects and controls for
$\pm 1.96*SE$
. Period zero corresponds to Table 1 (specifications 1–4). Regression includes time and industry fixed effects and controls for $log(Sales)$
and
$log(Sales)$
and $log(Assets)$
. Annual data cover the period from 2001–2020. Financial Data Source: QFR US Census Bureau (2001–2020b). Productivity Data: DiSP database US Census Bureau (2001–2020b). Robust Standard Errors.
$log(Assets)$
. Annual data cover the period from 2001–2020. Financial Data Source: QFR US Census Bureau (2001–2020b). Productivity Data: DiSP database US Census Bureau (2001–2020b). Robust Standard Errors.

In Figure 4, I find that for TFPR (panels (a) through (c)), the coefficient on current liabilities is significantly positive for one to three periods, depending on the measure, with the highest estimate usually in the first period (the one exception being the IQR). This is consistent with pressing funding needs leading to immediate impacts that die out relatively quickly. Similarly, the largest log OPH response to current liabilities is generally in the first period, and yet the response is seemingly more persistent (although the coefficient for IQR is less precise). It might be that current financing needs are more persistently felt on the labor margin than on other inputs.
IRF: Productivity Dispersion correlation to Change in Current Liability Leverage at year 0.
Notes: Lines indicate point estimates at each time horizon $h=0,\ldots 6$
, shaded areas represent
$h=0,\ldots 6$
, shaded areas represent $\pm 1.96*SE$
. Period zero corresponds to Table 1 (specifications 1–4). Regression includes time and industry fixed effects and controls for
$\pm 1.96*SE$
. Period zero corresponds to Table 1 (specifications 1–4). Regression includes time and industry fixed effects and controls for $log(Sales)$
and
$log(Sales)$
and $log(Assets)$
. Annual data cover the period from 2001–2020. Financial Data Source: QFR US Census Bureau (2001–2020b). Productivity Data: DiSP database US Census Bureau (2001–2020b). Robust Standard Errors.
$log(Assets)$
. Annual data cover the period from 2001–2020. Financial Data Source: QFR US Census Bureau (2001–2020b). Productivity Data: DiSP database US Census Bureau (2001–2020b). Robust Standard Errors.

Although the coefficient on long-term leverage is not significant at any horizon for the standard deviation, Figure 3 shows evidence of a positive relationship between leverage and the interquartile and interdecile ranges for TFPR. Curiously, these effects are not any more persistent than short-term leverage. Labor productivity does not appear to be notably impacted by long-term debt at any horizon or for any measure of dispersion. This stands in stark contrast to the results for short-term debt, where similar results hold for both TFPR and OPH, suggesting that the labor margin might be differentially impacted by short-term vs. long-term debt. In the detailed model I construct in the next section, I include a role for long-term and short-term debt, which varies by input to explore whether such mechanisms can generate similar patterns.
The coefficient on inventories is negative, significant, and persistent across measures of productivity and all concepts of dispersion. This robust finding suggests inventories have a significant role to play in determining dispersion, although it should be noted that the point estimates are relatively small. Such evidence is consistent with the findings in Caglio et al. (Reference Caglio, Darst and Kalemli-Özcan2021) that inventories support financing, possibly by serving as collateral that is easily valued.
4.3 Empirical results: tail dispersion
A measure not discussed in the motivational framework is the extreme tails of the distribution. However, to the extent tail dispersion measures capture “distance to the frontier,” or how far even highly productive firms are away from the efficient frontier, then they may be of interest in understanding the potential gains from reallocation. Furthermore, the motivational framework will predict increased dispersion is associated with an increase in skewness. For example, if there is no dispersion in interest rates, the lower bound of TFPR is the value for unconstrained firms, suggesting that there may be little dispersion in the lower tail. The binding constraint, however, creates both higher measured productivity and dispersion among constrained firms, potentially affecting the upper tail.
I discuss the results from these exercises in Appendix C. Overall, there are relatively weak relationships between tail dispersion and leverage, with the possible exception of upper tail labor productivity dispersion and short-term leverage.
5. Full scale model
The empirics suggest that leverage and dispersion are positively correlated, but the relationship depends on the type of debt and the productivity measure. In this section, I modify the framework from Section 2. The model is still partial equilibrium in the following sense: while labor markets must clear, there is inelastically supplied labor from a representative household. Further, I assume that interest rates are not changing over time—equivalent to assuming an elastic supply of loanable funds. I leave the general equilibrium implications of the following exercises to future work.
Given the partial equilibrium nature of the problem, I focus on the firm side. I specify additional sources of heterogeneity in financial conditions: life cycle dynamics, collateral/earnings-based constraints, and heterogeneous interest rates. Furthermore, inputs face different types of financial constraints. Capital takes time to build and is therefore inherently tied to intertemporal debt, while labor can be hired using intratemporal debt, similar to trade credit.Footnote 15 Intratemporal debt is the model analog to short-term debt in the empirics, and intertemporal debt represents long-term debt. The ability to hire workers on trade credit aligns with my empirical results that show long-term debt affects TFPR dispersion but not OPH dispersion. Intermediates (materials) are purchased in spot markets with no financing costs or constraints.
There are exogenous entry and exit dynamics for firms—a fixed proportion exit randomly and the same proportion are born each period. Firms accumulate capital and bond savings over time, so the distribution of assets will evolve as firms age according to aggregate conditions and the realization of their productivity processes, which now evolve stochastically. Additionally, firms are now subject to heterogeneous external financing costs—they are separated onto “islands” that vary in interest rate spreads—and face a sales-based constraint that varies according to firm characteristics. In the baseline, the constraint will be a fraction of average output and common across firms.
5.1 Final output
Output is aggregated across a continuum of intermediate goods by a final goods producer that operates a CES technology:
 \begin{equation*}Y = \left (\int _0^1 y_i^{\rho } di\right )^{\frac {1}{\rho }},\end{equation*}
Where $y_i$
is output from firm
$y_i$
is output from firm $i$
and
$i$
and $\rho$
parameterizes the returns to scale for each intermediate firm. The model has the standard pricing solution for the intermediate good:
$\rho$
parameterizes the returns to scale for each intermediate firm. The model has the standard pricing solution for the intermediate good:
 \begin{equation*}p_i = \left (\frac {Y}{y_i}\right )^{1-\rho }.\end{equation*}
5.2 Intermediate firms
The value function for a firm with state variables $z_i$
(productivity),
$z_i$
(productivity), $k_i$
(capital),
$k_i$
(capital), $b_i$
(intertemporal debt/asset), and location indicator (
$b_i$
(intertemporal debt/asset), and location indicator ( $I_i$
):
$I_i$
):
 \begin{align*} V\left (z_i,k_i,b_i,I_i\right )&=\max _{k_i',b_i',h_i,m_i} p_i y_i - wh_{i} - m_i -r\left (I_i\right )\omega \left (h_i\right ) +\left (1+ r\left (I_i\right )\right ) b_i -b_i' -C\left (k_i',k_i\right )\nonumber\\[-3pt] &\quad+ \beta \zeta E\left [V\left (z_i', k_i',b_i',I_i'\right )\right ] \end{align*}
 \begin{equation} \text {s.t.} \quad \quad p_i = \left (\frac {Y}{y_i}\right )^{1-\rho }, \quad \quad y_i = z_i k_i^{\alpha _k}h_i^{\alpha _{\ell }}m_i^{1-\alpha _k-\alpha _{\ell }}, \end{equation}
 \begin{equation} \omega \left (h_i\right ) = \max (wh_i - \max (b_i,0),0), \quad \quad \omega \left (h_i\right )\leq \max (b_i,0)+\xi \left ( k_i + Y\right ), \end{equation}
 \begin{equation} b_i' \geq -\xi \left (k_i'+E\left [V\left (z_i', k_i', b_i',I_i'\right )\right ]\right ), \end{equation}
 \begin{equation} C\left (k_i',k_i\right ) = k_i'-\left (1-\delta \right )k_i + \frac {\chi }{2k_i}\left (k_i'-\left (1-\delta \right )k_i\right )^2, \end{equation}
 \begin{equation} ln\left (z_i'\right ) = \rho _z ln\left (z_i\right )+ \varepsilon _{i}', \quad \quad \varepsilon _i' \sim \mathcal {N}\left (0,\sigma _{\varepsilon }\right ), \end{equation}
where the firm faces wage $w$
and interest rate
$w$
and interest rate $r(I_i)$
, the latter of which depends on the firm’s location. The equations in (25), as before, give demand (pricing) and production for the firm providing good
$r(I_i)$
, the latter of which depends on the firm’s location. The equations in (25), as before, give demand (pricing) and production for the firm providing good $i$
. Working capital
$i$
. Working capital $\omega (h_i)$
is defined in (26) as the difference between labor demand and internal funds (if available), and faces a constraint governed by the parameter
$\omega (h_i)$
is defined in (26) as the difference between labor demand and internal funds (if available), and faces a constraint governed by the parameter $\xi$
. This intratemporal borrowing constraint depends on both owned capital and average sales.Footnote
16
Intertemporal borrowing is likewise constrained, not just by current capital, but also the future profits of the firm captured by the value function appearing on the right-hand side of (27). Capital accumulation is also subject to quadratic adjustment costs described in (28). Productivity follows an AR(1) process described in (29).
$\xi$
. This intratemporal borrowing constraint depends on both owned capital and average sales.Footnote
16
Intertemporal borrowing is likewise constrained, not just by current capital, but also the future profits of the firm captured by the value function appearing on the right-hand side of (27). Capital accumulation is also subject to quadratic adjustment costs described in (28). Productivity follows an AR(1) process described in (29).
I collapse productivity variation to $z_i$
, since
$z_i$
, since $\theta _i$
and
$\theta _i$
and $z_i$
are isomorphic. The log of productivity
$z_i$
are isomorphic. The log of productivity $log\left (z_i\right )$
evolves according to an AR(1) process. Second, I include a “finance island” indicator
$log\left (z_i\right )$
evolves according to an AR(1) process. Second, I include a “finance island” indicator $I_i$
as (exogenous) state variables specific to the firm, since interest rates now vary across a discrete number of islands. Firms cannot move islands.
$I_i$
as (exogenous) state variables specific to the firm, since interest rates now vary across a discrete number of islands. Firms cannot move islands.
The first financial constraint applies to labor directly, limiting “working capital” $\omega \left (h_i\right )$
. It depends on assets
$\omega \left (h_i\right )$
. It depends on assets $k_i$
and
$k_i$
and $b_i$
and expected sales from the lenders perspective. For simplicity, I assume that lenders have no special information about sales, and expect the average (aggregate) output to be the firm’s output.Footnote
17
It is a “working capital” constraint in that firms can make labor decisions within the period after realizing productivity shocks, but they must pay workers in advance. They can use liquid savings, but the difference between wage bill and liquid savings
$b_i$
and expected sales from the lenders perspective. For simplicity, I assume that lenders have no special information about sales, and expect the average (aggregate) output to be the firm’s output.Footnote
17
It is a “working capital” constraint in that firms can make labor decisions within the period after realizing productivity shocks, but they must pay workers in advance. They can use liquid savings, but the difference between wage bill and liquid savings $b_i\gt 0$
must be financed by “working capital,” or intraperiod loans. Firms prefer to self-finance, but if the firm has no savings or negative savings,
$b_i\gt 0$
must be financed by “working capital,” or intraperiod loans. Firms prefer to self-finance, but if the firm has no savings or negative savings, $b_i\leq 0$
, then the entire wage bill must be financed, which comes at a cost. For firms that can only self-finance part of the bill, they incur interest costs on only the portion they borrow (thus
$b_i\leq 0$
, then the entire wage bill must be financed, which comes at a cost. For firms that can only self-finance part of the bill, they incur interest costs on only the portion they borrow (thus $r\left (I_i\right )\omega \left (h_i\right )$
shows up in the flow costs of the value function). The timing within period works as follows: firms realize productivity draws, choose labor and intermediate inputs, use savings and/or borrow the funds necessary to pay workers up front, produce, pay materials bill, pay back intratemporal loans, then make portfolio allocation decisions for the next period.
$r\left (I_i\right )\omega \left (h_i\right )$
shows up in the flow costs of the value function). The timing within period works as follows: firms realize productivity draws, choose labor and intermediate inputs, use savings and/or borrow the funds necessary to pay workers up front, produce, pay materials bill, pay back intratemporal loans, then make portfolio allocation decisions for the next period.
The intertemporal portfolio decision is likewise constrained, as firms can only borrow (i.e., $b_i\lt 0$
) up to some fraction of their capital and the expected value of the franchise in the next period. Therefore, capital is generally more closely associated with long-term debt, while labor is more closely associated with short-term borrowing. Additionally, I include quadratic adjustment costs, captured by the third term of the investment cost function
$b_i\lt 0$
) up to some fraction of their capital and the expected value of the franchise in the next period. Therefore, capital is generally more closely associated with long-term debt, while labor is more closely associated with short-term borrowing. Additionally, I include quadratic adjustment costs, captured by the third term of the investment cost function $C(k_i',k_i)$
to better reflect the (lack of) flexibility in investment plans seen in the data (Cooper and Haltiwanger, Reference Cooper and Haltiwanger2006).
$C(k_i',k_i)$
to better reflect the (lack of) flexibility in investment plans seen in the data (Cooper and Haltiwanger, Reference Cooper and Haltiwanger2006).
5.3 Entry and exit dynamics
I specify exogenous entry and exit, with a fixed fraction $1-\zeta$
exiting and entering each period. Thus, firms discount the future by
$1-\zeta$
exiting and entering each period. Thus, firms discount the future by $\zeta$
to account for the exit probability. Entering firms receive capital
$\zeta$
to account for the exit probability. Entering firms receive capital $k_{ent}= c_eK$
where
$k_{ent}= c_eK$
where $0\lt c_e\lt 1$
to capture the fact that entering firms have lower capital. I set
$0\lt c_e\lt 1$
to capture the fact that entering firms have lower capital. I set $c_e=0.1$
for the exercises below. Entering firms have no liquid savings (or debt) upon entry.
$c_e=0.1$
for the exercises below. Entering firms have no liquid savings (or debt) upon entry.
5.4 Equilibrium
As noted, the model is partial equilibrium in that credit supply is perfectly elastic at the interest rate consistent with discount factor $\beta$
. Intermediate inputs are assumed to have the same price as output, reflecting the “roundabout production” approach found in Bils et al. (Reference Bils, Klenow and Ruane2021). Wages are set such that labor demand from firms is equal to inelastic labor
$\beta$
. Intermediate inputs are assumed to have the same price as output, reflecting the “roundabout production” approach found in Bils et al. (Reference Bils, Klenow and Ruane2021). Wages are set such that labor demand from firms is equal to inelastic labor $\bar {H}$
. That is,
$\bar {H}$
. That is,
 \begin{equation*}\int _0^1 h_i^*di=\bar {H},\end{equation*}
where $h_i^*$
is the optimal solution to firm’s problem for labor demand problem in 5.2.
$h_i^*$
is the optimal solution to firm’s problem for labor demand problem in 5.2.
5.5 Parameters
Table 2 gives parameters for the calibration of the model. I use input share parameters $\alpha _{\ell }$
and
$\alpha _{\ell }$
and $\alpha _k$
consistent with data from the ASM (see Blackwood et al., Reference Blackwood, Haltiwanger and Wolf2024). Wages are determined in equilibrium by equating labor demand to labor supply set to a standard EPOP ratio. Intermediate good prices are equal to that of output (normalized to one).Footnote
18
Discount factor
$\alpha _k$
consistent with data from the ASM (see Blackwood et al., Reference Blackwood, Haltiwanger and Wolf2024). Wages are determined in equilibrium by equating labor demand to labor supply set to a standard EPOP ratio. Intermediate good prices are equal to that of output (normalized to one).Footnote
18
Discount factor $\beta$
and revenue curvature parameter
$\beta$
and revenue curvature parameter $\rho$
are standard. Exit rate (and entry rate) parameter
$\rho$
are standard. Exit rate (and entry rate) parameter $\zeta$
is set to imply 8% entry rates based on data from the mid-2000s in the US Census Bureau’s Business Dynamics Statistics. Productivity persistence
$\zeta$
is set to imply 8% entry rates based on data from the mid-2000s in the US Census Bureau’s Business Dynamics Statistics. Productivity persistence $\rho _z$
has been much debated, and in these exercises it is set to a reasonable value within the discussed range in the literature (see Asker et al., Reference Asker, Collard-Wexler and De Loecker2014); Midrigan and Xu, Reference Midrigan and Xu2014; Moll, Reference Moll2014). Additionally, I specify an interest rate range of 150 basis points that roughly corresponds to the standard deviation of corporate spreads discussed in Gilchrist et al. (Reference Gilchrist, Sim and Zakrajšek2013).
$\rho _z$
has been much debated, and in these exercises it is set to a reasonable value within the discussed range in the literature (see Asker et al., Reference Asker, Collard-Wexler and De Loecker2014); Midrigan and Xu, Reference Midrigan and Xu2014; Moll, Reference Moll2014). Additionally, I specify an interest rate range of 150 basis points that roughly corresponds to the standard deviation of corporate spreads discussed in Gilchrist et al. (Reference Gilchrist, Sim and Zakrajšek2013).
Calibration

The remaining parameters, variance in productivity shocks $\sigma _e$
, collateral constraint parameter
$\sigma _e$
, collateral constraint parameter $\xi$
, and adjustment cost parameter
$\xi$
, and adjustment cost parameter $\chi$
, are chosen to reasonably capture some key moments in the data. In particular, TFPR dispersion,corporate leverage, and the standard deviation of investment.
$\chi$
, are chosen to reasonably capture some key moments in the data. In particular, TFPR dispersion,corporate leverage, and the standard deviation of investment.
Table 3 gives some steady state moments targeted by the model. The model is able to reproduce one key aspect of the US manufacturing data: dispersion in labor productivity (OPH) is larger than dispersion in TFPR. In the model, this is largely due to the fact that labor is distorted, while materials is an undistorted margin. Even though capital is typically thought to be “more distorted”, dispersion in (log) TFPR is a weighted linear combination of dispersion in average revenue products of each input (and covariances). Thus, the lack of variance in average revenue product of materials (revenue over materials) drags TFPR dispersion downward relative to labor productivity.
Moments

Still, the model does not produce the same level of dispersion in either TFPR or OPH as in the data. This is not entirely surprising, since there are many candidate mechanisms for measured TFPR/OPH dispersion in the literature, which I do not incorporate here aside from capital adjustment costs. Gopinath et al. (Reference Gopinath, Kalemli-Özcan, Karabarbounis and Villegas-Sanchez2017) note a similar phenomenon, and discuss how substantial additional frictions are needed in a model extension to match levels of dispersion. However, responsiveness to changes in financial frictions, the focus of their paper and this paper, is not sensitive to these additional mechanisms.
Leverage is very close to the data, and the standard deviation of investment is mildly higher than what is found in Cooper and Haltiwanger (Reference Cooper and Haltiwanger2006). With these results in hand, I apply the Hsieh and Klenow (Reference Hsieh and Klenow2009) framework to the distribution of firms in the model to obtain a measure of misallocation. That is, I take the invariant distribution as “data” and derive the implied measure of misallocation a researcher would find if they estimated distortions as in the Bils et al. (Reference Bils, Klenow and Ruane2021) variant of the model. It is somewhat unsurprising that the model economy is relatively “efficient” compared to the data given the relatively low dispersion. Allocative efficiency is high relative to the long-run average of roughly 75% in the data, but within the historical bounds reported in the literature (Bils et al., Reference Bils, Klenow and Ruane2021; Blackwood et al., Reference Blackwood, Foster, Grim, Haltiwanger and Wolf2021).
The model also generates a substantial amount of constrained firms-20.7% of firms in the model are externally constrained. The majority (73.5%) are externally dependent, while a small share (5%) are unconstrained. Less than 1% are internally constrained.Footnote 19 Ultimately, external finance is relevant for a large majority of firms (roughly 94.5%), but most are externally dependent. One reason dispersion is relatively low in this model is that dispersion in interest rates is not significant enough to generate substantial dispersion, as noted in Gilchrist et al. (Reference Gilchrist, Sim and Zakrajšek2014).
5.6 Exercises
What mechanisms might generate the positive correlations seen between leverage and productivity dispersion? I now take the model outlined above and explore the implications of credit frictions for both productivity dispersion and leverage. I do so by finding a baseline invariant distribution in steady state. I then consider simple shocks that decay within 10 periods and study the dynamic response of dispersion and misallocation, along with other aggregates of interest. I consider three shocks: an aggregate productivity shock, an interest rate shock, and a collateral constraint shock. Shocks are entirely unanticipated, and then the path of the shock, prices, and aggregates are known with perfect foresight immediately upon realization of the shock (i.e., an “MIT shock”). I then take the increase in (short-term and long-term) leverage from the model and estimate empirical responses of dispersion based on the results in Section 4, along with associated confidence intervals.
5.6.1 Increased aggregate productivity
Aggregate productivity is normalized to one in the model detailed in Section 5.2. I feed in a 5% aggregate productivity shock, which serves as a source of higher demand for inputs, and therefore credit. This captures the dynamic interaction between determinants of growth and credit constraints–as productivity evolves, firms are pushed toward constraints, which generate dispersion and misallocation.Footnote 20
5.6.2 Lower interest rates
I consider a one percentage point increase in interest rates that reverts back to the baseline rate in 10 periods. As noted in Gopinath et al. (Reference Gopinath, Kalemli-Özcan, Karabarbounis and Villegas-Sanchez2017), relaxation in credit conditions can similarly lead to increased dispersion, if the relaxation is on the explicit interest rate cost while credit constraints remain tight. Essentially, lower interest rates stimulate credit demand, which can lead to both higher leverage and tighter constraints, and thus more dispersion in productivity. Again, given the non-linear relationship explored in Section 2, it remains to be seen whether this is true in the invariant steady state.
5.6.3 Tighter credit constraints
To simulate a change in credit constraints, I specify a tightening in the parameter $\xi$
–similar to “credit crunches” explored in the macro-finance literature (e.g., Khan and Thomas, Reference Khan and Thomas2013). The shock is picked to generate a decline in leverage similar to the decline in debt to assets in the corporate sector seen in the data during the Great Recession. In the context of the empirical results, it is possible that more constrained industries hit up against tighter constraints, which generates more dispersion. On the other hand, tighter constraints reduce the leverage of constrained firms, and potentially cause more firms to become constrained. This leans toward reducing leverage, contradicting the empirical findings of a positive correlation. However, the endogenous response of the invariant distribution could work to offset both of these effects.
$\xi$
–similar to “credit crunches” explored in the macro-finance literature (e.g., Khan and Thomas, Reference Khan and Thomas2013). The shock is picked to generate a decline in leverage similar to the decline in debt to assets in the corporate sector seen in the data during the Great Recession. In the context of the empirical results, it is possible that more constrained industries hit up against tighter constraints, which generates more dispersion. On the other hand, tighter constraints reduce the leverage of constrained firms, and potentially cause more firms to become constrained. This leans toward reducing leverage, contradicting the empirical findings of a positive correlation. However, the endogenous response of the invariant distribution could work to offset both of these effects.
Aggregate Responses to Productivity, Interest Rate and Collateral Constraint Shocks.
Notes: Lines indicate point estimates at each time horizon $h=0,\ldots 6$
, shaded areas represent
$h=0,\ldots 6$
, shaded areas represent $\pm 1.96*SE$
. Period zero corresponds to Table 1 (specifications 1–4). Regression includes time and industry fixed effects and controls for
$\pm 1.96*SE$
. Period zero corresponds to Table 1 (specifications 1–4). Regression includes time and industry fixed effects and controls for $log(Sales)$
and
$log(Sales)$
and $log(Assets)$
. Annual data cover the period from 2001–2020. Financial Data Source: QFR US Census Bureau (2001–2020b). Productivity Data: DiSP database US Census Bureau (2001–2020b). Robust Standard Errors.
$log(Assets)$
. Annual data cover the period from 2001–2020. Financial Data Source: QFR US Census Bureau (2001–2020b). Productivity Data: DiSP database US Census Bureau (2001–2020b). Robust Standard Errors.

5.7 Results
Figure 5 shows that the relationship between these shocks and aggregates generally follows intuition. In response to productivity and interest rate shocks (the first two columns), short-term leverage increases upon impact, and so does dispersion in TFPR and OPH. Long-term leverage cannot move on impact (due to time-to-build and the definition of interperiod borrowing), and so increases with a delay in the interest rate shock experiment, as expected. Notably, long-term leverage decreases in response to a productivity shock, as firms immediately generate revenue that allows them to internally finance, leading to lower intertemporal leverage. In the collateral constraint shock experiment, short-term and especially long-term leverage decline, as anticipated, while dispersion rises.
Productivity Shock: Relationship between Leverage and Dispersion.
Notes: Deviations from Steady state, in percentage points, to shock in $t+h$
. Short-term Debt is “working capital” or intraperiod financing. Long-term Debt is interperiod borrowing. Each column corresponds to the shock depicted in row 1.
$t+h$
. Short-term Debt is “working capital” or intraperiod financing. Long-term Debt is interperiod borrowing. Each column corresponds to the shock depicted in row 1.

The response of productivity dispersion in both the productivity shock and collateral constraint experiments is short-lived, falling back to (or below) the initial level by the second period. Thus, the persistent responses in OPH dispersion seen in the empirical results are only accounted for in the interest rate model. Intuitively, a productivity shock generates some demand for credit, but it also creates immediate sources of internal financing, leading to constraints that do not bind as tightly. Perhaps a shock that builds then dissipates would generate more persistent responses. On the other hand, interest rate shocks induce additional demand of external finance but provide no immediate internal financing boost. This leads to increased credit demand and binding constraints, and thus more dispersion. Furthermore, so long as interest rates are low today vs. tomorrow, firms pull forward investment plans in anticipation of higher future interest rates, so leverage remains higher for longer. Finally, tighter collateral constraints force firms to reduce leverage, but as the constraint begins to relax, firms have the opportunity to accumulate assets to help ease constraints further.
The bottom row gives the path of implied misallocation from Bils et al. (Reference Bils, Klenow and Ruane2021). The response of measured misallocation is an economically meaningful, if modest decline of 0.7 percentage points in the productivity shock experiment and 0.5 percentage points in the interest rate shock experiment. Intuitively, this means financial frictions generate a drag of more than half a percentage point on GDP growth in the model. The drag on growth is less substantial in the collateral constraint case (0.05 percentage points), although the shock is relatively small.
Overall, interest rates shocks are a promising candidate mechanism for generating similar responses to the data. I now make a more direct comparison to the empirics. First, I take the initial change in leverage in each experiment and treat it as a “shock” to leverage that I can use to generate implied predicted values from the estimated models in Section 4. That is, I take the estimated coefficient on leverage in 23 multiplied by the change in leverage in the model and generate predicted changes in dispersion along each time horizon $t+h$
.Footnote
21
For long-term leverage, the “leverage shock” is obtained from period
$t+h$
.Footnote
21
For long-term leverage, the “leverage shock” is obtained from period $t+1$
since long-term leverage cannot change initially.
$t+1$
since long-term leverage cannot change initially.
Interest Rate Shock: Relationship between Leverage and Dispersion.
Notes: Predicted values in response to deviation in leverage from model in Section 4.2 for horizons $t+h$
, shaded areas represent
$t+h$
, shaded areas represent $\pm 1.96*SE$
. Response to initial period (t + 0) in the first period, period t + 1 for long-term leverage.
$\pm 1.96*SE$
. Response to initial period (t + 0) in the first period, period t + 1 for long-term leverage.

Figure 6 presents results from the productivity shock experiment. Responses are qualitatively similar, with TFPR and OPH increasing in response to short-term leverage. However, the response for TFPR is small while the response of OPH is larger than what is observed in the data. Likewise, both are relatively short-lived compared to the data. However, it is possible that persistent or permanent productivity shocks could generate the more persistent patterns seen in the data.
Since long-term leverage declines in the productivity shock experiment, predicted dispersion in the long-term leverage model decreases, although it is statistically indistinguishable from zero. While the implied model response is within the error bands, this result further highlights the discrepancy between the experiment and the empirical response to short-term debt. The lack of a persistent increase in leverage, long- and short-term, means that the model does not generate a persistent response, and in fact overshoots slightly in the second period.
Collateral Constraint Shock: Relationship between Leverage and Dispersion.
Notes: Predicted values in response to deviation in leverage from model in Section 4.2 for horizons $t+h$
, shaded areas represent
$t+h$
, shaded areas represent $\pm 1.96*SE$
. Response to initial period (t + 0) in the first period, period t + 1 for long-term leverage.
$\pm 1.96*SE$
. Response to initial period (t + 0) in the first period, period t + 1 for long-term leverage.

Figure 7 shows the response of productivity dispersion to the period of low interest rates considered in the second column of Figure 5. Panel (a) shows a fairly tight fit of the quantitative model to the empirics, as the path of TFPR dispersion in the model lies within 1.96 standard errors of the point estimate from the empirical model for the entire time horizon. Likewise the small response to long-term leverage is reasonable compared with the data.Footnote 22 The response of output per hour dispersion, while qualitatively consistent with the data, is quantitatively much larger in the model. This is perhaps due to the inelastic labor supply, which generates a much larger increase in wages. Still, the model generates a similarly persistent response to the data, and fits closely to the data at longer time horizons. Estimated responses to long-term leverage changes are not distinguishable from zero. The model produces a response which is relatively small and reverts to zero quickly.
Finally, Figure 8 presents the collateral constraint experiment comparison to the data. This shock generates counterfactual responses of dispersion to leverage, as dispersion increases while short-term leverage falls. The empirical model predicts the opposite. This is not to say that such shocks do not happen, but that they are not responsible for the patterns observed in the data via the empirical model estimated in Section 4.
IRF: Productivity Dispersion correlation to Change in Inventory-Sales Ratio at Year 0.
Notes: Predicted values in response to deviation in leverage from model in Section 4.2 for horizons $t+h$
, shaded areas represent
$t+h$
, shaded areas represent $\pm 1.96*SE$
. Response to initial period (t + 0) in the first period, period t + 1 for long-term leverage.
$\pm 1.96*SE$
. Response to initial period (t + 0) in the first period, period t + 1 for long-term leverage.

5.8 Discussion
The model successfully generates labor productivity dispersion in excess of TFPR dispersion. The inclusion of an undistorted input margin (materials) is crucial to this result. Furthermore, the data suggest that among the shocks considered in this paper, interest rate shocks are the most promising candidate for explaining the empirical patterns documented in Section 4.2. The model implies that leverage and productivity dispersion positively co-move in response to the shock, consistent with the data, and the dynamic path for TFPR is quantitatively similar.
The shortcomings of the model include relatively low productivity dispersion and large responses of labor productivity dispersion to shocks, especially interest rate shocks. The lack of additional frictions or distortions could be responsible for the first shortcoming, especially the lack of frictions on materials, the largest share of input costs. Future work could consider how financial frictions might apply to materials. This is particularly of interest given the relative importance of inventories in the empirical results, and in serving as collateral as documented by Caglio et al. (Reference Caglio, Darst and Kalemli-Özcan2021). The response of labor productivity is likely in part due to the responsiveness of wages, and alternative labor supply assumptions might yield more muted dispersion responses.
Quantitatively, implied misallocation, according to the measure specified in Bils et al. (Reference Bils, Klenow and Ruane2021), is modest compared to the data, but within the historical range. Responses of misallocation to shocks are economically meaningful, and suggest that financial frictions could create a drag on productivity as credit demand expands. To the extent these frictions can be relaxed, then welfare can be improved by allowing for expanded credit and reducing misallocation. A natural response would be to seek ways to ease credit conditions for firms, but appropriate policy must take into account the margins on which credit interventions act. If a policy acts only on the price margin (i.e. lower interest rates), then it only serves to expand credit demand, which could lead to more dispersion. This may or may not positively impact welfare, but the empirics and theory detailed in this paper agree it will only increase measured misallocation. However, relaxing the constraint itself will likely reduce misallocation. This suggests that the ability to obtain credit, given a price, is a more important margin to act on if the goal is to reduce misallocation.
6. Conclusion
The relationship between financial frictions and misallocation is much debated. I contribute on two fronts. First, using new publicly available data on within-industry productivity dispersion, I document a positive relationship between leverage and productivity dispersion. I detail how the relationship varies across long and short term leverage and different productivity concepts (TFPR and OPH). I find that both labor and total factor productivity dispersion move positively with short-term leverage, while only TFPR dispersion varies significantly with long-term leverage. Further, the relationship between labor productivity dispersion and leverage is relatively persistent.
Second, I show models of firm dynamics with financial constraints can replicate some of these findings, although it is not immediately obvious from inspecting firm decision rules. A quantitative evaluation of the model reveals that leverage and productivity dispersion can co-move positively, but only in response to certain shocks. In particular, interest rate shocks match the empirical results qualitatively, and track them fairly closely from a quantitative perspective. Productivity shocks are qualitatively similar to the empirical results, but do not match the quantitative response in either magnitude or persistence. Collateral constraint shocks do not align with the empirics qualitatively, and so are likely not the dominant driver of the relationships found in the data.
Collectively, these findings suggest developments that induce changes to credit demand, without affecting the productive capacity of firms directly, are important for explaining the relationship between leverage and productivity dispersion. Relaxation in interest rates faced by firms is one such shock. The implied misallocation in this case is modest but notable, suggesting a decline in allocative efficiency of 0.5 percentage points in response to a 1 percentage point change in interest rates. This drag on output of half a percentage point suggests meaningful improvements to welfare could be achieved through reduced credit frictions.
Supplementary material
The supplementary material for this article can be found at https://doi.org/10.1017/S1365100525000203.
Acknowledgements
I am indebted to John Haltiwanger, Şebnem Kalemli-Özcan, and Borağan Aruoba for helpful guidance and support, as well as Luminita Stevens and Laura Veldkamp for additional advice. I thank the participants and discussant of the paper at the Liberal Arts Macro Conference for their feedback, as well as Veronika Penciakova. I am also a schedule A employee of the US Census Bureau.


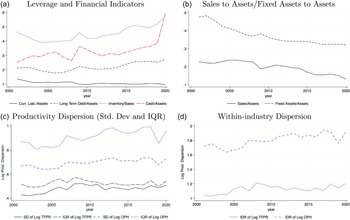
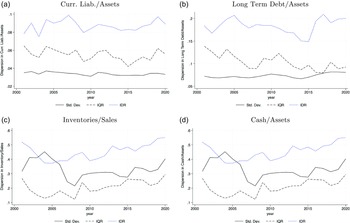

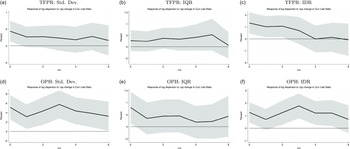


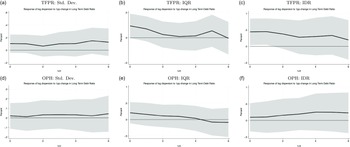


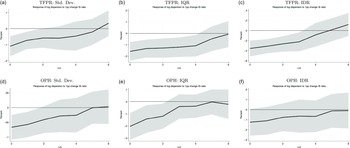


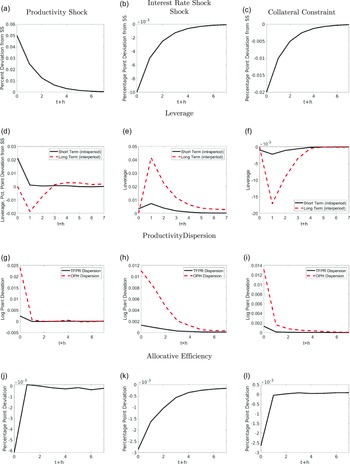

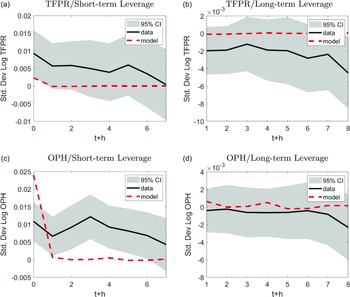


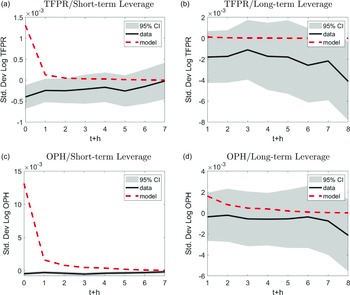


 Open access