

INTRODUCTION
Measles and meningococcal meningitis are both directly transmitted human diseases and significant public health issues in West Africa [Reference Grais1, Reference Molesworth2]. They are epidemiologically and biologically very different; while the comparatively simple dynamics of measles are fairly well understood, the complex transmission dynamics of meningococcal meningitis has been difficult to characterize. In this study, we apply well-known patterns of measles epidemiology and transmission to gain insight into the dynamics of meningococcal meningitis transmission by contrasting weekly time-series of reported measles cases and suspected meningococcal meningitis cases at the spatial scale of Niger's 38 health districts.
Measles is strongly immunizing, both natural infection and the inexpensive vaccine confer long-term immunity; measles predominantly infects children until high vaccination coverage is achieved. Susceptible individuals become infected through direct contact with an infected individual and recover fully in approximately 14 days. The resulting simple, recurrent patterns have made measles an ideal system for studying the dynamics of acute immunizing infections [Reference Earn3, Reference Bjornstad, Finkenstadt and Grenfell4]. Spatial dispersal of measles cases also reveals important information about human movement and density of contacts that result in disease transmission [Reference Bharti5, Reference Grenfell, Bjornstad and Kappey6]. Similarly, spatial patterns of human movement are highly relevant for understanding meningococcal meningitis transmission (see below) but cannot be extracted from reported meningococcal meningitis cases alone.
In pre-vaccine industrialized nations, outbreaks of measles typically occurred at regular intervals with strong spatial synchrony [Reference Grenfell, Bjornstad and Kappey6]. Locally, measles persists above a critical community size (CCS), below which it goes stochastically extinct, or fades out (Fig. S1 a, online). Routine vaccination has successfully interrupted endemic measles transmission in many regions of the world, although it persists in parts of Africa and Asia, and other areas where only patchy vaccine coverage is achieved [Reference Strebel7].
Today, in the West African nation Niger, measles outbreaks occur only during the dry season (Fig. 1 a), when urban population density is thought to peak, favouring transmission [Reference Ferrari8]. Very high birth rates, patchy routine vaccine coverage, and strong seasonal transmission increase the CCS for measles in Niger by an order of magnitude compared to previously observed values [Reference Ferrari8, Reference Bartlett9]. Following local extinctions, measles is consistently reintroduced along frequently travelled routes, particularly transnational primary roads [Reference Bharti5].
(a) Seasonal outbreaks of meningococcal meningitis (red) align with those of measles (grey) and both are strongly out of phase with rainfall (blue). Shaded areas are ±1 standard deviation. (b) Map of Africa with the meningitis belt shaded in red (adapted from [48]) and Niger outlined in blue. (c) Pair-wise correlation by distance for all districts for reported meningococcal meningitis incidence [red, regional synchrony=0·35(0·26, 0·43)] and reported measles incidence [black, regional synchrony=0·31(0·26, 0·37)].

Meningococcal meningitis (meningococcus) is caused by the bacterium Neisseria meningitidis, and similarly to measles, it is transmitted by direct contact with saliva or respiratory droplets from infected individuals. Unlike measles, the duration of infection can vary greatly and immunity is relatively short-lived [Reference Stollenwerk, Maiden and Jansen10], resulting in a broad age range of infections, predominantly in those aged between 2 and 30 years [Reference Moore11–Reference Greenwood13]. Different serogroups of N. meningitidis circulate, including multiple serosubtypes. These have low levels of cross-immunity and contribute to re-infection [Reference Stollenwerk, Maiden and Jansen10].
Asymptomatic carriers of N. meningitidis unknowingly harbour the bacteria with no signs of disease and are probably important for transmission [Reference Trotter, Gay and Edmunds14]. Unfortunately, transmission during asymptomatic carriage is poorly understood. The proportion of carriers in a population is difficult to assess, with estimates ranging from 3% to 30% [Reference Trotter and Greenwood12] while the duration of carriage varies between a half-life of 3 months [Reference Blakebrough15] and an upper bound of 10 months [Reference Boisier16] (although these do not consider host or pathogen variation such that longer term carriage can neither be refuted nor supported [Reference Trotter and Greenwood12]). The current lack of information on carriage, including seasonal prevalence and prevalence during and between epidemics, hinders our understanding of meningococcal meningitis epidemiology. Field studies examining levels of carriage in the African belt through each season and during different phases of epidemics will provide important information on meningococcal meningitis transmission.
Cases of meningococcal meningitis occur worldwide but the highest rates of incidence are found in a region known as the meningitis belt [Reference Molesworth2, Reference Lapeyssonnie17] (Fig. 1 b). Throughout the belt annual rainfall ranges between 300–1100 mm [Reference Lapeyssonnie17] and cases peak during the dry season and decrease abruptly when the rainy season begins (Fig. 1 a). This sub-Saharan African region is characterized by hyperendemic meningitis and seasonally recurring large outbreaks. Niger straddles the boundary of this belt with high environmental diversity, as the northern districts are primarily sparsely populated desert regions and the southern districts are densely populated and agriculturally viable. Within the belt, epidemics can be widespread, such as the outbreak in 1996, which caused over 250 000 cases throughout the region [18] with a 10% case-fatality rate (50% if untreated) and a 20% rate of permanently debilitating survivors [18].
The very existence of the African belt and the strong seasonal incidence of meningococcal meningitis within it indicate a link between meningococcal meningitis and environmental components, such as humidity, rainfall, and wind [Reference de Chabalier19–Reference Sultan21]. One popular hypothesis suggests that the dry dusty winds of the seasonal Harmattan cause mechanical damage to mucosal membranes. The resulting small scratches prime the throat for bacterial invasion and increase susceptibility to meningococcal meningitis infection [Reference Moore11, Reference Sultan21]. Additionally, higher absolute humidity may either decrease meningococcal meningitis transmission by reducing the viability of infectious respiratory droplets or decrease the proportion of meningococcal meningitis carriers by promoting healthy mucosal tissue [Reference Cheesbrough, Morse and Green22].
Across the African belt, the magnitude of meningococcal meningitis outbreaks is highly erratic and unpredictable [Reference de Chabalier19, Reference Yaka20]. Due to strain variation and waning immunity (~3 years) [Reference Stollenwerk, Maiden and Jansen10, Reference Moore11], vaccination in the meningitis belt is typically done reactively based on case surveillance [18], emphasizing the importance of early detection of the disease and rapid reactive vaccination of the at-risk population with bivalent A/C or trivalent A/C/W135 polysaccharide vaccines managed by a global stockpile of limited supply. Thus, local spatial variation is extremely important in early outbreak detection and response [Reference Grais23]. While environmental factors influence the broad range of meningococcal meningitis, they do not explain the spatial variation in incidence and prevalence within the meningitis belt.
The recent introduction of a conjugate vaccine for serogroup A has raised hopes that herd immunity will eliminate outbreaks. However, surveillance and reactive vaccination remain the predominant strategies for managing meningococcal meningitis outbreaks, including serogroups C, W135, and X, which are not directly affected by the new conjugate vaccine but may be impacted by reduced competition for hosts. Additionally, despite the ongoing efforts of routine immunizations, such as measles vaccine, outbreaks of preventable diseases continue to occur worldwide. This demonstrates the difficulty of achieving and maintaining sufficiently high vaccine coverage levels in areas lacking strong public health infrastructure and emphasizes the importance of vigilant surveillance. As with any vaccine-preventable outbreak, early reactive vaccination (prior to the peak of the epidemic) slows transmission in the initial stages of the epidemic and provides the greatest reduction in morbidity and mortality [Reference Grais24]. Identifying the underlying triggers of meningococcal meningitis epidemics and developing tools to detect and predict the timing and location of outbreaks in the African belt are major public health priorities.
Host movement and disease dynamics
Due to its highly infectious nature, measles easily invades and quickly moves through populations. Measles fades out seasonally through much of Niger [Reference Ferrari8] and is later reintroduced [Reference Bjornstad and Grenfell25] by the movement of infected individuals [Reference Bharti5]. Although movement and reintroductions occur throughout the year, measles epidemics do not. This is probably due to seasonal increases in levels of urban host density [Reference Ferrari8], a mechanism which has been shown to trigger measles outbreaks [Reference Fine and Clarkson26].
In contrast to measles, meningococcal meningitis is a slow progressing disease that may not go locally extinct during the rainy season during periods with zero reported cases. Undetected asymptomatic carriers can cause reappearances of reported cases following long absences without breaking local chains of transmission. Suspected cases are thought to reappear in conjunction with favourable conditions of climate and demography [Reference Molesworth2, Reference Yaka20]. Interestingly, at small spatial scales, locations that share environmental and climatic conditions report different rates of meningococcal meningitis incidence. Although silent transmission between asymptomatic carriers probably occurs frequently, transitions from an absence of suspected cases to a presence of cases represents a distinct and important subset of either transmission or importation events because these represent a source of disease. Investigating the spatial patterns of these events and the underlying factors, which result in either sporadic cases or large outbreaks, can improve our understanding of meningococcal meningitis transmission. Here, we investigate the influence of host movements as possible contributing factors to local meningococcal meningitis incidence, particularly reappearances following an absence of reported disease.
Until now, in comparison to environmental and climatic factors, seasonal patterns of host movement and density were thought to be relatively unimportant for the onset of seasonal meningococcal meningitis outbreaks [Reference Moore11]. (Large groups of displaced individuals may be epidemiologically important, a point which we return to in the Discussion.) In contrast, spatial patterns of measles outbreaks and reintroductions are based largely on host population movement and aggregation. To assess similarities and differences between the underlying mechanisms of local increases in measles and meningococcal meningitis, we compare spatial patterns of reported cases of suspected meningococcal meningitis reappearance with those of measles reintroductions.
By comparing the spatial patterns of measles to those of meningococcal meningitis in Niger, we re-evaluate conventional ideas regarding the impact of population movement and density in meningitis dynamics. Recently, Bharti et al. [Reference Bharti5] analysed spatial patterns of measles fadeouts and reintroduction rates to identify epidemiologically important districts in Niger for reintroductions and early outbreak detection [Reference Bjornstad, Finkenstadt and Grenfell4, Reference Bartlett9]. Using detailed spatio-temporal incidence for meningococcal meningitis in Niger, we complete a similar analysis to identify epidemiologically important districts for meningococcal meningitis by analysing absences of suspected cases during the troughs between epidemics. To further measure epidemic importance, we determine the rate of reappearance of suspected meningococcal meningitis by district and compare this to measles reintroduction rates by district [Reference Bharti5, Reference Bjornstad and Grenfell25].
METHODS
Reported cases and spatial correlation
The case definition for meningococcal disease caused by N. meningitidis is briefly outlined here (taken from [27]). A possible case is defined as a patient meeting the clinical criteria. To meet the clinical criteria, the patient must have at least one of the following five symptoms: fever, meningeal signs, petechial rash, septic shock, or septic arthritis. A probable case is any patient meeting the clinical criteria and the epidemiological criteria. To meet the epidemiological criteria, the patient has to have an epidemiological link by human-to-human transmission. A confirmed case is any person meeting the laboratory criteria, which indicates at least one of the following four laboratory results: isolation of N. meningitidis from a normally sterile site, detection of N. meningitidis nucleic acid from a normally sterile site, detection of N. meningitidis antigen in cerebrospinal fluid (CSF), or detection of Gram-negative diplococcus in CSF.
Weekly surveillance reports of meningococcal meningitis cases from 1986 to 2005 from all 38 health districts (35 districts and three urban districts) in Niger were obtained from a national surveillance system of the World Health Organization (WHO) (Fig. S2, online) [28]. These reports capture all suspected and probable cases taken from patients presenting at a healthcare facility with meningitis-like symptoms. A portion of these suspected cases underwent lumbar puncture procedure with a CSF sample submitted for laboratory analysis. These samples were tested for the presence of meningitis-causing bacteria. Samples testing positive for N. meningitidis may further have the serogroup determined. Many samples testing negative for N. meningitidis were identified as Streptococcus pneumoniae while others were found to be negative for all tested agents. However, during an epidemic of meningococcal meningitis, most suspected cases of meningococcal meningitis are likely to fulfil both the clinical and epidemiological criteria and are therefore classified as probable cases. Because of the severity of meningococcal meningitis infection, underreporting of suspected cases is believed to be relatively low throughout the meningitis belt [see Text S1 (online) for analysis of reporting rates].
We also obtained weekly reported measles cases from 1995 to 2004 [Reference Ferrari8] from the 38 health districts in Niger from the Ministry of Health of Niger [29]. Weekly measles reports were not available at the same spatial scale for each of the years matching meningococcal meningitis surveillance.
To assess the spatial spread of measles and meningococcal meningitis in Niger, we measured the correlation of reported cases with distance by using pair-wise comparisons of the time-series across all possible pairs of district centroids for each disease.
Total fadeouts and population size
Two or more consecutive weeks with no reported measles cases is defined as a fadeout, with the length of a fadeout determined by the number of weeks with zero cases (such that a 1-week fadeout cannot exist, as explained below, but a fadeout with length of three refers to three consecutive weeks with zero reported cases; consistent with [Reference Bharti5]). Due to the infectious period of measles (~2 weeks), single weeks with zero reported cases are not considered ‘fadeouts’ because they do not suggest a broken chain of transmission. Consecutive fadeouts of measles (which exceed the minimum length of 2 weeks) are defined as inter-epidemic periods. For consistency, the same 2-week threshold is used to define an absence of suspected meningococcal meningitis cases. It is important to note that due to the occurrence of long-term carriage of meningococcal meningitis, the absence of cases does not necessarily imply a break in the chain of transmission and thus the term ‘fadeout’ is not appropriate (we return to this point in the Discussion). For meningococcal meningitis, consecutive absences of suspected cases are also defined as inter-epidemic periods.
Although weekly ‘attack rate’ thresholds are generally used for the purposes of reactive meningitis vaccination in the African belt (5 cases/100 000 inhabitants defines the district alert threshold, 10 cases/10 000 inhabitants defines the district epidemic threshold), using the district population size to interpret the number of cases could reduce the detectable effects of density and spatial progression of low levels cases; i.e. early in an epidemic or with reappearances of suspected cases. This approach also introduces a dimension of uncertainty, as the actual number of people in any district is unknown. To avoid weakening signals of density effects and host movement, we avoid the use of attack rates in this analysis. Due to the convention of using the alert and epidemic thresholds in meningitis control, we completed similar analyses using the conventional thresholds and the results are presented in Text S2 (online).
The negative relationship between the proportion of weeks with zero reported measles cases (or the number of fadeout weeks in the time-series) and population size is well understood [Reference Bjornstad, Finkenstadt and Grenfell4, Reference Bartlett9] (Fig. S1 a, online). We have previously demonstrated the presence of this relationship during this study period for measles in Niger [Reference Bharti5, Reference Ferrari8]. We focused our comparative analysis on the residuals from the relationship between proportion of weeks with zero reported cases and population size for both measles and meningococcal meningitis. For any directly transmitted disease, districts with the fewest fadeouts or absences relative to population size (negative residuals from a linear regression) are important for the regional spread of each disease; these districts either have a greater number of disease reintroductions or higher rates of local transmission than expected. In this analysis, districts with negative residuals for both measles and meningococcal meningitis are likely to be important in spatial coupling and connectivity. We refer to these as potential hotspots and focus this analysis on those districts.
Rates of reintroduction and reappearance
We used the length of local disease fadeouts and absences (the number of consecutive weeks with zero reported cases) to inversely measure the rate of reintroduction and reappearance for measles and meningococcal meningitis, respectively. This provides insight on spatial connectivity and human movement [Reference Bjornstad and Grenfell25]. Using a Cox proportional hazard regression model, we fit the length of the inter-epidemic periods as a waiting time to determine the hazard rate of reintroduction for measles (similar to [Reference Bjornstad and Grenfell25] and as in [Reference Bharti5] for measles) (Fig. S1 b, online). Accounting for population size, we compared the rates of reintroduction and reappearance for measles and meningococcal meningitis, respectively, from the potential hotspots to those of all the other districts for each disease.
We observed that disease-reporting rates may vary between districts and could lead to biases in the detection of hotspots. We addressed this in two separate analyses; first by increasing the minimum threshold for the definition of a fadeout from 2 weeks to 4 weeks and second by estimating disease-reporting rates by district from measles incidence (Text S1, online).
Environment and settlement data
Niger's district population sizes were obtained from the official census reports from Niger. These values are based on the 2001 census and are projected both forward and backward based on district-specific growth rates [30].
Daily rainfall estimates were obtained from 2003 to 2006 from NOAA's Climate Prediction Center's CPC Morphing Technique [31]. We determined an annual rainfall curve by fitting a smoothing spline with 3 degrees of freedom to the mean of the daily national total of each year.
Esri shapefiles for administrative boundaries were obtained from Global Administrative Areas v. 0.9 (GADM) [Reference Hijmans32]. Road maps were obtained from the USGS early warning roads file [33], VMAP0 [34], and from the Visual Media Unit in the Communications and Information Services Branch of the United Nations Office for the Coordination of Humanitarian Affairs. These three maps were manually merged to obtain the highest possible resolution of primary roads.
RESULTS
Seasonal incidence and spatial correlation
As noted earlier, the seasonal incidence of measles and meningococcal meningitis is very similar (both peak during the dry season and decrease at the onset of the rainy season), although suspected cases of meningococcal meningitis decrease more severely than measles incidence (Fig. 1 a).
Despite marked differences between the natural history and the impact of the environment on measles and meningococcal meningitis, we found that both diseases showed a similar pattern of spatial correlation of incidence and similar values for regional synchrony (0·35±0·09 and 0·31±0·06 for meningococcal meningitis and measles, respectively) (Fig. 1 c).
Population size and fadeouts
The relationship between population size and total number of fadeouts and absences showed an overall similar negative relationship for both measles [Reference Bharti5, Reference Ferrari8] (P<0·01, R 2=0·28, correlation=–0·53) and meningococcal meningitis (P<0·01, R 2=0·52, correlation=–0·72) (Fig. 2 a, b). Although the linear correlation value is not very strong, this may be due to the spatial aggregation of local fadeout dynamics, which may have a negative nonlinear relationship at the district scale [Reference Keeling and Grenfell35]. This pattern was expected for measles but not necessarily for meningococcal meningitis if long-term carriage during inter-epidemic periods generates strong local persistence [Reference Rohani, Earn and Grenfell36]. Even more marked, the residuals from these relationships (i.e. correcting for population size) were positively correlated for the two diseases [P<0·01, R 2=0·45, correlation=0·77, Fig. 2 d, see Fig. S3 (online) for discussion about the outlier, Niamey]; in other words, relatively high or low persistence of one disease in a district indicated similar persistence for the other disease.
(a) Number of fadeouts weeks per year against population size for each district for meningococcal meningitis. Grey line is the best-fit line. Grey points show districts with negative residuals. (b) As for panel (a) for measles (adapted from [Reference Bharti5]). (c) Map of Niger showing all 38 districts, including three urban districts. The 15 districts that have negative residuals for both measles and meningococcal meningitis are shaded in grey. (d) Residuals from panel (a) plotted against residuals from panel (b), grey points show the 15 joint potential hotspots [grey districts from panel (c)], size of points correlates to district population size. (e) Residuals of mean length of inter-epidemic periods on population size for the 15 joint potential hotspots in grey [grey districts from panel (c)] and all other districts in black for meningococcal meningitis (left) and measles (right) (adapted from [Reference Bharti5]).
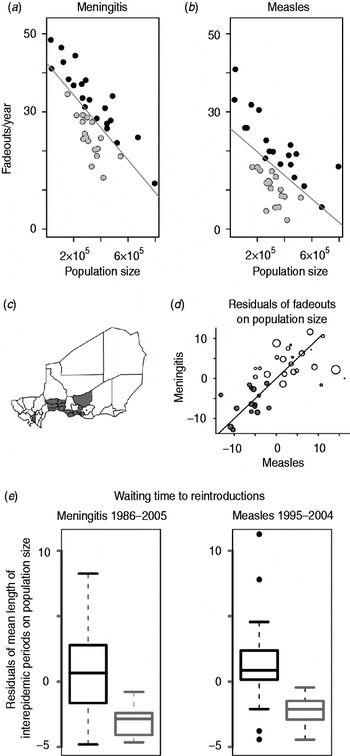
To detect relative ‘hotspots’ for disease reintroduction, we identified districts with negative residuals of fadeouts and absences for each disease [Reference Bjornstad, Finkenstadt and Grenfell4]. We identified 19 districts with negative residuals of measles fadeouts on population size [Reference Bharti5] (Fig. 2 a), and 17 districts with negative residuals of meningococcal meningitis absences on population size (Fig. 2 b). Fifteen districts had negative residuals of fadeouts (or absences) on population size for both diseases (Fig. 2 c); we focused on these as joint potential hotspots.
Rates of reintroduction and reappearance
The length of inter-epidemic periods provided an inverse measure of the rate of reintroduction of measles and reappearance of meningococcal meningitis for each district [Reference Bjornstad and Grenfell25] (Fig. S1 b, online). Not surprisingly, population size was positively correlated with the rate of reintroductions (or reappearances) by district for both diseases (for meningococcal meningitis P<0·01. R 2=0·37, correlation=0·64; for measles P<0·01, R 2=0·24, correlation=0·33, Fig. 2 e), indicating that reintroductions and reappearances were more likely in more populous districts. More importantly, we found that the 15 districts classified as ‘joint potential hotspots’ had a significantly higher rate of reintroductions and reappearances relative to population size for both diseases compared to the other 23 districts (P<0·01 for meningococcal meningitis, P<0·01 for measles) (Fig. 2 e). Results were unchanged when the fadeout threshold was increased from 2 weeks to 4 weeks. The difference in rate of reintroductions and reappearances between the 15 joint hotspot districts and the remaining 23 districts was not the result of a reporting bias between districts; we found no statistical differences between the reporting rates of joint hotspot districts and the reporting rate of the remaining districts [see Text S1 (online) for full analysis].
DISCUSSION
Comparative approaches to disease dynamics, such as the present analysis, can strengthen our understanding of spatio-temporal risks for human diseases [Reference Rohani, Earn and Grenfell37]. Here we show that the seasonal patterns of incidence of meningococcal meningitis are very similar to those of measles (Fig. 1 a). Previous studies have shown that measles dynamics are strongly influenced by birth rates and seasonal aggregation of the host population (such as school terms [Reference Fine and Clarkson26] and possibly agricultural cycles [Reference Ferrari8]), although not directly by environmental factors. In contrast, it is widely believed that meningococcal meningitis dynamics are largely determined by environmental components and their impact on the susceptibility of the host population [Reference Molesworth2, Reference Sultan21], with immune status and vaccine coverage playing important roles. It is currently unknown whether rates of meningococcal meningitis carriage vary markedly by season in the region [Reference Greenwood13, Reference Blakebrough15] and environmental factors in the meningitis belt have not definitively been shown to enhance the transmission of N. meningitis between hosts [Reference Blakebrough15], such that the possibility of non-environmental triggers cannot be eliminated. Seasonal incidence for both measles and meningococcal meningitis peaks when population density is thought to be increasing [Reference Ferrari8], which would improve the spread of a directly transmitted pathogen.
Meningococcal meningitis and measles also exhibit very similar spatial patterns; the correlation between incidence and distance (Fig. 1 c) is unexpectedly high for these two infections, given their very different epidemiology. More marked is the highly correlated spatial pattern of weeks with zero reported cases, both in absolute terms and when correcting for population size (Fig. 2 a–d). The overwhelming similarity between the spatial distribution of the hotspots for measles and meningococcal meningitis as well as the similar rates of reintroduction (or reappearance) for both diseases suggests that meningococcal meningitis progresses spatially in a manner similar to measles. This indicates that human contact, movement, and aggregation could be important contributing factors in the local spatial dynamics of meningococcal meningitis. These hotspot districts are likely to be in frequent contact with the dense northern states of Nigeria, as they lie along primary roads only a short distance away. Niger has seven primary roads that cross its national border, four of which cross the Niger–Nigeria border. These transnational primary roads to Nigeria cross through 13 of the 17 hotspots identified in this analysis. Another two of the 17 hotspots districts contain primary roads within Niger, which connect two of the three transnational primary roads that cross between Niger and Nigeria. Only two of the 17 districts identified in this study did not contain primary roads. A previous study has shown the relative importance of these transnational primary roads for measles importations based on fadeout patterns and incidence following national immunization activities [Reference Bharti5].
Host movement and density have impacted meningococcal meningitis transmission throughout the history of meningococcal outbreaks during the Hajj, an annual, 5-day pilgrimage from Mecca that often draws 1–2 million individuals. During the Hajj, the number of monthly meningococcal meningitis cases has consistently increased in Saudi Arabia and large outbreaks occurred during the Hajj in 1987 [Reference Moore38], 1992 [Reference Al-gahtani39], 2000 and 2001 [Reference Trotter, Gay and Edmunds14]. As a result, proof of meningococcal vaccination is now required with a Hajj visa application [40].
It is important to note that the complex transmission dynamics of meningococcal meningitis make the significance of weeks with zero cases difficult to interpret. Weeks of zero reported cases represent an absence of new cases of suspected meningococcal meningitis but not necessarily a broken chain of transmission, due to asymptomatic carriage. Therefore, reported cases of meningococcal meningitis that follow zero cases represent the reappearance of suspected cases. Although the mechanism underlying these reappearances is not clearly understood, identifying districts where possible cases of meningococcal meningitis reappear most frequently is clearly important progress in both intervention and disease management.
This study defines districts where targeted surveillance and early action can have an important impact for reactive immunization campaigns. The new conjugate meningitis vaccine provides longer-term immunity, which may shift the focus of vaccination from reactive control to preventative coverage [Reference Kieny and LaForce41]. Identifying districts with high rates of meningococcal meningitis persistence and frequent reappearance will continue to be useful with the new management strategy monitoring circulating serogroups of N. meningitidis. The conjugate vaccine protects solely against serogroup A, which may decrease the competition for hosts for other serogroups and increase their prevalence.
In analysing the dynamics of meningococcal meningitis, previous and ongoing studies have identified a pattern of a primary acute respiratory viral infection followed by a secondary bacterial disease [Reference Brundage42–Reference Mueller45]. These studies suggest that a primary viral infection may either increase susceptibility to, or exacerbate the severity of, a later bacterial infection. Interestingly, a specific relationship between influenza and serogroups of N. meningitidis has been shown in various settings [Reference Brundage42, Reference Harrison43, Reference Mueller45, Reference Hubert46].
Although these specific associations between influenza and meningococcal meningitis are best documented outside the meningitis belt and little is definitively known regarding influenza incidence in Niger, there are indications that the seasonality of influenza is similar to that of meningococcal meningitis [Reference Viboud, Wladimir and Simonsen47]. Future work can address this hypothesis and influenza surveillance may ultimately provide valuable insight for understanding meningococcal meningitis seasonality. An acute infection (such as influenza) would probably show spatial patterns similar to measles and could ‘steer’ meningococcal meningitis down the same spatial paths, thus explaining the nearly identical ‘hotspots’ between the acute infection of measles and the slow progressing meningitis. If meningococcal meningitis in the African belt lags influenza, or some other acute infection, identifying this pattern would be an important step towards a mechanistic understanding of the seasonality of meningococcal meningitis and the role of population density. This may provide some predictive power for outbreaks in the meningitis belt.
CONCLUSIONS
Although environmental factors such as humidity, rainfall, and wind are likely to be major determinants of meningococcal meningitis outbreaks [Reference de Chabalier19–Reference Sultan21], these do not explain the full extent of spatial and temporal variation in the seasonal outbreaks of meningitis within the African belt, particularly at fine spatial scales. The marked similarities between the overall patterns of measles and meningococcal meningitis suggest that human movement and density of contacts may influence the epidemiology of meningitis, an important point for improving control measures. This is, to the best of our knowledge, the strongest evidence to date for a density effect in seasonal meningococcal meningitis dynamics.
This study brings us one step closer to understanding the spatio-temporal dynamics of meningococcal meningitis epidemics in the African belt. The next steps in this analysis will use dynamic models for measles and meningococcal meningitis to interpret these results while taking into account the complexities of meningitis, including environmental drivers, predisposing infections, serogroup and serosubtype dynamics, and asymptomatic carriage.
NOTE
Supplementary material accompanies this paper on the Journal's website (http://journals.cambridge.org/psm).
ACKNOWLEDGEMENTS
This study was supported by the Bill and Melinda Gates Foundation. M.J.F., A.J.T., and B.T.G. were also supported by the RAPIDD programme of the Science and Technology Directorate, Department of Homeland Security. B.T.G. was also supported by the Fogarty International Center, National Institutes of Health. H.B. was supported by the Intramural Research Group at Fogarty International Center, National Institutes of Health. A.J.T. was also supported by a grant from the Bill and Melinda Gates Foundation (no. 49446). The funders had no role in study design, data collection and analysis, decision to publish, or preparation of the manuscript.
DECLARATION OF INTEREST
None.


