

1 Introduction
Reliability analysis is one of the most conducted analyses in psychology and education. For example, Cronbach’s (Reference Cronbach1951) original paper introducing coefficient alpha (Cronbach’s alpha), arguably the most popular reliability estimate, has been cited over 70,000 times.Footnote 1 Reliability analysis can be classified into at least two approaches. The first one involves conducting reliability analysis under a measurement model that places restrictions on data, such as a factor model or an item response theory model. In this case, reliability estimates are derived from model parameters. For example, coefficient omega (McDonald, Reference McDonald1999; also, see Zinbarg et al., Reference Zinbarg, Revelle, Yovel and Li2005) is an unbiased test-score reliability estimate under the hierarchical factor model, and the test-score reliability coefficient and latent-trait reliability coefficient derived by Andersson et al. (Reference Andersson, Luo and Marcq2022) are unbiased reliability estimates under the multigroup item response theory model. The second approach entails reliability analysis within classical test theory (e.g., Lord & Novick, Reference Lord and Novick1968), a model that does not impose any restrictions on test data. For example, Lord and Novick (Reference Lord and Novick1968, Theorem 4.4.3) proved that Cronbach’s alpha is a lower bound to reliability under any model. This paper considers reliability coefficients under classical test theory (see, e.g., Sijtsma et al., Reference Sijtsma, Ellis and Borsboom2024, for motivations for using classical test theory).
Reliability analysis under the classical test theory model is offered in general data analysis packages such as JASP (Love et al., Reference Love, Selker, Marsman, Jamil, Dropmann, Verhagen and Wagenmakers2019; JASP, 2024), SAS (SAS Institute Inc., 2023), SPSS (IBM Corp., 2021), and Stata (StataCorp., 2023), and also in R packages, such as psych (Revelle, Reference Revelle2024). The output of these software packages include five types of descriptive statistics (Table 1, columns 2–6): (i) item statistics, such as item means and item standard deviations; (ii) scale statistics, such as scale mean, scale standard deviation, and reliability estimators such as Cronbach’s alpha, Guttman’s lambda series (Guttman, Reference Guttman1945), and the split-half reliability coefficient (Guilford, Reference Guilford1936, p. 419); (iii) rest statistics (i.e., scale statistics with one item deleted), such as Cronbach’s alpha if an item were deleted; (iv) inter-item statistics such as correlations and covariances; and (v) item-rest statistics, such as item-rest correlations, which is also known as the corrected item-total correlation or ${R}_{ir}$
statistic. Sometimes, the item-total correlation or
${R}_{ir}$
statistic. Sometimes, the item-total correlation or ${R}_{it}$
statistic is also provided. In this article, the term reliability coefficient is used as a generic label for all statistics reported in a reliability analysis.
${R}_{it}$
statistic is also provided. In this article, the term reliability coefficient is used as a generic label for all statistics reported in a reliability analysis.
Reliability coefficients, number of coefficients produced per analysis for each type of coefficient, and corresponding appendix for SE derivations

Note: Column 1 lists the reliability coefficients for which SEs were derived. Columns 2–6 indicate for six types of coefficients the number of coefficients produced in a single reliability analysis. Column 7 refers to the appendix where SE derivations are provided. $J$
= number of items. App. = appendix.
$J$
= number of items. App. = appendix.
a Covariance matrix is usually not reported, but many reliability estimators are based on inter-item covariances.
Although reliability analysis concerns precision of measurement, software providing reliability analysis generally do not provide standard errors (SEs) or confidence intervals (CIs) for the reliability coefficients. As a result, SEs or CIs are generally not reported (Oosterwijk et al., Reference Oosterwijk, Van der Ark and Sijtsma2019). Because SEs and CIs can be used to quantify the sampling error associated with each reliability coefficient, they allow the researcher to determine whether the sample was large enough to obtain sufficiently precise estimates. For some reliability coefficients, SEs or CIs have been derived, but these SEs have generally not been included in statistical software packages. For example, Feldt et al. (Reference Feldt, Woodruff and Salih1987) derived a CI for Cronbach’s alpha ( $\alpha$
) under the assumption that item scores satisfy the assumptions of an ANOVA model. For a 95% CI, let
$\alpha$
) under the assumption that item scores satisfy the assumptions of an ANOVA model. For a 95% CI, let ${F}_a$
and
${F}_a$
and ${F}_b$
be the critical values of an F distribution with
${F}_b$
be the critical values of an F distribution with $N-1$
and
$N-1$
and $\left(N-1\right)\left(J-1\right)$
degrees of freedom, such that
$\left(N-1\right)\left(J-1\right)$
degrees of freedom, such that $P\left(F<{F}_a\right) = .025$
and
$P\left(F<{F}_a\right) = .025$
and $P\left(F<{F}_b\right) = .975$
. The 95% CI is then estimated as
$P\left(F<{F}_b\right) = .975$
. The 95% CI is then estimated as $\left(1-\left[1-\widehat{\alpha}\right]{F}_b;1-\left[1-\widehat{\alpha}\right]{F}_a\right)$
. Ahn and Fessler (Reference Ahn and Fessler2003) derived SEs for the variance and standard deviation for normally distributed scores:
$\left(1-\left[1-\widehat{\alpha}\right]{F}_b;1-\left[1-\widehat{\alpha}\right]{F}_a\right)$
. Ahn and Fessler (Reference Ahn and Fessler2003) derived SEs for the variance and standard deviation for normally distributed scores: ${\widehat{SE}}_{S_X} = {S}_X/\sqrt{2\left(N-1\right)}$
. Also, Fisher Z-transformation (e.g., Bartlett, Reference Bartlett1993) normalizes the sampling distribution of the correlation coefficient, where
${\widehat{SE}}_{S_X} = {S}_X/\sqrt{2\left(N-1\right)}$
. Also, Fisher Z-transformation (e.g., Bartlett, Reference Bartlett1993) normalizes the sampling distribution of the correlation coefficient, where ${\widehat{SE}}_Z = 1/\sqrt{N-3}$
is the SE of the transformed correlation coefficient. On StackExchange (2020), answers have been provided for the SE of an estimated covariance under a bivariate normal distribution:
${\widehat{SE}}_Z = 1/\sqrt{N-3}$
is the SE of the transformed correlation coefficient. On StackExchange (2020), answers have been provided for the SE of an estimated covariance under a bivariate normal distribution: ${\widehat{SE}}_{C_{XY}} = \left({S}_X^2+{S}_Y^2\right)/\left(2\sqrt{N}\right)$
.
${\widehat{SE}}_{C_{XY}} = \left({S}_X^2+{S}_Y^2\right)/\left(2\sqrt{N}\right)$
.
While most SEs are estimated under the assumption of normally distributed data, this may be unrealistic for bounded discrete scores typically used in reliability analyses, such as scores on dichotomous items. For the reliability coefficients in Table 1, this article provides estimates of SEs under multinomial sampling (see Goodman & Kruskal, Reference Goodman and Kruskal1963, for some examples), which is a relatively unrestrictive assumption suitable for discrete variables.
First, I discuss a two-step general framework for deriving SEs under a multinomial distribution, referred to as the two-step procedure. The two-step procedure was developed in the context of marginal modeling (e.g., Bergsma et al., Reference Bergsma, Croon and Hagenaars2009; Rudas & Bergsma, Reference Rudas, Bergsma, Kateri and Moustaki2023); it is quite flexible and has been used earlier to derive SEs for relatively complicated coefficients, such as Mokken’s scalability coefficients (Kuijpers et al., Reference Kuijpers, Van der Ark and Croon2013a) and norm statistics (Oosterhuis et al., Reference Oosterhuis, Van der Ark and Sijtsma2017). The two-step procedure was designed for discrete data, but Oosterhuis et al. showed that it also allows the derivation of SEs for continuous scores.
Second, I discuss the SEs of the coefficients in Table 1. The derivations are often lengthy and cumbersome and are provided in appendices (see Table 1, last column). Note that Table 1 does not provide an exhaustive list of coefficients used in classical test-theory-based reliability analysis. Some coefficients that are not listed in Table 1 involve the maximum or minimum values observed in sample data (e.g., coefficients ${\lambda}_4$
,
${\lambda}_4$
, ${\lambda}_5$
, and
${\lambda}_5$
, and ${\lambda}_6$
from Guttman’s, Reference Guttman1945, lambda series), and therefore, regularity conditions for computing first-order partial derivatives are not satisfied. Other coefficients (e.g., beta, Revelle, Reference Revelle1979; skewness or kurtosis) were excluded to make the task feasible, but their SEs can also be derived using the two-step procedure.
${\lambda}_6$
from Guttman’s, Reference Guttman1945, lambda series), and therefore, regularity conditions for computing first-order partial derivatives are not satisfied. Other coefficients (e.g., beta, Revelle, Reference Revelle1979; skewness or kurtosis) were excluded to make the task feasible, but their SEs can also be derived using the two-step procedure.
Third, I discuss the bias of the estimated SEs that was examined in a simulation study mimicking educational test data and psychological questionnaire data. Some existing estimates of SEs were included in the simulation study, serving as benchmarks. R code for estimating the SEs and conducting the simulation study, as well as the complete results of the study, is available on the Open Science Framework (Van der Ark, Reference Van der Ark2025).
2 A two-step procedure to derive SEs
Let $X$
be a random variable obtained from administering a test to a simple random sample of
$X$
be a random variable obtained from administering a test to a simple random sample of $N$
respondents, such as an item score, a sum score, or a rest score (i.e., the sum score minus the item score). For the coefficients in Table 1, the SEs of the mean, variance, and standard deviation are based on a single variable
$N$
respondents, such as an item score, a sum score, or a rest score (i.e., the sum score minus the item score). For the coefficients in Table 1, the SEs of the mean, variance, and standard deviation are based on a single variable $X$
. The SEs of the covariance, correlation, and split-half reliability coefficient are based on two variables—denoted by
$X$
. The SEs of the covariance, correlation, and split-half reliability coefficient are based on two variables—denoted by $X$
and
$X$
and $Y$
. Finally, the SEs of the lambda coefficients are based on
$Y$
. Finally, the SEs of the lambda coefficients are based on $J$
item scores—denoted by
$J$
item scores—denoted by ${X}_1,\dots, {X}_j,\dots {X}_J$
. Let
${X}_1,\dots, {X}_j,\dots {X}_J$
. Let $\mathbf{R}$
be a matrix containing all unique response patterns observed in the test administration. The response patterns are assumed to be ordered lexicographically (i.e., last column changes fastest), and the number of observed response patterns is denoted by
$\mathbf{R}$
be a matrix containing all unique response patterns observed in the test administration. The response patterns are assumed to be ordered lexicographically (i.e., last column changes fastest), and the number of observed response patterns is denoted by $K$
. For a dataset containing the responses of 426 respondents to
$K$
. For a dataset containing the responses of 426 respondents to $J = 3$
dichotomous items, Table 2 (upper panel) provides illustrations of
$J = 3$
dichotomous items, Table 2 (upper panel) provides illustrations of $\mathbf{R}$
for response patterns based on a single dichotomous item score (top left), on a dichotomous item score and its rest score (top center), and on all three item scores (top left). In Table 2, all observed scores are integers, but they may also be real-valued.
$\mathbf{R}$
for response patterns based on a single dichotomous item score (top left), on a dichotomous item score and its rest score (top center), and on all three item scores (top left). In Table 2, all observed scores are integers, but they may also be real-valued.
Three examples of response patterns collected in matrix $\mathbf{R}$
(top, for details, see note), and the corresponding frequency vectors (bottom).
$\mathbf{R}$
(top, for details, see note), and the corresponding frequency vectors (bottom).

Note: The examples were based on a test consisting of three dichotomous items. On the left, the two response patterns (0 and 1) produced by a single dichotomous item. In the middle, the six response patterns (00, …, 12) produced by a dichotomous item and its rest score; and the eight response patterns (000, …, 111) produced by all three item scores. In this specific example, all possible response patterns are observed, which needs not be true in general.
Let $\mathbf{n}$
denote the vector of observed frequencies of each row in
$\mathbf{n}$
denote the vector of observed frequencies of each row in $\mathbf{R}$
. Table 2 (lower panel) shows the vectors of observed frequencies for each of the three matrices in the upper panel with example frequencies. The subscripts of the elements of
$\mathbf{R}$
. Table 2 (lower panel) shows the vectors of observed frequencies for each of the three matrices in the upper panel with example frequencies. The subscripts of the elements of $\mathbf{n}$
refer to the corresponding response patterns. Sometimes, it is useful to use a single index
$\mathbf{n}$
refer to the corresponding response patterns. Sometimes, it is useful to use a single index $k$
(
$k$
( $k = 1,\dots, K$
) to indicate the ordering of elements; that is,
$k = 1,\dots, K$
) to indicate the ordering of elements; that is, $\mathbf{n} = {\left[{n}_1,\dots, {n}_k,\dots, {n}_K\right]}^{\mathrm{T}}$
, where superscript T denotes the transpose of a matrix or vector. Let
$\mathbf{n} = {\left[{n}_1,\dots, {n}_k,\dots, {n}_K\right]}^{\mathrm{T}}$
, where superscript T denotes the transpose of a matrix or vector. Let ${K}^{\ast }$
be the total number of possible response patterns. Under the two-step procedure, the values of
${K}^{\ast }$
be the total number of possible response patterns. Under the two-step procedure, the values of $\mathbf{n}$
are assumed to form a random sample of size
$\mathbf{n}$
are assumed to form a random sample of size $N$
from a multinomial distribution,
$N$
from a multinomial distribution, $Mult\left(N,\boldsymbol{\unicode{x3c0}} = {\left[{\pi}_1,\dots, {\pi}_k,\dots, {\pi}_{K^{\ast }}\right]}^{\mathrm{T}}\right),$
which implies that each response pattern has a positive probability of appearing in the data.
$Mult\left(N,\boldsymbol{\unicode{x3c0}} = {\left[{\pi}_1,\dots, {\pi}_k,\dots, {\pi}_{K^{\ast }}\right]}^{\mathrm{T}}\right),$
which implies that each response pattern has a positive probability of appearing in the data.
2.1 Step 1. Deriving the Jacobian of coefficients using the generalized exp-log notation.
Let $\boldsymbol{\unicode{x3b8}}$
be a vector of population coefficients, with sample estimates
$\boldsymbol{\unicode{x3b8}}$
be a vector of population coefficients, with sample estimates $\widehat{\boldsymbol{\unicode{x3b8}}}$
. Except for the inter-item covariance matrix, all coefficients in Table 1 are scalars, and vectors
$\widehat{\boldsymbol{\unicode{x3b8}}}$
. Except for the inter-item covariance matrix, all coefficients in Table 1 are scalars, and vectors $\boldsymbol{\unicode{x3b8}}$
and
$\boldsymbol{\unicode{x3b8}}$
and $\widehat{\boldsymbol{\unicode{x3b8}}}$
reduce to scalars
$\widehat{\boldsymbol{\unicode{x3b8}}}$
reduce to scalars $\theta$
and
$\theta$
and $\widehat{\theta}$
, respectively. First, it must be shown that
$\widehat{\theta}$
, respectively. First, it must be shown that $\widehat{\boldsymbol{\unicode{x3b8}}}$
can be written as a (vector) function of
$\widehat{\boldsymbol{\unicode{x3b8}}}$
can be written as a (vector) function of $\mathbf{n}$
; that is,
$\mathbf{n}$
; that is, $\widehat{\boldsymbol{\unicode{x3b8}}} = \mathbf{g}\left(\mathbf{n}\right)$
. This facilitates the computation of the Jacobian—denoted by
$\widehat{\boldsymbol{\unicode{x3b8}}} = \mathbf{g}\left(\mathbf{n}\right)$
. This facilitates the computation of the Jacobian—denoted by $\mathbf{G}\left(\mathbf{n}\right)$
, the matrix of first partial derivatives of
$\mathbf{G}\left(\mathbf{n}\right)$
, the matrix of first partial derivatives of $\widehat{\boldsymbol{\unicode{x3b8}}}$
with respect to
$\widehat{\boldsymbol{\unicode{x3b8}}}$
with respect to $\mathbf{n}$
—required for deriving SEs using the delta method in Step 2. In general, deriving the Jacobian requires tedious derivations. The generalized exp-log notation developed by Grizzle et al. (Reference Grizzle, Starmer and Koch1969), Forthofer and Koch (Reference Forthofer and Koch1973), Kritzer (Reference Kritzer1977), and Bergsma (Reference Bergsma1997) alleviates the burden by writing
$\mathbf{n}$
—required for deriving SEs using the delta method in Step 2. In general, deriving the Jacobian requires tedious derivations. The generalized exp-log notation developed by Grizzle et al. (Reference Grizzle, Starmer and Koch1969), Forthofer and Koch (Reference Forthofer and Koch1973), Kritzer (Reference Kritzer1977), and Bergsma (Reference Bergsma1997) alleviates the burden by writing $\widehat{\boldsymbol{\unicode{x3b8}}} = \mathbf{g}\left(\mathbf{n}\right)$
as a series of
$\widehat{\boldsymbol{\unicode{x3b8}}} = \mathbf{g}\left(\mathbf{n}\right)$
as a series of $Q$
appropriate design matrices,
$Q$
appropriate design matrices, ${\mathbf{A}}_1,{\mathbf{A}}_2,\dots, {\mathbf{A}}_Q$
, such that
${\mathbf{A}}_1,{\mathbf{A}}_2,\dots, {\mathbf{A}}_Q$
, such that
 $$\begin{align}\widehat{\boldsymbol{\unicode{x3b8}}} = \mathbf{g}\left(\mathbf{n}\right) = {\mathbf{A}}_Q.\exp \left({\mathbf{A}}_{Q-1}.\log \left({\mathbf{A}}_{Q-2}.\exp \left(\dots \log \left({\mathbf{A}}_3.\exp \left({\mathbf{A}}_2.\log \left({\mathbf{A}}_1.\mathbf{n}\right)\right)\right)\right)\right)\right),\end{align}$$
where $\exp \left(\mathbf{X}\right)$
and
$\exp \left(\mathbf{X}\right)$
and $\log \left(\mathbf{X}\right)$
denote the exponential and natural logarithm, respectively, for each element of matrix,
$\log \left(\mathbf{X}\right)$
denote the exponential and natural logarithm, respectively, for each element of matrix, $\mathbf{X}$
and
$\mathbf{X}$
and $\mathbf{X}.\mathbf{Y}$
denotes the matrix product of
$\mathbf{X}.\mathbf{Y}$
denotes the matrix product of $\mathbf{X}$
and
$\mathbf{X}$
and $\mathbf{Y}$
. The generalized exp-log notation facilitates the derivation of the Jacobian because the chain rule can be applied. In some cases, functions other than
$\mathbf{Y}$
. The generalized exp-log notation facilitates the derivation of the Jacobian because the chain rule can be applied. In some cases, functions other than $\exp (.)$
and
$\exp (.)$
and $\log (.)$
may be useful (e.g., logit, square root, or difference), hence the name generalized exp-log notation. Equation 1 can be derived using the following steps:
$\log (.)$
may be useful (e.g., logit, square root, or difference), hence the name generalized exp-log notation. Equation 1 can be derived using the following steps:
First, a series of $Q+1$
functions,
$Q+1$
functions, ${\mathbf{g}}_0$
,
${\mathbf{g}}_0$
, ${\mathbf{g}}_1$
,
${\mathbf{g}}_1$
, ${\mathbf{g}}_2$
, …,
${\mathbf{g}}_2$
, …, ${\mathbf{g}}_Q$
, are defined, where
${\mathbf{g}}_Q$
, are defined, where ${\mathbf{g}}_0 = \mathbf{n}$
, and for
${\mathbf{g}}_0 = \mathbf{n}$
, and for $q = 1,\dots, Q-1$
,
$q = 1,\dots, Q-1$
,
 $$\begin{align}{\mathbf{g}}_q = \log \left({\mathbf{A}}_q.{\mathbf{g}}_{q-1}\right),\mathrm{if}\kern0.24em q\;\mathrm{is}\kern0.17em \mathrm{an}\;\mathrm{odd}\;\mathrm{number},\end{align}$$
and
 $$\begin{align}{\mathbf{g}}_q = \exp \left({\mathbf{A}}_q.{\mathbf{g}}_{q-1}\right),\mathrm{if}\kern0.24em q\;\mathrm{is}\kern0.17em \mathrm{an}\kern0.17em \mathrm{even}\kern0.17em \mathrm{number}.\end{align}$$
The last function is the series $\widehat{\boldsymbol{\unicode{x3b8}}} = \mathbf{g}\left(\mathbf{n}\right) = {\mathbf{g}}_Q = {\mathbf{A}}_Q.{\mathbf{g}}_{Q-1}.$
The application of the generalized exp-log notation to derive the SE of the sample mean (Appendix A) may serve as an instructive example. Appendix A also discusses the case in which
$\widehat{\boldsymbol{\unicode{x3b8}}} = \mathbf{g}\left(\mathbf{n}\right) = {\mathbf{g}}_Q = {\mathbf{A}}_Q.{\mathbf{g}}_{Q-1}.$
The application of the generalized exp-log notation to derive the SE of the sample mean (Appendix A) may serve as an instructive example. Appendix A also discusses the case in which ${\mathbf{A}}_q.{\mathbf{g}}_{q-1}$
contains one or more non-positive elements, in which case
${\mathbf{A}}_q.{\mathbf{g}}_{q-1}$
contains one or more non-positive elements, in which case $\log \left({\mathbf{A}}_q.{\mathbf{g}}_{q-1}\right)$
in Equation 2 is undefined in the reals.
$\log \left({\mathbf{A}}_q.{\mathbf{g}}_{q-1}\right)$
in Equation 2 is undefined in the reals.
Next, let ${\mathbf{G}}_0$
,
${\mathbf{G}}_0$
, ${\mathbf{G}}_1$
,
${\mathbf{G}}_1$
, ${\mathbf{G}}_2$
, …,
${\mathbf{G}}_2$
, …, ${\mathbf{G}}_Q$
denote the Jacobians of
${\mathbf{G}}_Q$
denote the Jacobians of ${\mathbf{g}}_0$
,
${\mathbf{g}}_0$
, ${\mathbf{g}}_1$
,
${\mathbf{g}}_1$
, ${\mathbf{g}}_2$
, …,
${\mathbf{g}}_2$
, …, ${\mathbf{g}}_Q$
, respectively, and let
${\mathbf{g}}_Q$
, respectively, and let ${\mathbf{I}}_p$
denote an identity matrix of order
${\mathbf{I}}_p$
denote an identity matrix of order $p$
. Following standard calculus,
$p$
. Following standard calculus, ${\mathbf{G}}_0 = \partial {\mathbf{g}}_0\backslash \partial \mathbf{n} = {\mathbf{I}}_K$
. Let
${\mathbf{G}}_0 = \partial {\mathbf{g}}_0\backslash \partial \mathbf{n} = {\mathbf{I}}_K$
. Let ${\mathbf{Y}}^{-1}$
denote the inverse of
${\mathbf{Y}}^{-1}$
denote the inverse of $\mathbf{Y}$
, and let
$\mathbf{Y}$
, and let $\mathbf{D}\left(\mathbf{y}\right)$
denote the diagonal matrix with vector
$\mathbf{D}\left(\mathbf{y}\right)$
denote the diagonal matrix with vector $\mathbf{y}$
on the diagonal; then, for
$\mathbf{y}$
on the diagonal; then, for $q = 1,\dots, Q-1$
,
$q = 1,\dots, Q-1$
,
 $$\begin{align}{\mathbf{G}}_q = \frac{\partial {\mathbf{g}}_q}{\partial \mathbf{n}} = {\mathbf{D}}^{-\mathbf{1}}\left({\mathbf{A}}_q.{\mathbf{g}}_{q-1}\right).{\mathbf{A}}_q.{\mathbf{G}}_{q-1},\mathrm{if}\kern0.24em q\;\mathrm{is}\kern0.17em \mathrm{an}\;\mathrm{odd}\;\mathrm{number},\end{align}$$
and
 $$\begin{align}{\mathbf{G}}_q = \frac{\partial {\mathbf{g}}_q}{\partial \mathbf{n}} = \mathbf{D}\left(\exp \left({\mathbf{A}}_q.{\mathbf{g}}_{q-1}\right)\right).{\mathbf{A}}_q.{\mathbf{G}}_{q-1},\mathrm{if}\kern0.24em q\kern0.24em \mathrm{is}\kern0.17em \mathrm{an}\kern0.17em \mathrm{even}\kern0.17em \mathrm{number}.\end{align}$$
The last function in the series is ${\mathbf{G}}_{\widehat{\boldsymbol{\unicode{x3b8}}}} = \mathbf{G}\left(\mathbf{n}\right) = {\mathbf{G}}_Q = {\mathbf{A}}_Q.{\mathbf{G}}_{Q-1}.$
For notational convenience, in the remainder,
${\mathbf{G}}_{\widehat{\boldsymbol{\unicode{x3b8}}}} = \mathbf{G}\left(\mathbf{n}\right) = {\mathbf{G}}_Q = {\mathbf{A}}_Q.{\mathbf{G}}_{Q-1}.$
For notational convenience, in the remainder, ${\mathbf{G}}_{\widehat{\boldsymbol{\unicode{x3b8}}}}$
will be used as the general notation of the Jacobian of a vector of coefficients.
${\mathbf{G}}_{\widehat{\boldsymbol{\unicode{x3b8}}}}$
will be used as the general notation of the Jacobian of a vector of coefficients.
2.2 Step 2. Using the delta method to derive standard errors for reliability coefficients
If $\mathbf{n}$
is a consistent estimator, under a multinomial sampling scheme,
$\mathbf{n}$
is a consistent estimator, under a multinomial sampling scheme, $\mathbf{n}$
converges to its true value
$\mathbf{n}$
converges to its true value $\boldsymbol{\unicode{x3bd}} = N\times \boldsymbol{\unicode{x3c0}}$
, and the central limit theorem can be applied to obtain asymptotic normality,
$\boldsymbol{\unicode{x3bd}} = N\times \boldsymbol{\unicode{x3c0}}$
, and the central limit theorem can be applied to obtain asymptotic normality,
 $$\begin{align}\left(\mathbf{n}-\boldsymbol{\unicode{x3bd}} \right)\overset{D}{\to } Norm\left(\boldsymbol{0},{\mathbf{V}}_{\mathbf{n}}\right),\end{align}$$
where ${\mathbf{V}}_{\mathbf{n}}$
=
${\mathbf{V}}_{\mathbf{n}}$
= $N\left(\mathbf{D}\left(\boldsymbol{\unicode{x3c0}}\;\right)-\boldsymbol{\unicode{x3c0}} .{\boldsymbol{\unicode{x3c0}}}^{\mathrm{T}}\right) = \mathbf{D}\left(\boldsymbol{\unicode{x3bd}} \right)-\boldsymbol{\unicode{x3bd}} .{N}^{-1}.{\boldsymbol{\unicode{x3bd}}}^{\mathrm{T}}$
is the variance–covariance matrix of
$N\left(\mathbf{D}\left(\boldsymbol{\unicode{x3c0}}\;\right)-\boldsymbol{\unicode{x3c0}} .{\boldsymbol{\unicode{x3c0}}}^{\mathrm{T}}\right) = \mathbf{D}\left(\boldsymbol{\unicode{x3bd}} \right)-\boldsymbol{\unicode{x3bd}} .{N}^{-1}.{\boldsymbol{\unicode{x3bd}}}^{\mathrm{T}}$
is the variance–covariance matrix of $\mathbf{n}$
. Under a multinomial distribution, the sample estimate of
$\mathbf{n}$
. Under a multinomial distribution, the sample estimate of ${\mathbf{V}}_{\mathbf{n}}$
equals
${\mathbf{V}}_{\mathbf{n}}$
equals
 $$\begin{align}{\widehat{\mathbf{V}}}_{\mathbf{n}} = \mathbf{D}\left(\mathbf{n}\right)-\mathbf{n}.{N}^{-1}.{\mathbf{n}}^{\mathrm{T}}\end{align}$$
(e.g., Agresti, Reference Agresti2013), where ${N}^{-1}$
is a
${N}^{-1}$
is a $1\times 1$
matrix with element
$1\times 1$
matrix with element $1/N.$
Using the first two terms of the Taylor series,
$1/N.$
Using the first two terms of the Taylor series,
 $$\begin{align}\mathbf{g}\left(\mathbf{n}\right)\approx \mathbf{g}\left(\boldsymbol{\unicode{x3bd}} \right)+{\mathbf{G}}_{\widehat{\boldsymbol{\unicode{x3b8}}}}^{\mathrm{T}}.\left(\mathbf{n}-\boldsymbol{\unicode{x3bd}} \right).\end{align}$$
Equation 6 implies that the variance of $\mathbf{g}\left(\mathbf{n}\right)$
can be approximated by
$\mathbf{g}\left(\mathbf{n}\right)$
can be approximated by
 $$\begin{align}{\mathbf{V}}_{\mathbf{g}\left(\mathbf{n}\right)}\approx {\mathbf{G}}_{\widehat{\boldsymbol{\unicode{x3b8}}}}.{\widehat{\mathbf{V}}}_{\mathbf{n}}.{\mathbf{G}}_{\widehat{\boldsymbol{\unicode{x3b8}}}}^{\mathrm{T}}.\end{align}$$
Therefore,
 $$\begin{align}\left(\mathbf{g}\left(\mathbf{n}\right)-\mathbf{g}\left(\boldsymbol{\unicode{x3bd}} \right)\right)\overset{D}{\to }N\left(\boldsymbol{0},{\mathbf{G}}_{\widehat{\boldsymbol{\unicode{x3b8}}}}.{\mathbf{V}}_{\mathbf{n}}.{\mathbf{G}}_{\widehat{\boldsymbol{\unicode{x3b8}}}}^{\mathrm{T}}\right).\end{align}$$
Based on Equation 10, and using the result in Equation 7, the sample estimate of the asymptotic variance of $\mathbf{g}\left(\mathbf{n}\right)$
is
$\mathbf{g}\left(\mathbf{n}\right)$
is
 $$\begin{align}{\widehat{\mathbf{V}}}_{\mathrm{g}\left(\mathbf{n}\right)} = {\widehat{\mathbf{V}}}_{\widehat{\boldsymbol{\unicode{x3b8}}}} = {\mathbf{G}}_{\widehat{\boldsymbol{\unicode{x3b8}}}}.{\widehat{\mathbf{V}}}_{\mathbf{n}}.{\mathbf{G}}_{\widehat{\boldsymbol{\unicode{x3b8}}}}^{\mathrm{T}} = {\mathbf{G}}_{\widehat{\boldsymbol{\unicode{x3b8}}}}.\left(\mathbf{D}\left(\mathbf{n}\right)-\mathbf{n}.{N}^{-1}.{\mathbf{n}}^{\mathrm{T}}\right).{\mathbf{G}}_{\widehat{\boldsymbol{\unicode{x3b8}}}}^{\boldsymbol{T}}={\mathbf{G}}_{\widehat{\boldsymbol{\unicode{x3b8}}}}.\mathbf{D}\left(\mathbf{n}\right).{\mathbf{G}}_{\widehat{\boldsymbol{\unicode{x3b8}}}}^{\mathbf{T}}-{\mathbf{G}}_{\widehat{\boldsymbol{\unicode{x3b8}}}}.\mathbf{n}.{N}^{-1}{\mathbf{n}}^{\mathrm{T}}.{\mathbf{G}}_{\widehat{\boldsymbol{\unicode{x3b8}}}}^{\mathrm{T}}.\end{align}$$
By taking the square root of the diagonal elements of ${\widehat{\mathbf{V}}}_{\widehat{\boldsymbol{\unicode{x3b8}}}}$
, the sample estimate of the asymptotic SE of
${\widehat{\mathbf{V}}}_{\widehat{\boldsymbol{\unicode{x3b8}}}}$
, the sample estimate of the asymptotic SE of $\widehat{\boldsymbol{\unicode{x3b8}}}$
is obtained. Equation 11 can be simplified if
$\widehat{\boldsymbol{\unicode{x3b8}}}$
is obtained. Equation 11 can be simplified if $\mathbf{g}\left(\mathbf{n}\right)$
is homogeneous of order 0, which is true if
$\mathbf{g}\left(\mathbf{n}\right)$
is homogeneous of order 0, which is true if $\mathbf{g}\left(\mathbf{n}\right) = \mathbf{g}\left(t\mathbf{n}\right)$
for every positive constant
$\mathbf{g}\left(\mathbf{n}\right) = \mathbf{g}\left(t\mathbf{n}\right)$
for every positive constant $t.$
For the application here, it is useful to note that if functions are homogenous of order 0, it does not matter whether observed frequencies
$t.$
For the application here, it is useful to note that if functions are homogenous of order 0, it does not matter whether observed frequencies $\mathbf{n}$
or observed probabilities
$\mathbf{n}$
or observed probabilities $\mathbf{p} = \mathbf{n}/N$
(i.e.,
$\mathbf{p} = \mathbf{n}/N$
(i.e., $t = 1/N$
) are used as an argument of
$t = 1/N$
) are used as an argument of $\mathbf{g}(.)$
. Bergsma (Reference Bergsma1997, Appendix D) showed that if
$\mathbf{g}(.)$
. Bergsma (Reference Bergsma1997, Appendix D) showed that if $\mathbf{g}\left(\mathbf{n}\right)$
is homogeneous of order 0, then
$\mathbf{g}\left(\mathbf{n}\right)$
is homogeneous of order 0, then ${\mathbf{G}}_{\widehat{\boldsymbol{\unicode{x3b8}}}}.\mathbf{n}.{N}^{-1}.{\mathbf{n}}^{\mathrm{T}}.{\mathbf{G}}_{\widehat{\boldsymbol{\unicode{x3b8}}}}^{\mathrm{T}}=\boldsymbol{0},$
and Equation 11 reduces to
${\mathbf{G}}_{\widehat{\boldsymbol{\unicode{x3b8}}}}.\mathbf{n}.{N}^{-1}.{\mathbf{n}}^{\mathrm{T}}.{\mathbf{G}}_{\widehat{\boldsymbol{\unicode{x3b8}}}}^{\mathrm{T}}=\boldsymbol{0},$
and Equation 11 reduces to
 $$\begin{align}{\widehat{\mathbf{V}}}_{\mathrm{g}\left(\mathbf{n}\right)} = {\widehat{\mathbf{V}}}_{\widehat{\boldsymbol{\unicode{x3b8}}}} = {\mathbf{G}}_{\widehat{\boldsymbol{\unicode{x3b8}}}}.\mathbf{D}\left(\mathbf{n}\right).{\mathbf{G}}_{\widehat{\boldsymbol{\unicode{x3b8}}}}^{\mathrm{T}}.\end{align}$$
For a single coefficient (i.e., $\boldsymbol{\unicode{x3b8}} = \theta$
),
$\boldsymbol{\unicode{x3b8}} = \theta$
), ${\mathbf{G}}_{\widehat{\boldsymbol{\unicode{x3b8}}}}$
is a row vector of length
${\mathbf{G}}_{\widehat{\boldsymbol{\unicode{x3b8}}}}$
is a row vector of length $K$
, and Equation 11 and Equation 12 can be expressed as
$K$
, and Equation 11 and Equation 12 can be expressed as
 $$\begin{align}{\widehat{V}}_{\widehat{\theta}} = {\sum}_k{n}_k{G}_k^2-\frac{1}{N}{\sum}_k{\sum}_l{n}_k{n}_l{G}_k{G}_l\end{align}$$
and
 $$\begin{align}{\widehat{V}}_{\widehat{\theta}} = {\sum}_k{n}_k{G}_k^2,\end{align}$$
respectively. The estimated SEs, obtained by taking the square root of the estimated variances (Equations 11, 12, 13, and 14) typically have a rather intricate form. Therefore, attempts were made to simplify the SEs to a more comprehensible form.
3 Large-sample estimates of the SEs of reliability coefficients
3.1 Mean
The estimated SE of the sample mean equals $S{E}_{\overline{X}} = {S}_X/\sqrt{N}.$
Although this is an established result, the two-step procedure for deriving the estimated SE of the sample mean without bias correction,
$S{E}_{\overline{X}} = {S}_X/\sqrt{N}.$
Although this is an established result, the two-step procedure for deriving the estimated SE of the sample mean without bias correction, ${\overset{\sim }{SE}}_{\overline{X}}$
(Appendix A), is relatively simple and can serve as an instructive example of the two-step procedure.
${\overset{\sim }{SE}}_{\overline{X}}$
(Appendix A), is relatively simple and can serve as an instructive example of the two-step procedure.
3.2 Covariance
The unbiased covariance estimator equals ${C}_{XY} = \frac{1}{N-1}{\sum}_n\left({X}_n-\overline{X}\right)\left({Y}_n-\overline{Y}\right)$
. Let
${C}_{XY} = \frac{1}{N-1}{\sum}_n\left({X}_n-\overline{X}\right)\left({Y}_n-\overline{Y}\right)$
. Let
 $$\begin{align}{d}_{X{Y}_n} = \frac{\left({X}_n-\overline{X}\right)\left({Y}_n-\overline{Y}\right)-{C}_{XY}}{N-1}.\end{align}$$
In Appendix B, it is shown that the estimated $SE$
of
$SE$
of ${C}_{XY}$
equals
${C}_{XY}$
equals
 $$\begin{align}{\widehat{SE}}_{C_{XY}} = \sqrt{\sum_n{d}_{X{Y}_n}^2-\frac{1}{N}{\sum}_m{\sum}_n{d}_{X{Y}_m}{d}_{X{Y}_n}}.\end{align}$$
Appendix B also shows that for large $N$
, the term
$N$
, the term $\frac{1}{N}{\sum}_m{\sum}_n{d}_{X{Y}_m}{d}_{X{Y}_n}$
in Equation 16 tends to 0, and the estimated SE may be approximated by
$\frac{1}{N}{\sum}_m{\sum}_n{d}_{X{Y}_m}{d}_{X{Y}_n}$
in Equation 16 tends to 0, and the estimated SE may be approximated by
 $$\begin{align}{\widehat{SE}}_{C_{XY}}\approx {\widehat{SE}}_{C_{XY}}^{\ast} = \sqrt{\sum_n{d}_{X{Y}_n}^2}.\end{align}$$
There are two special cases. First, if ${S}_X^2 = 0$
or
${S}_X^2 = 0$
or ${S}_Y^2 = 0$
, then
${S}_Y^2 = 0$
, then ${d}_{X{Y}_n} = 0$
for all
${d}_{X{Y}_n} = 0$
for all $n$
. As a result,
$n$
. As a result, ${\widehat{SE}}_{C_{XY}} = {\widehat{SE}}_{C_{XY}}^{\ast} = 0$
. Second, let
${\widehat{SE}}_{C_{XY}} = {\widehat{SE}}_{C_{XY}}^{\ast} = 0$
. Second, let $\max \left({C}_{XY}\right)$
and
$\max \left({C}_{XY}\right)$
and $\min \left({C}_{XY}\right)$
be the maximum and minimum covariance, respectively, that can be obtained given the marginal distributions of
$\min \left({C}_{XY}\right)$
be the maximum and minimum covariance, respectively, that can be obtained given the marginal distributions of $X$
and Y. If
$X$
and Y. If ${C}_{XY} = \max \left({C}_{XY}\right)$
or
${C}_{XY} = \max \left({C}_{XY}\right)$
or ${C}_{XY} = \min \left({C}_{XY}\right)$
, then
${C}_{XY} = \min \left({C}_{XY}\right)$
, then ${d}_{X{Y}_n}<0$
for all
${d}_{X{Y}_n}<0$
for all $n$
, and neither
$n$
, and neither ${\widehat{SE}}_{C_{XY}}$
nor
${\widehat{SE}}_{C_{XY}}$
nor ${\widehat{SE}}_{C_{XY}}^{\ast }$
exist. These two special cases also apply to the SEs of the sample variance and the sample standard deviation in the next subsections.
${\widehat{SE}}_{C_{XY}}^{\ast }$
exist. These two special cases also apply to the SEs of the sample variance and the sample standard deviation in the next subsections.
3.3 Variance
The unbiased variance estimator equals ${S}_X^2 = \frac{1}{N-1}{\sum}_n{\left({X}_n-\overline{X}\right)}^2$
. The variance may be considered a special case of a covariance where both variables are the same; that is,
${S}_X^2 = \frac{1}{N-1}{\sum}_n{\left({X}_n-\overline{X}\right)}^2$
. The variance may be considered a special case of a covariance where both variables are the same; that is, ${S}_X^2 = {C}_{XX}$
.
${S}_X^2 = {C}_{XX}$
.
If $Y$
is replaced by
$Y$
is replaced by $X$
in Equation 15, Equation 15 becomes
$X$
in Equation 15, Equation 15 becomes
 $$\begin{align}{d}_{X{X}_n} = \frac{{\left({X}_n-\overline{X}\right)}^2-{S}_X^2}{N-1}.\end{align}$$
It follows directly from Equations 16 and 17 that the estimated $SE$
of
$SE$
of ${S}_X^2$
equals
${S}_X^2$
equals
 $$\begin{align}{\widehat{SE}}_{S_X^2} = \sqrt{\sum_n{d}_{X{X}_n}^2-\frac{1}{N}{\sum}_m{\sum}_n{d}_{X{X}_m}{d}_{X{X}_n}},\end{align}$$
which for large samples reduces to
 $$\begin{align}{\widehat{SE}}_{S_X^2}^{\ast} = \sqrt{\sum_n{d}_{X{X}_n}^2}.\end{align}$$
3.4 Standard deviation
The estimator of the standard deviation equals ${S}_X = \sqrt{S_X^2} = \sqrt{\frac{1}{N-1}{\sum}_n{\left({X}_n-\overline{X}\right)}^2}$
. Appendix C shows that the estimated SE of
${S}_X = \sqrt{S_X^2} = \sqrt{\frac{1}{N-1}{\sum}_n{\left({X}_n-\overline{X}\right)}^2}$
. Appendix C shows that the estimated SE of ${S}_X$
is derived by multiplying the SE of
${S}_X$
is derived by multiplying the SE of ${S}_X^2$
(Equations 19 and 20) by
${S}_X^2$
(Equations 19 and 20) by $\frac{1}{2{S}_X}$
; that is,
$\frac{1}{2{S}_X}$
; that is,
 $$\begin{align}{\widehat{SE}}_{S_X} = \frac{1}{2{S}_X}{\widehat{SE}}_{S_X^2} = \frac{1}{2{S}_X}\sqrt{\sum_n{d}_{X{X}_n}^2-\frac{1}{N}{\sum}_m{\sum}_n{d}_{X{X}_m}{d}_{X{X}_n}},\end{align}$$
which for large samples reduces to
 $$\begin{align}{\widehat{SE}}_{S_X}^{\ast} = \frac{1}{2{S}_X}{\widehat{SE}}_{S_X^2}^{\ast} = \frac{1}{2{S}_X}\sqrt{\sum_n{d}_{X{X}_n}^2}.\end{align}$$
3.5 Correlation
The unbiased estimator of the product-moment correlation coefficient equals ${K}_{XY} = \frac{C_{XY}}{S_X{S}_Y}.$
In Appendix D, it is shown that the estimated
${K}_{XY} = \frac{C_{XY}}{S_X{S}_Y}.$
In Appendix D, it is shown that the estimated $SE$
of
$SE$
of ${K}_{XY}$
equals
${K}_{XY}$
equals
 $$\begin{align}{\widehat{SE}}_{K_{XY}} = \frac{K_{XY}}{N-1}\sqrt{\sum_n{\left(\frac{\left({X}_n-\overline{X}\right)\left({Y}_n-\overline{Y}\right)}{C_{XY}}-\frac{{\left({X}_n-\overline{X}\right)}^2}{2{S}_X^2} - \frac{{\left({Y}_n-\overline{Y}\right)}^2}{2{S}_Y^2\;}\right)}^2.}\end{align}$$
There are three special cases. First, if ${S}_X^2 = 0$
or
${S}_X^2 = 0$
or ${S}_Y^2 = 0$
, neither
${S}_Y^2 = 0$
, neither ${K}_{XY}$
nor
${K}_{XY}$
nor ${\widehat{SE}}_{K_{XY}}$
are defined. Second, if
${\widehat{SE}}_{K_{XY}}$
are defined. Second, if ${K}_{XY} = 1$
or
${K}_{XY} = 1$
or ${K}_{XY} = -1$
,
${K}_{XY} = -1$
, ${\widehat{SE}}_{K_{XY}} = 0$
by definition. Third, let
${\widehat{SE}}_{K_{XY}} = 0$
by definition. Third, let $\epsilon$
be a very small positive value. For
$\epsilon$
be a very small positive value. For ${K}_{XY} = {C}_{XY} = 0$
, the term
${K}_{XY} = {C}_{XY} = 0$
, the term $\frac{\left({X}_n-\overline{X}\right)\left({Y}_n-\overline{Y}\right)}{C_{XY}}$
in Equation 23 does not exist, and
$\frac{\left({X}_n-\overline{X}\right)\left({Y}_n-\overline{Y}\right)}{C_{XY}}$
in Equation 23 does not exist, and ${\widehat{SE}}_{K_{XY}}$
is not defined, but by replacing
${\widehat{SE}}_{K_{XY}}$
is not defined, but by replacing ${C}_{XY}$
by
${C}_{XY}$
by ${C}_{XY}+\epsilon$
and letting
${C}_{XY}+\epsilon$
and letting ${K}_{XY} = \frac{C_{XY}+\epsilon }{S_X\times {S}_Y}$
, reasonable estimates of
${K}_{XY} = \frac{C_{XY}+\epsilon }{S_X\times {S}_Y}$
, reasonable estimates of ${\widehat{SE}}_{K_{XY}}$
are obtained. These three special cases also hold for the split-half correlation coefficient in the next subsection.
${\widehat{SE}}_{K_{XY}}$
are obtained. These three special cases also hold for the split-half correlation coefficient in the next subsection.
3.6 Split-half reliability coefficient
Suppose the test items are split into two sets, ${H}_1$
and
${H}_1$
and ${H}_2$
. Let
${H}_2$
. Let ${K}_{H_1{H}_2}$
be the correlation between the sum scores on
${K}_{H_1{H}_2}$
be the correlation between the sum scores on ${H}_1$
and the sum scores on
${H}_1$
and the sum scores on ${H}_2$
. Then, the sample value of the split-half reliability coefficient is
${H}_2$
. Then, the sample value of the split-half reliability coefficient is ${\widehat{\rho}}_{SH} = $
2
${\widehat{\rho}}_{SH} = $
2 ${K}_{H_1{H}_2}/\left(1+{K}_{H_1{H}_2}\right)$
. Appendix E shows that the estimated SE of the split-half reliability coefficient equals
${K}_{H_1{H}_2}/\left(1+{K}_{H_1{H}_2}\right)$
. Appendix E shows that the estimated SE of the split-half reliability coefficient equals
 $$\begin{align}{\widehat{SE}}_{{\widehat{\rho}}_{SH}} = \left(\frac{{\widehat{\rho}}_{SH}}{K_{H_1{H}_2}}-\frac{{\widehat{\rho}}_{SH}}{1+{K}_{H_1{H}_2}}\right){\widehat{SE}}_{K_{H_1{H}_2}},\end{align}$$
where ${\widehat{SE}}_{K_{H_1{H}_2}}$ $ = \frac{K_{H_1{H}_2}}{N-1}\sqrt{\sum_n{\left(\frac{\left({H_1}_n-{\overline{H}}_1\right)\left({H_2}_n-{\overline{H}}_2\right)}{C_{H_1{H}_2}}-\frac{{\left({H}_1-{\overline{H}}_1\right)}^2}{2{S}_{H_1}^2} - \frac{{\left({H}_2-{\overline{H}}_2\right)}^2}{2{S}_{H_2}^2\;}\right)}^2}$
is the SE of the correlation between the two halves (cf. Equation 23).
$ = \frac{K_{H_1{H}_2}}{N-1}\sqrt{\sum_n{\left(\frac{\left({H_1}_n-{\overline{H}}_1\right)\left({H_2}_n-{\overline{H}}_2\right)}{C_{H_1{H}_2}}-\frac{{\left({H}_1-{\overline{H}}_1\right)}^2}{2{S}_{H_1}^2} - \frac{{\left({H}_2-{\overline{H}}_2\right)}^2}{2{S}_{H_2}^2\;}\right)}^2}$
is the SE of the correlation between the two halves (cf. Equation 23).
3.7 Lambda coefficients
Reliability coefficients ${\lambda}_1$
,
${\lambda}_1$
, ${\lambda}_2$
,
${\lambda}_2$
, ${\lambda}_3 = \alpha$
are based on the inter-item sample variance-covariance matrix
${\lambda}_3 = \alpha$
are based on the inter-item sample variance-covariance matrix $\mathbf{C}$
. Let
$\mathbf{C}$
. Let $\mathrm{vec}\left(\mathbf{C}\right)$
be a
$\mathrm{vec}\left(\mathbf{C}\right)$
be a ${J}^2\times 1$
column vector obtained by stacking the column vectors of
${J}^2\times 1$
column vector obtained by stacking the column vectors of $\mathbf{C}$
on top of one another. In Appendix F,
$\mathbf{C}$
on top of one another. In Appendix F, ${\widehat{\mathbf{V}}}_{\mathrm{vec}\left(\mathbf{C}\right)}$
, the
${\widehat{\mathbf{V}}}_{\mathrm{vec}\left(\mathbf{C}\right)}$
, the ${J}^2\times {J}^2$
variance covariance matrix of
${J}^2\times {J}^2$
variance covariance matrix of $\mathrm{vec}\left(\mathbf{C}\right)$
, is derived. Let
$\mathrm{vec}\left(\mathbf{C}\right)$
, is derived. Let ${\widehat{v}}_{\left( ij, kl\right)}$ $(i,j,k,l = 1,\dots, J)$
denote the elements of
$(i,j,k,l = 1,\dots, J)$
denote the elements of ${\widehat{\mathbf{V}}}_{\mathrm{vec}\left(\mathbf{C}\right)}$
, where
${\widehat{\mathbf{V}}}_{\mathrm{vec}\left(\mathbf{C}\right)}$
, where ${\widehat{v}}_{\left( ii, ii\right)}$
denotes the estimated variance of
${\widehat{v}}_{\left( ii, ii\right)}$
denotes the estimated variance of ${S}_{X_i}$
(Equation 19),
${S}_{X_i}$
(Equation 19), ${\widehat{v}}_{\left( ij, ij\right)}$
the estimated variance of
${\widehat{v}}_{\left( ij, ij\right)}$
the estimated variance of ${C}_{X_i{X}_j}$
(Equation 16),
${C}_{X_i{X}_j}$
(Equation 16), ${\widehat{v}}_{\left( ii, kk\right)}$
the estimated covariance of
${\widehat{v}}_{\left( ii, kk\right)}$
the estimated covariance of ${S}_{X_i}$
and
${S}_{X_i}$
and ${S}_{X_k}$
,
${S}_{X_k}$
, ${\widehat{v}}_{\left( ii, kl\right)}$
the estimated covariance of
${\widehat{v}}_{\left( ii, kl\right)}$
the estimated covariance of ${S}_{X_i}$
and
${S}_{X_i}$
and ${C}_{X_k{X}_l}$
, and
${C}_{X_k{X}_l}$
, and ${\widehat{v}}_{\left( ij, kl\right)}$
the estimated covariance of
${\widehat{v}}_{\left( ij, kl\right)}$
the estimated covariance of ${C}_{X_i{X}_j}$
and
${C}_{X_i{X}_j}$
and ${C}_{X_k{X}_l}$
. Because
${C}_{X_k{X}_l}$
. Because ${\widehat{v}}_{\left( ij, kl\right)}$
has an intricate form that could not easily be simplified,
${\widehat{v}}_{\left( ij, kl\right)}$
has an intricate form that could not easily be simplified, ${\widehat{v}}_{\left( ij, kl\right)}$
is presented only in the generalized exp-log notation (see Equation F4, F5, F6, F7, and F8 in Appendix F).
${\widehat{v}}_{\left( ij, kl\right)}$
is presented only in the generalized exp-log notation (see Equation F4, F5, F6, F7, and F8 in Appendix F).
Guttman’s $\,{\lambda}_1$
. The sample value of Guttman’s lambda 1 equals
$\,{\lambda}_1$
. The sample value of Guttman’s lambda 1 equals ${\widehat{\lambda}}_1 = 1-\frac{\sum_j{S}_j^2}{S_{X_{+}}^2}$
, where
${\widehat{\lambda}}_1 = 1-\frac{\sum_j{S}_j^2}{S_{X_{+}}^2}$
, where ${S}_j^2$
denotes the sample variance of item
${S}_j^2$
denotes the sample variance of item $j$
and
$j$
and ${S}_{X_{+}}^2$
denotes the sample variance of the sum score. Let
${S}_{X_{+}}^2$
denotes the sample variance of the sum score. Let ${\delta}_{\left( ij, kl\right)} = 1$
if
${\delta}_{\left( ij, kl\right)} = 1$
if $i = j$
or
$i = j$
or $k = l$
, then Appendix G shows that the estimated SE of
$k = l$
, then Appendix G shows that the estimated SE of ${\widehat{\lambda}}_1$
equals
${\widehat{\lambda}}_1$
equals
 $$\begin{align}{\widehat{SE}}_{{\widehat{\lambda}}_1} = \sqrt{{\sum}_i{\sum}_j{\sum}_k{\sum}_l{\left({\sum}_h{S}_h^2-{\delta}_{\left( ij, kl\right)}\frac{{\left({\sum}_h{S}_h^2\right)}^2}{S_{X_{+}}^2}\right)}^2{v}_{\left( ij, kl\right)}}.\end{align}$$
Guttman’s $\,{\lambda}_2$
. The sample value of lambda 2 equals
$\,{\lambda}_2$
. The sample value of lambda 2 equals ${\widehat{\lambda}}_2 = \frac{\sum_j{S}_j^2-\sqrt{\frac{J-1}{J}\times \sum \limits_{i = 1}^{J-1}\sum \limits_{j = i+1}^J2{\left({C}_{X_i{X}_j}\right)}^2\;}}{S_{X_{+}}^2}$
. Let
${\widehat{\lambda}}_2 = \frac{\sum_j{S}_j^2-\sqrt{\frac{J-1}{J}\times \sum \limits_{i = 1}^{J-1}\sum \limits_{j = i+1}^J2{\left({C}_{X_i{X}_j}\right)}^2\;}}{S_{X_{+}}^2}$
. Let ${S}_{X_{+}}^2 = {\sum}_i{\sum}_j{C}_{X_i{X}_j}$
denote the sample variance of the sum score, let
${S}_{X_{+}}^2 = {\sum}_i{\sum}_j{C}_{X_i{X}_j}$
denote the sample variance of the sum score, let ${\sum}_j{S}_j^2$
denote the sum of the sample variances of the
${\sum}_j{S}_j^2$
denote the sum of the sample variances of the $J$
items, let
$J$
items, let ${C}_{+} = {\sum}_i{\sum}_j{C}_{X_i{X}_j}-{\sum}_k{C}_{X_k{X}_k} = {S}_{X_{+}}^2-{\sum}_j{S}_j^2$
denote the sum of all sample covariances, let
${C}_{+} = {\sum}_i{\sum}_j{C}_{X_i{X}_j}-{\sum}_k{C}_{X_k{X}_k} = {S}_{X_{+}}^2-{\sum}_j{S}_j^2$
denote the sum of all sample covariances, let ${C}_{+}^2 = {\sum}_i{\sum}_j{C}_{X_i{X}_j}^2-{\sum}_k{C}_{X_k{X}_k}^2$
denote the sum of all squared sample covariances, and let
${C}_{+}^2 = {\sum}_i{\sum}_j{C}_{X_i{X}_j}^2-{\sum}_k{C}_{X_k{X}_k}^2$
denote the sum of all squared sample covariances, and let ${\overset{\sim }{C}}_{+}^2 = \sqrt{J/\left(J-1\right)\times {C}_{+}^2\;}$
; then,
${\overset{\sim }{C}}_{+}^2 = \sqrt{J/\left(J-1\right)\times {C}_{+}^2\;}$
; then, ${\widehat{\lambda}}_2$
reduces to
${\widehat{\lambda}}_2$
reduces to ${\widehat{\lambda}}_2 = \frac{C_{+}+{\overset{\sim }{C}}_{+}^2}{S_{X_{+}}^2}.$
Furthermore, let
${\widehat{\lambda}}_2 = \frac{C_{+}+{\overset{\sim }{C}}_{+}^2}{S_{X_{+}}^2}.$
Furthermore, let ${W}_1 = \frac{{\overset{\sim }{C}}_{+}^2}{C_{+}^2{S}_{X_{+}}^2}$
,
${W}_1 = \frac{{\overset{\sim }{C}}_{+}^2}{C_{+}^2{S}_{X_{+}}^2}$
, ${W}_2 = \frac{1}{S_{X_{+}}^2}$
, and
${W}_2 = \frac{1}{S_{X_{+}}^2}$
, and ${W}_3 = -\frac{{\widehat{\lambda}}_2}{S_{X_{+}}^2}$
be three constant values, and let
${W}_3 = -\frac{{\widehat{\lambda}}_2}{S_{X_{+}}^2}$
be three constant values, and let ${\delta}_{ij}$
be Kronecker delta (i.e.,
${\delta}_{ij}$
be Kronecker delta (i.e., ${\delta}_{ij} = 1$
if
${\delta}_{ij} = 1$
if $i = j$
,
$i = j$
, ${\delta}_{ij} = 0$
otherwise). Appendix H shows that the estimated SE of
${\delta}_{ij} = 0$
otherwise). Appendix H shows that the estimated SE of ${\widehat{\lambda}}_2$
equals
${\widehat{\lambda}}_2$
equals
 $$\begin{align}{\widehat{SE}}_{{\widehat{\lambda}}_2} &= \left({\sum}_i{\sum}_j{\sum}_k{\sum}_l\left[{W}_1^2\left(1-{\delta}_{ij}\right)\left(1-{\delta}_{kl}\right){C}_{ij}{C}_{kl}+{W}_1{W}_2\left(1-{\delta}_{ij}\right)\left(1-{\delta}_{kl}\right){C}_{ij}\right.\right.\nonumber\\&\quad\left.\left.+{W}_1{W}_3\left(1-{\delta}_{ij}\right){C}_{ij}+{W}_1{W}_2\left(1-{\delta}_{ij}\right)\left(1-{\delta}_{kl}\right){C}_{kl}+{W}_2^2\left(1-{\delta}_{ij}\right)\left(1-{\delta}_{kl}\right)\right.\right.\nonumber\\&\quad\left.\left.+{W}_2{W}_3\left(1-{\delta}_{ij}\right)+{W}_1{W}_3\left(1-{\delta}_{kl}\right){C}_{kl}+{W}_2{W}_3\left(1-{\delta}_{kl}\right)+{K}_3^2\right]{v}_{\left( ij, kl\right)}\right)^{\frac{1}{2}}.\end{align} $$
Guttman’s $\,{\lambda}_3$
. Guttman’s
$\,{\lambda}_3$
. Guttman’s ${\lambda}_3$
equals Cronbach’s alpha and also equals
${\lambda}_3$
equals Cronbach’s alpha and also equals $\frac{J}{J-1}{\lambda}_1$
(Guttman, Reference Guttman1945). The SE can therefore be derived directly from
$\frac{J}{J-1}{\lambda}_1$
(Guttman, Reference Guttman1945). The SE can therefore be derived directly from ${\widehat{SE}}_{{\widehat{\lambda}}_1}$
(Equation 25) as
${\widehat{SE}}_{{\widehat{\lambda}}_1}$
(Equation 25) as
 $$\begin{align}{\widehat{SE}}_{{\widehat{\lambda}}_3} = {\widehat{SE}}_{\widehat{\alpha}} = \frac{J}{J-1}\;{\widehat{SE}}_{{\widehat{\lambda}}_1}.\end{align}$$
4 Simulation study
For different sample sizes and different types of coefficients (see Table 1), the bias of the proposed SEs and the coverage of corresponding Wald CIs for all coefficients in Table 1 were investigated using simulated data. SEs obtained by methods discussed in the Introduction section, were included as benchmarks.
4.1 Method
4.1.1 Population model
A two-dimensional extension of Samejima’s (Reference Samejima1995) five-parameter multidimensional acceleration model (5PAM; see, e.g., Van Abswoude et al., Reference Van Abswoude, Van der Ark and Sijtsma2004) for dichotomous items was used as a population model. Let $\boldsymbol{\unicode{x3be}} = {\left({\xi}_1,{\xi}_2\right)}^{\mathrm{T}}$
denote the vector of latent traits. For item
$\boldsymbol{\unicode{x3be}} = {\left({\xi}_1,{\xi}_2\right)}^{\mathrm{T}}$
denote the vector of latent traits. For item $j = 1,\dots, 10$
and dimension
$j = 1,\dots, 10$
and dimension $h = 1,2$
, let
$h = 1,2$
, let ${\alpha}_{jh}$
and
${\alpha}_{jh}$
and ${\delta}_{jh}$
be discrimination and location parameters, respectively. Let
${\delta}_{jh}$
be discrimination and location parameters, respectively. Let ${\gamma}_j^{\mathrm{lo}}$
and
${\gamma}_j^{\mathrm{lo}}$
and ${\gamma}_j^{\mathrm{up}}$
denote the lower and upper asymptotes of the item response function;
${\gamma}_j^{\mathrm{up}}$
denote the lower and upper asymptotes of the item response function; ${\eta}_j$
the acceleration parameter; and
${\eta}_j$
the acceleration parameter; and ${d}_{j1}$
and
${d}_{j1}$
and ${d}_{j2}$
design parameters. Then, the probability of a score 1 on item
${d}_{j2}$
design parameters. Then, the probability of a score 1 on item $j$
, given the latent trait vector
$j$
, given the latent trait vector $\boldsymbol{\unicode{x3be}}$
, is
$\boldsymbol{\unicode{x3be}}$
, is
 $$\begin{align}P\left({X}_j = 1|\boldsymbol{\unicode{x3be}} \right) = {\gamma}_j^{lo}+\left({\gamma}_j^{\mathrm{up}}-{\gamma}_j^{\mathrm{lo}}\right){\left\{\frac{\exp \left[{d}_{j1}{\alpha}_{j1}\left({\xi}_1-{\delta}_{j1}\right)+{d}_{j2}{\alpha}_{j2}\left({\xi}_2-{\delta}_{j2}\right)\right]\kern0.24em }{1+\exp \left[{d}_{j1}{\alpha}_{j1}\left({\xi}_1-{\delta}_{j1}\right)+{d}_{j2}{\alpha}_{j2}\left({\xi}_2-{\delta}_{j2}\right)\right]\kern0.24em }\right\}}^{\eta_j}.\end{align}$$
In this study, $\boldsymbol{\unicode{x3be}}$
followed a bivariate standard normal distribution with correlation
$\boldsymbol{\unicode{x3be}}$
followed a bivariate standard normal distribution with correlation ${K}_{\xi_1,{\xi}_2} = .4.$
The discrimination parameters were randomly sampled from a lognormal distribution with mean 0 and standard deviation 0.1. Location parameters
${K}_{\xi_1,{\xi}_2} = .4.$
The discrimination parameters were randomly sampled from a lognormal distribution with mean 0 and standard deviation 0.1. Location parameters ${\unicode{x3b4}}_1,\dots, {\unicode{x3b4}}_{10}$
were evenly spaced in the range
${\unicode{x3b4}}_1,\dots, {\unicode{x3b4}}_{10}$
were evenly spaced in the range $\left[-3,3\right]$
. Parameters
$\left[-3,3\right]$
. Parameters ${\gamma}_j^{\mathrm{lo}}$
, which allow the lower asymptote to be greater than 0, were sampled from
${\gamma}_j^{\mathrm{lo}}$
, which allow the lower asymptote to be greater than 0, were sampled from $Norm\left({\mu}_{\gamma },{\sigma}_{\boldsymbol{\gamma}}^2\right)$
; parameters
$Norm\left({\mu}_{\gamma },{\sigma}_{\boldsymbol{\gamma}}^2\right)$
; parameters ${\gamma}_j^{\mathrm{up}}$
, which allow the upper asymptote to be less than 1, were sampled from
${\gamma}_j^{\mathrm{up}}$
, which allow the upper asymptote to be less than 1, were sampled from $Norm\left(1-{\mu}_{\gamma },{\sigma}_{\boldsymbol{\gamma}}^2\right)$
; and parameters
$Norm\left(1-{\mu}_{\gamma },{\sigma}_{\boldsymbol{\gamma}}^2\right)$
; and parameters ${\eta}_j$
, which allow the item response function to be asymmetric, were sampled from
${\eta}_j$
, which allow the item response function to be asymmetric, were sampled from $Norm\left(1,{\sigma}_{\eta}^2\right)$
. Parameters
$Norm\left(1,{\sigma}_{\eta}^2\right)$
. Parameters ${\mu}_{\gamma }$
,
${\mu}_{\gamma }$
, ${\sigma}_{\boldsymbol{\gamma}}^2$
, and
${\sigma}_{\boldsymbol{\gamma}}^2$
, and ${\sigma}_{\eta}^2$
and the design parameters
${\sigma}_{\eta}^2$
and the design parameters ${d}_{j1}$
and
${d}_{j1}$
and ${d}_{j2}$
varied across the design cells (see below). Note that if
${d}_{j2}$
varied across the design cells (see below). Note that if ${\gamma}_j^{\mathrm{lo}} = 0$
,
${\gamma}_j^{\mathrm{lo}} = 0$
, ${\gamma}_j^{\mathrm{up}} = 1$
, and
${\gamma}_j^{\mathrm{up}} = 1$
, and ${\eta}_j = 1$
, Equation 28 reduces to the two-dimensional two-parameter logistic model. For each design cell, the population values of the reliability coefficients (θ) were computed from item scores—derived via Equation 28—based on a sample of 10 million
${\eta}_j = 1$
, Equation 28 reduces to the two-dimensional two-parameter logistic model. For each design cell, the population values of the reliability coefficients (θ) were computed from item scores—derived via Equation 28—based on a sample of 10 million $\boldsymbol{\unicode{x3be}}$
values.
$\boldsymbol{\unicode{x3be}}$
values.
4.1.2 Data generation
First, $N$
latent-trait values (
$N$
latent-trait values ( ${\boldsymbol{\unicode{x3be}}}_1,\dots, {\boldsymbol{\unicode{x3be}}}_N$
) were sampled, and the corresponding values of
${\boldsymbol{\unicode{x3be}}}_1,\dots, {\boldsymbol{\unicode{x3be}}}_N$
) were sampled, and the corresponding values of $P\left({X}_j = 1|{\boldsymbol{\unicode{x3be}}}_n\right)$
(
$P\left({X}_j = 1|{\boldsymbol{\unicode{x3be}}}_n\right)$
( $j = 1,\dots, 10$
) were computed using Equation 28. For design cells with
$j = 1,\dots, 10$
) were computed using Equation 28. For design cells with $J = 30$
items, the probabilities were determined by setting
$J = 30$
items, the probabilities were determined by setting $P\left({X}_j = 1|{\boldsymbol{\unicode{x3be}}}_n\right) = P\left({X}_{10+j} = 1|{\boldsymbol{\unicode{x3be}}}_n\right) = P\left({X}_{20+j} = 1|{\boldsymbol{\unicode{x3be}}}_n\right)$
,
$P\left({X}_j = 1|{\boldsymbol{\unicode{x3be}}}_n\right) = P\left({X}_{10+j} = 1|{\boldsymbol{\unicode{x3be}}}_n\right) = P\left({X}_{20+j} = 1|{\boldsymbol{\unicode{x3be}}}_n\right)$
, $j = 1,\dots, 10$
. Let
$j = 1,\dots, 10$
. Let ${U}_{nj}$ $(n = 1,\dots, N$
;
$(n = 1,\dots, N$
; $J = 1, \dots, J)$
be random draws from the uniform distribution
$J = 1, \dots, J)$
be random draws from the uniform distribution $U\left(0,1\right).$
The score of respondent
$U\left(0,1\right).$
The score of respondent $n$
on item
$n$
on item $j$
was equal to 1 if
$j$
was equal to 1 if $P\left({X}_j = 1|{\xi}_n\right)>{U}_{jn}$
and 0 otherwise. Finally, respondent scores were collected in an
$P\left({X}_j = 1|{\xi}_n\right)>{U}_{jn}$
and 0 otherwise. Finally, respondent scores were collected in an $N\times J$
data matrix. The data generation process was replicated 2,000 times yielding datasets
$N\times J$
data matrix. The data generation process was replicated 2,000 times yielding datasets ${\mathbf{X}}_1,\dots, {\mathbf{X}}_{\mathrm{2,000}},$
coefficients
${\mathbf{X}}_1,\dots, {\mathbf{X}}_{\mathrm{2,000}},$
coefficients ${\widehat{\theta}}_1,\dots, {\widehat{\theta}}_{\mathrm{2,000}},$
and estimated SEs
${\widehat{\theta}}_1,\dots, {\widehat{\theta}}_{\mathrm{2,000}},$
and estimated SEs ${\widehat{SE}}_{{\widehat{\theta}}_1},\dots, {\widehat{SE}}_{{\widehat{\theta}}_{\mathrm{2,000}}}.$
4.1.3 Independent variables
Sample size.
Bias and coverage were investigated for three sample sizes ( $N = 100$
,
$N = 100$
, $N = 500,$
and
$N = 500,$
and $N = \mathrm{2,000}$
).
$N = \mathrm{2,000}$
). $N = 100$
may be considered too small for reliability analyses, but this sample size was included to investigate the behavior of the SEs and CIs in relatively small samples.
$N = 100$
may be considered too small for reliability analyses, but this sample size was included to investigate the behavior of the SEs and CIs in relatively small samples.
Reliability coefficients.
All coefficients listed in Table 1 were included. It can be expected that as an estimated coefficient approaches its theoretical bound—or if one or more of the statistics on which the coefficient is based approach their bounds—the bias of the SEs will increase and the coverage of the CI will decrease. Therefore, SEs of the sample mean, sample variance, and sample standard deviation were investigated for a low-mean item (i.e., the first item, referred to as item A $)$
, which is relatively close to the upper bound of 1; for a high-variance item (i.e., the item in the middle, for which
$)$
, which is relatively close to the upper bound of 1; for a high-variance item (i.e., the item in the middle, for which $j/J = 0.5$
, referred to as item B), which is relatively close to upper bound
$j/J = 0.5$
, referred to as item B), which is relatively close to upper bound $\frac{1}{4}$
; and for the sum score. The SEs of the sample covariance and sample correlation were investigated for item A and item B; item A and its rest score; and item B and its rest score. All other coefficients were investigated using the scores on all
$\frac{1}{4}$
; and for the sum score. The SEs of the sample covariance and sample correlation were investigated for item A and item B; item A and its rest score; and item B and its rest score. All other coefficients were investigated using the scores on all $J$
items.
$J$
items.
Dimensionality.
One-dimensional and two-dimensional versions of the model in Equation 28 were investigated. In the one-dimensional model, item response depended only on ${\xi}_1$
by setting
${\xi}_1$
by setting ${d}_{1j} = 1$
and
${d}_{1j} = 1$
and ${d}_{2j} = 0$
. In the two-dimensional model, odd items depended on
${d}_{2j} = 0$
. In the two-dimensional model, odd items depended on ${\xi}_1$
(
${\xi}_1$
( ${d}_{1j} = 1)$
and to a lesser extent on
${d}_{1j} = 1)$
and to a lesser extent on ${\xi}_2$
(
${\xi}_2$
( ${d}_{2j} = 0.5$
), whereas even items depended only on
${d}_{2j} = 0.5$
), whereas even items depended only on ${\xi}_2$
(
${\xi}_2$
( ${d}_{j1} = 0,{d}_{j2} = 1$
).
${d}_{j1} = 0,{d}_{j2} = 1$
).
Number of items.
The number of items was $J = 10$
and
$J = 10$
and $J = 30.$
Model complexity. Either the 5PAM or the 2PLM was investigated. The 5PAM was obtained by setting ${\mu}_{\gamma} = 0.1$
,
${\mu}_{\gamma} = 0.1$
, ${\sigma}_{\gamma} = 0.02$
, and
${\sigma}_{\gamma} = 0.02$
, and ${\sigma}_{\eta} = 0.02$
when generating item parameters. The 2PLM was obtained by setting
${\sigma}_{\eta} = 0.02$
when generating item parameters. The 2PLM was obtained by setting ${\mu}_{\gamma} = {\sigma}_{\gamma} = {\sigma}_{\eta} = 0.$
4.1.4 Dependent variables
The standard deviation of $\widehat{\theta}$
across the 2,000 replications was considered the true SE of
$\widehat{\theta}$
across the 2,000 replications was considered the true SE of $\widehat{\theta}$
,
$\widehat{\theta}$
, $S{E}_{\widehat{\theta}}$
. Let
$S{E}_{\widehat{\theta}}$
. Let ${\overline{SE}}_{\widehat{\theta}}$
be the mean value of
${\overline{SE}}_{\widehat{\theta}}$
be the mean value of ${\widehat{SE}}_{\widehat{\theta}}$
across the 2,000 replications; then, the scaled bias of
${\widehat{SE}}_{\widehat{\theta}}$
across the 2,000 replications; then, the scaled bias of ${\widehat{SE}}_{\widehat{\theta}}$
was computed as
${\widehat{SE}}_{\widehat{\theta}}$
was computed as
 $$\begin{align}\mathrm{bias} = \frac{{\widehat{SE}}_{\widehat{\theta}}-{\overline{\; SE}}_{\widehat{\theta}}}{{\widehat{SE}}_{\widehat{\theta}}}\times 100\%.\end{align}$$
Except for the sample mean, in each replication, a 95% CI was computed using $\widehat{\theta}\pm {z}_{.975}\times {\widehat{SE}}_{\widehat{\theta}}$
. For the sample mean, instead of a normal deviate, a t distribution with df =
$\widehat{\theta}\pm {z}_{.975}\times {\widehat{SE}}_{\widehat{\theta}}$
. For the sample mean, instead of a normal deviate, a t distribution with df = $N-1$
was used. The coverage was the percentage of times the CIs included the population value
$N-1$
was used. The coverage was the percentage of times the CIs included the population value $\theta$
. For the conditions examining the SEs of the variance and standard deviation of item B, in some replications, the sample coefficient was on the boundary of the parameter space, and the SE did not exist. These replications were omitted from the results. To accurately interpret the values of the coverage, a 95% Agresti–Coull (Reference Agresti and Coull1998) CI was derived, which equaled
$\theta$
. For the conditions examining the SEs of the variance and standard deviation of item B, in some replications, the sample coefficient was on the boundary of the parameter space, and the SE did not exist. These replications were omitted from the results. To accurately interpret the values of the coverage, a 95% Agresti–Coull (Reference Agresti and Coull1998) CI was derived, which equaled $\left[93.9\%,95.8\%\right]$
.
$\left[93.9\%,95.8\%\right]$
.
4.2 Results
The effects of dimensionality, number of items, and model complexity were small to negligible. Therefore, the results for the one-dimensional 2PLM for 10 items are reported here. The complete results are available in the supplementary material.
4.2.1 Mean
The bias of the SEs of the sample mean was close to negligible (Table 3). Under conditions in the supplementary material, for ${\overline{X}}_{\mathrm{A}}$
, some undercoverage was observed for
${\overline{X}}_{\mathrm{A}}$
, some undercoverage was observed for $N = 100$
. As the population mean for this item is relatively close to the boundary, the sampling distribution is skewed to the left. For small samples, it may not be represented well by a t distribution.
$N = 100$
. As the population mean for this item is relatively close to the boundary, the sampling distribution is skewed to the left. For small samples, it may not be represented well by a t distribution.
Bias of ${\widehat{SE}}_{\overline{X}}$
and coverage of the corresponding 95% Wald CI
${\widehat{SE}}_{\overline{X}}$
and coverage of the corresponding 95% Wald CI

Note: Coef. = coefficient, Par. = parameter value rounded to three decimals. Values 100, 500, and 2,000 in columns represent sample sizes. Item A is a low-mean dichotomous item, and item B is a high-variance dichotomous item (for details, see text). ${X}_{\mathrm{A}}$
and
${X}_{\mathrm{A}}$
and ${X}_{\mathrm{B}}$
denote the scores on items A and B, respectively, and
${X}_{\mathrm{B}}$
denote the scores on items A and B, respectively, and ${X}_{+}$
denotes the sum score. Coverage percentages outside the 95% Agresti–Coull CI [93.9%, 95.8%] are shown in boldface. Scaled bias larger than 10% is shown in boldface.
${X}_{+}$
denotes the sum score. Coverage percentages outside the 95% Agresti–Coull CI [93.9%, 95.8%] are shown in boldface. Scaled bias larger than 10% is shown in boldface.
4.2.2 Covariance
Under the proposed method, the SEs of the sample covariances exhibited negligible bias, with coverage at the expected level (Table 4, upper panel). Under the alternative method, bias was much larger, and none of the coverage percentages fell within the Agresti–Coull CI, indicating that the method’s assumptions were too strong for this type of data.
Bias of ${\widehat{SE}}_{C_{XY}}$
and coverage of the corresponding 95% Wald CI as estimated by the proposed method (upper panel), and under normality with homogeneous variances (StackExchange, 2020) (lower panel)
${\widehat{SE}}_{C_{XY}}$
and coverage of the corresponding 95% Wald CI as estimated by the proposed method (upper panel), and under normality with homogeneous variances (StackExchange, 2020) (lower panel)

Note: Coef. = coefficient, Par. = parameter value rounded to three decimals. Values 100, 500, and 2,000 in columns represent sample sizes. Item A is a low-mean dichotomous item, and item B is a high-variance dichotomous item (for details, see text). ${X}_{\mathrm{A}}$
and
${X}_{\mathrm{A}}$
and ${X}_{\mathrm{B}}$
denote the scores on items A and B, respectively, and
${X}_{\mathrm{B}}$
denote the scores on items A and B, respectively, and ${R}_{\left(\mathrm{A}\right)}$
ad
${R}_{\left(\mathrm{A}\right)}$
ad ${R}_{\left(\mathrm{B}\right)}$
denote the rest scores of item A and B, respectively. Coverage percentages outside the 95% Agresti–Coull CI [93.9%, 95.8%] are shown in boldface. Scaled bias larger than 10% is shown in boldface.
${R}_{\left(\mathrm{B}\right)}$
denote the rest scores of item A and B, respectively. Coverage percentages outside the 95% Agresti–Coull CI [93.9%, 95.8%] are shown in boldface. Scaled bias larger than 10% is shown in boldface.
4.2.3 Variance and standard deviation
Except for differences that can be attributed to Monte Carlo error, bias variances and standard deviations were identical. Therefore, only the results for the standard deviation are reported. Under the proposed method, the bias of the estimated SEs appears to be small (Table 5, upper panel). For item B, the results indicate undercoverage of the CI. This is to be expected because ${\sigma}_{X_{\mathrm{B}}}\approx .494$
, which is very close to the theoretical upper bound .5. As a result, the sampling distribution of
${\sigma}_{X_{\mathrm{B}}}\approx .494$
, which is very close to the theoretical upper bound .5. As a result, the sampling distribution of ${S}_{X_{\mathrm{B}}}$
is skewed to the left (see histograms of the sampling distribution
${S}_{X_{\mathrm{B}}}$
is skewed to the left (see histograms of the sampling distribution ${S}_{X_{\mathrm{B}}}$
, Van der Ark, Reference Van der Ark2025), and the normal approximation does not work well, even for larger samples. For item A and the sum score, the coverage was satisfactory for
${S}_{X_{\mathrm{B}}}$
, Van der Ark, Reference Van der Ark2025), and the normal approximation does not work well, even for larger samples. For item A and the sum score, the coverage was satisfactory for $N = 500$
and
$N = 500$
and $N = \mathrm{2,000}$
. Under the alternative estimation method (Table 5, lower panel), the bias was much larger, and none of coverage percentages were within the Agresti–Coull CI, suggesting that the method assumptions were too strong for this type of data.
$N = \mathrm{2,000}$
. Under the alternative estimation method (Table 5, lower panel), the bias was much larger, and none of coverage percentages were within the Agresti–Coull CI, suggesting that the method assumptions were too strong for this type of data.
Bias of ${\widehat{SE}}_{S_X}$
and coverage of the corresponding 95% Wald
${\widehat{SE}}_{S_X}$
and coverage of the corresponding 95% Wald $\mathrm{CI}$
as estimated by the proposed method (upper panel), and under normality (Ahn & Fessler, Reference Ahn and Fessler2003) (lower panel)
$\mathrm{CI}$
as estimated by the proposed method (upper panel), and under normality (Ahn & Fessler, Reference Ahn and Fessler2003) (lower panel)

Note: Coef. = coefficient, Par. = parameter value rounded to three decimals. Values 100, 500, and 2,000 in columns represent sample sizes. Item A is a low-mean dichotomous item, and item B is a high-variance dichotomous item (for details, see text). ${X}_A$
and
${X}_A$
and ${X}_B$
denote the scores on items A and B, respectively, and
${X}_B$
denote the scores on items A and B, respectively, and ${X}_{+}$
denotes the sum score. Coverage percentages outside the 95% Agresti–Coull CI [93.9%, 95.8%] are shown in boldface. Scaled bias larger than 10% is shown in boldface.
${X}_{+}$
denotes the sum score. Coverage percentages outside the 95% Agresti–Coull CI [93.9%, 95.8%] are shown in boldface. Scaled bias larger than 10% is shown in boldface.
1 55 replications resulted in an NA, and results are based on 1,945 replications.
4.2.4 Correlation
Under the proposed method, relative bias was large and coverage too low for $N = 100$
, but both improved quickly as the sample size increased. This may be because the correlation is a more complicated function of n than the mean, covariance, or standard deviation and therefore requires a larger sample size to stabilize. For the Fisher Z-transformation, SEs were not computed. Its CIs showed better coverage at
$N = 100$
, but both improved quickly as the sample size increased. This may be because the correlation is a more complicated function of n than the mean, covariance, or standard deviation and therefore requires a larger sample size to stabilize. For the Fisher Z-transformation, SEs were not computed. Its CIs showed better coverage at $N = 100$
and coverage comparable to the proposed CIs at larger sample sizes.
$N = 100$
and coverage comparable to the proposed CIs at larger sample sizes.
4.2.5 Split-half reliability coefficient and lambda coefficients
For all these coefficients, bias was small (Table 7). Similar to the sample correlation (Table 6), ${\widehat{\rho}}_{SH}$
showed slight undercoverage for
${\widehat{\rho}}_{SH}$
showed slight undercoverage for $N = 100$
(Table 7), a pattern that is also shown in the supplementary material. Within the lambda series,
$N = 100$
(Table 7), a pattern that is also shown in the supplementary material. Within the lambda series, ${\lambda}_2$
displayed slight undercoverage at
${\lambda}_2$
displayed slight undercoverage at $N = 100$
, while coverage was satisfactory for larger samples. In the supplementary material, the slight overcoverage for λ1 and λ3 in Table 7 is likely due to Monte Carlo error, as it did not appear under other conditions. By contrast, the CI for
$N = 100$
, while coverage was satisfactory for larger samples. In the supplementary material, the slight overcoverage for λ1 and λ3 in Table 7 is likely due to Monte Carlo error, as it did not appear under other conditions. By contrast, the CI for ${\lambda}_3$
proposed by Feldt et al. (Reference Feldt, Woodruff and Salih1987) exhibited systematic overcoverage (Table 7, last row).
${\lambda}_3$
proposed by Feldt et al. (Reference Feldt, Woodruff and Salih1987) exhibited systematic overcoverage (Table 7, last row).
Bias of ${\widehat{SE}}_{K_{XY}}$
and coverage of the corresponding 95% Wald
${\widehat{SE}}_{K_{XY}}$
and coverage of the corresponding 95% Wald $\mathrm{CI}$
as estimated by the proposed method (upper panel), and the coverage of the CI estimated using the Fisher Z-transformation (lower panel)
$\mathrm{CI}$
as estimated by the proposed method (upper panel), and the coverage of the CI estimated using the Fisher Z-transformation (lower panel)

Note: Coef. = coefficient, Par. = parameter value rounded to three decimals. Values 100, 500, and 2,000 in columns represent sample sizes. Item A is a low-mean dichotomous item, and item B is a high-variance dichotomous item (for details, see text). ${X}_{\mathrm{A}}$
and
${X}_{\mathrm{A}}$
and ${X}_{\mathrm{B}}$
denote the scores on items A and B, respectively, and
${X}_{\mathrm{B}}$
denote the scores on items A and B, respectively, and ${R}_{\left(\mathrm{A}\right)}$
ad
${R}_{\left(\mathrm{A}\right)}$
ad ${R}_{\left(\mathrm{B}\right)}$
denote the rest scores of item A and B, respectively. Coverage percentages outside the 95% Agresti–Coull CI [93.9%, 95.8%] are shown in boldface. Scaled bias larger than 10% is shown in boldface.
${R}_{\left(\mathrm{B}\right)}$
denote the rest scores of item A and B, respectively. Coverage percentages outside the 95% Agresti–Coull CI [93.9%, 95.8%] are shown in boldface. Scaled bias larger than 10% is shown in boldface.
Bias of SEs of reliability estimates ${\widehat{\unicode{x3c1}}}_{\mathrm{SH}}$
,
${\widehat{\unicode{x3c1}}}_{\mathrm{SH}}$
, ${\widehat{\unicode{x3bb}}}_1$
,
${\widehat{\unicode{x3bb}}}_1$
, ${\widehat{\unicode{x3bb}}}_2$
, and
${\widehat{\unicode{x3bb}}}_2$
, and ${\widehat{\unicode{x3bb}}}_3 = \unicode{x3b1}$
, and the coverage of the corresponding 95% Wald
${\widehat{\unicode{x3bb}}}_3 = \unicode{x3b1}$
, and the coverage of the corresponding 95% Wald $\mathrm{CI}$

Note: Coef. = coefficient, Par. = parameter value rounded to three decimals. Values 100, 500, and 2,000 in columns represent sample sizes. Coverage percentages outside the 95% Agresti–Coull CI [93.9%, 95.8%] are shown in boldface. Scaled bias larger than 10% is shown in boldface. * = CI as proposed by Feldt et al.(Reference Feldt, Woodruff and Salih1987).
5 Discussion
This study provided analytic estimates of SEs and corresponding Wald CIs for 10 coefficients that are often used in the output of reliability analysis: mean, covariance, variance, standard deviation, product-moment correlation, reliability estimates ${\lambda}_1$
,
${\lambda}_1$
, ${\lambda}_2$
, and
${\lambda}_2$
, and ${\lambda}_3$
(better known as Cronbach’s alpha), and the split-half reliability coefficient. The SEs were derived using a two-step procedure: the scaled bias of the SEs and the coverage of the corresponding Wald CIs were further investigated in a simulation study and, when available, compared to other formula-based estimates of SEs and CIs. The derived SEs were implemented in the freely available software package JASP (as of version 19), and all coefficients and SEs are freely available as R functions on the Open Science Framework repository (Van der Ark, Reference Van der Ark2025).
${\lambda}_3$
(better known as Cronbach’s alpha), and the split-half reliability coefficient. The SEs were derived using a two-step procedure: the scaled bias of the SEs and the coverage of the corresponding Wald CIs were further investigated in a simulation study and, when available, compared to other formula-based estimates of SEs and CIs. The derived SEs were implemented in the freely available software package JASP (as of version 19), and all coefficients and SEs are freely available as R functions on the Open Science Framework repository (Van der Ark, Reference Van der Ark2025).
In general, the scaled bias of the derived SEs was satisfactory for larger samples and coefficients whose values were not too close to the boundary of the parameter space. For more intricate coefficients (e.g., ${\unicode{x3bb}}_2$
), larger sample sizes were required than for a simple one (e.g., mean). For the covariance, variance, and standard deviation, other analytic SEs were available, which generally had a higher scaled bias than large-sample SEs. For the mean, it is well known that the conventional SE, based on the unbiased variance estimate, is unbiased, whereas the large-sample SE, based on the maximum-likelihood variance estimator, is not. Hence, for the mean, the conventional SE should always be preferred.
${\unicode{x3bb}}_2$
), larger sample sizes were required than for a simple one (e.g., mean). For the covariance, variance, and standard deviation, other analytic SEs were available, which generally had a higher scaled bias than large-sample SEs. For the mean, it is well known that the conventional SE, based on the unbiased variance estimate, is unbiased, whereas the large-sample SE, based on the maximum-likelihood variance estimator, is not. Hence, for the mean, the conventional SE should always be preferred.
Similarly, the coverage of the Wald CIs, based on large-sample SEs, was satisfactory for larger samples and coefficients whose values were not too close to the boundary of the parameter space. For the correlation and ${\unicode{x3bb}}_3$
(Cronbach’s alpha), an asymmetric analytic CI was available. For correlation coefficients, for small samples (
${\unicode{x3bb}}_3$
(Cronbach’s alpha), an asymmetric analytic CI was available. For correlation coefficients, for small samples ( $N = 100)$
, Fisher-Z transformation resulted in a better coverage than Wald-based CIs. However, for
$N = 100)$
, Fisher-Z transformation resulted in a better coverage than Wald-based CIs. However, for ${\unicode{x3bb}}_3$
, the transformation of Feldt et al. (Reference Feldt, Woodruff and Salih1987) did not result in better coverage than Wald CI.
${\unicode{x3bb}}_3$
, the transformation of Feldt et al. (Reference Feldt, Woodruff and Salih1987) did not result in better coverage than Wald CI.
If a coefficient lies close to a parameter boundary, sampling distribution tends to be skewed rather than normal, so Wald-based CIs may fail to be range-preserving and may exhibit undercoverage. For example, for ${\sigma_X}_B = 0.494$
, the coverage of the CI was too low in the simulation study, which can be because the value of
${\sigma_X}_B = 0.494$
, the coverage of the CI was too low in the simulation study, which can be because the value of ${\sigma_X}_B$
is close to its bound 0.5. In behavioral sciences, two types of bounds may be distinguished. First, coefficients may have theoretical bounds (e.g.,
${\sigma_X}_B$
is close to its bound 0.5. In behavioral sciences, two types of bounds may be distinguished. First, coefficients may have theoretical bounds (e.g., ${S}_x\ge 0$
,
${S}_x\ge 0$
, $\alpha \le 1$
,
$\alpha \le 1$
, $0\le {K}_{XY}\le 1$
). Second, coefficients may be bounded due to the data format. For example, for a single dichotomous item, the mean is bounded by 0 and 1, the variance by 0 and
$0\le {K}_{XY}\le 1$
). Second, coefficients may be bounded due to the data format. For example, for a single dichotomous item, the mean is bounded by 0 and 1, the variance by 0 and $\frac{1}{4}$
, and the standard deviation by 0 and
$\frac{1}{4}$
, and the standard deviation by 0 and $\frac{1}{2}$
. For two dichotomous items, the covariance is bounded by
$\frac{1}{2}$
. For two dichotomous items, the covariance is bounded by $-\frac{1}{4}$
and
$-\frac{1}{4}$
and $\frac{1}{4}$
. These bounds also restrict the mean, variance, standard deviation, and covariance of composite scores, such as the sum score or rest score. In addition, these bounds also restrict coefficients that are functions of the coefficients, such as Cronbach’s alpha (
$\frac{1}{4}$
. These bounds also restrict the mean, variance, standard deviation, and covariance of composite scores, such as the sum score or rest score. In addition, these bounds also restrict coefficients that are functions of the coefficients, such as Cronbach’s alpha ( ${\lambda}_3)$
, which is a function of the variance–covariance matrix.
${\lambda}_3)$
, which is a function of the variance–covariance matrix.
For Cronbach’s alpha, a series of papers has investigated its asymptotic distribution. Van Zyl et al. (Reference Van Zyl, Neudecker and Nel2000) derived an asymptotic normal distribution without restrictions on the covariance structure, and this result was extended to nonnormal distributions by Ogasawara (Reference Ogasawara2006) and Maydeu-Olivares et al. (Reference Maydeu-Olivares, Coffman and Hartmann2007). Some comparisons have been carried out; for example, Kuijpers et al. (Reference Kuijpers, Van der Ark and Croon2013b, Table 1) examined tests of the null hypothesis that Cronbach’s alpha equals a constant ccc and found that type I error rates were slightly better for the marginal modeling approach (from which the two-step procedure in this paper is derived) than for the method of Maydeu-Olivares et al. Nonetheless, a thorough comparison of different methods remains an important topic for future research.
The two-step procedure that was used to derive large-sample SEs assumes a multinomial distribution. On the one hand, by only assuming a multinomial distribution, the procedure is flexible with respect to the shape of the data distribution and can be applied to most coefficients used in social and behavioral research. In addition, the method can also be used to compute the asymptotic variance–covariance matrix between the coefficients. For example, in Appendix F, the asymptotic covariances of the sample variances and covariances were derived. On the other hand, as multinomial distribution is a discrete distribution, the procedure requires discrete scores (item scores, sum scores, and rest scores). Although the scores need not be integer-valued, for data in which virtually all respondents have distinct scores (e.g., time to complete a task measured in milliseconds), the procedure becomes time-consuming because each observed score is considered a separate category. This is particularly true when the asymptotic covariance matrix of the sample covariance matrix of the scores is required. In such cases, it is advisable to use alternative methods for continuous data. For example, for continuous data, the software package JASP computes SEs of the lambda coefficients under the assumption of an inverse Wishart distribution.
The study focused on analytic SEs, but SEs and CIs based on resampling, such as the nonparametric bootstrap (Efron & Tibshirani, Reference Efron and Tibshirani1986), or simulation, such as Mandel’s (Reference Mandel2013) simulation algorithm that replaces the delta method. Although these methods may also provide good or even better results with respect to bias and coverage, analytic SEs have several advantages over SEs and CIs based on resampling or simulation, which make them useful in their own right. First, they are efficient in the sense that, once derived, they are very fast to compute and do not require thousands of resamples. Second, they are deterministic; they give the same result every time without Monte Carlo error. Third, they are transparent; they clarify the mathematical relationship between the SE and the factors affecting the SE. Moreover, analytic SEs facilitate sample-size planning, since closed-form SEs can often be inverted to yield explicit formulas for the required sample size, unlike bootstrap-based Ses, which require computationally intensive simulations. A well-known case is the mean, where $N = 4{z}_{1-\unicode{x3b1} /2}^2{\sigma}^2/{m}^2$
. Once these formulas for the required sample size have been derived, this advantage extends to other coefficients, such as reliability estimates or standard deviations.
$N = 4{z}_{1-\unicode{x3b1} /2}^2{\sigma}^2/{m}^2$
. Once these formulas for the required sample size have been derived, this advantage extends to other coefficients, such as reliability estimates or standard deviations.
Supplementary material
R code and supplementary materials are available on OSF (https://osf.io/y3bae).
Funding statement
This research received no specific grant funding from any funding agency, commercial or not-for-profit sectors. Open access funding provided by University of Amsterdam.
Competing interests
The author declares no competing interests.
Appendix A: The estimated standard error of the sample mean
Let $\mathbf{R}$
be a
$\mathbf{R}$
be a $K\times 1$
vector containing the unique observed scores of
$K\times 1$
vector containing the unique observed scores of $X$
(cf. Table 2, left panel). The sample mean can be written in the generalized exp-log notation as
$X$
(cf. Table 2, left panel). The sample mean can be written in the generalized exp-log notation as
 $$\begin{align}{\mathbf{g}}_{\overline{X}} = \exp \left({\mathbf{A}}_2.\log \left({\mathbf{A}}_1.\mathbf{n}\right)\right)\end{align}$$
where ${\mathbf{A}}_1 = {\left[\mathbf{R}\kern0.5em {\boldsymbol{1}}_K\right]}^{\mathrm{T}}$
is a
${\mathbf{A}}_1 = {\left[\mathbf{R}\kern0.5em {\boldsymbol{1}}_K\right]}^{\mathrm{T}}$
is a $2\times K$
matrix and
$2\times K$
matrix and ${\mathbf{A}}_2 = \left[\begin{array}{cc}1& -1\end{array}\right]$
is a
${\mathbf{A}}_2 = \left[\begin{array}{cc}1& -1\end{array}\right]$
is a $1\times 2$
row vector. Let
$1\times 2$
row vector. Let ${\mathbf{g}}_0 = \mathbf{n}$
; then, following Equations 2 and 3,
${\mathbf{g}}_0 = \mathbf{n}$
; then, following Equations 2 and 3,
 $$\begin{align}{\mathbf{g}}_1 = \log \left({\mathbf{A}}_1.{\mathbf{g}}_0\Big)\right) = \log \left(\left[\begin{array}{c}\begin{array}{c}{\mathbf{R}}^{\rm T}\end{array}.\mathbf{n}\\ {}{\mathbf{1}}_K^{\rm T}.\mathbf{n}\end{array}\right]\;\right) = \left[\begin{array}{c}\log \left(\sum {X}_n\right)\\ {}\log (N)\end{array}\right],\end{align}$$
and
 $$\begin{align}{\mathbf{g}}_{\overline{X}} = {\mathbf{g}}_2 = \exp \left({\mathbf{A}}_2.{\mathbf{g}}_1\right) = \exp \left(\left[\begin{array}{cc}1& -1\end{array}\right]\;\left[\begin{array}{c}\log \left(\sum {X}_n\right)\\ {}\log (N)\end{array}\right]\right) = \left[\frac{\sum {X}_n}{N}\right] = \overline{X}.\end{align}$$
The Jacobian ${\mathbf{G}}_{\overline{X}}$
can be derived from
${\mathbf{G}}_{\overline{X}}$
can be derived from ${\mathbf{g}}_1$
and
${\mathbf{g}}_1$
and ${\mathbf{g}}_2$
. Let
${\mathbf{g}}_2$
. Let ${\mathbf{G}}_0 = \mathbf{I}$
. Following Equation 4,
${\mathbf{G}}_0 = \mathbf{I}$
. Following Equation 4,
 $$\begin{align}{\mathbf{G}}_1 = {\mathbf{D}}^{-1}\left({\mathbf{A}}_1.{\mathbf{g}}_0\right).{\mathbf{A}}_1.{\mathbf{G}}_0 = {\mathbf{D}}^{-1}\left(\left[\begin{array}{c}\sum {X}_n\\ {}N\end{array}\right]\right).\left[\begin{array}{c}\begin{array}{c}{\mathbf{R}}^{\mathrm{T}}\end{array}\\ {}{\mathbf{1}}_K^{\mathrm{T}}\end{array}\right].\mathbf{I} = \left[\begin{array}{c}\begin{array}{c}{\mathbf{R}}^{\mathrm{T}}/\sum {X}_n\end{array}\\ {}{\mathbf{1}}_K^{\mathrm{T}}/N\end{array}\right],\end{align}$$
and following Equation 5,
 $$\begin{align}{\mathbf{G}}_{\overline{X}} = {\mathbf{G}}_2 = \mathbf{D}\left(\exp \left({\mathbf{A}}_2.{\mathbf{g}}_1\right)\right).{\mathbf{A}}_2.{\mathbf{G}}_1 = \mathbf{D}\left(\left[\frac{\sum {X}_n}{N}\right]\right).\left[\begin{array}{cc}1& -1\end{array}\right].\left[\begin{array}{c}\begin{array}{c}\frac{{\mathbf{R}}^{\mathrm{T}}}{\sum {X}_n}\end{array}\\ {}\frac{{\mathbf{1}}_k^{\mathrm{T}}}{N}\end{array}\right] = \frac{{\mathbf{R}}^{\mathrm{T}}-\overline{X}.{\mathbf{1}}^{\mathrm{T}}}{N}\end{align}$$
Because the sample mean is a scalar, ${\widehat{\mathbf{V}}}_{\overline{X}}$
reduces to
${\widehat{\mathbf{V}}}_{\overline{X}}$
reduces to ${\widehat{V}}_{\overline{X}}$
. Furthermore, because
${\widehat{V}}_{\overline{X}}$
. Furthermore, because ${\mathbf{g}}_{\overline{X}}$
is homogeneous of order 0,
${\mathbf{g}}_{\overline{X}}$
is homogeneous of order 0, ${\widehat{V}}_{\overline{X}}$
is given by Equation 12; that is,
${\widehat{V}}_{\overline{X}}$
is given by Equation 12; that is,
 $$\begin{align}{\widehat{V}}_{\overline{X}}\approx {\mathbf{G}}_{\overline{X}}.\mathbf{D}\left(\mathbf{n}\right).{\mathbf{G}}_{\overline{X}}^{\mathrm{T}} = \left[\frac{{\mathbf{R}}^{\mathrm{T}}-\overline{X}.{\mathbf{1}}^{\mathrm{T}}}{N}\right].\mathbf{D}\left(\mathbf{n}\right).{\left[\frac{{\mathbf{R}}^{\mathrm{T}}-\overline{X}.{\mathbf{1}}^{\mathrm{T}}}{N}\right]}^{\mathrm{T}} = \frac{1}{N}{\sum}_{k = 1}^K{n}_k{\left\{{R}_k-\overline{X}\right\}}^2 = \frac{{\overset{\sim }{S}}_X^2}{N},\end{align}$$
where ${\overset{\sim }{S}}_X^2$
is the maximum-likelihood estimator of the variance, and the estimated standard error equals
${\overset{\sim }{S}}_X^2$
is the maximum-likelihood estimator of the variance, and the estimated standard error equals ${\widehat{SE}}_{\overline{X}} = \frac{{\overset{\sim }{s}}_X}{\sqrt{N}}.$
Note that if ${\sum}_n{X}_n<0$
,
${\sum}_n{X}_n<0$
, $\log \left({\sum}_n{X}_n\right)$
(Equation A2) exists only as a complex number. This does not affect the theoretical derivation of the standard errors. The expression
$\log \left({\sum}_n{X}_n\right)$
(Equation A2) exists only as a complex number. This does not affect the theoretical derivation of the standard errors. The expression $\exp \left({\mathbf{A}}_2.\log \left({\mathbf{A}}_1.{\mathbf{g}}_1\right)\right)$
(i.e., Equations A2 and A3 combined) is used only to divide
$\exp \left({\mathbf{A}}_2.\log \left({\mathbf{A}}_1.{\mathbf{g}}_1\right)\right)$
(i.e., Equations A2 and A3 combined) is used only to divide ${\sum}_n{X}_n$
by
${\sum}_n{X}_n$
by $N$
, and neither expression contains an imaginary part. The logarithm is not used in the derivation of the Jacobian. This reasoning applies to all derivations in this article.Footnote
2
If
$N$
, and neither expression contains an imaginary part. The logarithm is not used in the derivation of the Jacobian. This reasoning applies to all derivations in this article.Footnote
2
If ${\sum}_n{X}_n = 0$
,
${\sum}_n{X}_n = 0$
, $\log \left({\sum}_n{X}_n\right)$
does not exist, but replacing 0 with a small positive value (e.g.,
$\log \left({\sum}_n{X}_n\right)$
does not exist, but replacing 0 with a small positive value (e.g., $\epsilon = {10}^{-16}$
) gave good results.
$\epsilon = {10}^{-16}$
) gave good results.
Appendix B: The estimated standard error of the sample covariance
The unbiased covariance estimator equals ${C}_{XY} = \frac{1}{N-1}{\sum}_n\left({X}_n-\overline{X}\right)\left({Y}_n-\overline{Y}\right) = \frac{1}{N-1}\left({\sum}_n{X}_n{Y}_n-{\sum}_n{X}_n{\sum}_n{Y}_n/N\right).$
Let
${C}_{XY} = \frac{1}{N-1}{\sum}_n\left({X}_n-\overline{X}\right)\left({Y}_n-\overline{Y}\right) = \frac{1}{N-1}\left({\sum}_n{X}_n{Y}_n-{\sum}_n{X}_n{\sum}_n{Y}_n/N\right).$
Let $\mathbf{R}=\left[\begin{array}{cc}{\mathbf{r}}_X& {\mathbf{r}}_Y\end{array}\right]$
be the
$\mathbf{R}=\left[\begin{array}{cc}{\mathbf{r}}_X& {\mathbf{r}}_Y\end{array}\right]$
be the $K\times 2$
matrix containing the
$K\times 2$
matrix containing the $K$
possible response patterns with column vectors
$K$
possible response patterns with column vectors ${\mathbf{r}}_X$
and
${\mathbf{r}}_X$
and ${\mathbf{r}}_Y$
, and let
${\mathbf{r}}_Y$
, and let $\ast$
denote the Hadamar (i.e., elementwise) product. Then,
$\ast$
denote the Hadamar (i.e., elementwise) product. Then, ${C}_{XY}$
can be written in the generalized exp-log notation as
${C}_{XY}$
can be written in the generalized exp-log notation as
 $$\begin{align}{\mathbf{g}}_{C_{XY}} = \exp \left({\mathbf{A}}_4.\log \left({\mathbf{A}}_3.\exp \left({\mathbf{A}}_2.\log \left({\mathbf{A}}_1.\mathbf{n}\right)\right)\right)\right),\end{align}$$
where ${\mathbf{A}}_1 = {\left[\begin{array}{ccccc}{\mathbf{r}}_X& {\mathbf{r}}_Y& {\mathbf{r}}_X\ast {\mathbf{r}}_Y& {\mathbf{1}}_K& {\mathbf{1}}_K\end{array}\right]}^{\mathrm{T}}$
is a
${\mathbf{A}}_1 = {\left[\begin{array}{ccccc}{\mathbf{r}}_X& {\mathbf{r}}_Y& {\mathbf{r}}_X\ast {\mathbf{r}}_Y& {\mathbf{1}}_K& {\mathbf{1}}_K\end{array}\right]}^{\mathrm{T}}$
is a $5\times K$
matrix,
$5\times K$
matrix, ${\mathbf{A}}_2 = \left[\begin{array}{ccccc}1& 1& 0& -1& 0\\ {}0& 0& 1& 0& 0\\ {}0& 0& 0& 1& 0\\ {}0& 0& 0& 1& -1\end{array}\right]$
is a
${\mathbf{A}}_2 = \left[\begin{array}{ccccc}1& 1& 0& -1& 0\\ {}0& 0& 1& 0& 0\\ {}0& 0& 0& 1& 0\\ {}0& 0& 0& 1& -1\end{array}\right]$
is a $4\times 5$
matrix,
$4\times 5$
matrix, ${\mathbf{A}}_3 = \left[\begin{array}{cccc}-1& 1& 0& 0\\ {}0& 0& 1& -1\end{array}\right]$
is a
${\mathbf{A}}_3 = \left[\begin{array}{cccc}-1& 1& 0& 0\\ {}0& 0& 1& -1\end{array}\right]$
is a $2\times 4$
matrix and
$2\times 4$
matrix and ${\mathbf{A}}_4 = \left[\begin{array}{cc}1& -1\end{array}\right]$
is a
${\mathbf{A}}_4 = \left[\begin{array}{cc}1& -1\end{array}\right]$
is a $1\times 2$
row vector. With
$1\times 2$
row vector. With ${\mathbf{g}}_0 = \mathbf{n}$
,
${\mathbf{g}}_0 = \mathbf{n}$
, $C{P}_n = \left({X}_n-\overline{X}\right)\left({Y}_n-\overline{Y}\right)$
and cross-product
$C{P}_n = \left({X}_n-\overline{X}\right)\left({Y}_n-\overline{Y}\right)$
and cross-product $CP = {\sum}_nC{P}_n = {\sum}_n\left({X}_n-\overline{X}\right)\left({Y}_n-\overline{Y}\right) = {\sum}_n{X}_n{Y}_n-{\sum}_n{X}_n{\sum}_n{Y}_n/N$
, following Equations 2 and 3,
$CP = {\sum}_nC{P}_n = {\sum}_n\left({X}_n-\overline{X}\right)\left({Y}_n-\overline{Y}\right) = {\sum}_n{X}_n{Y}_n-{\sum}_n{X}_n{\sum}_n{Y}_n/N$
, following Equations 2 and 3,
 $$\begin{align}{\mathbf{g}}_1 = \log \left({\mathbf{A}}_1.{\mathbf{g}}_0\right) = \log \left({\left[\begin{array}{ccccc}{\mathbf{r}}_X& {\mathbf{r}}_Y& {\mathbf{r}}_X\ast {\mathbf{r}}_Y& {\mathbf{1}}_K& {\mathbf{1}}_K\end{array}\right]}^{\mathrm{T}}.\mathbf{n}\;\right) = \left[\begin{array}{c}\log \left(\sum {X}_n\right)\\ {}\log \left(\sum {Y}_n\right)\\ {}\log \left(\sum {X}_n{Y}_n\right)\\ {}\log (N)\\ {}\log (N)\end{array}\right],\end{align}$$
 $$\begin{align}{\mathbf{g}}_2 = \exp \left({\mathbf{A}}_2.{\mathbf{g}}_1\right) = \exp \left(\;\left[\begin{array}{ccccc}1& 1& 0& -1& 0\\ {}0& 0& 1& 0& 0\\ {}0& 0& 0& 1& 0\\ {}0& 0& 0& 1& -1\end{array}\right].\left[\begin{array}{c}\log \left(\sum {X}_n\right)\\ {}\log \left(\sum {Y}_n\right)\\ {}\log \left(\sum {X}_n{Y}_n\right)\\ {}\log (N)\\ {}\log (N)\end{array}\right]\;\right) = \left[\begin{array}{c}\frac{\sum {X}_n\sum {Y}_n}{N}\\ {}\sum {X}_n{Y}_n\\ {}N\\ {}1\end{array}\right],\end{align}$$
 $$\begin{align}{\mathbf{g}}_3 = \log \left({\mathbf{A}}_3.{\mathbf{g}}_2\right) = \log \left(\left[\begin{array}{cccc}-1& 1& 0& 0\\ {}0& 0& 1& -1\end{array}\right].\left[\begin{array}{c}\frac{\sum {X}_n\sum {Y}_n}{N}\\ {}\sum {X}_n{Y}_n\\ {}N\\ {}1\end{array}\right]\right) = \left[\begin{array}{c}\log (CP)\\ {}\log \left(N-1\right)\end{array}\right],\end{align}$$
and
 $$\begin{align}{\mathbf{g}}_{C_{XY}} = {\mathbf{g}}_4 = \exp \left({\mathbf{A}}_4.{\mathbf{g}}_3\right) = \exp \left(\left[\begin{array}{cc}1& -1\end{array}\right].\left[\begin{array}{c}\log (CP)\\ {}\log \left(N-1\right)\end{array}\right]\right) = \frac{CP}{N-1} = {C}_{XY}.\end{align}$$
Jacobian ${\mathbf{G}}_C$
can be derived from
${\mathbf{G}}_C$
can be derived from ${\mathbf{g}}_1,{\mathbf{g}}_2,{\mathbf{g}}_3$
, and
${\mathbf{g}}_1,{\mathbf{g}}_2,{\mathbf{g}}_3$
, and ${\mathbf{g}}_4$
. Let
${\mathbf{g}}_4$
. Let ${\mathbf{G}}_0 = \mathbf{I}$
. Following Equations 4 and 5,
${\mathbf{G}}_0 = \mathbf{I}$
. Following Equations 4 and 5,
 $$\begin{align}{\mathbf{G}}_1 = {\mathbf{D}}^{-1}\left({\mathbf{A}}_1.{\mathbf{g}}_0\right).{\mathbf{A}}_1.{\mathbf{G}}_0 = {\mathbf{D}}^{-1}\left(\left[\begin{array}{c}\sum {X}_n\\ {}\sum {Y}_n\\ {}\sum {X}_n{Y}_n\\ {}N\\ {}N\end{array}\right]\right).{\left[\begin{array}{ccccc}{\mathbf{r}}_X& {\mathbf{r}}_Y& {\mathbf{r}}_X\ast {\mathbf{r}}_Y& {\mathbf{1}}_K& {\mathbf{1}}_K\end{array}\right]}^{\mathrm{T}}.\mathbf{I} = \left[\begin{array}{c}\frac{{\mathbf{r}}_X^{\mathrm{T}}}{\sum {X}_n}\\ {}\frac{{\mathbf{r}}_Y^{\mathrm{T}}}{\sum {Y}_n}\\ {}\frac{{\mathbf{r}}_X^{\mathrm{T}}\ast {\mathbf{r}}_Y^{\mathrm{T}}}{\sum {X}_n{Y}_n}\\ {}\frac{{\mathbf{1}}_K^{\mathrm{T}}}{N}\\ {}\frac{{\mathbf{1}}_K^{\mathrm{T}}}{N}\end{array}\right],\end{align}$$
 $$\begin{align}{\mathbf{G}}_2 = \mathbf{D}\left(\exp \left({\mathbf{A}}_2.{\mathbf{g}}_1\right)\right).{\mathbf{A}}_2.{\mathbf{G}}_1 = \mathbf{D}\left(\left[\begin{array}{c}\frac{\sum {X}_n\sum {Y}_n}{N}\\ {}\sum {X}_n{Y}_n\\ {}N\\ {}1\end{array}\right]\right).\left[\begin{array}{ccccc}1& 1& 0& -1& 0\\ {}0& 0& 1& 0& 0\\ {}0& 0& 0& 1& 0\\ {}0& 0& 0& 1& -1\end{array}\right].\left[\begin{array}{c}\frac{{\mathbf{r}}_X^{\mathrm{T}}}{\sum {X}_n}\\ {}\frac{{\mathbf{r}}_Y^{\mathrm{T}}}{\sum {Y}_n}\\ {}\frac{{\mathbf{r}}_X^{\mathrm{T}}\ast {\mathbf{r}}_Y^{\mathrm{T}}}{\sum {X}_n{Y}_n}\\ {}\frac{{\mathbf{1}}_K^{\mathrm{T}}}{N}\\ {}\frac{{\mathbf{1}}_K^{\mathrm{T}}}{N}\end{array}\right] = \left[\begin{array}{c}{\mathbf{r}}_X^{\mathrm{T}}\overline{Y}+{\mathbf{r}}_Y^{\mathrm{T}}\overline{X}-{\mathbf{1}}_K^{\mathrm{T}}\overline{X}\overline{Y}\\ {}{\mathbf{r}}_X^{\mathrm{T}}\ast {\mathbf{r}}_Y^{\mathrm{T}}\;\\ {}{\mathbf{1}}_K^T\\ {}{\mathbf{0}}_K^T\end{array}\right],\end{align}$$
 $$\begin{align}{\mathbf{G}}_3 = {\mathbf{D}}^{-1}\left({\mathbf{A}}_3.{\mathbf{g}}_2\right).{\mathbf{A}}_3.{\mathbf{G}}_2 = {\mathbf{D}}^{-1}\left(\left[\begin{array}{c} CP\\ {}N-1\end{array}\right]\right).\left[\begin{array}{cccc}-1& 1& 0& 0\\ {}0& 0& 1& -1\end{array}\right].\left[\begin{array}{c}{\mathbf{r}}_X^{\mathrm{T}}\overline{Y}+{\mathbf{r}}_Y^{\mathrm{T}}\overline{X}-{\mathbf{1}}_K^{\mathrm{T}}\overline{X}\overline{Y}\\ {}{\mathbf{r}}_X\ast {\mathbf{r}}_Y\\ {}{\mathbf{1}}_K^T\\ {}{\mathbf{0}}_K^T\end{array}\right] = \left[\begin{array}{c}\frac{\left({\mathbf{r}}_X-\overline{X}\right)\left({\mathbf{r}}_Y-\overline{Y}\right)}{CP}\\ {}{\mathbf{1}}^T/\left(N-1\right)\end{array}\right],\end{align}$$
and, the Jacobian equals
 $$\begin{align}{\mathbf{G}}_{C_{XY}} &= {\mathbf{G}}_4 = \mathbf{D}\left(\exp \left({\mathbf{A}}_4.{\mathbf{g}}_3\right)\right).{\mathbf{A}}_4.{\mathbf{G}}_3 = {C}_{XY}.\left[\begin{array}{cc}1& -1\end{array}\right].\left[\begin{array}{c}\frac{\left({\mathbf{r}}_X^{\mathrm{T}}-\overline{X}\right)\ast \left({\mathbf{r}}_Y^{\mathrm{T}}-\overline{Y}\right)}{CP}\\ {}\frac{{\mathbf{1}}^{\mathrm{T}}}{N-1}\end{array}\right] = {C}_{XY}\left(\frac{\left({\mathbf{r}}_X^{\mathrm{T}}-\overline{X}\right)\left({\mathbf{r}}_Y^{\mathrm{T}}-\overline{Y}\right)}{CP}-\frac{{\mathbf{1}}^{\mathrm{T}}}{N-1}\right) \nonumber\\&={C}_{XY}\left(\frac{\left({\mathbf{r}}_X^{\mathrm{T}}-\overline{X}\right)\left({\mathbf{r}}_Y^{\mathrm{T}}-\overline{Y}\right)}{C_{XY}\left(N-1\right)}-\frac{{\mathbf{1}}^{\mathrm{T}}}{N-1}\right) = \frac{\left({\mathbf{r}}_X^{\mathrm{T}}-\overline{X}\right)\left({\mathbf{r}}_Y^{\mathrm{T}}-\overline{Y}\right)-{C}_{XY}{\mathbf{1}}^{\mathrm{T}}}{\left(N-1\right){\mathbf{1}}^{\mathrm{T}}}. \end{align}$$
Because the sample covariance is a scalar, ${\widehat{\mathbf{V}}}_{C_{XY}}$
reduces to
${\widehat{\mathbf{V}}}_{C_{XY}}$
reduces to ${\widehat{V}}_{C_{XY}}$
, and because
${\widehat{V}}_{C_{XY}}$
, and because ${\mathbf{g}}_{C_{XY}}$
is not homogeneous of order 0, Equation 14 should be used to compute
${\mathbf{g}}_{C_{XY}}$
is not homogeneous of order 0, Equation 14 should be used to compute ${\widehat{V}}_{C_{XY}}$
. The
${\widehat{V}}_{C_{XY}}$
. The $k$
th element of
$k$
th element of ${\mathbf{G}}_{C_{XY}}$
(Equation B9) equals
${\mathbf{G}}_{C_{XY}}$
(Equation B9) equals ${G}_k = \frac{\left({R}_{X_k}-\overline{X}\right)\left({R}_{Y_k}-\overline{Y}\right)-{C}_{XY}}{N-1}$
. Let
${G}_k = \frac{\left({R}_{X_k}-\overline{X}\right)\left({R}_{Y_k}-\overline{Y}\right)-{C}_{XY}}{N-1}$
. Let ${\delta}_{kl}$
be Kronecker delta; that is,
${\delta}_{kl}$
be Kronecker delta; that is, ${\delta}_{kl} = 1$
if
${\delta}_{kl} = 1$
if $l = k$
, and
$l = k$
, and ${\delta}_{kl} = 0$
otherwise. The estimated variance of
${\delta}_{kl} = 0$
otherwise. The estimated variance of ${C}_{XY}$
equals
${C}_{XY}$
equals
 $$\begin{align}{\widehat{V}}_{C_{XY}} = {\sum}_k{n}_k{\left(\frac{\left({R}_{X_k}-\overline{X}\right)\left({R}_{Y_k}-\overline{Y}\right)-{C}_{XY}}{N-1}\right)}^2- \frac{1}{N}{\sum}_K{\sum}_l{n}_k{n}_l\left(\frac{\left({R}_{X_k}-\overline{X}\right)\left({R}_{Y_k}-\overline{Y}\right)-{C}_{XY}}{N-1}\right)\left(\frac{\left({R}_{X_l}-\overline{X}\right)\left({R}_{Y_l}-\overline{Y}\right)-{C}_{XY}}{N-1}\right).\end{align}$$
Rather than in terms of frequencies for response patterns $k$
and
$k$
and $l$
, Equation B10 can be rewritten for individual observations
$l$
, Equation B10 can be rewritten for individual observations $n$
and
$n$
and $m$
(hence, the frequencies
$m$
(hence, the frequencies ${n}_k$
and
${n}_k$
and ${n}_l$
in Equation B10 reduce to 1), resulting in
${n}_l$
in Equation B10 reduce to 1), resulting in
 $$\begin{align}{\widehat{V}}_{C_{XY}} = {\sum}_n{\left(\frac{\left({X}_n-\overline{X}\right)\left({Y}_n-\overline{Y}\right)-{C}_{XY}}{N-1}\right)}^2-\frac{1}{N}{\sum}_m{\sum}_n\left(\frac{\left({X}_m-\overline{X}\right)\left({Y}_m-\overline{Y}\right)-{C}_{XY}}{N-1}\right)\left(\frac{\left({X}_n-\overline{X}\right)\left({Y}_n-\overline{Y}\right)-{C}_{XY}}{N-1}\right).\end{align}$$
With ${d}_{X{Y}_n} = \frac{\left({X}_n-\overline{X}\right)\left({Y}_n-\overline{Y}\right)-{C}_{XY}}{N-1}$
(see Equation 15), the estimated standard error equals
${d}_{X{Y}_n} = \frac{\left({X}_n-\overline{X}\right)\left({Y}_n-\overline{Y}\right)-{C}_{XY}}{N-1}$
(see Equation 15), the estimated standard error equals
 $$\begin{align}{\widehat{SE}}_{C_{XY}} = \sqrt{\sum_n{d_{XY}^2}_n-\frac{1}{N}{\sum}_m{\sum}_n{d}_{X{Y}_m}{d}_{X{Y}_n}}.\end{align}$$
The expression $\frac{1}{N}{\sum}_m{\sum}_n{d}_{X{Y}_m}{d}_{X{Y}_n}$
in Equation 16 equals
$\frac{1}{N}{\sum}_m{\sum}_n{d}_{X{Y}_m}{d}_{X{Y}_n}$
in Equation 16 equals
 $$\begin{align*}\frac{1}{N}{\sum}_m{\sum}_n{d_{XY}}_m{d_{XY}}_n = \frac{1}{N}{\sum}_m{\sum}_n\left(\frac{\left({X}_m-\overline{X}\right)\left({Y}_m-\overline{Y}\right)-{C}_{XY}}{N-1}\right)\left(\frac{\left({X}_n-\overline{X}\right)\left({Y}_n-\overline{Y}\right)-{C}_{XY}}{N-1}\right) \end{align*}$$
 $$\begin{align*}=\frac{1}{N}{\sum}_m{\sum}_n\left(\frac{\left({X}_m-\overline{X}\right)\left({Y}_m-\overline{Y}\right)\left({X}_n-\overline{X}\right)\left({Y}_n-\overline{Y}\right)-\left({X}_m-\overline{X}\right)\left({Y}_m-\overline{Y}\right){C}_{XY}-\left({X}_n-\overline{X}\right)\left({Y}_n-\overline{Y}\right){C}_{XY}+{C}_{XY}^2}{{\left(N-1\right)}^2}\right) = \end{align*}$$
 $$\begin{align*}=\frac{\sum_m{\sum}_n\left({X}_m-\overline{X}\right)\left({Y}_m-\overline{Y}\right)\left({X}_n-\overline{X}\right)\left({Y}_n-\overline{Y}\right)-2{C}_{XY}{\sum}_n\left({X}_n-\overline{X}\right)\left({Y}_n-\overline{Y}\right)+{C}_{XY}^2}{N{\left(N-1\right)}^2} \end{align*}$$
 $$\begin{align*}=\frac{1}{N{\left(N-1\right)}^2}\left\{{\left(N-1\right)}^2{C}_{XY}^2-2{C}_{XY}N\left(N-1\right){C}_{XY}+{N}^2{C}_{XY}^2\right\} \end{align*}$$
 $$\begin{align}=\frac{N-1}{N}{C}_{XY}^2-2{C}_{XY}^2+\frac{N}{N-1}{C}_{XY}^2.\end{align}$$
For large $N$
,
$N$
, $N/(N-1)\approx 1$
, and replacing
$N/(N-1)\approx 1$
, and replacing $N-1$
by
$N-1$
by $N$
in the last term of Equation B13 has neglible effect on the outcome. When doing so, that term becomes 0. As a result, for large
$N$
in the last term of Equation B13 has neglible effect on the outcome. When doing so, that term becomes 0. As a result, for large $N$
$N$
 $$\begin{align}{\widehat{SE}}_{C_{XY}}\approx {\widehat{SE}}_{C_{XY}}^{\ast} = \sqrt{\sum_n{d}_{X{Y}_n}^2}.\end{align}$$
Appendix C: The estimated standard error of the sample standard deviation
The estimator of the standard deviation equals the square root of the unbiased estimator of the variance; that is, ${S}_X = \sqrt{S_X^2} = \sqrt{\frac{1}{N-1}{\sum}_n{\left({X}_n-\overline{X}\right)}^2},$
which can be written in generalized exp-log notation: let
${S}_X = \sqrt{S_X^2} = \sqrt{\frac{1}{N-1}{\sum}_n{\left({X}_n-\overline{X}\right)}^2},$
which can be written in generalized exp-log notation: let ${a}_1 = 1$
and Let
${a}_1 = 1$
and Let ${a}_2 = \frac{1}{2}$
, both be
${a}_2 = \frac{1}{2}$
, both be $1\times 1$
scalars. With
$1\times 1$
scalars. With ${g}_0 = {S}_X^2$
, and following Equations 2 and 3,
${g}_0 = {S}_X^2$
, and following Equations 2 and 3,
 $$\begin{align}{g}_1 = \log \left({a}_1\;{g}_0\right) = \log \left({S}_X^2\right),\end{align}$$
and
 $$\begin{align}{g}_S = {g}_2 = \exp \left({a}_2{g}_1\right) = \exp \left(\frac{1}{2}\log \left({S}_X^2\right)\right) = {S}_X.\end{align}$$
The Jacobian ${\mathbf{G}}_{S_X}$
can be derived from
${\mathbf{G}}_{S_X}$
can be derived from ${g}_1\;\mathrm{and}\;{g}_2.$
With
${g}_1\;\mathrm{and}\;{g}_2.$
With ${G}_0 = 1$
, and following Equations 4 and 5,
${G}_0 = 1$
, and following Equations 4 and 5,
 $$\begin{align}{G}_1 = \frac{1}{a_1.{g}_0}{a}_1{G}_0 = \frac{1}{S_X^2}\end{align}$$
and
 $$\begin{align}{G}_{S_X} = {G}_2 = \left(\exp \left({a}_2{g}_1\right)\right){a}_2{G}_1 = {S}_X\left(\frac{1}{2}\right)\left(\frac{1}{S_X^2}\right) = \frac{1}{2{S}_x}.\end{align}$$
Following Equation 11 and using the result from Equation C4, the estimated variance of ${S}_X$
equals
${S}_X$
equals
 $$\begin{align}{\widehat{V}}_{S_X} = {G}_{S_X}^2{\widehat{V}}_{S_X^2} = \frac{1}{4{S}_x^2}{\widehat{V}}_{S_X^2}.\end{align}$$
Then, ${\widehat{SE}}_{S_X}$
equals the square root of Equation C
5; that is,
${\widehat{SE}}_{S_X}$
equals the square root of Equation C
5; that is,
 $$\begin{align}{\widehat{SE}}_{S_X} = \sqrt{\frac{1}{4{S}_x^2}\left({\widehat{V}}_{S_X^2}\right)} = \frac{1}{2{S}_X}{\widehat{SE}}_{S_X^2}.\end{align}$$
Appendix D: The estimated standard error of the sample product-moment correlation
The sample product-moment correlation coefficient equals ${K}_{XY} = \frac{c_{XY}}{s_X{s}_Y}.$
Let
${K}_{XY} = \frac{c_{XY}}{s_X{s}_Y}.$
Let $\mathbf{R}=\left[\begin{array}{cc}{\mathbf{r}}_X& {\mathbf{r}}_Y\end{array}\right]$
be the
$\mathbf{R}=\left[\begin{array}{cc}{\mathbf{r}}_X& {\mathbf{r}}_Y\end{array}\right]$
be the $K\times 2$
matrix containing the
$K\times 2$
matrix containing the $K$
possible response patterns with column vectors
$K$
possible response patterns with column vectors ${\mathbf{r}}_X$
and
${\mathbf{r}}_X$
and ${\mathbf{r}}_Y$
, and let
${\mathbf{r}}_Y$
, and let $\ast$
denote the Hadamar product. Then,
$\ast$
denote the Hadamar product. Then, ${K}_{XY}$
can be written in the generalized exp-log notation as
${K}_{XY}$
can be written in the generalized exp-log notation as
 $$\begin{align}{\mathbf{g}}_{K_{XY}} = \exp \left({\mathbf{A}}_4.\log \left({\mathbf{A}}_3.\exp \left({\mathbf{A}}_2.\log \left({\mathbf{A}}_1.\mathbf{n}\right)\right)\right)\right),\end{align}$$
where ${\mathbf{A}}_1 = {\left[\begin{array}{cccccc}{\mathbf{r}}_X& {\mathbf{r}}_Y& {\mathbf{r}}_X^2& {\mathbf{r}}_Y^2& {\mathbf{r}}_X\ast {\mathbf{r}}_Y& {\mathbf{1}}_K\end{array}\right]}^{\mathrm{T}}$
is a
${\mathbf{A}}_1 = {\left[\begin{array}{cccccc}{\mathbf{r}}_X& {\mathbf{r}}_Y& {\mathbf{r}}_X^2& {\mathbf{r}}_Y^2& {\mathbf{r}}_X\ast {\mathbf{r}}_Y& {\mathbf{1}}_K\end{array}\right]}^{\mathrm{T}}$
is a $6\times K$
matrix,
$6\times K$
matrix, ${\mathbf{A}}_2 = \left[\begin{array}{c@{\kern1pt}c@{\kern1pt}c@{\kern1pt}c@{\kern1pt}c@{\kern1pt}c}0& 0& 0& 0& 1& 0\\ {}1& 1& 0& 0& 0& -1\\ {}0& 0& 1& 0& 0& 0\\ {}2& 0& 0& 0& 0& -1\\ {}0& 0& 0& 1& 0& 0\\ {}0& 2& 0& 0& 0& -1\end{array}\right]$
is a
${\mathbf{A}}_2 = \left[\begin{array}{c@{\kern1pt}c@{\kern1pt}c@{\kern1pt}c@{\kern1pt}c@{\kern1pt}c}0& 0& 0& 0& 1& 0\\ {}1& 1& 0& 0& 0& -1\\ {}0& 0& 1& 0& 0& 0\\ {}2& 0& 0& 0& 0& -1\\ {}0& 0& 0& 1& 0& 0\\ {}0& 2& 0& 0& 0& -1\end{array}\right]$
is a $6\times 6$
matrix,
$6\times 6$
matrix, ${\mathbf{A}}_3 = \left[\begin{array}{c@{\kern1pt}c@{\kern1pt}c@{\kern1pt}c@{\kern1pt}c@{\kern1pt}c}1& -1& 0& 0& 0& 0\\ {}0& 0& 1& -1& 0& 0\\ {}0& 0& 0& 0& 1& -1\end{array}\right]$
is a
${\mathbf{A}}_3 = \left[\begin{array}{c@{\kern1pt}c@{\kern1pt}c@{\kern1pt}c@{\kern1pt}c@{\kern1pt}c}1& -1& 0& 0& 0& 0\\ {}0& 0& 1& -1& 0& 0\\ {}0& 0& 0& 0& 1& -1\end{array}\right]$
is a $3\times 6$
, and
$3\times 6$
, and ${\mathbf{A}}_4 = \left[\begin{array}{ccc}1& -\frac{1}{2}& -\frac{1}{2}\end{array}\right]$
is a
${\mathbf{A}}_4 = \left[\begin{array}{ccc}1& -\frac{1}{2}& -\frac{1}{2}\end{array}\right]$
is a $1\times 3$
row vector. With
$1\times 3$
row vector. With ${\mathbf{g}}_0 = \mathbf{n}$
,
${\mathbf{g}}_0 = \mathbf{n}$
,
 $$\begin{align}{\mathbf{g}}_1 = \log \left({\mathbf{A}}_1.{\mathbf{g}}_0\right) = \log \left({\left[\begin{array}{cccccc}{\mathbf{r}}_X& {\mathbf{r}}_Y& {\mathbf{r}}_X^2& {\mathbf{r}}_Y^2& {\mathbf{r}}_X\ast {\mathbf{r}}_Y& {\mathbf{1}}_K\end{array}\right]}^{\mathrm{T}}\mathbf{n}\;\right) = \left[\begin{array}{c}\log \left(\sum {X}_n\right)\\ {}\log \left(\sum {Y}_n\right)\\ {}\log \left(\sum {X}_n^2\right)\\ {}\log \left(\sum {Y}_n^2\right)\\ {}\log \left(\sum {X}_n{Y}_n\right)\\ {}\log (N)\end{array}\right],\end{align}$$
 $$\begin{align}{\mathbf{g}}_2 = \exp \left({\mathbf{A}}_2.{\mathbf{g}}_1\right) = \exp \left(\;\left[\begin{array}{cccccc}0& 0& 0& 0& 1& 0\\ {}1& 1& 0& 0& 0& -1\\ {}0& 0& 1& 0& 0& 0\\ {}2& 0& 0& 0& 0& -1\\ {}0& 0& 0& 1& 0& 0\\ {}0& 2& 0& 0& 0& -1\end{array}\right].\left[\begin{array}{c}\log \left(\sum {X}_n\right)\\ {}\log \left(\sum {Y}_n\right)\\ {}\log \left(\sum {X}_n^2\right)\\ {}\log \left(\sum {Y}_n^2\right)\\ {}\log \left(\sum {X}_n{Y}_n\right)\\ {}\log (N)\end{array}\right]\;\right) = \left[\begin{array}{c}\sum {X}_n{Y}_n\\ {}\frac{\sum {X}_n\sum {Y}_n}{N}\\ {}\sum {X}_n^2\\ {}\frac{{\left(\sum {X}_n\right)}^2}{N}\;\\ {}\sum {Y}_n^2\\ {}\frac{{\left(\sum {Y}_n\right)}^2}{N}\end{array}\right],\end{align}$$
 $$\begin{align}{\mathbf{g}}_3 = \log \left({\mathbf{A}}_3.{\mathbf{g}}_2\right) = \log \left(\left[\begin{array}{cccccc}1& -1& 0& 0& 0& 0\\ {}0& 0& 1& -1& 0& 0\\ {}0& 0& 0& 0& 1& -1\end{array}\right].\left[\begin{array}{c}\sum {X}_n{Y}_n\\ {}\frac{\sum {X}_n\sum {Y}_n}{N}\\ {}\sum {X}_n^2\\ {}\frac{{\left(\sum {X}_n\right)}^2}{N}\;\\ {}\sum {Y}_n^2\\ {}\frac{{\left(\sum {Y}_n\right)}^2}{N}\end{array}\right]\right) = \log \left(\left[\begin{array}{c}\sum {X}_n{Y}_n-\frac{\sum {X}_n\sum {Y}_n}{N}\\ {}\sum {X}_n^2-\frac{{\left(\sum {X}_n\right)}^2}{N}\;\\ {}\sum {Y}_n^2-\frac{{\left(\sum {Y}_n\right)}^2}{N}\end{array}\right]\right) = \log \left(\left[\begin{array}{c}{C}_{XY}\left(N-1\right)\\ {}{S}_X^2\left(N-1\right)\\ {}{S}_Y^2\left(N-1\right)\end{array}\right]\right),\end{align}$$
and
 $$\begin{align}{\mathbf{g}}_{K_{XY}} = {\mathbf{g}}_4 = \exp \left({\mathbf{A}}_4.{\mathbf{g}}_3\right) = \exp \left(\left[\begin{array}{ccc}1& -\frac{1}{2}& -\frac{1}{2}\end{array}\right].\log \left(\left[\begin{array}{c}{C}_{XY}\left(N-1\right)\\ {}{S}_X^2\left(N-1\right)\\ {}{S}_Y^2\left(N-1\right)\end{array}\right]\right)\right) = \frac{C_{XY}\left(N-1\right)}{\sqrt{S_X^2\left(N-1\right)}\sqrt{S_Y^2\left(N-1\right)}} = {K}_{XY}.\end{align}$$
The Jacobian ${\mathbf{G}}_{K_{XY}}$
can be derived from
${\mathbf{G}}_{K_{XY}}$
can be derived from ${\mathbf{g}}_1,{\mathbf{g}}_2,{\mathbf{g}}_3$
, and
${\mathbf{g}}_1,{\mathbf{g}}_2,{\mathbf{g}}_3$
, and ${\mathbf{g}}_4$
. Let
${\mathbf{g}}_4$
. Let ${\mathbf{G}}_0 = \mathbf{I}$
. Following Equations 4 and 5,
${\mathbf{G}}_0 = \mathbf{I}$
. Following Equations 4 and 5,
 $$\begin{align}{\mathbf{G}}_1 = {\mathbf{D}}^{-1}\left({\mathbf{A}}_1.{\mathbf{g}}_0\right).{\mathbf{A}}_1.{\mathbf{G}}_0 = {\mathbf{D}}^{-1}\left(\left[\begin{array}{c}\sum {X}_n\\ {}\sum {Y}_n\\ {}\sum {X}_n^2\\ {}\sum {X}_n^2\\ {}\sum {X}_n{Y}_n\\ {}N\end{array}\right]\right).\left[\begin{array}{c}{\mathbf{r}}_X^{\mathrm{T}}\\ {}{\mathbf{r}}_Y^{\mathrm{T}}\\ {}{\mathbf{r}}_X^{2\mathrm{T}}\\ {}{\mathbf{r}}_Y^{2\mathrm{T}}\\ {}{\mathbf{r}}_X^{\mathrm{T}}\ast {\mathbf{r}}_Y^{\mathrm{T}}\\ {}{\mathbf{1}}_K^{\mathrm{T}}\end{array}\right].\mathbf{I} = \left[\begin{array}{c}\frac{{\mathbf{r}}_X^{\mathrm{T}}}{\sum {X}_n}\\ {}\frac{{\mathbf{r}}_Y^{\mathrm{T}}}{\sum {Y}_n}\\ {}\frac{{\mathbf{r}}_X^{2\mathrm{T}}}{\sum {X}_n^2}\\ {}\frac{{\mathbf{r}}_Y^{2\mathrm{T}}}{\sum {Y}_n^2}\\ {}\frac{{\mathbf{r}}_X^{\mathrm{T}}\ast {\mathbf{r}}_Y^{\mathrm{T}}}{\sum {X}_n{Y}_n}\\ {}\frac{{\mathbf{1}}_K^{\mathrm{T}}}{N}\end{array}\right],\end{align}$$
 $$\begin{align}{\mathbf{G}}_2 = \mathbf{D}\left(\exp \left({\mathbf{A}}_2.{\mathbf{g}}_1\right)\right).{\mathbf{A}}_2.{\mathbf{G}}_1 = \mathbf{D}\left(\left[\begin{array}{c}\sum {X}_n{Y}_n\\ {}\frac{\sum {X}_n\sum {Y}_n}{N}\\ {}\sum {X}_n^2\\ {}\frac{{\left(\sum {X}_n\right)}^2}{N}\;\\ {}\sum {Y}_n^2\\ {}\frac{{\left(\sum {Y}_n\right)}^2}{N}\end{array}\right]\right).\left[\begin{array}{cccccc}0& 0& 0& 0& 1& 0\\ {}1& 1& 0& 0& 0& -1\\ {}0& 0& 1& 0& 0& 0\\ {}2& 0& 0& 0& 0& -1\\ {}0& 0& 0& 1& 0& 0\\ {}0& 2& 0& 0& 0& -1\end{array}\right].\left[\begin{array}{c}\frac{{\mathbf{r}}_X^{\mathrm{T}}}{\sum {X}_n}\\ {}\frac{{\mathbf{r}}_Y^{\mathrm{T}}}{\sum {Y}_n}\\ {}\frac{{\mathbf{r}}_X^{2\mathrm{T}}}{\sum {X}_n^2}\\ {}\frac{{\mathbf{r}}_Y^{2\mathrm{T}}}{\sum {Y}_n^2}\\ {}\frac{{\mathbf{r}}_X^{\mathrm{T}}\ast {\mathbf{r}}_Y^{\mathrm{T}}}{\sum {X}_n{Y}_n}\\ {}\frac{{\mathbf{1}}_K^{\mathrm{T}}}{N}\end{array}\right] = \left[\begin{array}{c}{\mathbf{r}}_X^{\mathrm{T}}\ast {\mathbf{r}}_Y^{\mathrm{T}}\\ {}{\mathbf{r}}_X^{\mathrm{T}}\overline{Y}+{\mathbf{r}}_Y^{\mathrm{T}}\overline{X}-{\mathbf{1}}_K^{\mathrm{T}}\overline{X}\overline{Y}\\ {}{\mathbf{r}}_X^{2\mathrm{T}}\;\\ {}{\mathbf{r}}_X^{\mathrm{T}}2\overline{X}-{\mathbf{1}}_K^{\mathrm{T}}{\overline{X}}^2\\ {}{\mathbf{r}}_Y^{2\mathrm{T}}\\ {}{\mathbf{r}}_Y^{\mathrm{T}}2\overline{Y}-{\mathbf{1}}_K^{\mathrm{T}}{\overline{Y}}^2\end{array}\right],\end{align}$$
 $$\begin{align}{\mathbf{G}}_3 &= {\mathbf{D}}^{-1}\left({\mathbf{A}}_3.{\mathbf{g}}_2\right).{\mathbf{A}}_3.{\mathbf{G}}_2 = {\mathbf{D}}^{-1}\left(\left[\begin{array}{c}{C}_{XY}\left(N-1\right)\\ {}{S}_X^2\left(N-1\right)\\ {}{S}_Y^2\left(N-1\right)\end{array}\right]\right).\left[\begin{array}{cccccc}1& -1& 0& 0& 0& 0\\ {}0& 0& 1& -1& 0& 0\\ {}0& 0& 0& 0& 1& -1\end{array}\right].\left[\begin{array}{c}{\mathbf{r}}_X^{\mathrm{T}}\ast {\mathbf{r}}_Y^{\mathrm{T}}\\ {}{\mathbf{r}}_X^{\mathrm{T}}\overline{Y}+{\mathbf{r}}_Y^{\mathrm{T}}\overline{X}-{\boldsymbol{1}}_K^{\mathrm{T}}\overline{X}\overline{Y}\\ {}{\mathbf{r}}_X^{2\mathrm{T}}\;\\ {}{\mathbf{r}}_X^{\mathrm{T}}2\overline{X}-{\boldsymbol{1}}_K^{\mathrm{T}}{\overline{X}}^2\\ {}{\mathbf{r}}_Y^{2T}\\ {}{\mathbf{r}}_Y^{\mathrm{T}}2\overline{Y}-{\boldsymbol{1}}_K^{\mathrm{T}}{\overline{Y}}^2\end{array}\right]\nonumber\\ &=\left[\begin{array}{c}\frac{\;{\mathbf{r}}_X^{\mathrm{T}}\ast {\mathbf{r}}_Y^{\mathrm{T}}-{\mathbf{r}}_X^{\mathrm{T}}\overline{Y}-{\mathbf{r}}_Y^{\mathrm{T}}\overline{X}+{\mathbf{1}}_K^{\mathrm{T}}\overline{X}\overline{Y}}{C_{XY}\left(N-1\right)}\\ {}\frac{{\mathbf{r}}_X^{2\mathrm{T}}-{\mathbf{r}}_X^{\mathrm{T}}2\overline{X}+{\mathbf{1}}_K^{\mathrm{T}}{\overline{X}}^2}{S_X^2\left(N-1\right)}\\ {}\frac{{\mathbf{r}}_Y^{2\mathrm{T}}-{\mathbf{r}}_Y^{\mathrm{T}}2\overline{Y}+{\mathbf{1}}_K^{\mathrm{T}}{Y}^2}{S_Y^2\left(N-1\right)}\end{array}\right] = \left[\begin{array}{c}\frac{\left(\;{\mathbf{r}}_X^{\mathrm{T}}-\overline{X}\right)\left(\;{\mathbf{r}}_Y^{\mathrm{T}}-\overline{Y}\right)}{C_{XY}\left(N-1\right)}\\ {}\frac{{\left(\;{\mathbf{r}}_X^{\mathrm{T}}-\overline{X}\right)}^2}{S_X^2\left(N-1\right)}\\ {}\frac{{\left(\;{\mathbf{r}}_Y^{\mathrm{T}}-\overline{Y}\right)}^2}{S_Y^2\left(N-1\right)}\end{array}\right],\end{align}$$
and, the Jacobian equals
 $$\begin{align} {\mathbf{G}}_{K_{XY}} &= {\mathbf{G}}_4 = \mathbf{D}\left(\exp \left({\mathbf{A}}_4.{\mathbf{g}}_3\right)\right).{\mathbf{A}}_4.{\mathbf{G}}_3 = {R}_{XY}.\left[\begin{array}{ccc}1& -\frac{1}{2}& -\frac{1}{2}\end{array}\right].\left[\begin{array}{c}\frac{\left(\;{\mathbf{r}}_X^{\mathrm{T}}-\overline{X}\right)\left(\;{\mathbf{r}}_Y^{\mathrm{T}}-\overline{Y}\right)}{C_{XY}\left(N-1\right)}\\ {}\frac{{\left(\;{\mathbf{r}}_X^{\mathrm{T}}-\overline{X}\right)}^2}{S_X^2\left(N-1\right)}\\ {}\frac{{\left(\;{\mathbf{r}}_Y^{\mathrm{T}}-\overline{Y}\right)}^2}{S_Y^2\left(N-1\right)}\end{array}\right]\nonumber\\ &= {R}_{XY}\left[\frac{\left(\;{\mathbf{r}}_X^{\mathrm{T}}-\overline{X}\right)\left(\;{\mathbf{r}}_Y^{\mathrm{T}}-\overline{Y}\right)}{C_{XY}\left(N-1\right)}-\frac{{\left(\;{\mathbf{r}}_X^{\mathrm{T}}-\overline{X}\right)}^2}{2{S}_X^2\;\left(N-1\right)}-\frac{{\left(\;{\mathbf{r}}_Y^{\mathrm{T}}-\overline{Y}\right)}^2}{2{S}_Y^2\;\left(N-1\right)}\;\right].\end{align}$$
Because ${K}_{XY}$
is homogeneous of order 0,
${K}_{XY}$
is homogeneous of order 0, ${\widehat{V}}_{K_{XY}}$
is given by Equation 12; that is,
${\widehat{V}}_{K_{XY}}$
is given by Equation 12; that is,
 $$\begin{align}{\widehat{V}}_{K_{XY}}&\approx {\mathbf{G}}_{K_{XY}}.\mathbf{D}\left(\mathbf{n}\right).{\mathbf{G}}_{K_{XY}}^{\mathrm{T}} = {K}_{XY}^2\times {\sum}_k{n}_k{\left(\frac{\left(\;{\mathbf{r}}_{Xk}^{\mathrm{T}}-\overline{X}\right)\left(\;{\mathbf{r}}_{Yk}^{\mathrm{T}}-\overline{Y}\right)}{C_{XY}\left(N-1\right)}-\frac{{\left(\;{\mathbf{r}}_{Xk}^{\mathrm{T}}-\overline{X}\right)}^2}{2{S}_X^2\;\left(N-1\right)}-\frac{{\left(\;{\mathbf{r}}_{Yk}^{\mathrm{T}}-\overline{Y}\right)}^2}{2{S}_Y^2\;\left(N-1\right)}\right)}^2.\nonumber\\ &= \frac{K_{XY}^2}{{\left(N-1\right)}^2}\times {\sum}_k{n}_k{\left(\frac{\left(\;{\mathbf{r}}_{Xk}^{\mathrm{T}}-\overline{X}\right)\left(\;{\mathbf{r}}_{Yk}^{\mathrm{T}}-\overline{Y}\right)}{C_{XY}}-\frac{{\left(\;{\mathbf{r}}_{Xk}^{\mathrm{T}}-\overline{X}\right)}^2}{2{S}_X^2} - \frac{{\left(\;{\mathbf{r}}_{Yk}^{\mathrm{T}}-\overline{Y}\right)}^2}{2{S}_Y^2\;}\right)}^2.\end{align}$$
Writing Equation D10 at the respondent level (see Appendix B) means that the ${n}_k = 1$
and yields
${n}_k = 1$
and yields
 $$\begin{align}{\widehat{V}}_{K_{XY}}\approx \frac{K_{XY}^2}{{\left(N-1\right)}^2}\times {\sum}_n{\left(\frac{\left({X}_n-\overline{X}\right)\left({Y}_n-\overline{Y}\right)}{C_{XY}}-\frac{{\left({X}_n-\overline{X}\right)}^2}{2{S}_X^2} - \frac{{\left({Y}_n-\overline{Y}\right)}^2}{2{S}_Y^2\;}\right)}^2.\end{align}$$
The estimated SE is the square root of Equation D11; that is,
 $$\begin{align}{\widehat{SE}}_{K_{XY}} = \frac{K_{XY}}{N-1}\sqrt{\sum_n{\left(\frac{\left({X}_n-\overline{X}\right)\left({Y}_n-\overline{Y}\right)}{C_{XY}}-\frac{{\left({X}_n-\overline{X}\right)}^2}{2{S}_X^2} - \frac{{\left({Y}_n-\overline{Y}\right)}^2}{2{S}_Y^2\;}\right)}^2.}\end{align}$$
Appendix E: Split-half reliability coefficient
Let the test items be split into two sets ${H}_1$
and
${H}_1$
and ${H}_2$
, and let
${H}_2$
, and let ${K}_{H_1{H}_2}$
be the correlation between the sum scores on
${K}_{H_1{H}_2}$
be the correlation between the sum scores on ${H}_1$
and
${H}_1$
and ${H}_2$
. The sample value of the split-half reliability coefficient is
${H}_2$
. The sample value of the split-half reliability coefficient is ${\widehat{\rho}}_{SH} = $
2
${\widehat{\rho}}_{SH} = $
2 ${K}_{H_1{H}_2}/\left(1+{K}_{H_1{H}_2}\right)$
. The estimated variance of a correlation coefficient was derived in Appendix D (Equation D11); that is,
${K}_{H_1{H}_2}/\left(1+{K}_{H_1{H}_2}\right)$
. The estimated variance of a correlation coefficient was derived in Appendix D (Equation D11); that is,
 $$\begin{align}{\widehat{V}}_{K_{H_1{H}_2}}\approx \frac{K_{K_{H_1{H}_2}}^2}{{\left(N-1\right)}^2}\times {\sum}_n{\left(\frac{\left({H}_{1n}-{\overline{H}}_1\right)\left({H}_{2n}-{\overline{H}}_2\right)}{C_{H_1{H}_2}}-\frac{{\left({H}_{1n}-{\overline{H}}_1\right)}^2}{2{S}_{H_1}^2} - \frac{{\left({H}_{2n}-{\overline{H}}_2\right)}^2}{2{S}_{H_2}^2\;}\right)}^2.\end{align}$$
Using ${K}_{H_1{H}_2}$
as a basis, the split-half reliability coefficient can be written in generalized exp-log notation: let
${K}_{H_1{H}_2}$
as a basis, the split-half reliability coefficient can be written in generalized exp-log notation: let ${\mathbf{A}}_1 = {\left[\begin{array}{ccc}2& 1& 1\end{array}\right]}^T$
be a
${\mathbf{A}}_1 = {\left[\begin{array}{ccc}2& 1& 1\end{array}\right]}^T$
be a $3\times 1$
vector, let
$3\times 1$
vector, let ${\mathbf{A}}_2 = \left[\begin{array}{ccc}1& 0& 0\\ {}0& 1& 0\\ {}0& 1& -1\end{array}\right]$
be a
${\mathbf{A}}_2 = \left[\begin{array}{ccc}1& 0& 0\\ {}0& 1& 0\\ {}0& 1& -1\end{array}\right]$
be a $3\times 3$
matrix, let
$3\times 3$
matrix, let ${\mathbf{A}}_3 = \left[\begin{array}{ccc}1& 0& 0\\ {}0& 1& 1\end{array}\right]$
be a
${\mathbf{A}}_3 = \left[\begin{array}{ccc}1& 0& 0\\ {}0& 1& 1\end{array}\right]$
be a $2\times 3$
matrix, and let
$2\times 3$
matrix, and let ${\mathbf{A}}_4 = \left[\begin{array}{cc}1& -1\end{array}\right]$
be a 1
${\mathbf{A}}_4 = \left[\begin{array}{cc}1& -1\end{array}\right]$
be a 1 $\times 2$
row vector. With
$\times 2$
row vector. With ${\mathbf{g}}_0 = {K}_{H_1{H}_2}$
, and following Equations 2 and 3,
${\mathbf{g}}_0 = {K}_{H_1{H}_2}$
, and following Equations 2 and 3,
 $$\begin{align}{\mathbf{g}}_1 = \log \left({\mathbf{A}}_1.{\mathbf{g}}_0\right) = \log \left(\left[\begin{array}{c}2\\ {}1\\ {}1\end{array}\right].{K}_{H_1{H}_2}\;\right) = \log \left(\left[\begin{array}{c}2{K}_{H_1{H}_2}\\ {}{K}_{H_1{H}_2}\\ {}{K}_{H_1{H}_2}\end{array}\right]\right),\end{align}$$
 $$\begin{align}{\mathbf{g}}_2 = \exp \left({\mathbf{A}}_2.{\mathbf{g}}_1\right) = \exp \left(\left[\begin{array}{ccc}1& 0& 0\\ {}0& 1& 0\\ {}0& 1& -1\end{array}\right].\left[\begin{array}{c}2{K}_{H_1{H}_2}\\ {}{K}_{H_1{H}_2}\\ {}{K}_{H_1{H}_2}\end{array}\right]\right) = \left[\begin{array}{c}2{K}_{H_1{H}_2}\\ {}{K}_{H_1{H}_2}\\ {}1\end{array}\right].\end{align}$$
 $$\begin{align}{\mathbf{g}}_3 = \log \left({\mathbf{A}}_3.{\mathbf{g}}_2\right) = \log \left(\left[\begin{array}{ccc}1& 0& 0\\ {}0& 1& 1\end{array}\right].\left[\begin{array}{c}2{K}_{H_1{H}_2}\\ {}{K}_{H_1{H}_2}\\ {}1\end{array}\right]\;\right) = \log \left(\left[\begin{array}{c}2{K}_{H_1{H}_2}\\ {}1+{K}_{H_1{H}_2}\end{array}\right]\right),\end{align}$$
and
 $$\begin{align}{\mathbf{g}}_{{\widehat{\rho}}_{SH}} = {\mathbf{g}}_4 = \exp \left({\mathbf{A}}_4.{\mathbf{g}}_3\right) = \exp \left(\left[\begin{array}{cc}1& -1\end{array}\right].\log \left(\left[\begin{array}{c}2{K}_{H_1{H}_2}\\ {}1+{K}_{H_1{H}_2}\end{array}\right]\right)\right) = \frac{2{K}_{H_1{H}_2}}{\left(1+{K}_{H_1{H}_2}\right)} = {\widehat{\rho}}_{SH}\end{align} $$
The Jacobian ${\mathbf{G}}_{{\widehat{\rho}}_{SH}}$
can be derived from
${\mathbf{G}}_{{\widehat{\rho}}_{SH}}$
can be derived from ${\mathbf{g}}_1,{\mathbf{g}}_2,{\mathbf{g}}_3,$
and
${\mathbf{g}}_1,{\mathbf{g}}_2,{\mathbf{g}}_3,$
and ${\mathbf{g}}_4$
. With
${\mathbf{g}}_4$
. With ${\mathbf{G}}_0 = \mathbf{I}$
and following Equations 4 and 5,
${\mathbf{G}}_0 = \mathbf{I}$
and following Equations 4 and 5,
 $$\begin{align}{\mathbf{G}}_1 = {\mathbf{D}}^{-1}\left({\mathbf{A}}_1.{\mathbf{g}}_0\right).{\mathbf{A}}_1.{\mathbf{G}}_0 = {\mathbf{D}}^{-1}\left(\left[\begin{array}{c}2{K}_{H_1{H}_2}\\ {}{K}_{H_1{H}_2}\\ {}{K}_{H_1{H}_2}\end{array}\right]\right).\left[\begin{array}{c}2\\ {}1\\ {}1\end{array}\right].\mathbf{I} = \left[\begin{array}{c}1/{K}_{H_1{H}_2}\\ {}1/{K}_{H_1{H}_2}\\ {}1/{K}_{H_1{H}_2}\end{array}\right]\end{align}$$
 $$\begin{align}{\mathbf{G}}_2 = \mathbf{D}\left(\exp \left({\mathbf{A}}_2.{\mathbf{g}}_1\right)\right).{\mathbf{A}}_2.{\mathbf{G}}_1 = \mathbf{D}\left(\left[\begin{array}{c}2{K}_{H_1{H}_2}\\ {}{K}_{H_1{H}_2}\\ {}1\end{array}\right]\right).\left[\begin{array}{ccc}1& 0& 0\\ {}0& 1& 0\\ {}0& 1& -1\end{array}\right].\left[\begin{array}{c}1/{K}_{H_1{H}_2}\\ {}1/{K}_{H_1{H}_2}\\ {}1/{K}_{H_1{H}_2}\end{array}\right] = \left[\begin{array}{c}2\\ {}1\\ {}0\end{array}\right],\end{align}$$
 $$\begin{align}{\mathbf{G}}_3 = {\mathbf{D}}^{-1}\left({\mathbf{A}}_3.{\mathbf{g}}_2\right).{\mathbf{A}}_3.{\mathbf{G}}_2 = {\mathbf{D}}^{-1}\left(\left[\begin{array}{c}2{K}_{H_1{H}_2}\\ {}1+{K}_{H_1{H}_2}\end{array}\right]\right).\left[\begin{array}{ccc}1& 0& 0\\ {}0& 1& 1\end{array}\right].\left[\begin{array}{c}2\\ {}1\\ {}0\end{array}\right] = \left[\begin{array}{c}1/{K}_{H_1{H}_2}\\ {}1/\left(1+{K}_{H_1{H}_2}\right)\end{array}\right], \end{align}$$
and
 $$\begin{align}{G}_4 &= {G}_{{\widehat{\rho}}_{SH}} = \mathbf{D}\left(\exp \left({\mathbf{A}}_4.{\mathbf{g}}_3\right)\right).{\mathbf{A}}_4.{\mathbf{G}}_3 = {\widehat{\rho}}_{SH}.\left[\begin{array}{cc}1& -1\end{array}\right].\left[\begin{array}{c}\frac{1}{K_{H_1{H}_2}}\\ {}\frac{1}{1+{K}_{H_1{H}_2}}\end{array}\right] = \frac{{\widehat{\rho}}_{SH}}{K_{H_1{H}_2}}-\frac{{\widehat{\rho}}_{SH}}{1+{K}_{H_1{H}_2}},\end{align}$$
Following Equation 9, the estimated variance of ${\widehat{\rho}}_{SH}$
equals
${\widehat{\rho}}_{SH}$
equals
 $$\begin{align}{\widehat{V}}_{{\widehat{\rho}}_{SH}} = {G}_{{\widehat{\rho}}_{SH}}^2{V}_{K_{H_1{H}_2}} = {\left(\frac{{\widehat{\rho}}_{SH}}{K_{H_1{H}_2}}-\frac{{\widehat{\rho}}_{SH}}{1+{K}_{H_1{H}_2}}\right)}^2{V}_{K_{H_1{H}_2}}\end{align}$$
Then, ${\widehat{SE}}_{{\widehat{\rho}}_{SH}}$
equals the square root of Equation E8; that is,
${\widehat{SE}}_{{\widehat{\rho}}_{SH}}$
equals the square root of Equation E8; that is,
 $$\begin{align}{\widehat{SE}}_{{\widehat{\rho}}_{SH}} = \left(\frac{{\widehat{\rho}}_{SH}}{K_{H_1{H}_2}}-\frac{{\widehat{\rho}}_{SH}}{1+{K}_{H_1{H}_2}}\right){\widehat{SE}}_{K_{H_1{H}_2}.}\end{align}$$
Appendix F: The estimated variance–covariance matrix of the sample variance–covariance matrix $P$
variables—denoted by
$P$
variables—denoted by ${X}_1,\dots, {X}_P$
, where
${X}_1,\dots, {X}_P$
, where ${X}_i$
has
${X}_i$
has ${K}_i$
observed scores—result in
${K}_i$
observed scores—result in $K = {\prod}_i{K}_i$
response patterns. Let
$K = {\prod}_i{K}_i$
response patterns. Let $B = {\sum}_i{\sum}_j{K}_i{K}_j$
, and let
$B = {\sum}_i{\sum}_j{K}_i{K}_j$
, and let ${\mathbf{n}}_{(2)}$
be the
${\mathbf{n}}_{(2)}$
be the $B\times 1$
vector of all univariate and bivariate frequencies, where univariate frequencies are given twice. The latter allows treating variances and covariances the same, which is convenient for the derivation. For example, if
$B\times 1$
vector of all univariate and bivariate frequencies, where univariate frequencies are given twice. The latter allows treating variances and covariances the same, which is convenient for the derivation. For example, if
 $$\begin{align}\mathbf{n} = {\left[\begin{array}{cccccccc}{n}_{000}& {n}_{001}& {n}_{010}& {n}_{011}& {n}_{100}& {n}_{101}& {n}_{110}& {n}_{111}\end{array}\right]}^{\mathrm{T}},\end{align}$$
then vectors containing the univariate frequencies given twice are ${\mathbf{n}}_{1,1}^{\mathrm{T}} = \left[\begin{array}{cccc}{n}_{0++}& {n}_{0++}& {n}_{1++}& {n}_{1++}\end{array}\right]$
,
${\mathbf{n}}_{1,1}^{\mathrm{T}} = \left[\begin{array}{cccc}{n}_{0++}& {n}_{0++}& {n}_{1++}& {n}_{1++}\end{array}\right]$
, ${\mathbf{n}}_{2,2}^{\mathrm{T}} = \left[\begin{array}{cccc}{n}_{+0+}& {n}_{+0+}& {n}_{+1+}& {n}_{+1+}\end{array}\right]$
, and
${\mathbf{n}}_{2,2}^{\mathrm{T}} = \left[\begin{array}{cccc}{n}_{+0+}& {n}_{+0+}& {n}_{+1+}& {n}_{+1+}\end{array}\right]$
, and ${\mathbf{n}}_{3,3}^{\mathrm{T}} = \left[\begin{array}{cccc}{n}_{++0}& {n}_{++0}& {n}_{++1}& {n}_{++1}\end{array}\right]$
, and the vectors providing the bivariate frequencies are
${\mathbf{n}}_{3,3}^{\mathrm{T}} = \left[\begin{array}{cccc}{n}_{++0}& {n}_{++0}& {n}_{++1}& {n}_{++1}\end{array}\right]$
, and the vectors providing the bivariate frequencies are ${\mathbf{n}}_{1,2}^{\mathrm{T}} = \left[\begin{array}{cccc}{n}_{00+}& {n}_{01+}& {n}_{10+}& {n}_{11+}\end{array}\right]$
,
${\mathbf{n}}_{1,2}^{\mathrm{T}} = \left[\begin{array}{cccc}{n}_{00+}& {n}_{01+}& {n}_{10+}& {n}_{11+}\end{array}\right]$
, ${\mathbf{n}}_{1,3}^{\mathrm{T}} = \left[\begin{array}{cccc}{n}_{0+0}& {n}_{0+1}& {n}_{1+0}& {n}_{1+0}\end{array}\right]$
, etc. Then,
${\mathbf{n}}_{1,3}^{\mathrm{T}} = \left[\begin{array}{cccc}{n}_{0+0}& {n}_{0+1}& {n}_{1+0}& {n}_{1+0}\end{array}\right]$
, etc. Then,
 $$\begin{align}{\mathbf{n}}_{(2)} = {\left[\begin{array}{ccccccccc}{\mathbf{n}}_{1,1}^{\mathrm{T}}& {\mathbf{n}}_{1,2}^{\mathrm{T}}& {\mathbf{n}}_{1,3}^{\mathrm{T}}& {\mathbf{n}}_{2,1}^{\mathrm{T}}& {\mathbf{n}}_{2,2}^{\mathrm{T}}& {\mathbf{n}}_{2,3}^{\mathrm{T}}& {\mathbf{n}}_{3,1}^{\mathrm{T}}& {\mathbf{n}}_{3,2}^{\mathrm{T}}& {\mathbf{n}}_{3,3}^{\mathrm{T}}\end{array}\right]}^{\mathrm{T}}.\end{align}$$
Let ${\mathbf{M}}_{(2)}$
be the
${\mathbf{M}}_{(2)}$
be the $B\times K$
design matrix so that
$B\times K$
design matrix so that ${\mathbf{n}}_{(2)} = {\mathbf{M}}_{(2)}\mathbf{n}$
. The first
${\mathbf{n}}_{(2)} = {\mathbf{M}}_{(2)}\mathbf{n}$
. The first ${K}_1^2$
rows of
${K}_1^2$
rows of ${\mathbf{M}}_{(2)}$
correspond to
${\mathbf{M}}_{(2)}$
correspond to ${\mathbf{n}}_{1,1}$
; the next
${\mathbf{n}}_{1,1}$
; the next ${K}_1{K}_2$
rows to
${K}_1{K}_2$
rows to ${\mathbf{n}}_{1,2}$
, the next
${\mathbf{n}}_{1,2}$
, the next ${K}_1{K}_3$
rows to
${K}_1{K}_3$
rows to ${\mathbf{n}}_{1,3}$
, and so on. Element (
${\mathbf{n}}_{1,3}$
, and so on. Element ( $b$
,
$b$
, $k$
) in
$k$
) in ${\mathbf{M}}_{(2)}$
equals 1 if the
${\mathbf{M}}_{(2)}$
equals 1 if the $k$
th response pattern contributes to the
$k$
th response pattern contributes to the $b$
th univariate or bivariate frequency, and 0 otherwise. For example, for the vector of observed frequencies in Equation F1, the first and the second row of
$b$
th univariate or bivariate frequency, and 0 otherwise. For example, for the vector of observed frequencies in Equation F1, the first and the second row of ${\mathbf{M}}_2$
equal
${\mathbf{M}}_2$
equal $\left(1,1,1,1,0,0,0,0\right)$
, which pertains to observed univariate frequency
$\left(1,1,1,1,0,0,0,0\right)$
, which pertains to observed univariate frequency ${n}_{0++}.$
The asymptotic covariance matrix of the sample covariance matrix is derived using the univariate and bivariate frequencies in
${n}_{0++}.$
The asymptotic covariance matrix of the sample covariance matrix is derived using the univariate and bivariate frequencies in ${\mathbf{n}}_{(2)}$
, whereas for the coefficients in Appendices A through E, vector
${\mathbf{n}}_{(2)}$
, whereas for the coefficients in Appendices A through E, vector $\mathbf{n}$
was used. Using vector
$\mathbf{n}$
was used. Using vector ${\mathbf{n}}_{(2)}$
is useful because both the sample covariance (Equation B5) and its Jacobian (Equation B9) require only the bivariate frequencies as displayed in Equation F2.
${\mathbf{n}}_{(2)}$
is useful because both the sample covariance (Equation B5) and its Jacobian (Equation B9) require only the bivariate frequencies as displayed in Equation F2.
Let $\mathbf{C}=\left\{{C}_{ij}\right\}$
be the
$\mathbf{C}=\left\{{C}_{ij}\right\}$
be the $P\times P$
sample variance covariance matrix variables
$P\times P$
sample variance covariance matrix variables ${X}_1,{X}_2,\dots, {X}_P$
, let
${X}_1,{X}_2,\dots, {X}_P$
, let $\mathrm{vec}\left(\mathbf{C}\right)$
be a
$\mathrm{vec}\left(\mathbf{C}\right)$
be a ${P}^2\times 1$
column vector obtained by stacking the column vectors of
${P}^2\times 1$
column vector obtained by stacking the column vectors of $\mathbf{C}$
on top of one another, let
$\mathbf{C}$
on top of one another, let $\bigoplus$
denote the direct sum, and let
$\bigoplus$
denote the direct sum, and let $\bigotimes$
denote the Kronecker product; then,
$\bigotimes$
denote the Kronecker product; then, ${\mathbf{g}}_{C_{XY}}$
(Equation B5) can be generalized to a vector function for the vectorized sample variance–covariance matrix by
${\mathbf{g}}_{C_{XY}}$
(Equation B5) can be generalized to a vector function for the vectorized sample variance–covariance matrix by
 $$\begin{align}{\mathbf{g}}_{\mathrm{vec}\left(\mathbf{C}\right)} = \exp \left({\mathbf{A}}_4^{\ast}.\log \left({\mathbf{A}}_3^{\ast}.\exp \left({\mathbf{A}}_2^{\ast}.\log \left({\mathbf{A}}_1^{\ast}.{\mathbf{M}}_2.\mathbf{n}\right)\right)\right)\right),\end{align}$$
where ${\mathbf{A}}_1^{\ast} = {\bigoplus}_i{\bigoplus}_j{\left[\begin{array}{ccccc}{\mathbf{r}}_i& {\mathbf{r}}_j& {\mathbf{r}}_i\ast {\mathbf{r}}_j& {\mathbf{1}}_K& {\mathbf{1}}_K\end{array}\right]}^T$
is a
${\mathbf{A}}_1^{\ast} = {\bigoplus}_i{\bigoplus}_j{\left[\begin{array}{ccccc}{\mathbf{r}}_i& {\mathbf{r}}_j& {\mathbf{r}}_i\ast {\mathbf{r}}_j& {\mathbf{1}}_K& {\mathbf{1}}_K\end{array}\right]}^T$
is a $5{P}^2\times B$
matrix,
$5{P}^2\times B$
matrix, ${\mathbf{A}}_2^{\ast} = {\mathbf{I}}_{P^2}\bigotimes \left[\begin{array}{ccccc}1& 1& 0& -1& 0\\ {}0& 0& 1& 0& 0\\ {}0& 0& 0& 1& 0\\ {}0& 0& 0& 1& -1\end{array}\right]$
is a
${\mathbf{A}}_2^{\ast} = {\mathbf{I}}_{P^2}\bigotimes \left[\begin{array}{ccccc}1& 1& 0& -1& 0\\ {}0& 0& 1& 0& 0\\ {}0& 0& 0& 1& 0\\ {}0& 0& 0& 1& -1\end{array}\right]$
is a $4{P}^2\times 5{P}^2$
matrix,
$4{P}^2\times 5{P}^2$
matrix, ${\mathbf{A}}_3^{\ast} = {\mathbf{I}}_{P^2}\bigotimes \left[\begin{array}{cccc}-1& 1& 0& 0\\ {}0& 0& 1& -1\end{array}\right]$
is a
${\mathbf{A}}_3^{\ast} = {\mathbf{I}}_{P^2}\bigotimes \left[\begin{array}{cccc}-1& 1& 0& 0\\ {}0& 0& 1& -1\end{array}\right]$
is a $2{P}^2\times 4{P}^2$
matrix, and
$2{P}^2\times 4{P}^2$
matrix, and ${\mathbf{A}}_4^{\ast} = {\mathbf{I}}_{P^2}\bigotimes \left[\begin{array}{cc}1& -1\end{array}\right]$
is a
${\mathbf{A}}_4^{\ast} = {\mathbf{I}}_{P^2}\bigotimes \left[\begin{array}{cc}1& -1\end{array}\right]$
is a ${P}^2\times 2{P}^2$
matrix. Note that
${P}^2\times 2{P}^2$
matrix. Note that ${\mathbf{A}}_1^{\ast}$
,
${\mathbf{A}}_1^{\ast}$
, ${\mathbf{A}}_2^{\ast},{\mathbf{A}}_3^{\ast},\mathrm{and}\;{\mathbf{A}}_4^{\ast}$
are block-diagonal matrices that are generalizations of
${\mathbf{A}}_2^{\ast},{\mathbf{A}}_3^{\ast},\mathrm{and}\;{\mathbf{A}}_4^{\ast}$
are block-diagonal matrices that are generalizations of ${\mathbf{A}}_1$
,
${\mathbf{A}}_1$
, ${\mathbf{A}}_2,{\mathbf{A}}_3,\mathrm{and}\;{\mathbf{A}}_4$
in Appendix B. Straightforward generalizations of Equations B2, B3, B4, and B5 yield
${\mathbf{A}}_2,{\mathbf{A}}_3,\mathrm{and}\;{\mathbf{A}}_4$
in Appendix B. Straightforward generalizations of Equations B2, B3, B4, and B5 yield ${\mathbf{g}}_{\mathrm{vec}\left(\mathbf{C}\right)} = \mathrm{vec}\left(\mathbf{C}\right).$
The Jacobian ${\mathbf{G}}_{\mathrm{vec}\left(\mathbf{C}\right)}$
can be derived as follows. Let
${\mathbf{G}}_{\mathrm{vec}\left(\mathbf{C}\right)}$
can be derived as follows. Let ${\mathbf{g}}_0 = \mathbf{n}$
,
${\mathbf{g}}_0 = \mathbf{n}$
, ${\mathbf{g}}_1 = \log \left({\mathbf{A}}_1^{\ast}.{\mathbf{M}}_2.{\mathbf{g}}_0\right)$
,
${\mathbf{g}}_1 = \log \left({\mathbf{A}}_1^{\ast}.{\mathbf{M}}_2.{\mathbf{g}}_0\right)$
, ${\mathbf{g}}_2 = \exp \left({\mathbf{A}}_2^{\ast}.{\mathbf{g}}_1\right)$
,
${\mathbf{g}}_2 = \exp \left({\mathbf{A}}_2^{\ast}.{\mathbf{g}}_1\right)$
, ${\mathbf{g}}_3 = \log \left({\mathbf{A}}_3^{\ast}.{\mathbf{g}}_2\right),$ ${\mathbf{g}}_4 = \exp \left({\mathbf{A}}_4^{\ast}.{\mathbf{g}}_3\right)$
, and
${\mathbf{g}}_4 = \exp \left({\mathbf{A}}_4^{\ast}.{\mathbf{g}}_3\right)$
, and ${\mathbf{G}}_0 = \mathbf{I}$
. Following Equations 4 and 5,
${\mathbf{G}}_0 = \mathbf{I}$
. Following Equations 4 and 5,
 $$\begin{align}{\mathbf{G}}_1 = {\mathbf{D}}^{-1}\left({\mathbf{A}}_1^{\ast}.\mathbf{M}.{\mathbf{g}}_0\right).{\mathbf{A}}_1^{\ast}.\mathbf{M},\end{align}$$
 $$\begin{align}{\mathbf{G}}_2 = \mathbf{D}\left(\exp \left({\mathbf{A}}_2^{\ast}.{\mathbf{g}}_1\right)\right).{\mathbf{A}}_2^{\ast}.{\mathbf{G}}_1\end{align}$$
 $$\begin{align}{\mathbf{G}}_3 = {\mathbf{D}}^{-1}\left({\mathbf{A}}_3^{\ast }.{\mathbf{g}}_2\right).{\mathbf{A}}_3^{\ast}.{\mathbf{G}}_2\end{align}$$
and
 $$\begin{align}{\mathbf{G}}_{\mathrm{vec}\left(\mathbf{C}\right)} = {\mathbf{G}}_4 = \mathbf{D}\left(\exp \left({\mathbf{A}}_4^{\ast}.{\mathbf{g}}_3\right)\right).{\mathbf{A}}_4^{\ast}.{\mathbf{G}}_3.\end{align}$$
Finally, because the elements are not homogeneous of order 0, the estimated asymptotic variance covariance matrix of the vectorized sample variance–covariance matrix is given by Equation 11; that is,
 $$\begin{align}{\widehat{\mathbf{V}}}_{\mathrm{vec}\left(\mathbf{C}\right)} = {\mathbf{G}}_{\mathrm{vec}\left(\mathbf{C}\right)}.\mathbf{D}\left(\mathbf{n}\right).{\mathbf{G}}_{\mathrm{vec}\left(\mathbf{C}\right)}^{\mathrm{T}}-{\mathbf{G}}_{\mathrm{vec}\left(\mathbf{C}\right)}.\mathbf{n}.{N}^{-1}.{\mathbf{n}}^{\mathrm{T}}.{\mathbf{G}}_{\mathrm{vec}\left(\mathbf{C}\right)}^{\mathrm{T}}.\end{align}$$
The diagonal elements of ${\widehat{\mathbf{V}}}_{\mathrm{vec}\left(\mathbf{C}\right)}$
are the estimated asymptotic variances of the sample variances and sample covariances that were derived in Appendix B. The off-diagonal elements are the estimated asymptotic covariances of the sample variances and covariances. Due to the irregular nature in matrix
${\widehat{\mathbf{V}}}_{\mathrm{vec}\left(\mathbf{C}\right)}$
are the estimated asymptotic variances of the sample variances and sample covariances that were derived in Appendix B. The off-diagonal elements are the estimated asymptotic covariances of the sample variances and covariances. Due to the irregular nature in matrix ${\mathbf{M}}_2$
, Equation F8 could not be simplified. The elements of
${\mathbf{M}}_2$
, Equation F8 could not be simplified. The elements of ${\widehat{\mathbf{V}}}_{\mathrm{vec}\left(\mathbf{C}\right)}$
are referred to as
${\widehat{\mathbf{V}}}_{\mathrm{vec}\left(\mathbf{C}\right)}$
are referred to as ${\widehat{v}}_{\left(i,j\right)\left(k,l\right)}$
, where
${\widehat{v}}_{\left(i,j\right)\left(k,l\right)}$
, where $i = j = k = l$
refers to an estimated variance of a sample variance,
$i = j = k = l$
refers to an estimated variance of a sample variance, $i = k$
and
$i = k$
and $j = l$
refer to an estimated variance of a sample covariance,
$j = l$
refer to an estimated variance of a sample covariance, $i = j$
and
$i = j$
and $k = l$
refer to an estimated covariance of sample variances,
$k = l$
refer to an estimated covariance of sample variances, $i = j$
or
$i = j$
or $k = l$
refer to an estimated covariance of a sample variance and a sample covariance, and in all other cases to an estimated covariance of sample covariances.
$k = l$
refer to an estimated covariance of a sample variance and a sample covariance, and in all other cases to an estimated covariance of sample covariances.
Appendix G: Guttman’s lambda 1
The sample value of Guttman’s lambda 1 equals ${\widehat{\lambda}}_1 = 1-\frac{\sum_j{S}_j^2}{S_{X_{+}}^2}$
, where
${\widehat{\lambda}}_1 = 1-\frac{\sum_j{S}_j^2}{S_{X_{+}}^2}$
, where ${S}_j^2$
denotes the variance of item
${S}_j^2$
denotes the variance of item $j$
and
$j$
and ${S}_{X_{+}}^2$
denotes the sum-score variance. The generalized exp-log notation of
${S}_{X_{+}}^2$
denotes the sum-score variance. The generalized exp-log notation of ${\widehat{\lambda}}_1$
uses
${\widehat{\lambda}}_1$
uses ${\widehat{\mathbf{V}}}_{\mathrm{vec}\left(\mathbf{C}\right)}$
(see Appendix F) as a starting point. Let
${\widehat{\mathbf{V}}}_{\mathrm{vec}\left(\mathbf{C}\right)}$
(see Appendix F) as a starting point. Let $J$
be the number of items; then,
$J$
be the number of items; then, ${\mathbf{A}}_1 = {\left[\begin{array}{ccc}{\mathbf{e}}_{S_j^2}& {\boldsymbol{1}}_{J^2}& {\boldsymbol{1}}_{J^2}\end{array}\right]}^T$
be a
${\mathbf{A}}_1 = {\left[\begin{array}{ccc}{\mathbf{e}}_{S_j^2}& {\boldsymbol{1}}_{J^2}& {\boldsymbol{1}}_{J^2}\end{array}\right]}^T$
be a $3\times {J}^2$
matrix, where the elements of
$3\times {J}^2$
matrix, where the elements of ${\mathbf{e}}_{S_j^2}$
equal 1 if they correspond to a variance (using the order of variances and covariances in
${\mathbf{e}}_{S_j^2}$
equal 1 if they correspond to a variance (using the order of variances and covariances in ${\widehat{\mathbf{V}}}_{\mathrm{vec}\left(\mathbf{C}\right)}$
) and equal 0 otherwise. Furthermore, let
${\widehat{\mathbf{V}}}_{\mathrm{vec}\left(\mathbf{C}\right)}$
) and equal 0 otherwise. Furthermore, let ${\mathbf{A}}_2 = \left[\begin{array}{ccc}1& -1& 0\\ {}0& 1& -1\end{array}\right]$
be a
${\mathbf{A}}_2 = \left[\begin{array}{ccc}1& -1& 0\\ {}0& 1& -1\end{array}\right]$
be a $2\times 3$
matrix and let
$2\times 3$
matrix and let ${\mathbf{A}}_3 = \left[\begin{array}{cc}-1& 1\end{array}\right]$
be a
${\mathbf{A}}_3 = \left[\begin{array}{cc}-1& 1\end{array}\right]$
be a $1\times 2$
row vector. With
$1\times 2$
row vector. With ${\mathbf{g}}_0 = \mathrm{vec}\left(\mathbf{C}\right)$
and following Equations 2 and 3, it follows that
${\mathbf{g}}_0 = \mathrm{vec}\left(\mathbf{C}\right)$
and following Equations 2 and 3, it follows that
 $$\begin{align}{\mathbf{g}}_1 = \log \left({\mathbf{A}}_1.{\mathbf{g}}_0\right) = \log \left(\left[\begin{array}{c}{\mathbf{e}}_{S_j^2}^T\\ {}{\mathbf{1}}_{J^2}^T\\ {}{\mathbf{1}}_{J^2}^T\end{array}\right].\mathrm{vec}\left(\mathbf{C}\right)\right) = \log {\left[\begin{array}{ccc}{\sum}_j{S}_j^2& {S}_{X_{+}}^2& {S}_{X_{+}}^2\end{array}\right]}^{\mathrm{T}},\end{align}$$
 $$\begin{align}{\mathbf{g}}_2 = \exp \left({\mathbf{A}}_2.{\mathbf{g}}_1\right) = \exp \left(\left[\begin{array}{ccc}1& -1& 0\\ {}0& 1& -1\end{array}\right].\log \left(\left[\begin{array}{c}{\sum}_j{S}_j^2\\ {}{S}_{X_{+}}^2\\ {}{S}_{X_{+}}^2\end{array}\right]\right)\right) = \left[\begin{array}{c}\frac{\sum_j{S}_j^2}{S_{X_{+}}^2}\\ {}1\end{array}\right],\end{align}$$
and
 $$\begin{align}{\mathbf{g}}_{{\widehat{\lambda}}_1} = {\mathbf{g}}_3 = {\mathbf{A}}_3.{\mathbf{g}}_2 = \left[\begin{array}{cc}-1& 1\end{array}\right].\left[\begin{array}{c}\frac{\sum_j{S}_j^2}{S_{X_{+}}^2}\\ {}1\end{array}\right] = 1-\frac{\sum_j{S}_j^2}{S_{X_{+}}^2} = {\widehat{\lambda}}_1.\end{align}$$
Jacobian ${\mathbf{G}}_{{\widehat{\lambda}}_1}$
can be derived from
${\mathbf{G}}_{{\widehat{\lambda}}_1}$
can be derived from ${\mathbf{g}}_1,{\mathbf{g}}_2,$
and
${\mathbf{g}}_1,{\mathbf{g}}_2,$
and ${\mathbf{g}}_3$
. Let
${\mathbf{g}}_3$
. Let ${\mathbf{G}}_0 = \mathbf{I}$
. Following Equations 2 and 3,
${\mathbf{G}}_0 = \mathbf{I}$
. Following Equations 2 and 3,
 $$\begin{align}{\mathbf{G}}_1 = {\mathbf{D}}^{-1}\left({\mathbf{A}}_1.{\mathbf{g}}_0\right).{\mathbf{A}}_1.{\mathbf{G}}_0 = {\mathbf{D}}^{-1}\left(\left[\begin{array}{c}{\sum}_j{S}_j^2\\ {}{S}_{X_{+}}^2\\ {}{S}_{X_{+}}^2\end{array}\right]\right).\left[\begin{array}{c}{\mathbf{e}}_{S_j^2}^{\mathrm{T}}\\ {}{\mathbf{1}}_{J^2}^{\mathrm{T}}\\ {}{\mathbf{1}}_{J^2}^{\mathrm{T}}\end{array}\right].\mathbf{I} = \left[\begin{array}{c}{\sum}_j{S}_j^2.{\mathbf{e}}_{S_j^2}^{\mathrm{T}}\\ {}{S}_{X_{+}}^2.{\mathbf{1}}_{J^2}^{\mathrm{T}}\\ {}{S}_{X_{+}}^2.{\mathbf{1}}_{J^2}^{\mathrm{T}}\end{array}\right],\end{align}$$
 $$\begin{align}{\mathbf{G}}_2 &= \mathbf{D}\left(\exp \left({\mathbf{A}}_2.{\mathbf{g}}_1\right)\right).{\mathbf{A}}_2.{\mathbf{G}}_1\nonumber\\ &= \mathbf{D}\left(\left[\begin{array}{c}\frac{\sum_j{S}_j^2}{S_{X_{+}}^2}\\ {}1\end{array}\right]\right).\left[\begin{array}{ccc}1& -1& 0\\ {}0& 1& -1\end{array}\right].\left[\begin{array}{c}{\sum}_j{S}_j^2.{\mathbf{e}}_{S_j^2}^{\mathrm{T}}\\ {}{S}_{X_{+}}^2.{\mathbf{1}}_{J^2}^{\mathrm{T}}\\ {}{S}_{X_{+}}^2.{\mathbf{1}}_{J^2}^{\mathrm{T}}\end{array}\right] = \left[\begin{array}{c}\frac{{\left({\sum}_j{S}_j^2\right)}^2}{S_{X_{+}}^2}.{\mathbf{e}}_{S_j^2}^{\mathrm{T}}\\ {}{\mathbf{0}}^{\mathrm{T}}\end{array}-{\sum}_j{S}_j^2.{\mathbf{1}}_{J^2}^{\mathrm{T}}\right],\end{align}$$
and, the Jacobian equals
 $$\begin{align}{\mathbf{G}}_{{\widehat{\lambda}}_1} = {\mathbf{A}}_3.{\mathbf{G}}_2 = \left[\begin{array}{cc}-1& 1\end{array}\right].\left[\begin{array}{c}\frac{{\left({\sum}_j{S}_j^2\right)}^2}{S_{X_{+}}^2}.{\mathbf{e}}_{S_j^2}^{\mathrm{T}}-{\sum}_j{S}_j^2.{\mathbf{1}}_{J^2}^{\mathrm{T}}\\ {}{\mathbf{0}}^T\end{array}\right] = \left[{\sum}_j{S}_j^2.{\mathbf{1}}_{J^2}^{\mathrm{T}}-\frac{{\left({\sum}_j{S}_j^2\right)}^2}{S_{X_{+}}^2}.{\mathbf{e}}_{S_j^2}^{\mathrm{T}}\right]\end{align}$$
Following Equation 9,
 $$\begin{align}{\widehat{V}}_{{\widehat{\lambda}}_1} = {\mathbf{G}}_{{\widehat{\lambda}}_1}.{\widehat{\mathbf{V}}}_{\mathrm{vec}\left(\mathbf{C}\right)}.{\mathbf{G}}_{{\widehat{\lambda}}_1}^{\mathrm{T}} = \left[{\sum}_j{S}_j^2.{\mathbf{1}}_{J^2}^{\mathrm{T}}-\frac{{\left({\sum}_j{S}_j^2\right)}^2}{S_{X_{+}}^2}.{\mathbf{e}}_{S_j^2}^{\mathrm{T}}\right].{\widehat{\mathbf{V}}}_{\mathrm{vec}\left(\mathbf{C}\right)}.\left[{\sum}_j{S}_j^2.{\mathbf{1}}_{J^2}-\frac{{\left({\sum}_j{S}_j^2\right)}^2}{S_{X_{+}}^2}.{\mathbf{e}}_{S_j^2}\right].\end{align}$$ ${\widehat{V}}_{{\widehat{\lambda}}_1}$
is a weighted sum of the elements of
${\widehat{V}}_{{\widehat{\lambda}}_1}$
is a weighted sum of the elements of ${\widehat{\mathbf{V}}}_{\mathrm{vec}\left(\mathbf{C}\right)}$
: elements that pertain to variances have weight
${\widehat{\mathbf{V}}}_{\mathrm{vec}\left(\mathbf{C}\right)}$
: elements that pertain to variances have weight ${\left({\sum}_j{S}_j^2\right)}^2-\frac{{\left({\sum}_j{S}_j^2\right)}^4}{S_{X_{+}}^4}$
, all other elements have weight
${\left({\sum}_j{S}_j^2\right)}^2-\frac{{\left({\sum}_j{S}_j^2\right)}^4}{S_{X_{+}}^4}$
, all other elements have weight ${\left({\sum}_j{S}_j^2\right)}^2$
. The estimated SE is
${\left({\sum}_j{S}_j^2\right)}^2$
. The estimated SE is
 $$\begin{align}{\widehat{SE}}_{{\widehat{\lambda}}_1} = \sqrt{\left[{\sum}_j{S}_j^2.{\mathbf{1}}_{J^2}^{\mathrm{T}}-\frac{{\left({\sum}_j{S}_j^2\right)}^2}{S_{X_{+}}^2}.{\mathbf{e}}_{S_j^2}^{\mathrm{T}}\right].{\widehat{\mathbf{V}}}_{\mathrm{vec}\left(\mathbf{C}\right)}.{\left[{\sum}_j{S}_j^2.{\mathbf{1}}_{J^2}-\frac{{\left({\sum}_j{S}_j^2\right)}^2}{S_{X_{+}}^2}.{\mathbf{e}}_{S_j^2}\right]}^{\mathrm{T}}}.\end{align}$$
Let ${v}_{\left( ij, kl\right)}$
denote the covariance of sample covariances
${v}_{\left( ij, kl\right)}$
denote the covariance of sample covariances ${C}_{X_i{X}_j}$
and
${C}_{X_i{X}_j}$
and ${C}_{X_k{X}_l}$
(see Appendix F), and let
${C}_{X_k{X}_l}$
(see Appendix F), and let ${\delta}_{\left( ij, kl\right)} = 1$
if
${\delta}_{\left( ij, kl\right)} = 1$
if $i = j$
or
$i = j$
or $k = l$
(i.e., at least one sample variance is involved); then, Equation G8 can be written as
$k = l$
(i.e., at least one sample variance is involved); then, Equation G8 can be written as
 $$\begin{align}{\widehat{SE}}_{{\widehat{\lambda}}_1} = \sqrt{\sum_i{\sum}_j{\sum}_k{\sum}_l{\left({\sum}_h{S}_h^2-{\delta}_{\left( ij, kl\right)}\frac{{\left({\sum}_j{S}_d^2\right)}^2}{S_{X_{+}}^2}\right)}^2{v}_{\left( ij, kl\right)}}.\end{align}$$
Appendix H: Guttman’s lambda 2
Let $J$
denote the number of items, let
$J$
denote the number of items, let ${C}_{X_i{X}_j}$
be the sample inter-item variances (
${C}_{X_i{X}_j}$
be the sample inter-item variances ( $i = j$
) and covariances (
$i = j$
) and covariances ( $i\ne j$
), let
$i\ne j$
), let ${S}_{X_{+}}^2 = {\sum}_i{\sum}_j{C}_{X_i{X}_j}$
denote the sum-score variance, let
${S}_{X_{+}}^2 = {\sum}_i{\sum}_j{C}_{X_i{X}_j}$
denote the sum-score variance, let ${\sum}_j{S}_j^2 = {\sum}_k{C}_{X_k{X}_k}$
denote the sum of the
${\sum}_j{S}_j^2 = {\sum}_k{C}_{X_k{X}_k}$
denote the sum of the $J$
item variances, let
$J$
item variances, let ${C}_{+} = {S}_{X_{+}}^2-{\sum}_j{S}_j^2$
denote the sum of all covariances, let
${C}_{+} = {S}_{X_{+}}^2-{\sum}_j{S}_j^2$
denote the sum of all covariances, let ${C}_{+}^2 = {\sum}_i{\sum}_j{C}_{X_i{X}_j}^2-{\sum}_k{C}_{X_k{X}_k}^2$
denote the sum of all squared covariances, and let
${C}_{+}^2 = {\sum}_i{\sum}_j{C}_{X_i{X}_j}^2-{\sum}_k{C}_{X_k{X}_k}^2$
denote the sum of all squared covariances, and let ${\overset{\sim }{C}}_{+}^2 = \sqrt{J/\left(J-1\right)\times {C}_{+}^2\;}$
. The sample value of Guttman’s lambda 2 then equals
${\overset{\sim }{C}}_{+}^2 = \sqrt{J/\left(J-1\right)\times {C}_{+}^2\;}$
. The sample value of Guttman’s lambda 2 then equals
 $$\begin{align}{\widehat{\lambda}}_2 = 1-\frac{\sum_j{S}_j^2-\sqrt{J/\left(J-1\right)\times {C}_{+}^2\;}}{S_{X_{+}}^2} = \frac{C_{+}+{\overset{\sim }{C}}_{+}^2}{S_{X_{+}}^2},\end{align}$$
where the right-hand side of Equation H1 is a convenient way to write ${\widehat{\lambda}}_2$
in the generalized exp-log notation. Let
${\widehat{\lambda}}_2$
in the generalized exp-log notation. Let $\mathrm{vec}\left(\mathbf{C}\right)$
denote the vectorized sample inter-item variance covariance matrix (see Appendix F), and let
$\mathrm{vec}\left(\mathbf{C}\right)$
denote the vectorized sample inter-item variance covariance matrix (see Appendix F), and let ${\mathbf{A}}_1 = {\left[\begin{array}{cc}\mathbf{D}\left({\mathbf{1}}_J-{\mathbf{e}}_{S_j^2}\right)& {\mathbf{1}}_J\end{array}\right]}^{\mathrm{T}}$
be a
${\mathbf{A}}_1 = {\left[\begin{array}{cc}\mathbf{D}\left({\mathbf{1}}_J-{\mathbf{e}}_{S_j^2}\right)& {\mathbf{1}}_J\end{array}\right]}^{\mathrm{T}}$
be a $\left({J}^2+1\right)\times {J}^2$
matrix—where
$\left({J}^2+1\right)\times {J}^2$
matrix—where $\mathbf{D}\left(\mathbf{x}\right)$
is a diagonal matrix with
$\mathbf{D}\left(\mathbf{x}\right)$
is a diagonal matrix with $\mathbf{x}$
on its diagonal and the elements of the
$\mathbf{x}$
on its diagonal and the elements of the ${J}^2$
vector
${J}^2$
vector ${\mathbf{e}}_{S_j^2}$
equal 1 if they correspond to a variance in
${\mathbf{e}}_{S_j^2}$
equal 1 if they correspond to a variance in $\mathrm{vec}\left(\mathbf{C}\right)$
and equal 0 if they correspond to a covariance in
$\mathrm{vec}\left(\mathbf{C}\right)$
and equal 0 if they correspond to a covariance in $\mathrm{vec}\left(\mathbf{C}\right)$
. Furthermore, let
$\mathrm{vec}\left(\mathbf{C}\right)$
. Furthermore, let ${\mathbf{A}}_2 = \left[\begin{array}{cc}2{\mathbf{I}}_{J^2}& \boldsymbol{0}\\ {}{\mathbf{I}}_{J^2}& \boldsymbol{0}\\ {}{\mathbf{0}}^T& 1\end{array}\right]$
be a
${\mathbf{A}}_2 = \left[\begin{array}{cc}2{\mathbf{I}}_{J^2}& \boldsymbol{0}\\ {}{\mathbf{I}}_{J^2}& \boldsymbol{0}\\ {}{\mathbf{0}}^T& 1\end{array}\right]$
be a $\left(2{J}^2+1\right)\times \left({J}^2+1\right)$
matrix, where
$\left(2{J}^2+1\right)\times \left({J}^2+1\right)$
matrix, where $2{\mathbf{I}}_P$
denotes a diagonal matrix with the value 2 on all diagonal elements, let
$2{\mathbf{I}}_P$
denotes a diagonal matrix with the value 2 on all diagonal elements, let ${\mathbf{A}}_3 = \left[\begin{array}{ccc}\frac{J}{J-1}\;{\boldsymbol{1}}^T& {\boldsymbol{0}}^T& 0\\ {}{\boldsymbol{0}}^T& {\boldsymbol{1}}^T& 0\\ {}{\boldsymbol{0}}^T& {\boldsymbol{0}}^T& 1\end{array}\right]$
be a
${\mathbf{A}}_3 = \left[\begin{array}{ccc}\frac{J}{J-1}\;{\boldsymbol{1}}^T& {\boldsymbol{0}}^T& 0\\ {}{\boldsymbol{0}}^T& {\boldsymbol{1}}^T& 0\\ {}{\boldsymbol{0}}^T& {\boldsymbol{0}}^T& 1\end{array}\right]$
be a $3\times \left(2{J}^2+1\right)$
matrix, let
$3\times \left(2{J}^2+1\right)$
matrix, let ${\mathbf{A}}_4 = \left[\begin{array}{ccc}\frac{1}{2}& 0& 0\\ {}0& 1& 0\\ {}0& 0& 1\end{array}\right]$
be a
${\mathbf{A}}_4 = \left[\begin{array}{ccc}\frac{1}{2}& 0& 0\\ {}0& 1& 0\\ {}0& 0& 1\end{array}\right]$
be a $3\times 3$
matrix, let
$3\times 3$
matrix, let ${\mathbf{A}}_5 = \left[\begin{array}{ccc}1& 1& 0\\ {}0& 0& 1\end{array}\right]$
be a
${\mathbf{A}}_5 = \left[\begin{array}{ccc}1& 1& 0\\ {}0& 0& 1\end{array}\right]$
be a $2\times 3$
matrix, and let
$2\times 3$
matrix, and let ${\mathbf{A}}_6 = \left[\begin{array}{cc}1& -1\end{array}\right]$
be a
${\mathbf{A}}_6 = \left[\begin{array}{cc}1& -1\end{array}\right]$
be a $2\times 1$
row vector. With
$2\times 1$
row vector. With ${\mathbf{g}}_0 = \mathrm{vec}\left(\mathbf{C}\right)$
, and following Equations 2 and 3, it follows that
${\mathbf{g}}_0 = \mathrm{vec}\left(\mathbf{C}\right)$
, and following Equations 2 and 3, it follows that
 $$\begin{align}{\mathbf{g}}_1 = \log \left({\mathbf{A}}_1.{\mathbf{g}}_0\right) = \log \left(\left[\begin{array}{c}\mathbf{D}\left(\mathbf{1}-{\mathbf{e}}_{S_j^2}\right)\\ {}{\mathbf{1}}_{J^2}^T\end{array}\right].\mathrm{vec}\left(\mathbf{C}\right)\right) = \log \left[\begin{array}{c}\mathrm{vec}\left({\mathbf{C}}^{\ast}\right)\\ {}{S}_{X_{+}}^2\end{array}\right],\end{align}$$
where ${\mathbf{C}}^{\ast}\;\mathrm{is}$
the inter-item variance covariance matrix with all variances set to zero;
${\mathbf{C}}^{\ast}\;\mathrm{is}$
the inter-item variance covariance matrix with all variances set to zero;
 $$\begin{align}{\mathbf{g}}_2 = \exp \left({\mathbf{A}}_2.{\mathbf{g}}_1\right) = \exp \left(\left[\begin{array}{cc}2{\mathbf{I}}_J& \mathbf{0}\\ {}{\mathbf{I}}_j& \mathbf{0}\\ {}{\mathbf{0}}^T& 1\end{array}\right].\log \left(\left[\begin{array}{c}\mathrm{vec}\left({\mathbf{C}}^{\ast}\right)\\ {}{S}_{X_{+}}^2\end{array}\right]\right)\right) = \left[\begin{array}{c}\mathrm{vec}\left({\mathbf{C}}^{\ast 2}\right)\\ {}\mathrm{vec}\left({\mathbf{C}}^{\ast}\right)\\ {}{S}_{X_{+}}^2\end{array}\right],\end{align}$$
where ${\mathbf{C}}^{\ast 2}\;\mathrm{is}$
a
${\mathbf{C}}^{\ast 2}\;\mathrm{is}$
a $J\times J$
matrix with the squared inter-item covariances on the off-diagonal elements and 0 on-diagonal elements;
$J\times J$
matrix with the squared inter-item covariances on the off-diagonal elements and 0 on-diagonal elements;
 $$\begin{align}{\mathbf{g}}_3 = \log \left({\mathbf{A}}_3.{\mathbf{g}}_2\right) = \log \left(\left[\begin{array}{ccc}\frac{J}{J-1}\;{\mathbf{1}}^T& 0& 0\\ {}{\mathbf{0}}^T& {\mathbf{1}}^T& 0\\ {}{\mathbf{0}}^T& 0& 1\end{array}\right].\left[\begin{array}{c}\mathrm{vec}\left({\mathbf{C}}^{\ast \mathbf{2}}\right)\\ {}\mathrm{vec}\left({\mathbf{C}}^{\ast}\right)\\ {}{S}_{X_{+}}^2\end{array}\right]\right) = \log \left[\begin{array}{c}\frac{J}{J-1}{C}_{+}^2\\ {}{C}_{+}\\ {}{S}_{X_{+}}^2\end{array}\right];\end{align}$$
 $$\begin{align}{\mathbf{g}}_4 = \exp \left({\mathbf{A}}_4.{\mathbf{g}}_3\right) = \exp \left(\left[\begin{array}{ccc}\frac{1}{2}& 0& 0\\ {}0& 1& 0\\ {}0& 0& 1\end{array}\right].\log \left[\begin{array}{c}\frac{J}{J-1}{C}_{+}^2\\ {}{C}_{+}\\ {}{S}_{X_{+}}^2\end{array}\right]\right) = \left[\begin{array}{c}\sqrt{\frac{J}{J-1}{C}_{+}^2}\\ {}{C}_{+}\\ {}{S}_{X_{+}}^2\end{array}\right] = \left[\begin{array}{c}{\overset{\sim }{C}}_{+}^2\\ {}{C}_{+}\\ {}{S}_{X_{+}}^2\end{array}\right];\end{align}$$
 $$\begin{align}{\mathbf{g}}_5 = \log \left({\mathbf{A}}_5.{\mathbf{g}}_4\right) = \log \left(\left[\begin{array}{ccc}1& 1& 0\\ {}0& 0& 1\end{array}\right].\left[\begin{array}{c}{\overset{\sim }{C}}_{+}^2\\ {}{C}_{+}\\ {}{S}_{X_{+}}^2\end{array}\right]\right) = \log \left[\begin{array}{c}{C}_{+}+{\overset{\sim }{C}}_{+}^2\\ {}{S}_{X_{+}}^2\end{array}\right];\end{align}$$
and
 $$\begin{align}{\mathbf{g}}_6 = {\mathbf{g}}_{{\widehat{\lambda}}_2} = \exp \left({\mathbf{A}}_6.{\mathbf{g}}_5\right) = \exp \left(\left[\begin{array}{cc}1& -1\end{array}\right].\log \left[\begin{array}{c}{C}_{+}+{\overset{\sim }{C}}_{+}^2\\ {}{S}_{X_{+}}^2\end{array}\right]\right) = \frac{C_{+}+{\overset{\sim }{C}}_{+}^2}{S_{X_{+}}^2} = {\widehat{\lambda}}_2\end{align}$$
The Jacobian ${\mathbf{G}}_{{\widehat{\lambda}}_2}$
can be derived from
${\mathbf{G}}_{{\widehat{\lambda}}_2}$
can be derived from ${\mathbf{g}}_1,\dots, {\mathbf{g}}_6$
. Let
${\mathbf{g}}_1,\dots, {\mathbf{g}}_6$
. Let ${\mathbf{G}}_0 = \mathbf{I}$
. Following Equations 4 and 5,
${\mathbf{G}}_0 = \mathbf{I}$
. Following Equations 4 and 5,
 $$\begin{align}{\mathbf{G}}_1 = {\mathbf{D}}^{-1}\left({\mathbf{A}}_1.{\mathbf{g}}_0\right).{\mathbf{A}}_1.{\mathbf{G}}_0 = {\mathbf{D}}^{-1}\left(\left[\begin{array}{c}\mathrm{vec}\left({\mathbf{C}}^{\ast}\right)\\ {}{S}_{X_{+}}^2\end{array}\right]\right).\left[\begin{array}{c}\mathbf{D}\left(\mathbf{1}-{\mathbf{e}}_{S_j^2}\right)\\ {}{\mathbf{1}}_{J^2}^T\end{array}\right].\mathbf{I} = \left[\begin{array}{c}{\mathbf{C}}_{\mathbf{1}}\\ {}{\mathbf{1}}_{J^2}^{\mathrm{T}}/{S}_{X_{+}}^2\end{array}\right],\end{align}$$
where ${\mathbf{C}}_1 = \mathbf{D}\left(\frac{\mathbf{1}-{\mathbf{e}}_{S_j^2}}{\mathrm{vec}\left({\mathbf{C}}^{\ast}\right)}\right)$
is a diagonal matrix, with the elements corresponding to
${\mathbf{C}}_1 = \mathbf{D}\left(\frac{\mathbf{1}-{\mathbf{e}}_{S_j^2}}{\mathrm{vec}\left({\mathbf{C}}^{\ast}\right)}\right)$
is a diagonal matrix, with the elements corresponding to ${C}_{X_i{X}_j}$
(
${C}_{X_i{X}_j}$
( $i,j = 1,\dots, J,i\ne j$
) equal to
$i,j = 1,\dots, J,i\ne j$
) equal to $1/{C}_{X_i{X}_j}$
, and all other elements equal to 0;
$1/{C}_{X_i{X}_j}$
, and all other elements equal to 0;
 $$\begin{align}{\mathbf{G}}_2 = \mathbf{D}\left(\exp \left({\mathbf{A}}_2.{\mathbf{g}}_1\right)\right).{\mathbf{A}}_2.{\mathbf{G}}_1 = \mathbf{D}\left(\left[\begin{array}{c}\mathrm{vec}\left({\mathbf{C}}^{\ast \mathbf{2}}\right)\\ {}\mathrm{vec}\left({\mathbf{C}}^{\ast}\right)\\ {}{S}_{X_{+}}^2\end{array}\right]\right).\left[\begin{array}{cc}2{\mathbf{I}}_J& \mathbf{0}\\ {}{\mathbf{I}}_j& 0\\ {}{\mathbf{0}}^T& 1\end{array}\right].\left[\begin{array}{c}{\mathbf{C}}_{\mathbf{1}}\\ {}{\mathbf{1}}_{J^2}^{\mathrm{T}}/{S}_{X_{+}}^2\end{array}\right] = \left[\begin{array}{c}2\mathbf{D}\left({\mathbf{C}}^{\ast}\right)\\ {}{\mathbf{I}}_J\\ {}{\mathbf{1}}_{J^2}^{\mathrm{T}}/{S}_{X_{+}}^2\end{array}\right];\end{align}$$
 $$\begin{align}{\mathbf{G}}_3 = {\mathbf{D}}^{-1}\left({\mathbf{A}}_3.{\mathbf{g}}_2\right).{\mathbf{A}}_3.{\mathbf{G}}_2 = {\mathbf{D}}^{-1}\left(\left[\begin{array}{c}\frac{J-1}{J}{C}_{+}^2\\ {}{C}_{+}\\ {}{S}_{X_{+}}^2\end{array}\right]\right).\left[\begin{array}{ccc}\frac{J}{J-1}\;{\mathbf{1}}^{\mathrm{T}}& 0& 0\\ {}{\mathbf{0}}^{\mathrm{T}}& {\mathbf{1}}^{\mathrm{T}}& 0\\ {}{\mathbf{0}}^{\mathrm{T}}& 0& 1\end{array}\right].\left[\begin{array}{c}2\mathbf{D}\left({\mathbf{C}}^{\ast}\right)\\ {}{\mathbf{I}}_J\\ {}\frac{{\mathbf{1}}_{J^2}^{\mathrm{T}}}{S_{X_{+}}^2}\end{array}\right] = \left[\begin{array}{c}\frac{2}{C_{+}^2}\times {\left(\mathrm{vec}\left({\mathbf{C}}^{\ast}\right)\right)}^{\mathrm{T}}\\ {}\frac{1}{C_{+}}\times \left({\mathbf{1}}_{J^{\mathbf{2}}}^{\mathrm{T}}-{\mathbf{e}}_{S_j^2}^{\mathrm{T}}\right)\\ {}\frac{1}{S_{X_{+}}^2}\times {\mathbf{1}}_{J^2}^{\mathrm{T}}\end{array}\right];\end{align}$$
 $$\begin{align}{\mathbf{G}}_4 &= \mathbf{D}\left(\exp \left({\mathbf{A}}_4.{\mathbf{g}}_3\right)\right).{\mathbf{A}}_4.{\mathbf{G}}_3 = \mathbf{D}\left(\left[\begin{array}{c}{\overset{\sim }{C}}_{+}^2\\ {}{C}_{+}\\ {}{S}_{X_{+}}^2\end{array}\right]\right).\left[\begin{array}{ccc}\frac{1}{2}& 0& 0\\ {}0& 1& 0\\ {}0& 0& 1\end{array}\right].\left[\begin{array}{c}\frac{2}{C_{+}^2}\times {\left(\mathrm{vec}\left({\mathbf{C}}^{\ast}\right)\right)}^{\mathrm{T}}\\ {}\frac{1}{C_{+}}\times \left({\mathbf{1}}_{J^{\mathbf{2}}}^{\mathrm{T}}-{\mathbf{e}}_{S_j^2}^{\mathrm{T}}\right)\\ {}\frac{1}{S_{X_{+}}^2}\times {\mathbf{1}}_{J^2}^{\mathrm{T}}\end{array}\right] =\left[\begin{array}{c}\frac{{\overset{\sim }{C}}_{+}^2}{C_{+}^2}\times {\left(\mathrm{vec}\left({\mathbf{C}}^{\ast}\right)\right)}^{\mathrm{T}}\\ {}\left({\mathbf{1}}_{J^{\mathbf{2}}}^{\mathrm{T}}-{\mathbf{e}}_{S_j^2}^{\mathrm{T}}\right)\\ {}{\mathbf{1}}_{J^2}^{\mathrm{T}}\end{array}\right];\end{align}$$
 $$\begin{align}{\mathbf{G}}_5 = {\mathbf{D}}^{-1}\left({\mathbf{A}}_5.{\mathbf{g}}_4\right).{\mathbf{A}}_5.{\mathbf{G}}_4 = {\mathbf{D}}^{-1}\left(\left[\begin{array}{c}{C}_{+}+{\overset{\sim }{C}}_{+}^2\\ {}{S}_{X_{+}}^2\end{array}\right]\right).\left[\begin{array}{ccc}1& 1& 0\\ {}0& 0& 1\end{array}\right].\left[\begin{array}{c}\frac{{\overset{\sim }{C}}_{+}^2}{C_{+}^2}\times {\left(\mathrm{vec}\left({\mathbf{C}}^{\ast}\right)\right)}^{\mathrm{T}}\\ {}\left({\mathbf{1}}_{J^{\mathbf{2}}}^{\mathrm{T}}-{\mathbf{e}}_{S_j^2}^{\mathrm{T}}\right)\\ {}{\mathbf{1}}_{J^2}^{\mathrm{T}}\end{array}\right] = \left[\begin{array}{c}\frac{\frac{{\overset{\sim }{C}}_{+}^2}{C_{+}^2}\times {\left(\mathrm{vec}\left({\mathbf{C}}^{\ast}\right)\right)}^{\mathrm{T}}+\left({\mathbf{1}}_{J^{\mathbf{2}}}^{\mathrm{T}}-{\mathbf{e}}_{S_j^2}^{\mathrm{T}}\right)}{C_{+}+{\overset{\sim }{C}}_{+}^2}\\ {}\frac{{\mathbf{1}}_{J^{\mathbf{2}}}^{\mathrm{T}}}{S_{X_{+}}^2}\end{array}\right];\end{align}$$
and
 $$\begin{align}{\mathbf{G}}_{{\widehat{\lambda}}_2} &= {\mathbf{G}}_6 = \mathbf{D}\left(\exp \left({\mathbf{A}}_6.{\mathbf{g}}_5\right)\right).{\mathbf{A}}_6.{\mathbf{G}}_5 = \frac{C_{+}+{\overset{\sim }{C}}_{+}^2}{S_{X_{+}}^2}.\left[\begin{array}{cc}1& -1\end{array}\right].\left[\begin{array}{c}\frac{\frac{{\overset{\sim }{C}}_{+}^2}{C_{+}^2}\times {\left(\mathrm{vec}\left({\mathbf{C}}^{\ast}\right)\right)}^{\mathrm{T}}+\left({\mathbf{1}}_{J^{\mathbf{2}}}^{\mathrm{T}}-{\mathbf{e}}_{S_j^2}^{\mathrm{T}}\right)}{C_{+}+{\overset{\sim }{C}}_{+}^2}\\ {}\frac{{\mathbf{1}}_{J^{\mathbf{2}}}^{\mathrm{T}}}{S_{X_{+}}^2}\end{array}\right]\nonumber\\& = \frac{C_{+}+{\overset{\sim }{C}}_{+}^2}{S_{X_{+}}^2}\left(\frac{\frac{{\overset{\sim }{C}}_{+}^2}{C_{+}^2}\times {\left(\mathrm{vec}\left({\mathbf{C}}^{\ast}\right)\right)}^{\mathrm{T}}+\left({\mathbf{1}}_{J^{\mathbf{2}}}^{\mathrm{T}}-{\mathbf{e}}_{S_j^2}^{\mathrm{T}}\right)}{C_{+}+{\overset{\sim }{C}}_{+}^2}-\frac{{\mathbf{1}}_{J^{\mathbf{2}}}^{\mathrm{T}}}{S_{X_{+}}^2}\right) = \frac{\frac{{\overset{\sim }{C}}_{+}^2}{C_{+}^2}\times {\left(\mathrm{vec}\left({\mathbf{C}}^{\ast}\right)\right)}^{\mathrm{T}}+\left({\mathbf{1}}_{J^{\mathbf{2}}}^{\mathrm{T}}-{\mathbf{e}}_{S_j^2}^{\mathrm{T}}\right)-{\widehat{\lambda}}_2{\mathbf{1}}_{J^{\mathbf{2}}}^{\mathrm{T}}}{S_{X_{+}}^2}\end{align}$$
Let ${\widehat{\mathbf{V}}}_{\mathrm{vec}\left(\mathbf{C}\right)}$
denote the estimated variance covariance matrix of
${\widehat{\mathbf{V}}}_{\mathrm{vec}\left(\mathbf{C}\right)}$
denote the estimated variance covariance matrix of $\mathrm{vec}\left(\mathbf{C}\right)$
, with elements
$\mathrm{vec}\left(\mathbf{C}\right)$
, with elements ${v}_{\left(i,j\right),\left(k,l\right)}$
(see Appendix F); then, following Equation 9,
${v}_{\left(i,j\right),\left(k,l\right)}$
(see Appendix F); then, following Equation 9,
 $$\begin{align}{\widehat{V}}_{{\widehat{\lambda}}_2} = {\mathbf{G}}_{{\widehat{\lambda}}_2}{\widehat{\mathbf{V}}}_{\mathrm{vec}\left(\mathbf{C}\right)}{\mathbf{G}}_{{\widehat{\lambda}}_2}^{\mathrm{T}} = \left[\frac{\frac{{\overset{\sim }{C}}_{+}^2}{C_{+}^2}\times {\left(\mathrm{vec}\left({\mathbf{C}}^{\ast}\right)\right)}^{\mathrm{T}}+\left({\mathbf{1}}_{J^{\mathbf{2}}}^T-{\mathbf{e}}_{S_j^2}^{\mathrm{T}}\right)-{\widehat{\lambda}}_2.{\mathbf{1}}_{J^{\mathbf{2}}}^{\mathrm{T}}}{S_{X_{+}}^2}\right].{\widehat{\mathbf{V}}}_{\mathrm{vec}\left(\mathbf{C}\right)}{\left[\frac{\frac{{\overset{\sim }{C}}_{+}^2}{C_{+}^2}\times {\left(\mathrm{vec}\left({\mathbf{C}}^{\ast}\right)\right)}^{\mathrm{T}}+\left({\mathbf{1}}_{J^{\mathbf{2}}}^T-{\mathbf{e}}_{S_j^2}^{\mathrm{T}}\right)-{\widehat{\lambda}}_2.{\mathbf{1}}_{J^{\mathbf{2}}}^{\mathrm{T}}}{S_{X_{+}}^2}\right]}^{\mathrm{T}}.\end{align}$$
Let ${G}_{(ij)}$
be the element of
${G}_{(ij)}$
be the element of ${\mathbf{G}}_{{\widehat{\lambda}}_2}$
that pertains to (co)variance
${\mathbf{G}}_{{\widehat{\lambda}}_2}$
that pertains to (co)variance ${C}_{ij}$
(
${C}_{ij}$
( $i,j = 1,\dots, J$
). It can be shown that the scalar notation of the last term of Equation H14 equals
$i,j = 1,\dots, J$
). It can be shown that the scalar notation of the last term of Equation H14 equals
 $$\begin{align}{G}_{(ij)} = \frac{{\overset{\sim }{C}}_{+}^2}{C_{+}^2{S}_{X_{+}}^2}\left(1-{\delta}_{ij}\right){C}_{ij}+\frac{1}{S_{X_{+}}^2}\left(1-{\delta}_{ij}\right)-\frac{{\widehat{\lambda}}_2}{S_{X_{+}}^2}.\end{align}$$
To simplify notation, let ${W}_1 = \frac{{\overset{\sim }{C}}_{+}^2}{C_{+}^2{S}_{X_{+}}^2}$
,
${W}_1 = \frac{{\overset{\sim }{C}}_{+}^2}{C_{+}^2{S}_{X_{+}}^2}$
, ${W}_2 = \frac{1}{S_{X_{+}}^2}$
, and
${W}_2 = \frac{1}{S_{X_{+}}^2}$
, and ${W}_3 = -\frac{{\widehat{\lambda}}_2}{S_{X_{+}}^2}$
. Then, Equation H15 reduces to
${W}_3 = -\frac{{\widehat{\lambda}}_2}{S_{X_{+}}^2}$
. Then, Equation H15 reduces to
 $$\begin{align}{G}_{(ij)} = {W}_1\left(1-{\delta}_{ij}\right){C}_{ij}+{W}_2\left(1-{\delta}_{ij}\right)+{W}_3.\end{align}$$
Then, Equation H14 in scalar notation becomes
 $$\begin{align}{\widehat{V}}_{{\widehat{\lambda}}_2} &= {\sum}_i{\sum}_j{\sum}_k{\sum}_l{G}_{(ij)}{G}_{(kl)}{v}_{\left( ij, kl\right)}\nonumber\\ &={\sum}_i{\sum}_j{\sum}_k{\sum}_l\left({W}_1\left(1-{\delta}_{ij}\right){C}_{ij}+{W}_2\left(1-{\delta}_{ij}\right)+{W}_3\right)\left({W}_1\left(1-{\delta}_{kl}\right){C}_{kl}+{W}_2\left(1-{\delta}_{kl}\right)+{W}_3\right){v}_{\left( ij, kl\right)} \nonumber\\ &= {\sum}_i{\sum}_j{\sum}_k{\sum}_l[{W}_1^2\left(1-{\delta}_{ij}\right)\left(1-{\delta}_{kl}\right){C}_{ij}{C}_{kl}+{W}_1{W}_2\left(1-{\delta}_{ij}\right)\left(1-{\delta}_{kl}\right){C}_{ij}+{W}_1{W}_3\left(1-{\delta}_{ij}\right){C}_{ij}\nonumber\\&\quad+{W}_1{W}_2\left(1-{\delta}_{ij}\right)\left(1-{\delta}_{kl}\right){C}_{kl}+{W}_2^2\left(1-{\delta}_{ij}\right)\left(1-{\delta}_{kl}\right)+{W}_2{W}_3\left(1-{\delta}_{ij}\right)+{W}_1{W}_3\left(1-{\delta}_{kl}\right){C}_{kl}\nonumber\\ &\quad +{W}_2{W}_3\left(1-{\delta}_{kl}\right)+{W}_3^2]{v}_{\left( ij, kl\right)}\end{align}$$
So, the SE of ${\widehat{\lambda}}_2$
equals
${\widehat{\lambda}}_2$
equals
 $$\begin{align}{\widehat{SE}}_{{\widehat{\lambda}}_2} &= \sqrt{{\widehat{V}}_{{\widehat{\lambda}}_2}} = \left({\sum}_i{\sum}_j{\sum}_k{\sum}_l[{W}_1^2\left(1-{\delta}_{ij}\right)\left(1-{\delta}_{kl}\right){C}_{ij}{C}_{kl}+{W}_1{W}_2\left(1-{\delta}_{ij}\right)\left(1-{\delta}_{kl}\right){C}_{ij}\right.\nonumber\\&\quad\left.+{W}_1{W}_3\left(1-{\delta}_{ij}\right){C}_{ij}+{W}_1{W}_2\left(1-{\delta}_{ij}\right)\left(1-{\delta}_{kl}\right){C}_{kl}+{W}_2^2\left(1-{\delta}_{ij}\right)\left(1-{\delta}_{kl}\right)+{W}_2{K}_3\left(1-{\delta}_{ij}\right)+{W}_1{W}_3\left(1-{\delta}_{kl}\right){C}_{kl}\right.\nonumber\\&\quad\left.+{W}_2{W}_3\left(1-{\delta}_{kl}\right)+{W}_3^2]{v}_{\left( ij, kl\right)}\right)^{\frac{1}{2}}\end{align} $$


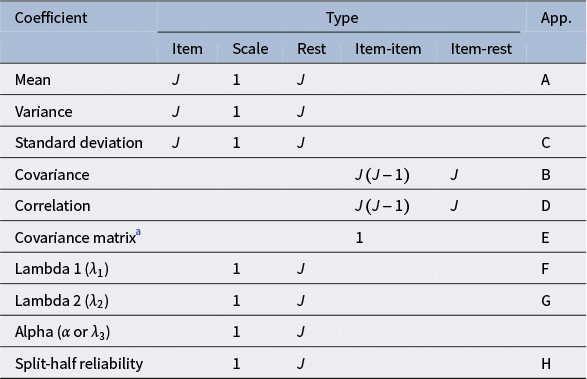
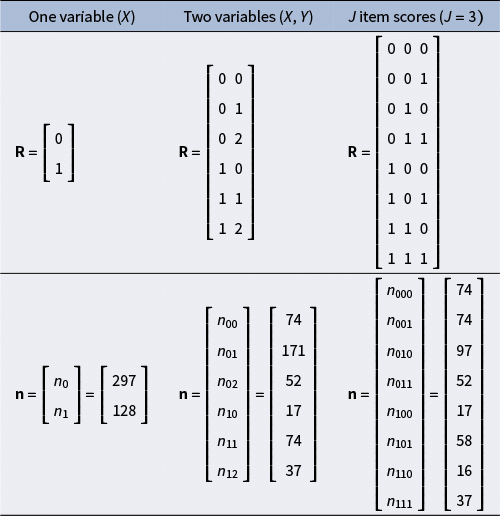

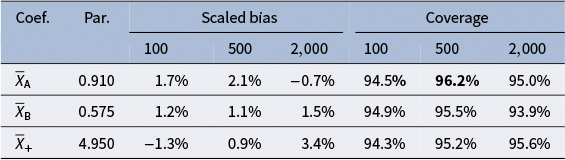

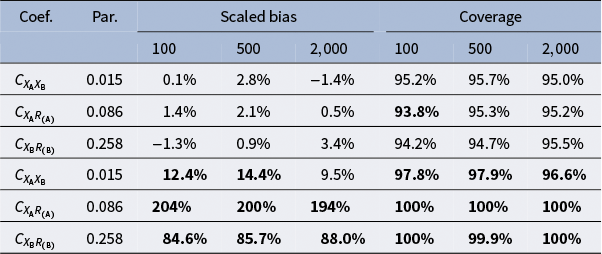

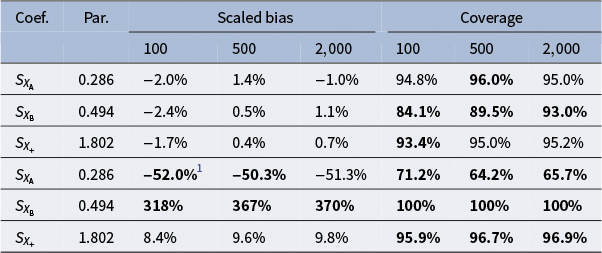


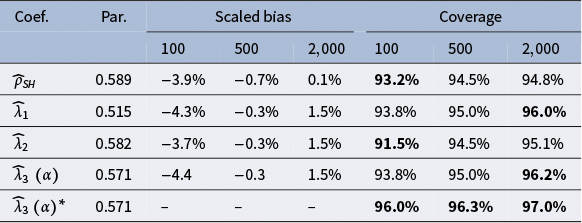


 Open access