


The study of personality has a rich history examining individual differences in how we behave, relate to ourselves and each other, and understand our experiences and environment. This work has had the significant challenge of linking multiple levels of analysis spanning complex neural and cognitive processes. Recently, computational models have provided a powerful tool to mathematically formalize this complexity, and provide rich descriptions of the processes underlying human behavior. In the present review, we discuss the concept and promise of a computational phenotype—a collection of mathematically derived parameters that precisely describe individual differences in personality, development, and psychiatric illness.
Traditional approaches to personality are grounded in the study of individuals and how they differ across a range of psychological characteristics that are indexed via measures of traits or symptoms. The most widespread example of this is “general intelligence” (Spearman, Reference Spearman1904). Individuals higher on general intelligence experience better educational (Deary, Strand, Smith, & Fernandes, Reference Deary, Strand, Smith and Fernandes2007) and job-related outcomes (Ree, Earles, & Teachout, Reference Ree, Earles and Teachout1994; Schmidt & Hunter, Reference Schmidt and Hunter2004). However, this research is largely descriptive; general intelligence is a composite measure of several underlying cognitive processes including, but not limited to, working memory (Alloway & Alloway, Reference Alloway and Alloway2010), verbal and spatial ability, reasoning and processing speed (Deary, Penke, & Johnson, Reference Deary, Penke and Johnson2010; Hunt, Reference Hunt2011; Lubinski, Reference Lubinski2004). This composition of processes has been examined experimentally, but rarely formalized mechanistically. A formal mechanistic definition describes how and why the composition of processes leads to the observable outcome or behavior.
Computational applications to psychiatry have been widely advocated in recent literature (Adams, Huys, & Roiser, Reference Adams, Huys and Roiser2015; Friston, Stephan, Montague, & Dolan, Reference Friston, Stephan, Montague and Dolan2014; Huys, Maia, & Frank, Reference Huys, Maia and Frank2016; Huys, Moutoussis, & Williams, Reference Huys, Moutoussis and Williams2011; Maia & Frank, Reference Maia and Frank2011; Montague, Dolan, Friston, & Dayan, Reference Montague, Dolan, Friston and Dayan2012; Paulus, Huys, & Maia, Reference Paulus, Huys and Maia2016; Petzschner, Weber, Gard, & Stephan, Reference Petzschner, Weber, Gard and Stephan2017; Schwartenbeck & Friston, Reference Schwartenbeck and Friston2016; Stephan, Iglesias, Heinzle, & Diaconescu, Reference Stephan, Iglesias, Heinzle and Diaconescu2015; Stephan & Mathys, Reference Stephan and Mathys2014; Wang & Krystal, Reference Wang and Krystal2014; Wiecki, Poland, & Frank, Reference Wiecki, Poland and Frank2015). In particular, the process of computational phenotyping has been described in considerable depth using real and simulated data (Schwartenbeck & Friston, Reference Schwartenbeck and Friston2016; Wiecki, Poland, & Frank, Reference Wiecki, Poland and Frank2015). Yet, computational perspectives in the fields of personality and development have been relatively limited. Thus, the current review has three goals. First, we broadly outline how computational phenotypes work, and why individuals differ in their phenotype. Second, we review recent work that illustrates the benefits of using computational phenotypes to investigate individual differences. Third, we look forward to challenges in the practical application of computational phenotypes.
1. Computational phenotypes: How and why
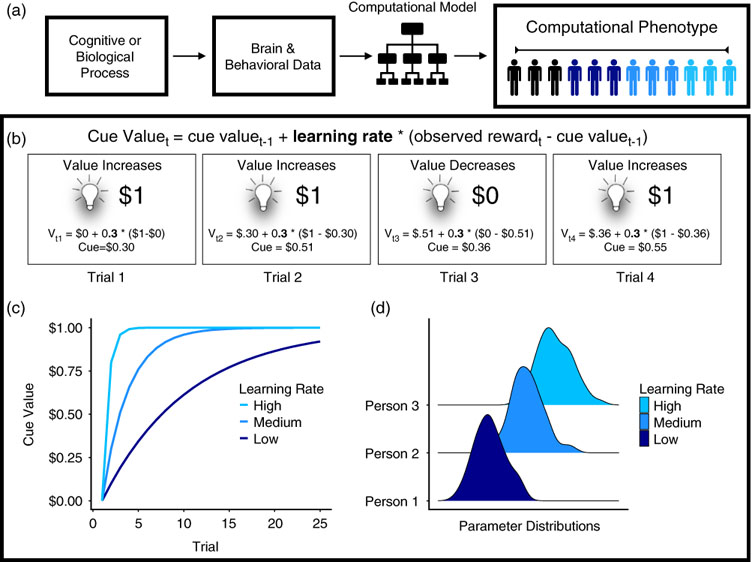
A computational phenotype is a set of parameters, derived from neural and behavioral data, which characterizes an individual’s cognitive mechanisms. We broadly schematize the process of deriving individual phenotypes in Figure 1a. This more explicit mechanistic characterization complements traditionally descriptive trait and symptom measures in several ways: It formalizes cognitive processes quantitatively, and reduces dimensionality by compressing the target process into a parameter or set of parameters. Moreover, these parameters vary within and between individuals, providing an opportunity to examine individual differences in computational mechanisms. The parameters are also sometimes linked to underlying neurobiological mechanisms.
(a) Computational phenotyping pipeline. Underlying cognitive or biological processes give rise to brain or behavioral data. The data are entered into the computational model, which produces a set of parameters representing the phenotype. (b) Process represented by computational phenotype. In this example, the light represents a cue that indicates a monetary reward. The value of the cue changes on each trial as a function of the value of the cue on the last trial (V t-1), the learning rate (i.e., computational phenotype; 0.3 in the illustration), and the prediction error (observed reward—cue valuet-1) (Rescorla & Wagner, Reference Rescorla and Wagner1972). (c) Learning rate is the computational phenotype. It varies between individuals, which is why the cue value changes at different rates for each person. (d) Learning rates are estimated using Bayesian analysis, increasing parameter sensitivity by using posterior distributions that incorporate uncertainty about the phenotype within and between individuals.

To illustrate how computational models can provide a mechanistic understanding of behavior, Figure 1b shows a case study of Pavlovian conditioning (Rescorla & Wagner, Reference Rescorla and Wagner1972; Sutton & Barto, Reference Sutton and Barto1998). In this experimental paradigm, a light signals the receipt of reward. The Rescorla–Wagner model (Rescorla & Wagner, Reference Rescorla and Wagner1972) explains how the light comes to acquire an association with reward (the “cue value,” denoted by V) over the course of conditioning. The learning equation uses the cue value on the current trial t (V t) to calculate the cue value for the next trial (V t+1):
 $$V_{{t{\plus}1}} {\equals}V_{t} {\plus}\alpha \delta _{t} $$
where α is a learning rate parameter (governing how quickly an individual learns) and the reward prediction error δ t is defined as the cue value from the last trial subtracted from the observed reward r t.
 $$\delta _{t} {\equals}r_{t} {\minus}V_{t} $$
These equations are formal definitions and serve as mechanistic hypotheses about a wide range of learning and decision-making processes with intricate ties to neurobiology. For example, reward prediction error signals have been found in midbrain dopamine neurons and functional activation in the ventral striatum (Glimcher, Reference Glimcher2011; O’Doherty et al., Reference O’Doherty, Dayan, Schultz, Deichmann, Friston and Dolan2004; Pessiglione, Seymour, Flandin, Dolan, & Frith, Reference Pessiglione, Seymour, Flandin, Dolan and Frith2006; Schultz, Dayan, & Montague, Reference Schultz, Dayan and Montague1997). In this simple model, the computational phenotype typically corresponds to the learning rate (Figure 1c), which has been linked to genetic (Frank, Moustafa, Haughey, Curran, & Hutchison, Reference Frank, Moustafa, Haughey, Curran and Hutchison2007) and developmental differences (Christakou et al., Reference Christakou, Gershman, Niv, Simmons, Brammer and Rubia2013; van den Bos, Cohen, Kahnt, & Crone, Reference van den Bos, Cohen, Kahnt and Crone2012) between individuals. The prediction error signal itself has sometimes been used as a computational phenotype, distinguishing learners from non-learners (Schönberg, Daw, Joel, & O’Doherty, Reference Schönberg, Daw, Joel and O’Doherty2007) and tracking individual differences in the relationship between fluid intelligence and dopamine synthesis (Schlagenhauf et al., Reference Schlagenhauf, Rapp, Huys, Beck, Wüstenberg, Deserno and … Heinz2013). We return to the latter study in depth, within the section on computational phenotyping in personality.
Another key advantage of computational phenotypes, such as learning rate, is dimensionality reduction. Describing a behavioral phenotype without a computational model requires a collection of parameters (e.g., accuracy, reaction time, choice preference) that roughly approximate the process of interest. Computational model parameters compress this information into a single parameter (e.g., learning rate) or set of parameters that specify how cognitive mechanisms produce behavior and neural activity.
In sum, computational phenotypes define how the cognitive process works mechanistically and provides rich descriptions about why individual variation in phenotypes (e.g., learning rate) produces different behavioral outcomes and neural activity.
2. Model selection and parameter estimation
Any study of computational phenotypes faces two methodological questions: How to select the appropriate model, and how to estimate the parameters of that model. Here we will briefly review the main approaches to these questions.
Models are typically evaluated in one of two ways. Goodness-of-fit criteria, such as the likelihood ratio test, the Bayesian information criterion, and the Akaike information criterion, evaluate how well the model fits the data, while penalizing for model complexity. Bayesian model selection criteria are similarly motivated, but place a full distribution over models. Each of these criteria is grounded in different theoretical foundations, so it is often useful to calculate multiple criteria. Predictive criteria evaluate how well a model predicts held-out data. For example, cross-validation uses a model fit to one subset of the data to predict another subset of the data.
Parameter estimation methods fall into one of two categories. Point estimation methods are based on fitting a single set of parameters for each individual. Bayesian methods are based on estimating a posterior distribution over parameters, which allows the researcher to quantify parameter uncertainty (Figure 1d). Hierarchical Bayesian models (see Gelman et al., Reference Gelman, Carlin, Stern, Dunson, Vehtari and Rubin2013; Wiecki, Poland, & Frank, Reference Wiecki, Poland and Frank2015) take this one step further, estimating distributions over both group-level and individual-level parameter estimates. Researchers can also incorporate prior beliefs about parameter estimates from other data sets, thereby increasing parameter reliability, identifiability, predictive validity, and sensitivity to individual differences (Gershman, Reference Gershman2016).
3. Computational phenotyping: Personality, development, and psychiatric illness
Next, we will illustrate the value of computational phenotypes from several different perspectives. Given the scientific breadth of this review, for each perspective we will focus on specific case studies rather than providing exhaustive coverage of the literature. We will show how this approach can reveal new insights into individual differences in personality and examine how the computational phenotype changes over the course of development and aging. Finally, we will show how differences between healthy and disordered brain function can be mapped onto systematic changes in the computational phenotype.
4. The computational structure of personality
Traditional approaches to the study of personality, such as factor analysis, have been particularly effective in reducing the high-dimensional space of personality to latent constructs such as the Big Five (openness, conscientiousness, extraversion, agreeableness, neuroticism) (Tupes & Christal, Reference Tupes and Christal1992). These personality dimensions are largely stable across the lifetime and predict a number of individual differences (e.g., religiosity, dating frequency, and alcohol use among many others; Paunonen, Reference Paunonen2003). Despite this predictive validity, traditional personality constructs are largely agnostic as to the cognitive mechanisms by which differences in personality lead to differences in behavior.
For example, conscientiousness is associated with a wide range of adaptive behaviors and outcomes such as greater health and longevity (Bogg & Roberts, Reference Bogg and Roberts2013), and increased reliability and goal-directed behavior (Jackson et al., Reference Jackson, Wood, Bogg, Walton, Harms and Roberts2010). Indeed, how people differ in conscientiousness has been well documented, but it is still relatively unclear as to why people differ in conscientiousness (Abram & DeYoung, Reference Abram and DeYoung2017). In part, this is due to the fact that conscientiousness is comprised of a heterogenous composition of underlying processes. Disentangling these processes is a task for which computational phenotyping can be uniquely useful. The specific processes can be operationalized, such as why people higher in conscientious seek more goal-directed behavior. Identifying the computational phenotypes associated with these personality constructs offers the opportunity to link the predictive validity of the construct to its underlying mechanisms. In this section, we examine a set of examples that illustrate what computational models have to offer as a complement to these traditional constructs.
4.1. Personality: Goals and habits
Computational modeling has had an enormous impact on our understanding of decision-making. Here we focus on one particular aspect of this research area: The distinction between two forms of action selection, one based on goals and one based on habits. Initial studies theorized that goal-directed behavior (as studied in rats) was subserved by a “cognitive map” of the environment that supported flexible pursuit of goals (Tolman, Reference Tolman1948). Tolman hypothesized the use of latent learning and planning processes that went far beyond the stimulus–response habits posited by the behaviorists (Thorndike, Reference Thorndike1911). Despite the intuitive link to our everyday experience, researchers had only glimpses into the underlying processes. It took more than 50 years to integrate advances in engineering (Bellman, Reference Bellman1957), computer science (Sutton & Barto, Reference Sutton and Barto1998), neuroscience (Schultz, Dayan, & Montague, Reference Schultz, Dayan and Montague1997), and psychology (Daw, Gershman, Seymour, Dayan, & Dolan, Reference Daw, Gershman, Seymour, Dayan and Dolan2011; Dickinson, Reference Dickinson1985) into a synthetic theoretical framework for understanding how the human brain carries out goal-directed and habitual action. This modern computational synthesis conceptualizes goal-directed action arises from using an internal model (“model-based” control) of potential actions and their consequences in the environment, whereas habits arise from a trial-and-error learning system that does not exploit an internal model (“model-free” control).
By constructing explicit computational models of these two systems and their interplay, researchers have been able to capture individual differences in the degree of reliance on model-based vs. model-free control using a single parameter estimated from a canonical task (Daw et al., Reference Daw, Gershman, Seymour, Dayan and Dolan2011). This line of work has led to the study of how stress (Otto, Raio, Chiang, Phelps, & Daw, Reference Otto, Raio, Chiang, Phelps and Daw2013), age (Decker, Otto, Daw, & Hartley, Reference Decker, Otto, Daw and Hartley2016; Eppinger, Walter, Heekeren, & Li, Reference Eppinger, Walter, Heekeren and Li2013), and psychiatric illness (Gillan, Kosinski, Whelan, Phelps, & Daw, Reference Gillan, Kosinski, Whelan, Phelps and Daw2016; Sebold et al., 2014, Reference Sebold, Nebe, Garbusow, Guggenmos, Schad, Beck and … Heinz2017; Voon et al., Reference Voon, Derbyshire, Rück, Irvine, Worbe, Enander and … Bullmore2015) affect, or fail to affect (Nebe et al., Reference Nebe, Kroemer, Schad, Bernhardt, Sebold, Müller and … Smolka2018), the delicate balance between model-based and model-free control.
Individual variation in model-based control was recently captured by Otto et al. (Reference Otto, Raio, Chiang, Phelps and Daw2013) when they examined how model-based control is affected by individual differences in stress response. Participants submerged their arms in ice-cold water (a commonly used acute stress manipulation) and their cortisol levels were measured. Subsequently, they completed a two-step sequential decision task (Daw et al., Reference Daw, Gershman, Seymour, Dayan and Dolan2011), that we will refer to as the “two-step task.” Computational parameters fit to this task characterize several aspects of learning and decision-making, including the relative contribution of model-free and model-based control for each individual. Otto et al. found that participants with higher cortisol levels (greater stress response) exhibited less model-based control. In turn, this effect was modulated by working memory capacity such that greater working memory attenuated stress-induced reductions in model-based control. The key insight from this study is that the precise characterization of how stress and working memory affect individual variation in the computational phenotype (i.e., model-based control), thereby shifting the balance between goal-directed and habitual action. Future work could seek to understand how model-based control does, or does not, covary with conscientiousness and stress.
4.2. Personality: Social cognition
Personality measures such as extraversion and agreeableness are composed of questions about social interaction, including how we relate to ourselves and others. Computational phenotyping increases our understanding of social interaction by specifying the mechanisms underlying social cognition. For example, computational models of social cognition include parameters representing how quickly we change our view of others, beliefs about the motivations driving their behavior, and a host of other features of social interaction. A recent study (Diaconescu et al., Reference Diaconescu, Mathys, Weber, Daunizeau, Kasper, Lomakina and … Stephan2014) provides a nice example of computational phenotyping of social cognition in an economic decision-making game.
Diaconescu et al. (Reference Diaconescu, Mathys, Weber, Daunizeau, Kasper, Lomakina and … Stephan2014) used a paradigm where participants were asked to predict the outcome of a lottery. Each participant was paired with an advisor who provided information to aid in the participant’s lottery prediction. Importantly, the advisor was incentivized to provide misleading or helpful information, and this varied over time. The critical question for the participant was whether or not to trust the advice of the advisor. Two key parameters from the computational model were (1) a parameter representing the perceived volatility of the advisor’s intentions (i.e., how quickly the advice shifted between misleading or helpful), and (2) a parameter representing the perceived advice correctness. When the perceived volatility of the advisor’s intentions was high, players weighted their advice lower. Strikingly, players with higher self-reported perspective-taking proficiency had more stable representations of their advisor. This was indicated by slower changes in their belief about advice correctness. Thus, a personality trait (perspective-taking proficiency) directly corresponded to a parameter representing the participant’s estimate of another person’s trustworthiness. In this example, we have a computational phenotype with parameters for each individual describing how and why they ultimately decide to take the advice of another person. This computational approach was subsequently extended to the relationship between social cognition and a personality questionnaire measuring autism traits in a healthy population (Sevgi, Diaconescu, Tittgemeyer, & Schilbach, Reference Sevgi, Diaconescu, Tittgemeyer and Schilbach2016).
Autism is characterized by impairment in social communication and social interaction leading to great difficulty maintaining interpersonal relationships. Moreover, autism traits are continuously distributed in the general population (Robinson et al., Reference Robinson, Koenen, McCormick, Munir, Hallett, Happé and … Ronald2011).To investigate the processes that underlie these traits, Sevgi et al. (Reference Sevgi, Diaconescu, Tittgemeyer and Schilbach2016) employed a computational approach in a social decision-making task while measuring a score on the autism spectrum in a healthy population. They used a game in which using social cue information (indicated by the directional “gaze” of a human avatar) resulted in higher task performance. A computational parameter that represented the weighting of this information in subsequent decisions was correlated with autism score such that higher autism traits were associated with less reliance on social information during decision-making. Moreover, the study showed that individuals high on the autism spectrum showed particular difficulty integrating social advice under more volatile task conditions. Thus, a computational phenotype characterizing a social decision-making process provides a specific mechanism whereby elevations in autism traits are associated with a decreased ability to effectively learn from social information. Next, we turn to the use of computational phenotyping to identify mechanisms underlying individual differences in how people process threatening situations. This is particularly relevant to the construct neuroticism, whereby people higher in this trait experience greater levels of anxiety and worry.
4.3. Personality: The spontaneous recovery of fear
A core feature of adaptive behavior is the ability to update our beliefs about threatening situations once they no longer pose a threat. However, some individuals continue to feel fear in apparently safe situations, whereas others seem to learn that a situation no longer poses a threat. In accordance with this idea, a recent paper by Gershman and Hartley (Reference Gershman and Hartley2015) demonstrated how a computational phenotype helps explain why some people seem to have persistent fears, while others do not.
Gershman and Hartley measured skin conductance response during Pavlovian conditioning. The experiment consisted of three phases: (1) acquisition of the initial fear association by pairing cues with shock, (2) extinction of the fear association by presenting the cues repeatedly without shock, and (3) testing of fear response one day later. Spontaneous recovery of fear was measured as the difference between skin conductance response on the first block of test relative to the last block of extinction (i.e., how much did an individual’s fear response to the cue re-emerge, despite having extinguished this fear response on the previous day). Gershman and Hartley fit a computational model of learning to the acquisition and extinction skin conductance data. This model posited that participants make inferences about the “latent causes” underlying the cue-shock pairs. When the contingencies change sufficiently, the participants should infer that a new latent cause is active. A single parameter controls the sensitivity of latent cause inferences to contingency change. For small values of this parameter, the acquisition and extinction phases are clustered together into a single cause, producing unlearning of the acquired fear and hence no possibility of recovery at test. For large values of this parameter, the acquisition and extinction phases are separated into separate latent causes, thereby protecting the acquired fear from extinction, thus making spontaneous recovery possible.
Using the computational model, Gershman and Hartley clustered participants into two groups on the basis of the sensitivity parameter. As predicted, participants with small sensitivity values apparently unlearned the fear association, showing no evidence of spontaneous recovery. In contrast, participants with larger sensitivity values inferred separate acquisition and extinction latent causes, and accordingly showed spontaneous recovery. Thus, this study demonstrated how a computational phenotyping approach can explain why some individuals may continue to feel threatened in environments that no longer pose a threat.
4.4. Personality: The mechanisms of fluid intelligence
As noted above, intelligence is comprised of a complex set of underlying processes. A recent study by Schlagenhauf et al. (Reference Schlagenhauf, Rapp, Huys, Beck, Wüstenberg, Deserno and … Heinz2013) validated complex attention and reasoning as a subprocess of general intelligence using computational modeling. Participants completed a reversal learning task during functional magnetic resonance imaging (fMRI) and this was followed by a positron emission tomography (PET) scan used to measure dopamine synthesis capacity. It was found that reward prediction errors in the ventral striatum positively correlated with IQ, and this was specific to the complex attention and reasoning portion of the general intelligence assessment. Moreover, the ventral striatal reward prediction error signal was inversely correlated with dopamine synthesis. Together these findings suggest that a component of the computational phenotype (reward prediction errors) are a promising target for understanding individual differences in fluid intelligence.
5. The computational phenotype across development and aging
Development across the lifespan is associated with profound behavioral and psychological changes. For example, adolescence is characterized by hypersensitivity to social context, vulnerability to emotional arousal, increased impulsivity, and a propensity toward drug and alcohol abuse. Adolescence is also accompanied by neurodevelopmental changes in brain structure (Giedd et al., Reference Giedd, Blumenthal, Jeffries, Castellanos, Liu, Zijdenbos and … Rapoport1999) and function (Casey, Getz, & Galvan, Reference Casey, Getz and Galvan2008). The challenge is linking brain and behavior to specific cognitive processes that are tuned differently across developmental stages. Understanding the normative trajectory of these processes can help us to identify atypical developmental trajectories. Moreover, individual differences in these processes arise through a developmental process. Computational phenotypes allow us to better understand and disentangle the factors that influence individual trajectories.
5.1. Development: Model-based control across the lifespan
One particularly important phenotype is the expression of model-based control—the critical ability to evaluate the consequences of our actions. The capacity to prospectively plan actions according to their consequences is starkly contrasted in childhood and adulthood. Requiring significant cognitive resources, model-based control relies on prefrontal structures (Doll, Duncan, Simon, Shohamy, & Daw, Reference Doll, Duncan, Simon, Shohamy and Daw2015; Smittenaar, FitzGerald, Romei, Wright, & Dolan, Reference Smittenaar, FitzGerald, Romei, Wright and Dolan2013) known to change dramatically across development (Gogtay et al., Reference Gogtay, Giedd, Lusk, Hayashi, Greenstein, Vaituzis and … Thompson2004). Indeed, there is a shift across development from reliance on impulses to deliberative goal-directed planning (Hartley & Somerville, Reference Hartley and Somerville2015). This behavioral shift mirrors a neurodevelopmental trajectory whereby prefrontal structures engaged during goal-directed evaluation exhibit a gradual process of integration with subcortical brain structures that can support more automatic behavior (Gogtay et al., Reference Gogtay, Giedd, Lusk, Hayashi, Greenstein, Vaituzis and … Thompson2004). The computational phenotype of model-based control is one way to link changes in brain function and structure to behavioral changes in goal-directed action across development.
Building upon this idea, Decker et al. (Reference Decker, Otto, Daw and Hartley2016) administered the same two-step task discussed above, using a computational model to estimate the relative balance of model-free and model-based control in a developmental sample. They found a near total absence of model-based control in children ages 8–12. Model-based control emerged during adolescence (ages 13–17) and further strengthened during adulthood (ages 18–25). Extending this work, a subsequent study found that age-related increases in model-based control were mediated by increases in fluid reasoning—the ability to integrate distant concepts to solve problems (Potter, Bryce, & Hartley, Reference Potter, Bryce and Hartley2017). The developmental relevance of these findings is bolstered by evidence that model-based control has been linked to variation in dopamine function (Deserno et al., Reference Deserno, Huys, Boehme, Buchert, Heinze, Grace and … Schlagenhauf2015; Doll, Bath, Daw, & Frank, Reference Doll, Bath, Daw and Frank2016; Sharp, Foerde, Daw, & Shohamy, Reference Sharp, Foerde, Daw and Shohamy2015; Wunderlich, Smittenaar, & Dolan, Reference Wunderlich, Smittenaar and Dolan2012) and prefrontal cortex function (Daw et al., Reference Daw, Gershman, Seymour, Dayan and Dolan2011; Doll et al., Reference Doll, Duncan, Simon, Shohamy and Daw2015; Smittenaar et al., Reference Smittenaar, FitzGerald, Romei, Wright and Dolan2013), both of which are known to change across development (Hartley & Somerville, Reference Hartley and Somerville2015). Interestingly, while Decker et al. found an increase in model-based control from childhood into adulthood, a recent study found that model-based control subsequently decreases in older adults.
Eppinger et al. (Reference Eppinger, Walter, Heekeren and Li2013) examined the relationship between model-based control, age, and working memory in a sample of younger adults (mean age 24) and older adults (mean age 69). Older adults showed less model-based control than younger adults and this effect was further pronounced by shifting the reward probabilities. They demonstrated that older adults have specific difficulties changing their “cognitive map” of the environment in response to unexpected rewards, whereas younger adults changed their decision strategy and explored the new environment. Like Otto et al. (Reference Otto, Raio, Chiang, Phelps and Daw2013), they found that greater working memory was associated with greater model-based control, but only in younger adults. Moreover, following unexpected rewards younger adults engaged in more strategic exploration of the task structure and older adults tended to perseverate on the previously exploited option. The authors suggest this may be due to a deficit updating expected reward values in older adults. By using a computational phenotype and relating it to other age-dependent processes, the authors demonstrate how phenotypes can be used to examine age-related changes in goal-directed and habitual behavior.
Together, these studies demonstrate how a computational phenotype can be used to trace an arc of cognitive changes across development and through senescence.
5.2. Development: Counterfactual deficits in adolescence
A core feature of adolescence is difficulty simulating the hypothetical outcomes of decisions. In cognitive science, the consideration of these alternative outcomes is referred to as counterfactual thinking. A recent demonstration of counterfactual deficits in adolescence was accomplished via Bayesian model selection. Palminteri, Kilford, Coricelli, and Blakemore (Reference Palminteri, Kilford, Coricelli and Blakemore2016) administered an instrumental learning task and applied three separate computational models. While adolescents were best characterized by a simple reinforcement learning model based upon the Rescorla–Wagner learning rule detailed above, adults were best fit by two more sophisticated models. The first was a counterfactual learning model in which adults incorporated task feedback about unchosen options, and the second was a value contextualization model that allowed adults to learn equally from positive and negative rewards. In contrast to symmetrical reward and punishment learning in adults, adolescents were less likely to learn from punishment. Therefore, this study identifies three separate computational phenotypes that account for developmental changes in learning and specific process components (e.g., counterfactual learning and punishment sensitivity) that underlie these differences.
6. Debugging the brain
Computational modeling provides the advantages in overcoming problems of heterogeneity, comorbidity, and non-specificity in psychiatric nosology (Petzschner et al., Reference Petzschner, Weber, Gard and Stephan2017; Stephan et al., Reference Stephan, Iglesias, Heinzle and Diaconescu2015; Wiecki, Poland, & Frank, Reference Wiecki, Poland and Frank2015), providing mechanistic links (i.e., computational phenotypes) between translational neuroscience and applied practice (Friston et al., Reference Friston, Stephan, Montague and Dolan2014; Huys, Maia, & Frank, Reference Huys, Maia and Frank2016; Maia & Frank, Reference Maia and Frank2017; Paulus, Huys, & Maia, Reference Paulus, Huys and Maia2016), and even producing single-patient clinical predictions (Stephan et al., Reference Stephan, Schlagenhauf, Huys, Raman, Aponte, Brodersen and … Heinz2017). To expand, pathological behavior can be linked to brain disruptions through computational models of distortions in the latent cognitive or biological process. Moreover, specific parameters represent individual components of the process, providing targets for intervention. Computational models also hold promise for linking various types of measurement (e.g., behavior, self-report, brain function) at several levels of analysis. In this section we turn back to model-based control, and examine how this phenotype shows specific relationships with different aspects of psychopathology. We then review work that combines phenotyping with machine learning to aid in the study of schizophrenia, and follow that with an illustration of using Bayesian model comparison to identify two separate neurobiological mechanisms for the phenomenon of synesthesia.
6.1. Psychopathology: Model-based control
A core feature of psychiatric illness is over-reliance on habits at the cost of goal-directed action (Everitt & Robbins, Reference Everitt and Robbins2005). For example, individuals will often continue a pattern of compulsive drug use despite a stated desire to abstain. The goal of abstinence requires actions that are commensurate with accurate prospective simulations of the severe consequences of relapse. Due to this phenomenological similarity with the prospective simulation aspect of model-based control (Doll et al., Reference Doll, Duncan, Simon, Shohamy and Daw2015), several studies have investigated the balance between model-free and model-based control in psychiatric illness. Model-based impairment has been found in schizophrenia (Culbreth, Westbrook, Daw, Botvinick, & Barch, Reference Culbreth, Westbrook, Daw, Botvinick and Barch2016), obsessive-compulsive disorder, methamphetamine dependence, and binge eating disorder (Voon et al., Reference Voon, Derbyshire, Rück, Irvine, Worbe, Enander and … Bullmore2015).
However, the association between model-based control and problematic alcohol use has been somewhat equivocal and concurrently illuminating. Across the subsequent studies the computational phenotype (balance between model-based and model-free behavior) remains formally consistent, yet the phenotype relates to categorical and trait characteristics of problematic alcohol use differentially. This suggests traditional category-based descriptions of heterogeneous phenomena such as addiction may be further specified with computational phenotypes.
In computational investigations of alcohol use problems some studies have found reduced model-based control in detoxified patients (Sebold et al., Reference Sebold, Deserno, Nebe, Schad, Garbusow, Hägele and … Huys2014) whereas others have not (Sebold et al., Reference Sebold, Nebe, Garbusow, Guggenmos, Schad, Beck and … Heinz2017; Voon et al., Reference Voon, Derbyshire, Rück, Irvine, Worbe, Enander and … Bullmore2015). Despite no reductions of model-based control, Sebold et al. (Reference Sebold, Nebe, Garbusow, Guggenmos, Schad, Beck and … Heinz2017) found that reduced medial-prefrontal signatures during model-based decision-making predicted relapse in detoxified alcohol-dependent patients. In addition, positive views about the reinforcing effects of alcohol were associated with reduced model-based control in patients who subsequently relapsed (Sebold et al., Reference Sebold, Nebe, Garbusow, Guggenmos, Schad, Beck and … Heinz2017). Yet, other research has found that model-based control is not associated with a range of problematic alcohol use, including binge drinking, onset age for alcohol use, and alcohol consumption (Nebe et al., Reference Nebe, Kroemer, Schad, Bernhardt, Sebold, Müller and … Smolka2018). Together these studies suggest that model-based impairments may have a more nuanced relationship with alcohol use that traditional methods are not well designed to capture.
Indeed, contemporary views of addiction (Everitt & Robbins, Reference Everitt and Robbins2005; Kurth-Nelson & Redish, Reference Kurth-Nelson and Redish2012) suggest that individuals will engage in complex reasoning and goal-directed activity to satisfy a craving. This shifts the view of addiction as simply habitual behavior to a process-based account of drug taking and seeking. Meanwhile, the traditional notion of “addiction as habit” relies on a phenomenological observation that compulsive drug seeking is habitual. This leaves out mechanistic accounts of what drives addictive behavior. Fortunately, a large volume of preclinical and human studies suggest that addiction is comprised of multifactorial disruptions (e.g., cognitive, pharmacological, neural) in the learning process (see this book chapter for theoretical integration of this research; Huys, Beck, Dayan, & Heinz, Reference Huys, Beck, Dayan and Heinz2014). Challenges in specifying the mechanisms underlying pathological phenomena can also be partially remedied via dimensional approaches to psychiatric illness.
A large online study by Gillan et al. (Reference Gillan, Kosinski, Whelan, Phelps and Daw2016) used a transdiagnostic approach to studying model-based control in psychopathology. They applied factor analysis to symptom dimensions comprising mood problems, habitual behaviors, and social functioning. They found that model-based control was reduced in a factor termed “compulsive behavior and intrusive thought” but was unaffected by anxious depression and slightly improved by social withdrawal. Thus, model-based impairments may be specific to symptoms and traits that cluster together.
While relatively few studies have examined model-based control in psychopathology, computational phenotypes provide a common mathematical foundation for understanding goal-directed deficits. The aforementioned categorical studies ostensibly examined the same process, however, they may suffer from nosological problems associated with diagnostic classification and description (Cuthbert & Insel, Reference Cuthbert and Insel2013; Insel et al., Reference Insel, Cuthbert, Garvey, Heinssen, Pine, Quinn and … Wang2010). Gillan et al. illustrate how we can more accurately conceptualize psychopathological phenomena by shared deficits in a certain process represented by a computational phenotype. Clinicians and researchers alike have observed the transdiagnostic nature of psychopathology, but we have been restricted by lack of formalization of the process and dysfunction within the process. In this regard, computational phenotypes may help shift diagnosis toward a process-oriented understanding of mental illness whereby deficits in the cognitive process are linked to brain disruptions and behavioral impairments.
6.2. Psychopathology: Generative embedding in schizophrenia
We have largely focused on mechanistic models that describe how the behavioral or neural data were generated (so-called generative models). These generative models can also be combined with machine learning techniques (e.g., Brodersen et al., Reference Brodersen, Schofield, Leff, Ong, Lomakina, Buhmann and Stephan2011). We illustrate this idea with a study that uses machine learning to define psychiatric subgroups in schizophrenia (Brodersen et al., Reference Brodersen, Deserno, Schlagenhauf, Lin, Penny, Buhmann and Stephan2014). In contrast to generative models, machine learning approaches are agnostic to mechanism and use the data only to classify subjects as patient or non-patient. However, there is a fundamental problem with this approach. It requires the use of Diagnostic and Statistical Manual of Mental Disorders or International Classification of Diseases diagnostic labels. Specifically, the researcher labels training data as patient or control and this is the input for the machine learning algorithm. Using these labels, the machine learning algorithm trains itself to classify the data into patient or control. This approach reifies pre-existing theories about categorical diagnoses. Alternatively, Brodersen et al. embed a generative model (rather than labels) of the process giving rise to neural data as the input into a machine learning classifier.
Brodersen et al. administered an n-back working memory task to a group of patients with a diagnosis of schizophrenia and healthy controls while they were being scanned with fMRI. They created a generative causal model of the underlying neuronal dynamics (dynamic causal model [DCM]) that gave rise to the fMRI data. The DCM described the network dynamics between the visual cortex, parietal cortex, and dorsolateral prefrontal cortex. Subject-level parameters were derived describing the specific neuronal dynamics for each person and these were subsequently entered into a machine learning algorithm that classified subjects into the schizophrenia or control group. Without any clinical information, the classifier was able to sort the subjects with 78% accuracy. Moreover, within the patient group, the classifier identified three different groups of neural network dynamics. Again, without access to any diagnostic information, the three classifier groups corresponded to three clinical subgroups as shown by significant differences in negative symptoms. This study is a powerful demonstration of linking a neurocognitive model of working memory to ecologically valid clinical diagnoses via completely data-driven approaches.
6.3. Psychopathology: Grapheme-color synthesia
Grapheme-color synthesthesia is a perceptual disturbance whereby letters and/or numerals are associated with an experience of color. For example, a person may see a black “4” and perceive the color yellow. Interestingly, there are two broad phenomena that characterize the experience of grapheme-color synthesthetes. Projector synthesthetes perceive the color externally such that the number (e.g., 4) appears in the color yellow. Alternatively, associator synthesthetes experience a strong internal association of the color. In a recent study, van Leeuwen, den Ouden, and Hagoort (Reference van Leeuwen, den Ouden and Hagoort2011) demonstrate the advantage of using computational phenotypes to identify separable neuronal mechanisms that account for these two types of grapheme-color synthesthesia.
van Leeuwen et al. administered a synesthesia-inducing paradigm to a group of known synesthetes during fMRI. They used a DCM to test two competing hypotheses about visual processing abnormalities that could account for projectors vs. associators. They found that neural activity in projectors more closely matched (via Bayesian model comparison) a bottom-up processing stream within the fusiform gyrus, whereas associators’ neural activity matched a top-down processing stream in the parietal lobe. Therefore, Bayesian model comparison was able to validate that projectors and associators have dissociable computational phenotypes.
7. Challenges ahead
Computational modeling is a field that holds promise for grounding individual differences in underlying cognitive and neural mechanisms. However, there are several challenges facing the practical use of computational phenotypes.
One challenge concerns specifying the mechanisms underlying the computational phenotype. For example, model-based control is based upon a number of interrelated cognitive mechanisms including working memory (see Voon, Reiter, Sebold, & Groman, Reference Voon, Reiter, Sebold and Groman2017, for a recent review). Therefore, impairments in working memory will correlate with impairments in model-based control (Culbreth et al., Reference Culbreth, Westbrook, Daw, Botvinick and Barch2016) and it will be difficult to tease competing mechanisms apart. One possible solution is administering multiple tasks within the same subject and developing models that capture the overlapping sets of mechanisms across these tasks. These models would derive, for example, parameters that concurrently consider working memory demands and sequential decision making to dissociate the relative contributions of various underlying mechanisms.
A second, related challenge is construct validity. While personality psychology has exerted considerable effort in establishing the validity and robustness of its constructs, computational phenotyping has not yet undertaken such a systematic effort. This is particularly important for several reasons. First, it is well known that parameters in computational models are not always identifiable (Gershman, Reference Gershman2016). This means that parameter values can trade-off against one another to produce similar predictions, thereby making it much more difficult to draw conclusions about the mechanism underlying patterns of behavior. This can be partially remedied by parameterizing models in such a way that they do not suffer from identifiability issues, or using data-driven constraints on parameter estimates (Gershman, Reference Gershman2016).
Reliable parameter estimates also require tasks with many trials. This is particularly problematic for patients studies where heterogeneity in the underlying mechanisms and deficits can produce high variance data. One possible solution is to use hierarchical Bayesian modeling to increase sensitivity to individual differences (Nilsson, Rieskamp, & Wagenmakers, Reference Nilsson, Rieskamp and Wagenmakers2011; Wiecki, Poland, & Frank, Reference Wiecki, Poland and Frank2015; Wiecki, Sofer, & Frank, Reference Wiecki, Sofer and Frank2013).
Adding to this complexity, it is also unclear how, why, or if, the processes represented by the parameters change over time. This is also important for developmental research, as cross-sectional age differences in a given parameter are assumed to mean that the parameter values within-individual exhibit similar age-related changes over developmental time. However, we do not typically know the test–retest reliability of computational phenotypes because models are rarely fit to multiple data sets from the same subject. This means we have no handle on the contribution of state dynamics to trait measures. This issue can be easily remedied simply by collecting more data; even better, we can measure (or experimentally control) the dynamics of other variables, and thus begin to model state-dependent aspects of computational phenotypes (see Kool, Gershman, & Cushman, Reference Kool, Gershman and Cushman2017, for an example). Test–retest reliability will be especially important for establishing the utility of phenotypes in predicting clinical outcomes and treatment development (Stephan et al., Reference Stephan, Schlagenhauf, Huys, Raman, Aponte, Brodersen and … Heinz2017) as we move from translational neuroscience to clinical application (Gold et al., Reference Gold, Barch, Carter, Dakin, Luck, MacDonald and … Strauss2012; Paulus, Huys, & Maia, Reference Paulus, Huys and Maia2016).
Another challenge concerns the integration of behavioral and neural data. Computational models are typically fit to behavioral data and then the fitted parameters and latent variables are used in the analysis of neural data. However, recent work has shown how simultaneously modeling neural data (e.g., electroencephalography or fMRI; Cassey, Gaut, Steyvers, & Brown, Reference Cassey, Gaut, Steyvers and Brown2016; Turner et al., Reference Turner, Forstmann, Wagenmakers, Brown, Sederberg and Steyvers2013; Turner, Rodriguez, Norcia, McClure, & Steyvers, Reference Turner, Rodriguez, Norcia, McClure and Steyvers2016; Turner, Van Maanen, & Forstmann, Reference Turner, van Maanen and Forstmann2015; Turner, Wang, & Merkle, Reference Turner, Wang and Merkle2017), or self-report measures (Vandekerckhove, Reference Vandekerckhove2014) with behavioral data can lead to greater predictive accuracy and integration of latent cognitive abilities with personality constructs. Other approaches, such as behavioral dynamic causal modeling (bDCM) translate experimental stimuli into neural connections, which in turn, gives rise to behavioral outcomes (Rigoux & Daunizeau, Reference Rigoux and Daunizeau2015). Effectively, the computational phenotypes represented by bDCMs are neural networks that operate as neurocomputational mechanisms between environmental inputs and behavioral outputs. Neural models of specific brain regions (e.g., the basal ganglia; Frank, Reference Frank2005) can also link cellular and systems neuroscience to inform decisions about experimental acquisition of behavioral and brain data. This approach provides biologically plausible mechanisms that account for the neural computations that give rise to behavior (Forstmann & Wagenmakers, Reference Forstmann and Wagenmakers2015). However, application of these models by non-experts poses significant challenges because of the mathematical and programmatic skills required.
Accessible software development is critical for adoption of models by non-computational psychologists and neuroscientists. To date, there are relatively limited software tools available (though, see Wiecki, Sofer, & Frank, Reference Wiecki, Sofer and Frank2013), and those that exist can be difficult for non-experts to use. This problem will be gradually remedied as funding bodies and journals place more stringent requirements on software accessibility. In fact, efforts such as the annual computational psychiatry course already provide open source software for reinforcement learning models, hierarchical Gaussian filters, and drift diffusion models.
Computational models also require mathematical skills that are not easily applied, or understood. Indeed, the application of these models to questions in personality, development, and psychiatry has typically required the integration of skills from multiple researchers with different backgrounds (e.g., personality psychologists and computational neuroscientists). Conferences (e.g., the annual Computational Psychiatry course in London), graduate courses, and potentially graduate degree tracks, could aid in filling these technical and conceptual gaps. In addition, simple steps such as attempts to bridge the language of complementary fields will also be important. For example, the article by Brodersen et al. (Reference Brodersen, Deserno, Schlagenhauf, Lin, Penny, Buhmann and Stephan2014) explicitly describes generative embedding methods in a tutorial aimed at researchers with a clinical background.
Finally, we need more systematic evaluations of the assumptions linking computational phenotypes to behavioral and neural data. Often, researchers run a correlation or regression, looking for simple associations without grappling with the possibility that computational phenotypes could be related to observed data in more complex ways. Clinical psychometricians have extensively studied a range of probabilistic models for understanding how different symptoms and traits are related, ranging from factor analysis to undirected networks (Borsboom, Mellenbergh, & van Heerden, Reference Borsboom, Mellenbergh and van Heerden2004; Borsboom et al., Reference Borsboom, Rhemtulla, Cramer, van der Maas, Scheffer and Dolan2016). These same kinds of techniques could be applied to analyzing computational phenotypes. However, the importance of these phenotypes depends upon their predictive validity. This is where longitudinal translational research efforts (Paulus, Huys, & Maia, Reference Paulus, Huys and Maia2016), such as those currently underway in the study of schizophrenia (Gold, Reference Gold2012; Gold et al., Reference Gold, Barch, Carter, Dakin, Luck, MacDonald and … Strauss2012), can validate the ecological and clinical utility of computational models.
Despite these challenges, we are optimistic that computational phenotypes have already begun to bear fruit for personality neuroscience and related fields. We envision a future in which they will be applied to precision medicine approaches (Cuthbert & Insel, Reference Cuthbert and Insel2013; Fernandes et al., Reference Fernandes, Williams, Steiner, Leboyer, Carvalho and Berk2017; Friston, Redish, & Gordon, Reference Friston, Redish and Gordon2017), where particular latent processes can be targeted for intervention, and optimized for individual people. Similar interventions could be conceived for the purposes of individualized education and the design of incentive mechanisms for improving financial decision making.
Acknowledgments
This research was supported by NSF CAREER award 1654393 (CAH) and the Harvard Brain Initiative.

 Open access