


Introduction
Over the 20th century, psychiatry increasingly shifted from hospital-based care largely focused on containment towards community-based care. The introduction of psychotropic medication, modern methodological approaches to examining interventions and the rise of patient-focused care epitomised by the recovery model (Sheedy and Whitter, Reference Sheedy and Whitter2009) have placed the patient's perspective in the centre of psychiatric management. Despite this, the restraint of patients in formal mental health care remains commonplace, is sometimes accepted as an unavoidable part of psychiatric practice and is routinely used in hospital settings (Curie, Reference Curie2005). This includes the use of mechanical devices, people-to-people contact, seclusion (solitary confinement) or chemical restraint. Of these, mechanical restraint is easily defined and is particularly egregious since it can lead to death (Mohr and Mohr, Reference Mohr and Mohr2000; O'Halloran and Frank, Reference O'Halloran and Frank2000), yet is rarely studied. It is this type of restraint, using any sort of device, which is the focus of this paper.
Empirical problems with restraint
Within the psychiatric community, there is increasing concern regarding mechanical restraint, and coercion in general (Newton-Howes, Reference Newton-Howes2010), including the lack of evidence of clinical effectiveness (Sailas and Fenton, Reference Sailas and Fenton2000). For instance, there is no clear empirical evidence that mechanical restraint reduces injury or assault, the commonest justification for use. Indeed the opposite may be true (Goulet et al., Reference Goulet, Larue and Dumais2017), with indications that improvements in safety and management are associated with efforts to reduce inpatient restraint. Of further concern is evidence of significant harm (Kersting et al., Reference Kersting, Hirsch and Steinert2019). From a patient perspective, it is difficult to see how restraint could be viewed as therapeutic (Frueh et al., Reference Frueh, Knapp, Cusack, Grubaugh, Sauvageot, Cousins, Yim, Robins, Monnier and Hiers2005; Kontio et al., Reference Kontio, Joffe, Putkonen, Kuosmanen, Hane, Holi and Välimäki2012). Indeed, qualitative research suggests that mechanical restraint is a traumatic experience that interferes with the therapeutic process and is viewed as both retraumatising and unethical (Strout, Reference Strout2010).
Ethical problems with restraint
The ethical problems with restraint, and to a lesser extent seclusion (Hopton, Reference Hopton1995), stretch beyond the potential harms to patients to direct effects on both the patient and their family. Actions such as mechanical restraint are a significant infringement on human rights. This is recognised in the United Nations Convention on the Rights of Persons with Disabilities (CRPD), signed and ratified by Japan, New Zealand and Australia, with the United States signing but yet to ratify it. This convention demands signatories abolish coercion and implement supported decision making, codifying a rights based approach to mental health care (Newton-Howes and Gordon, Reference Newton-Howes and Gordon2020).
The legal, policy and psychiatric response
There have been local, national and international efforts to minimise or abolish restraint. Examples of such efforts include initiatives such as the Heidenheim Mental Health Service in Germany (Zinkler, Reference Zinkler2016), Trieste in Italy (Mezzina and Vidoni, Reference Mezzina and Vidoni1995), the York Retreat in England (Charland, Reference Charland2007) and the Soteria project initiated in the United States (Mosher and Bola, Reference Mosher, Bola, Scrimali and Grimaldi2002). These longstanding, successful non-coercive approaches suggest that practices such as mechanical restraint are not a necessary element of psychiatric care. Each project has regional variations, but the central principle is to respect individual human rights and abolish restraint. In addition, many countries (including the four examined here) also have specific policies working towards minimising or abolishing restraint (see Mental Health Atlas, 2017; Geneva: World Health Organization; 2018. Licence: CC BY-NC-SA 3.0 IGO). Internationally, efforts to abolish restraint have received significant impetus from the CRPD, in particular article 5 (the right to equality and non-discrimination), and article 12 (equal recognition before the law). The CRPD makes explicit the rights all people (including the disabled) should have (Szmukler, Reference Szmukler2015). In light of the CRPD, coercive interventions such as community treatment orders have been questioned, and the loss of liberty related to mechanical restraint is significantly greater than that. The legitimacy and legality of mechanical restraint are now being questioned in many jurisdictions (Nations, 2014). Even where particular legislation enables mechanical restraint on legal grounds, the infringement of personal autonomy and the need for close oversight are usually recognised (Health, 2016).
A question of numbers
With the numerous ethical, legal and scientific problems associated with mechanical restraint, it is surprising that its use continues, especially in light of case reports of significant harms. This issue is closely aligned with how often and how long restraint is used within psychiatric services (Ishida et al., Reference Ishida, Katagiri, Uchida, Takeuchi, Sakurai, Watanabe and Mimura2014). Although several recent reviews address coercion in general (Barbui et al., Reference Barbui, Purgato, Abdulmalik, Caldas-de-Almeida, Eaton, Gureje, Hanlon, Nosè, Ostuzzi and Saraceno2020; Sashidharan et al., Reference Sashidharan, Mezzina and Puras2019; Gooding et al., Reference Gooding, McSherry and Roper2020), there is limited literature on variations in the use of restraint (Box 1) apart from some work within individual countries. These studies have either used retrospective reports (Allen and Currier, Reference Allen and Currier2004; Miodownik et al., Reference Miodownik, Friger, Orev, Gansburg, Reis and Lerner2019) or examined the relationship of restraint with nursing practices (Fukasawa et al., Reference Fukasawa, Miyake, Suzuki, Fukuda and Yamanouchi2018) or patient characteristics (Noda et al., Reference Noda, Sugiyama, Sato, Ito, Sailas, Putkonen, Kontio and Joffe2013), rather than reporting prevalence. In addition to a literature search, we contacted colleagues in Taiwan, Singapore, Hong Kong, South Korea and Canada and could find no freely available country-wide statistics for restraints. A decade-old review of restraints found that there was little information and concluded there was a need for national databases (Steinert et al., Reference Steinert, Lepping, Bernhardsgrütter, Conca, Hatling, Janssen, Keski-Valkama, Mayoral and Whittington2010).
Box 1. Literature review We searched the PubMed and Medline databases from 1980. The search terms were kept broad to maximise the likelihood of finding relevant literature to incorporate into our understanding of the data. The general terms ‘psych’ and ‘restraint’ were entered and combined with the Boolean classifier AND. This search revealed 360 articles. All articles were reviewed by title and abstract by one author (MS) for possible literature examining restraint in an adult population, but we were unable to find useful articles from other Pacific Rim countries.
Such national databases have been established in the Pacific Rim countries of Australia, Japan and the United States, and in part in New Zealand. We interrogated these databases to examine three interrelated questions:
1. What was the prevalence of mechanical restraint in 2017 in these four countries and how do they compare to each other?
2. What was the variation within each country, and how do such variations compare between countries?
3. Were there meaningful changes over time in rates of restraint? Here we are limited to the time periods covered by the databases: in Japan from 2003 to 2019; United States from 2013 to 2018; Australia from 2015 to 2019 and New Zealand in 2008, 2016/2017 and 2018.
Methods
Data overview
New Zealand, Australia, Japan and the United States all have policies intended to minimise, or abolish, the use of restraint in psychiatric practice (see online Supplement 1 for greater details and references). All but New Zealand reported to the World Health Organisation in 2017 (Mental Health Atlas) that their mental health laws and policies were fully compliant with the UN human rights conventions (New Zealand graded itself 4/5 in this category, and the rest graded themselves 5/5). As a part of these policies, nation-wide rates of restraint are tabulated and published in the public domain. We were unable to find country-wide, publicly available data for any other countries on the Pacific Rim.
The major difficulty in a comparative analysis of restraint data between any jurisdictions lies in the methods used to collect and report data. To enable comparisons, we developed a metric with a similar denominator. We examined the number of restraint episodes per day per population as the comparator of choice. Other options included the number of unique people restrained, or the duration of restraint. The number of restraint episodes per day was chosen as the most clinically and societally relevant metric, because it acts as a proxy for permissiveness in attitudes towards restraint, and it gives an understanding of how many people are subjected to restraint. Duration statistics were difficult to find, except for a few studies involving a limited number of hospitals. In order to account for the population of each country, the number of restraint episodes per day was adjusted using the population of that jurisdiction's age group under consideration. To compare the countries to each other, we calculated ratios of the restraint use in each country to a standard comparator. We chose Australia as the comparator since it had a relatively stable number of restraints that was in the mid-range. We also provided a second measure of the number of restraint episodes per thousand bed-days in hospital. This is the standard way Australian data are reported.
To measure the variability within countries, we calculated the Gini coefficient at published regional levels of data aggregation. This coefficient, often used as a measure of inequality to compare income distributions in economies, is a score of between 0 and 1 that reports the variability of a dataset (Gini, Reference Gini1955). In our study, a value of 0 would mean that restraint rates are identical in all regions. A value of 1 would mean that one region contributed all the restraints and none of the other regions had any. Although the Gini coefficient is most often used in economics, it has been used to examine inequality in health outcomes, particularly in mortality (Peltzman, Reference Peltzman2009).
What is the intervention: mechanical restraint?
We defined mechanical restraint as any restraint of a patient in an adult mental health hospital or mental health ward of a general hospital, using a device of any sort, other than restraint by third persons delivering a patient to the ward (e.g. the police bringing someone into the ward in handcuffs and then releasing them). We further shortened the term ‘mechanical restraint’ to ‘restraint’, except when we needed to distinguish it from another form of restraint (such as chemical restraint or personal restraint, wherein practitioners restrain physically, but without devices) for properly interpreting statistics presented in different forms in different countries.
Restrained population
The population under consideration was adults admitted to acute hospital wards, either private or publicly funded, in New Zealand, Australia, Japan and the United States. Admission could be formal (under mental health legislation/involuntary) or informal (voluntary), and all recorded restraints were included. We attempted to exclude forensic, child, geriatric and learning disability wards because the patients in these settings differ considerably in terms of age (and therefore risks) and psychopathology. Community restraints were also excluded, as these actions are not generalisable to a hospital setting. Japan's psychiatric wards include patients of all ages, and patients older than 65 currently make up more than 50% of the restrained population. Therefore, for Japan we included two groups: all ages, and ages 20–65, to enable cross-jurisdictional comparisons. Our underlying data were censuses of most of the population under restraint, rather than from surveys of random samples. Consequently, the rates we derived can be considered reasonably precise for the countries and time periods to which they refer and therefore do not require confidence intervals. The quality of the data collection (completeness, reliability and how much of the hospital populations are elderly) were separate sources of uncertainty that we outlined in detail in the online Supplementary material.
Jurisdictions reported figures annually, although not always in periods aligned to the calendar year. For our main comparison, we examined figures in annual reports that ended during 2017. We also measured trends over time to investigate the effect of public policy interventions in reducing restraint.
As each nation provides data somewhat differently, and our purpose is to produce comparable statistics, the methods of extraction are laid out for each country in greater detail in online Supplement 1 and Tables S1–S7.
Results
Results: comparisons between countries
Table 1 compares the four countries' use of restraints in terms of the average numbers of restraint events per 1 million population per day in 2017, and online Supplementary Table S7 provides the details of the calculations. The use of restraints varied by a factor of about 3000, from 0.031 restraint events per day per 1 million people aged 15–64 in New Zealand to 99 restraint events per day per 1 million people in Japan (including older people, but not those in dementia units). The range in the mean number of restraints per 1000 bed-days is only a factor of 300, due to the high rate of hospitalisation (and therefore number of bed-days) in Japan. If we only included Japanese people between 20 and 65 years of age, the Japanese rate reduced to 62 restraint events per day per 1 million people. In 2017 the number of restraint events per head in New Zealand was about a fifth of the number in Australia, and there were about twice as many restraints per person in the United States as in Australia. In Japan, when all ages were considered, there were 600 times more restraint events per person than in Australia. Japan's rate dropped to 370 times higher than Australia's when we consider only Japanese patients between the ages of 20 and 65.
Average number of restraint events per day per 1 million people living in the United States, Australia, New Zealand or Japan in 2017, and the average number of restraints per 1000 bed-days
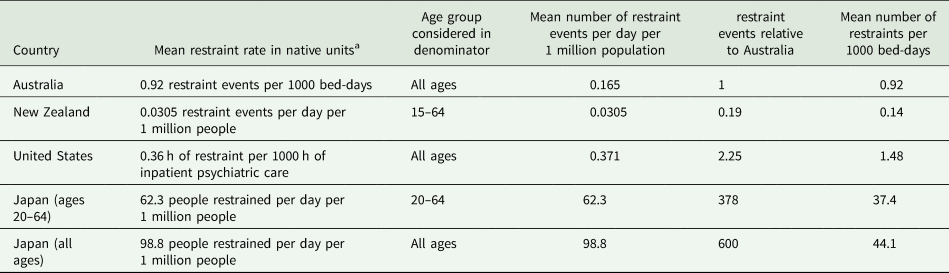
a The column ‘mean in native units’ presents the average figure reported by the country in question in their own standard reporting units. These average values are used for scaling the regional and temporal results in Figs 1 and 2 and the ‘Discussion’. Confidence intervals are not given because the numbers are based on census counts of numbers of people, events or hours rather than random samples from a population.
Results: comparison between different regions in the same countries
Figure 1 presents the regional variation of restraint rates for each country. Each region (District Health Boards [DHBs] for New Zealand, States for Australia and the United States and Prefecture for Japan) was ordered along the horizontal axis according to its rate. New Zealand's DHBs provide public health care to approximately numerically equal parts of the population while Japan's 47 prefectures are administrative jurisdictions. As the purpose of this study was to examine the variation, we have not identified the region each bar represents. There was strong variation in all countries.
Comparison of restraint rates by region (The horizontal axes are the regional areas of states, prefectures or District Health Board catchment areas, ordered by restraint rate. The vertical axes are restraint rates.), scaled to a rate of the number of restraints per day per 1 million population. Note that the maximum values for the graphs of New Zealand, United States and Australia are the same, but for visibility, the maximum value for Japan is more than 100 times higher.
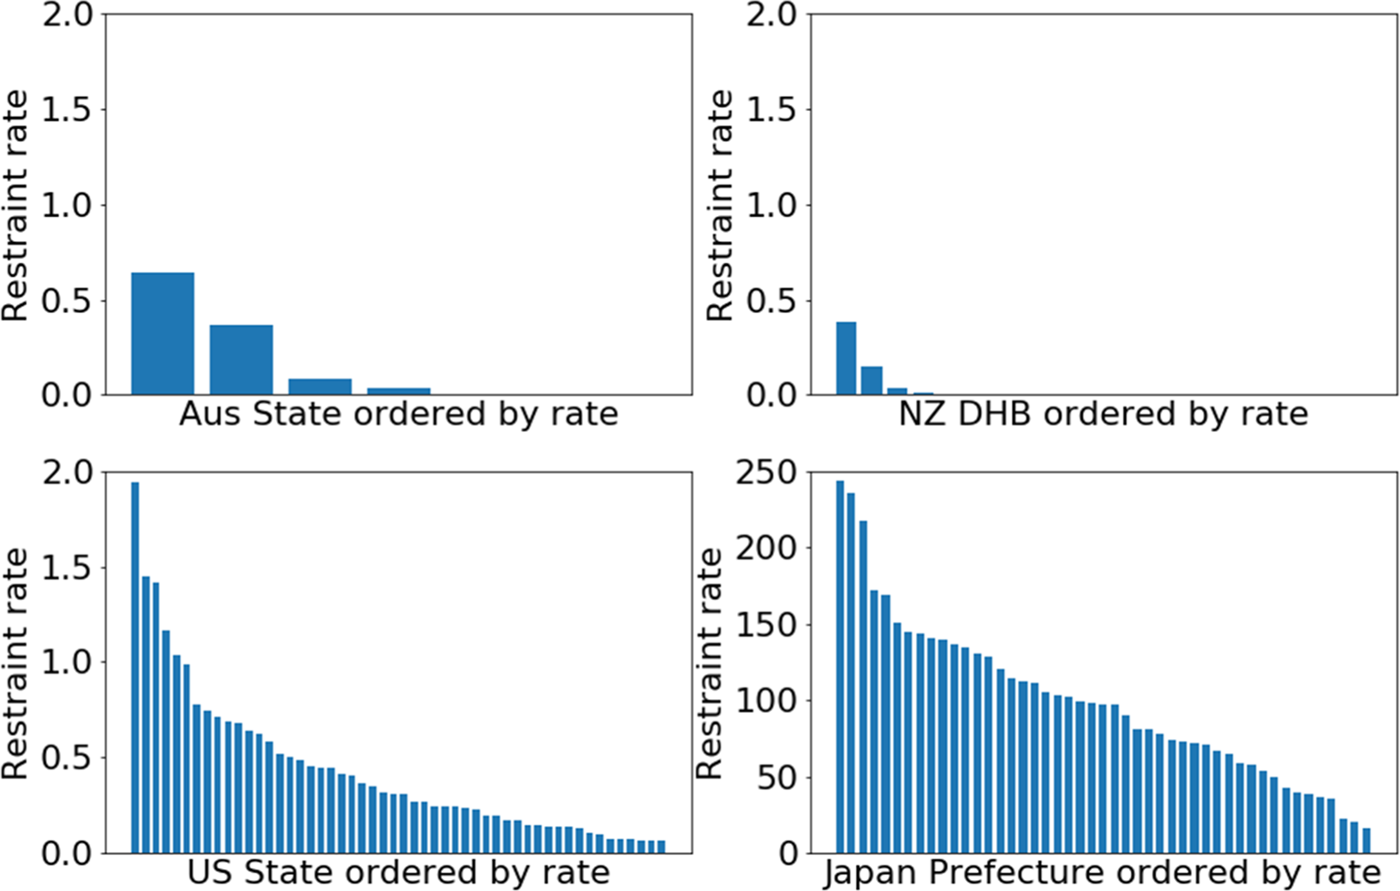
In Australia, there was a wide variation for both States and for individual hospitals in 2016/2017 (Fig. 1 and online Supplement 1). Of 102 hospitals, 78 had zero mechanical restraints, and therefore the median rate was 0.0. In total, 95% of the hospitals had a rate of less than 2.8 events per 1000 bed-days, or 0.5 events per day per 1 million population. The distribution of restraint events in the hospitals reporting non-zero values is also variable, with one hospital standing out compared to the others, reporting 20 restraint events per 1000 bed-days (3.5 events per day per 1 million population). The resulting Gini coefficient for hospitals was 0.95. There was also a wide variation among States that reported averages. The two highest had 3.6 and 2.0 restraint events per 1000 bed-days (0.65 and 0.36 restraint events per day per 1 million population) respectively, a Gini coefficient of 0.63. Below, we show that these statistics vary rapidly across time as well.
Although few DHBs in New Zealand used restraints, there was great variability between different regions. Two DHBs contributed to the vast majority of the restraint events and rates, and only three of the others had any restraint events (Fig. 1 and online Supplementary Table S1). As a result of this imbalance, the Gini coefficient for New Zealand DHBs was 0.9.
In the United States, there was also a wide variation by state and hospital. The states with the lowest rates reported 0.06 restraint events per day per 1 million population, which were 30 times lower than the state with the highest restraints (1.9 restraint events per 1 million population) (Fig. 1 and online Supplement 1). The median rate was 0.29 and Gini coefficient 0.45. There were similar variations in rates per 1000 h of hospitalisation. Similarly, individual hospitals varied, from rates of less than 0.1 per 1000 h of hospitalisation in 1079 of the 1718 reporting hospitals in the CMS database to 95 in the highest, with a Gini coefficient of 0.90. The Veteran's Administration (VA) hospitals had very low restraints, with 0.0 restraints in all but 8 of the 110 hospitals reporting, and a high of 0.67 h of restraint per 1000 h of hospitalisation. The median hospital had 0.04 events per 1000 h of hospitalisation and 95% of the hospitals were under 1.7.
In Japan, use by prefecture ranged from 14 to 139 people between the ages of 20 and 64 restrained per 1 million population (Fig. 1, online Supplement 1 and Tables S5 and S6). Including all ages, the range was between 16 and 244, with a median of 97 people restrained per 1 million population. Despite this variation, the Gini coefficient was only 0.29, reflecting the smooth decrease in rates visible in Fig. 1 and the fact that most prefectures had relatively high numbers of restraints. Restraint use for the whole population generally correlated with restraint use for younger adults. Restraint use data per hospital were not available.
Results: comparison over time within countries
Given that the countries in the study all have stated goals of minimising restraint, we investigated variations between years in the same countries (Fig. 2). In Australia, restraint use dropped by more than 40% per year between 2015/2016 (2670 restraints) and 2017/2018 (991 restraints), before rising slightly in 2018/2019 (Fig. 2). This is largely explained by a reduction in restraint use for the elderly.
Variation in restraint rates in different countries over time, in units of number of restraint events per day per 1 million population. Note that the scales on the vertical axes are different in order to aid visualisation due to the large differences in rates between countries.
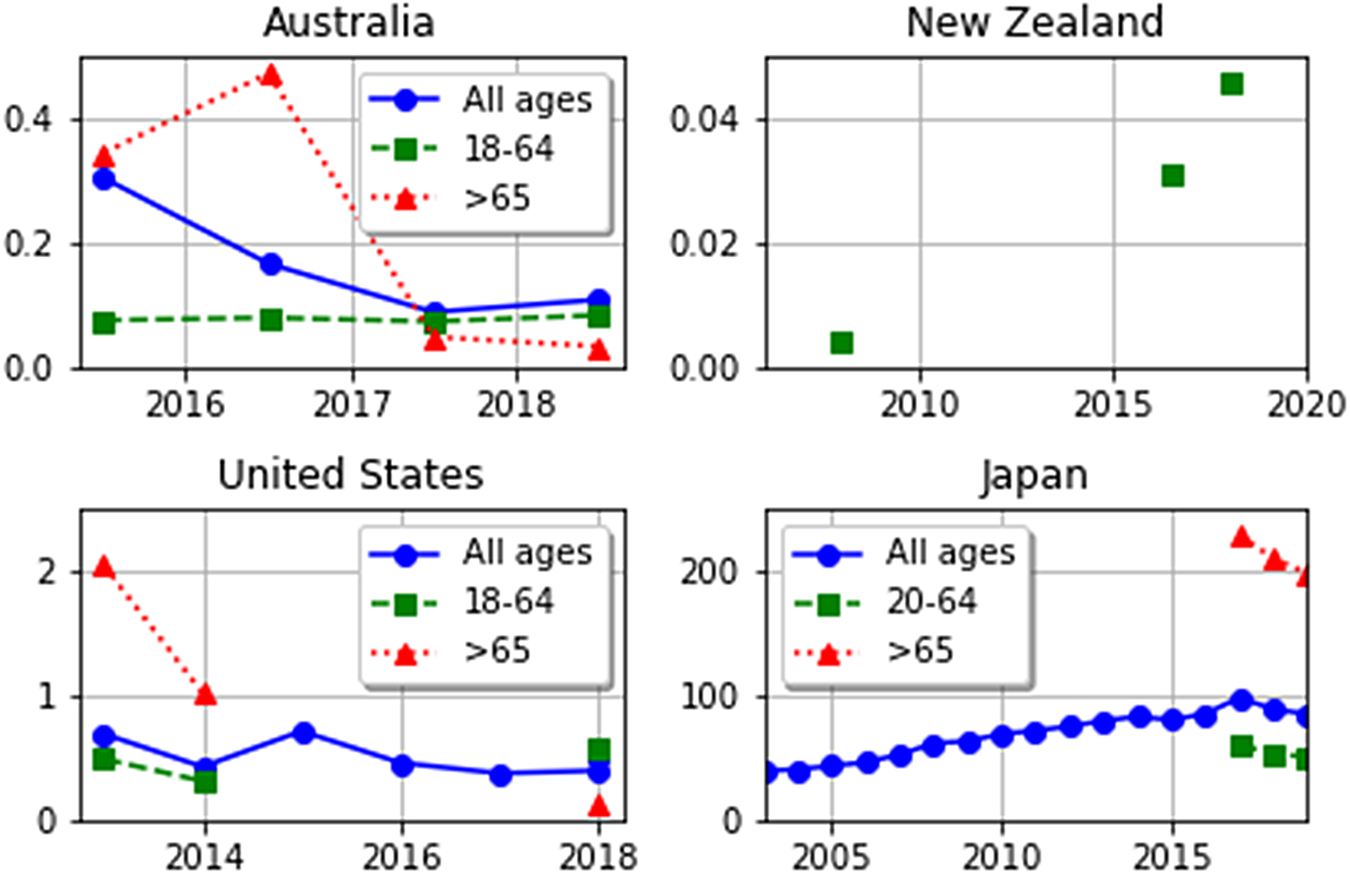
In New Zealand, absolute numbers of restraints rose from 4 reported restraint events in 2008 to 52 in 2018, an almost 12-fold rise (Fig. 2, online Supplementary Tables S1 and S2). However, the 52 restraint ‘episodes’ included 27 days of restraint for two people in different DHBs and so may be an anomaly. Moreover, several DHBs changed their reporting criteria through the years, so the 2008 results may not be comparable.
In the United States, rates of restraint from 2013 to 2018 varied between 0.38 and 0.72 restraints per day per 1 million population, with some fluctuation over time (Fig. 2). For the years 2013, 2014 and 2018–2019, the data were broken down further by age group. Patients 65 or older had much higher restraint rates in 2013 and 2014 (1–2 restraints per day per 1 million population) than in 2018/2019 (0.1–0.2 restraints per day per 1 million population). The rate of restraint of the elderly was higher than that of the population of 18–64 years of age in 2013–2014, but lower in 2018. These time variations are unlikely to be due to chance, since they are based on large numbers of hours of restraint (greater than 250 000 in 2013 and 2014).
In Japan, restraint rates climbed, more than doubling between 2003 and 2016 (Fig. 2 and online Supplementary Table S6). Slight reductions in restraint were seen in 2015, and in all age groups in 2018 and 2019. The population of Japan has been ageing and the restraint rate for older people is higher (4.9% of those 65 or greater in hospital in 2017, dropping to 4.3% in 2019) than for younger people (3.7% of those 20–64 in 2017, dropping to 3.5% in 2019) (online Supplementary Table S6). However, the increase in restraint rate between 2003 and 2016 cannot be solely caused by the ageing population, because the group least restrained in 2017, those under 20, were restrained at higher rates (3.8%) than the total population including all age groups in 2003 (1.5%). Furthermore, for Japan in 2017–2019, the elderly make up about 60% of those in hospital, and 65% of those in restraints. Therefore, the elderly are only being restrained slightly more often than other ages.
We note that, despite the stated goal of reduction of restraints, the only age group for which restraints were reduced in all countries over time, was the >65 year old group after 2016 or 2017.
Discussion
To our knowledge, this is the first paper to compare rates of mechanical restraint across jurisdictions, using publicly available data. We have documented large variations in restraint between and within countries, and over time. The reasons for these variations are unclear although it is unlikely to be entirely explained by variations in mental disorder or severity of psychopathology.
One explanation might be cultural differences between individual hospitals, regions and nations. Other possibilities may include differences in staffing levels or training, discrimination or stigma associated with psychiatric care, reliance on other forms of restraint (e.g. chemical or seclusion) and variations in hospital protocols/policies, mental health legislation, levels of hospital admission and bed numbers.
According to the WHO Mental Health Atlas (Mental Health Atlas), Japan has a similar number of psychiatrists and psychiatric nurses to the other countries but fewer psychologists and higher bed numbers. A study of >1400 medical staff suggests that more than 60% of staff think that restraints could be reduced with a higher staff/patient ratio (Hasegawa, Reference Hasegawa2016), and we suggest further research to test this hypothesis.
VA facilities in the United States use less restraint than non-VA facilities, and it seems unlikely that this is fully explained by differences between VA and non-VA patient populations, suggesting systemic differences in practice regarding restraint use.
Recent research supports the notion that improved staff training reduces restraint and shared decision making reduces involuntary admission (Reference Barbui, Purgato, Abdulmalik, Caldas-de-Almeida, Eaton, Gureje, Hanlon, Nosè, Ostuzzi and SaracenoBarbui et al.,). Some regions and hospitals have reduced or completely eliminated restraint use within standalone projects and mainstream psychiatric services as outlined in the Introduction. Some methods are beginning to show promise in reducing restraint use (e.g. Safewards (Bowers, Reference Bowers2014), Six Core Strategies (Huckshorn et al., Reference Huckshorn, Cap and Director2005) and the WHO QualityRights Programme). This suggests that restraint may not be a necessary element of care.
This study provides the first clear, cross-country reflection of mechanical restraint use, and enables clinicians, hospital administrators and policy makers to compare directly the results of their efforts towards minimising restraints with those of other jurisdictions in the Pacific Rim and elsewhere.
This study has limitations. First, in terms of international comparisons, the social, cultural and health milieu will likely have an impact on the use of restraints. Our findings do not provide any information on the contribution of these. Second, only a handful of countries provided publicly available data. In particular, we were unable to find statistics for mechanical restraint in other Pacific Rim countries such as Taiwan, Hong Kong or Singapore. We also did not examine restraints in countries outside the Pacific Rim, such as in Europe or Britain. Examining such data could help broaden understanding of results of efforts to reduce restraint. There was little information on restraint duration as none of the country-wide data except for New Zealand's included this information. Third, the difficulty in collecting data on an equivalent population of interest in all the countries is limiting. We aimed to examine adults of working age in mental health facilities, i.e. 18–65 year olds with serious mental illness. Data were collected nationally and only reported at high levels of aggregation, making it difficult to ensure that this was the only population included. We mitigated this by providing data with and without the population over 65 years where possible. Fourth, we were unable to disaggregate the data by public/private, high staffing/low staffing, urban/rural or other factors that may provide nuance to the findings. We encourage further study at increased detail. Fifth, data were not reported across consistent time frames, potentially limiting cross-national comparison. There were, however, no major structural changes in health care in these four countries that the authors are aware of, minimising this limitation. Sixth, restraint data were collected and reported in different ways with differing degrees of accuracy, making cross-jurisdictional analysis difficult. We have detailed the methods for analysis of each country's data (see online Supplement 1) to address this concern and allow interested third parties to test our assumptions. Seventh, we noted year-by-year variation in the data within jurisdictions. With low prevalence phenomena this can lead to high levels of fluctuation in the data due to the small numbers of cases. Lastly, this study only considers mechanical restraint. Seclusion, physical and chemical restraint are also issues of concern meriting similar international comparisons.
We note that despite policies meant to minimise restraint and subsequent monitoring, none of these four countries actually reduced restraint consistently over time for the general adult population. Therefore, extra efforts are needed to reduce restraint. If monitoring is not carried out, it will be impossible to determine if such extra efforts work. Therefore, developing and implementing international guidelines for the collection and reporting of restraint data would be a major advance, and one we advocate. Furthermore, we recommend that there should be uniform reporting of restraint incidents in all countries, using common metrics. Such reporting would allow for international benchmarking and a global approach to understanding the best interventions for the well-being of those in mental distress. From this study, we make a number of recommendations:
1. Reports on the use of restraint should be mandatory and publicly available. The metrics used would ideally be laid out by an international organisation, such as the World Psychiatric Association (WPA) or the World Health Organisation (WHO). Adoption of a common set of metrics would support the rapid dissemination and understanding of restraint, and act as a direct marker of the success of policies designed to abolish its use.
2. Types of restraints such as mechanical, personal, seclusion and chemical should be reported separately, including the absolute numbers of restrained people, how many times they were restrained and for how long, counts of restraint incidents and people restrained per day per 1 million population, and statistics on duration (e.g. 75th, 90th and 95th percentiles) for each type of restraint. Duration statistics are particularly important for mechanical restraint, where risk of death increases with duration of use.
3. Internationally, efforts should continually work towards implementing strategies to ensure that restraint occurs only in the most dangerous of situations and for the shortest length of time. Some methods are beginning to show promise in reducing restraint use (e.g. Safewards (Bowers, Reference Bowers2014), Six Core Strategies (Huckshorn et al., Reference Huckshorn, Cap and Director2005) and WHO QualityRights Programme), and the effectiveness of these should be measured against our recommended metrics.
Supplementary material
The supplementary material for this article can be found at https://doi.org/10.1017/S2045796020001031.
Data
All data used is publicly available and sources of these data are found in the Supplementary tables. Information requested in New Zealand under freedom of information legislation is available on request.
Acknowledgements
We thank all the New Zealand District Health Board official information request officers and the employees who helped to pull together the information on restraints. We also thank the Health Sector Workers Network for requesting information on restraints from 2016 to 2017 and for making the data available on the FYI site. Dr Robert Brasted and Dr John Allan provided context and information about US and Australian psychiatric hospitals, respectively. We thank documentary maker Michael Goldberg for motivating this study and for helping to facilitate communications, and Guadalupe Morales for communication with service users in the preparation of this manuscript.
Financial support
This research received no specific grant from any funding agency, commercial or not-for-profit sectors.
Conflict of interest
Newton-Howes and Kisely are psychiatrists and in the course of clinical work may encounter situations where mechanical restraint is requested and currently in force. Savage's son died after being mechanically restrained to his bed continuously for 10 days in a psychiatric hospital in Japan. Arnold, Hasegawa and Staggs have no conflicts to declare.


 Open access