

1. Introduction
A number of instances have been reported where, under the action of surface waves, a floating ice cover exhibited sudden break-up into pieces much smaller than the peak wavelength (Shackleton, Reference Shackleton1982; Liu and others, Reference Liu, Mollo-Christensen, Liu and Mollo-Christensen1988; Prinsenberg and Peterson, Reference Prinsenberg and Peterson2011; Asplin and others, Reference Asplin, Galley, Barber and Prinsenberg2012; Collins and others, Reference Collins, Rogers, Marchenko and Babanin A2015; Kohout and others, Reference Kohout, Williams, Toyota, Lieser and Hutchings2016; Hwang and others, Reference Hwang2017). For example, Asplin and others (Reference Asplin, Galley, Barber and Prinsenberg2012) observed the sudden break-up of multi-year sea ice due to wave action and Collins and others (Reference Collins, Rogers, Marchenko and Babanin A2015) witnessed the similar destruction of first-year sea ice. In both cases, a rapid swell built up after the break-up and the fractured cover had almost no effect on damping wave energy, opposite to the damping effect of a competent cover. Kohout and others (Reference Kohout, Williams, Dean and Meylan2014) showed that storm-generated ocean waves propagating through sea ice are able to transport enough energy to break sea ice hundreds of kilometers from the ice edge. In instances of this kind, break-up leads to an increase in the total ice floe perimeter, thereby increasing radiation incident upon the water beneath and, as a result, intensifying melting and also contributes to the decline of albedo (Pistone and others, Reference Pistone, Eisenman and Ramanathan2014; Zhang and others, Reference Zhang, Wang, Fu, Rasch and Wang2019). These observations prompt the question: is the sudden break-up a result of the weakening of the ice under wave-driven cyclic loading, in the manner of fatigue failure described by Haskell and others (Reference Haskell, Robinson and Langhorne1996), Bond and Langhorne (Reference Bond and Langhorne1997) and Langhorne and others (Reference Langhorne, Squire, Fox and Haskell1998, Reference Langhorne, Squire and Haskell1999, Reference Langhorne, Squire, Fox and Haskell2001)?
To address this question, we initially conducted a series of preliminary experiments in which plates of columnar-grained freshwater ice at −10°C were subjected to four-point, reverse cycling at ~0.1 Hz and then, after several hundreds or more cycles, bent to failure (Iliescu and others, Reference Iliescu, Murdza, Schulson and Renshaw2017). To our surprise, cycling did not weaken the ice. Nor did cycling activate fatigue failure in any systematic manner. Instead, cyclic loading strengthened the material, by as much as a factor of two. The strengthening is reminiscent of an effect first reported by Cole (Reference Cole1990) who noted that upon direct push–pull loading (Cole and Gould, Reference Cole and Gould1990) freshwater ice comprised of equi-axed and randomly oriented grains supported tensile stress greater than the tensile strength of non-cycled ice. And the tendencies both to resist fatigue failure and to not weaken are similar to the behavior noted by Hammond and others (Reference Hammond, Barr, Cooper, Caswell and Hirth2018) who subjected granular ice to cyclic loading through Brazil tests.
To deepen our knowledge of cyclic strengthening and to thus gain a better understanding of the underlying physical process, we subsequently performed a systematic series of load-cycling experiments over relatively wide ranges of outer-fiber stress (0.1–2.6 MPa), frequency (0.03–2.0 Hz) and temperature (−25 to −3°C). We report the results in this paper. As will become apparent, under all of the conditions that we examined, the flexural strength increases linearly with the amplitude of the stress, once a sufficient number of cycles has been imparted. As will also become apparent, strengthening is imparted as well through non-reverse cycling and through creep deformation, as long as the ice is bent to failure in the same sense as it is cycled or crept. We attribute the strengthening to the development of an internal back-stress that opposes crack nucleation.
Cyclic loading, incidentally, is relevant not only to floating ice covers as already noted but also to the floating ice shelves (Holdsworth, Reference Holdsworth1969; Vinogradov and Holdsworth, Reference Vinogradov and Holdsworth1985; Sergienko, Reference Sergienko2010) and icy crusts on Europa and Enceladus and on other satellites of the outer solar system that are subjected to tidal forcing (e.g. Burns and Matthews, Reference Burns and Matthews1986; Hammond and others, Reference Hammond, Barr, Cooper, Caswell and Hirth2018).
2. Experimental procedure
We studied freshwater ice that we produced in the laboratory. Tap water was frozen uni-directionally from top to bottom in a manner described previously (Smith and Schulson, Reference Smith and Schulson1993), forming pucks of ~1 m in diameter. In the interest of simulation of the microstructure of a floating ice sheet, the aim was to grow columnar-grained ice that possesses the S2 growth texture. The S2 texture is one in which the crystallographic c-axes of the individual grains of ice are oriented perpendicular to the long axis of the columnar-shaped grains but randomly oriented within the plane normal to the long axis. Thin-section analysis of ~100 grains showed that the ice was indeed S2 columnar ice. In particular, Figure 1 shows that the c-axes of the ice were randomly oriented within the horizontal plane of the ice and confined more or less to that plane (within ~15°) with no preferred orientation within the horizontal plane. The average column diameter was 5.5 ± 1.3 mm and the length of the columns exceeded 50 mm. Once the ice had been grown, it was stored in a plastic cooler in a cold room at −10°C.
Stereographic projection plot of crystal c-axis {0001} orientations of horizontal thin sections.

Specimens were manufactured from the ice pucks in the form of thin plates of dimensions h ~ 13 mm in thickness (parallel to the long axis of the grains), b ~ 75 mm in width, and l ~ 300 mm in length. Samples were allowed to equilibrate to the test temperature for at least 24 hours before testing. Most of the experiments described in this work were performed on samples that had machined (milled) surfaces. However, a few samples had surfaces that were pre-melted using a warm glass plate and then allowed to refreeze naturally prior to testing. This reduced the surface roughness of the samples. To investigate the possible role of the loading frame rollers in initiating sample failure, in some experiments polyethylene sheets were placed between the ice plate and loading rollers to reduce friction and allow ice movements in the plane of the ice plate. Results from these experiments showed that these precautions had no significant effect on flexural strength and so the use of polyethylene sheets and surface pre-melting were discontinued.
We flexed the plates up and down under four-point loading (Fig. 2) using a servo-hydraulic loading system (MTS model 810.14) to which we attached a custom-built four-point loading frame (see Iliescu and others (Reference Iliescu, Murdza, Schulson and Renshaw2017), Murdza and others (Reference Murdza, Schulson and Renshaw2018) and Murdza and others (Reference Murdza, Schulson and Renshaw2019) for details). During cyclic loading, the hydraulic actuator was driven up and down under displacement control with the load limited in both directions (load limits correspond to the outer-fiber maximum stress, set by the operator). The upward and downward motion of the hydraulic actuator was performed symmetrically with respect to the neutral axis of the ice plate. Loading was controlled using a FlexTest-40 controller. The operating principle of this controller is to slowdown the actuator just before reaching the maximum prescribed load, stop for a moment at the maximum prescribed load, and then move in the reverse direction at the specified rate. The calibrated load cell we used for measurements was designed for both tension and compression. The displacement of the top surface of the ice plate (or outer-fiber center-point strain) was measured using a calibrated LVDT (Linear Variable Differential Transformer) gage.
Sketch of the four-point bending apparatus connected to an MTS hydraulic testing system. The upper part is attached to the frame of the machine while the mobile middle part is attached through a fatigue-rated load cell to the piston. The apparatus is made from an aluminum alloy; the loading cylinders are made from stainless steel (created by Daniel Iliescu).
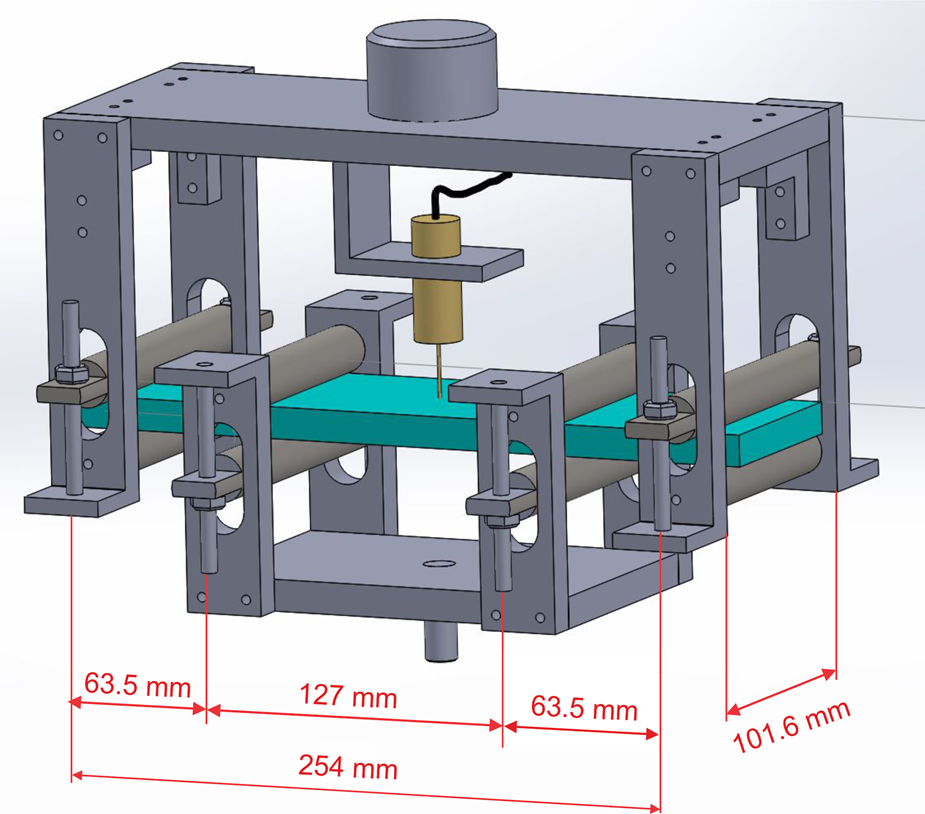
During cycling, specimens experienced both tensile and compressive stresses acting in the across-column direction. Owing to the fact that cylinders of the four-point flexing apparatus (see Fig. 2) constrain bending along the width of the sample and to the Poisson effect, the ice experienced a biaxial state of stress. Based on isotropic elasticity and plasticity theories, the minor stress was approximately between one-third to one-half of the major stress.
The experiments were performed in a cold room at temperatures of −3, −10 and −25°C and at outer-fiber center-point displacement rates of 0.01, 0.1 and 1 mm s−1 (or outer-fiber strain rates of ~1.4 × 10⁻⁵, 1.4 × 10⁻⁴ and 1.4 × 10⁻³ s−1, respectively). These rates resulted in an outer-fiber stress rate in the range from ~0.1 to 5 MPa s−1 and frequencies in the range from 0.03 to 2 Hz (i.e. periods from ~30 to 0.5 s). However, most of the tests were conducted at a frequency of ~0.1 Hz (~10 s period) which is approximately the frequency of ocean swells (Collins and others, Reference Collins, Rogers, Marchenko and Babanin A2015). The major outer-fiber stress σ f was calculated as:

where P is the applied load and L is the distance between the outer pair of loading cylinders and is set by the geometry of the apparatus to be L = 254 mm. Measurements of load and of displacement versus time at the beginning and near the end of cycling revealed little or no evidence of softening during the tests (see Fig. 2 of Iliescu and others, Reference Iliescu, Murdza, Schulson and Renshaw2017).
In the current work, four different loading procedures were used, as shown in Figure 3, with the aim of determining whether the type of loading affects the flexural strength. Type I is a completely reversed stress cycle with constant stress amplitude and mean stress of zero. Type II is a non-reversed cyclic loading test with constant stress amplitude and mean stress that is non-zero. Type III is similar to type I (fully reversed) but incorporates increasing, multi-level (or step-level) stress amplitudes. This type of test essentially consists of several type I tests of increasing stress amplitudes. Type IV is similar to type III but with increasing stress amplitude at every cycle. Initially, type III loading was used to pre-condition samples to reach higher stress amplitudes. Later, the pre-conditioning loading procedure was changed to type IV because of the smoother transition between stress levels in this type of loading. As will become apparent (Section 3.3), we detected no significant difference in the results obtained using loading types III and IV.
Stress cycling procedures. The stress here is the outer-fiber stress in one of the plate surfaces.

3. Results and observations
3.1. Flexural strength of non-cycled ice
To establish the strength of the non-cycled ice, we conducted a series of experiments where flexural strength on non-cycled ice was measured at −3, −10 and −25°C at a nominal outer-fiber center-point displacement rate of 0.1 mm s−1. Table 1 lists the results. The average and std dev. of the measured flexural strength at −3, −10 and −25°C are 1.42 ± 0.16, 1.67 ± 0.22 and 1.89 ± 0.01 MPa, respectively. These values compare favorably with the value of 1.73 ± 0.25 MPa reported by Timco and O'Brien (Reference Timco and O'Brien1994) for freshwater ice at temperatures below −4.5°C.
Flexural strength of non-cycled ice at different temperatures

3.2. Flexural strength as a function of reversed cycles
To find a relationship between the flexural strength and number of cycles imposed, we performed a series of experiments at −10°C at an outer-fiber center-point displacement rate of 0.1 mm s−1 at four levels of stress amplitude: 0.4, 0.7 , 1.2 and 1.5 MPa (stress amplitude was held constant during each test).
Figure 4 shows the results for cycling under the stress amplitude of 1.2 MPa during which we imposed from 3 to ~7000 cycles before the plate was monotonically bent to failure. Under that amplitude, the flexural strength saturates after ~300 cycles, at a level of ~2.6 MPa.
Flexural strength as a function of the number of cycles at 1.2 MPa cycling stress amplitude. All the data points represent an outer-fiber center-point displacement rate of 0.1 mm s−1 and temperature −10°C. The solid line is a line fit of tests for the number of cycles ≤300. The dotted line is a line fit of tests for the number of cycles >300.

Figure 5 shows the results for the stress amplitudes of 0.4, 0.7 and 1.5 MPa. Under these amplitudes, the number of cycles that were imposed before the plate was monotonically bent to failure varied from ~300 to ~ 16 000. The results indicate that, while generally increasing with stress amplitude (more below), the flexural strength of the cycled ice is essentially independent of the number of cycles imposed over the range explored (>300). These results are consistent with the results shown in Figure 4.
Flexural strength as a function of the number of cycles for different cycled stress amplitudes at T = −10°C and a rate of 0.1 mm s−1. Solid triangles of different colors directed to the right show different cycling stress amplitudes (left-hand ordinate) for different numbers of cycles. None of these samples broke during cycling. Solid circles of the same colors denote the flexural strength of the same specimen of ice tested after cycling (right-hand ordinate). Two horizontal solid black lines depict the range of flexural strength of non-cycled freshwater ice tested at the same conditions.

Given these results, in all subsequent tests, the ice was cycled more than 300 times, often ~2000 times, before being bent to failure.
3.3. Flexural strength of reversed cycled ice
The (saturated) flexural strength increases with stress amplitude. Figure 6 shows measurements obtained from ice cycled at −10°C at an outer-fiber displacement rate of 0.1 mm s−1. The relationship between the flexural strength, σ fc, and cycled stress amplitude, σ a, is linear (R 2 = 0.89) and described by the below equation:

where σ f0 = 1.75 MPa is the flexural strength of non-cycled ice and k is a constant whose value under the conditions of these experiments is k = 0.68.
Flexural strength of freshwater ice as a function of reverse-cycled stress amplitude. The solid pink line indicates the average flexural strength of non-cycled freshwater ice plus and minus one std dev., i.e. 1.73 ± 0.25 MPa (Timco and O'Brien, Reference Timco and O'Brien1994). Points represent tests that were conducted on freshwater ice at −10°C and 0.1 mm s−1 outer-fiber center-point displacement rate. During all depicted tests the ice did not fail during cycling and was broken by applying one unidirectional displacement until failure occurred.

Data shown in Figure 6 corresponding to stress amplitudes above 1.6 MPa were obtained from ice that had been pre-conditioned either through step-loading (type III) at progressively higher stress amplitude levels (see Iliescu and others (Reference Iliescu, Murdza, Schulson and Renshaw2017) and Murdza and others (Reference Murdza, Schulson and Renshaw2018) for details) or through gradual increase (type IV) of stress amplitude at every cycle. After pre-conditioning according to these two schemes, samples generally were cyclically loaded at least 300 times and generally for ~2000 times. As noted above, separate sets of experiments showed that there is no significant difference in the results obtained using these two pre-conditioning schemes.
3.4. Displacement rate effect
Figure 7 and Table 2 show data obtained from experiments performed to determine whether the displacement rate of cycling (0.01–1 mm s−1) affects the flexural strength. Samples were cycled ~2000 times at −10°C at different displacement rates that were held constant during each test. However, for the final monotonic one-directional bend, a displacement rate of 0.1 mm s−1 was used for all tests. This was performed in order to compare results with the flexural strength of non-cycled ice which was obtained at −10°C and 0.1 mm s−1 displacement rate.
Effect of displacement rate on flexural strength at −10°C. Red lower data points and the corresponding line fit (in red) describe the effect of outer-fiber center-point displacement rate on flexural strength for samples cycled at 0.4 MPa; blue upper data points and the corresponding line fit (in blue) describe the effect of outer-fiber center-point displacement rate on flexural strength for samples cycled at 0.7 MPa. Error bars represent std dev. Numbers next to each error bar indicate the number of experiments conducted of the same type.

Flexural strength of ice cycled at −10°C at 0.4 and 0.7 MPa at different displacement rates

Statistical analyses to test the hypothesis that the slope in Figure 7 for samples cycled at 0.7 and 0.4 MPa is zero resulted in a p-value equal ~0.06. Therefore, if there is an effect of displacement rate on the flexural strength, it is a small one, at least over the range explored here.
3.5 Temperature effect
Figure 8 and Table 3 show the results from experiments performed to determine whether the temperature of cycling (−25 to −3°C) affects the flexural strength. Although few in number, the data suggest that the flexural strength increases only slightly with decreasing temperature, for both non-cycled ice and for ice cycled at 0.7 and at 2.3 MPa. There is no evidence that the increase in strength imparted by cycling is significantly affected by temperature, evident from the similarities in slopes of the strength–temperature curves in Figure 8. Indeed, p-values for the difference in slopes between non-cycled and cycled at 0.7 MPa and non-cycled and cycled at 2.3 MPa are 0.82 and 0.57, respectively, imply that the slopes are statistically equivalent.
Effect of temperature on flexural strength of freshwater ice tested at 0.1 mm s−1 outer-fiber center-point displacement rate. Lower data points and the corresponding line fit (in black) describe temperature dependency of flexural strength of non-cycled ice; middle data points and the corresponding line fit (in blue) describe temperature dependency of flexural strength of the material which was cycled at 0.7 MPa; upper data points and the corresponding line fit (in red) describe temperature dependency of flexural strength of the material which was cycled at 2.3 MPa. Error bars represent std dev. Numbers next to each error bar indicate the number of experiments conducted of the same type.

Flexural strength of ice cycled at 0.7 and 2.3 MPa at different temperatures

3.6. Non-reversed cycling
Eight experiments were conducted at −10°C and 0.1 mm s−1 displacement rate under an outer-fiber stress maximum of 1.5 MPa, where mean stress was non-zero, following loading scheme type II. Table 4 lists the results. In this type of loading, one surface was always under tension while the other only under compression. The number of cycles imposed during non-reversed cycling was the same as for the reversed-cycling (~2000).
Flexural strength of freshwater ice after cycling at −10°C, 0.1 mm s−1 displacement rate and at 1.5 MPa in the reversed and non-reversed manners

The average and std dev. of the measured flexural strength of non-reversed cycling, where flexural strength was tested in the same sense as cycling, are 2.79 ± 0.17 MPa. These values are statistically equivalent (p = 0.7) to the flexural strength of 2.74 ± 0.13 MPa measured after reversed cycling at 1.5 MPa stress amplitude at the same temperature and displacement rate. In comparison, the average and std dev. of the measured flexural strength after non-reversed cycling when flexural strength was obtained by bending in the opposite sense than during cycling are 1.92 ± 0.18 MPa. This is about the same as the flexural strength of 1.67 ± 0.22 MPa that was measured for non-cycled ice (p = 0.23). In other words, we detected neither strengthening nor weakening during cycling when the sense of cycling and bending to failure were the opposite. Thus, it appears that to increase the flexural strength of ice, the surface which is ultimately loaded in tension to failure must have experienced tension.
3.7. Creep effect
We also conducted a series of creep tests in four-point bending at −10°C, where the outer-fiber stress was held constant (1 and 1.2 MPa) for different time intervals. The sample was then unloaded and brought to failure by bending either in the same sense as it was loaded or in the opposite sense.
Figure 9 and Table 5 show the results. As creep time increases, the flexural strength tested in the same sense also increases and then saturates after ~1000 s. This trend is similar to cycling, where the flexural strength saturates after ~300 cycles with each cycle lasting several seconds. Thus, the total time of loading at which the flexural strength saturates is similar under both cyclic loading and static creep. However, the flexural strength after a sample had been crept is not exactly the same as it was after cycling. For 1 MPa creep stress and 1 MPa stress amplitude of cycling, the subsequent flexural strengths were 2.05 and 2.43 MPa, respectively. The samples experience a greater increase in strength after cyclic loading.
Flexural strength of freshwater ice as a function of creep time after creeping at outer-fiber stress of 1.0 MPa and T = −10°C.

Flexural strength of freshwater ice after creeping at −10°C

For samples that had been crept and then bent in the opposite sense, the flexural strength is about the same as for non-cycled ice. This behavior is similar to the case of cyclic loading. These results again indicate that the requirement for strengthening is that the surface that undergoes maximum tensile stress during failure must have been pre-stressed in tension.
3.8. Deformation features
Microcracks? It is important to note an absence of remnant microcracks, at least of the size detectable by the unaided eye or in thin sections viewed using optical microscopy, in the two parts of the ice plates that were obtained after breaking. This point was noted originally in Iliescu and others (Reference Iliescu, Murdza, Schulson and Renshaw2017), where only 15 experiments were conducted. Since that time, in the many plates we broke to obtain the results for this paper, we found no evidence of remnant microcracks in any of the pieces. In keeping with the apparent absence of microcracks, we did not detect acoustic emissions (AE) over the frequency response of 3 kHz–3 MHz and minimum AE amplitude detection threshold of 45 dB during cycling (unlike Langhorne and Haskell (Reference Langhorne and Haskell1996); Cole and Dempsey (Reference Cole and Dempsey2004, Reference Cole and Dempsey2006) and Lishman and others (Reference Lishman, Marchenko, Sammonds and Murdza2020)); the only evidence of acoustic emissions was observed during the final monotonic unidirectional bend, when the ice fractured. Based on the fact that upon nucleation cracks in the ice are generally comparable to grain-size dimension (Cole, Reference Cole1988; Schulson and Duval, Reference Schulson and Duval2009), the absence of visible microcracks prior to failure implies that as soon as the first crack nucleates, it propagates almost immediately, leading to the creation of the fracture surface.
Recrystallization? A second point to note is the absence of recrystallization in cycled and broken ice. We compared the microstructure of samples before and after cycling and did not find any difference at the level of resolution (~0.1 mm). This suggests that insufficient plastic strain had been imparted to activate this solid-state transformation.
Grain boundary sliding? In our experiments we detected evidence for grain boundary sliding, i.e. of a mode of high homologous temperature deformation (e.g. Raj and Ashby, Reference Raj and Ashby1971) where the material is displaced inelastically across the boundary between two grains. The evidence is in the form of whitish features of grain size length, termed decohesion zones (or decohesions), reminiscent of similar-looking features observed in earlier experiments on the compressive behavior of ice (Ignat and Frost, Reference Ignat and Frost1987; Nickolayev and Schulson, Reference Nickolayev and Schulson1995; Picu and Gupta, Reference Picu and Gupta1995a, Reference Picu and Gupta1995b; Weiss and Schulson, Reference Weiss and Schulson2000). Decohesions are regions along the grain boundaries where partial and discontinuous separation has occurred. Unlike cracks that suddenly release elastic energy, decohesions nucleate and grow gradually suggesting that their formation is a viscous process (Weiss and Schulson, Reference Weiss and Schulson2000). In addition, decohesion opening is significantly smaller than that of cracks and, as a result, decohesions can heal and do not weaken the material (Frost, Reference Frost2001). In our experiments, the features intensified gradually during both cycling and creep and were first observed upon cycling in freshwater ice by Iliescu and others (Reference Iliescu, Murdza, Schulson and Renshaw2017). The image in Figure 3 in Iliescu and others (Reference Iliescu, Murdza, Schulson and Renshaw2017) shows a photograph of an ice plate loaded in the flexural rig, prior to fracture, after having been pre-conditioned according to the step-loading procedure III and then cycled at 2.6 MPa stress amplitude for ~2900 cycles. Having analyzed more data, we confirmed that these features are oriented at ~45° to the direction of the greater normal stress acting in the plane of the plate (Fig. 10d); i.e. along planes on which the shear stress is a maximum, suggesting that they formed through shear deformation along grain boundaries (Fig. 10). The figure shows examples of grain boundary decohesions that we observed during the present load-cycling experiments.
Photographs showing that decohesions form along grain boundaries: (a) decohesions formed after ~2000 cycles were imposed (transmitted light image); (b) red lines drawn along the decohesions (transmitted light image); (c) red lines which represent decohesions are superimposed with the microstructure (polarized image); (d) histogram of distribution of decohesion orientations in (a) with a mean of 47° and a std dev. of 17° (y-axis is a number of occurrences and x-axis is decohesion orientation with respect to the direction of the major normal stress which is horizontal in these images).

Decohesion zones were not detected in fractured specimens that were brought to failure without pre-conditioning. The lowest cyclic stress amplitude at which decohesions were detected was ~0.3 MPa. Under the low range of stress amplitudes (~0.3–0.5 MPa), only a few of decohesions formed; on average, they penetrated slightly toward the neutral axis of the bending and the degree of their visibility was low. At higher cyclic stress amplitudes, we observed more decohesions and, on average, they were deeper and longer (maximum length was of grain size length in the loading plane). However, there was evidence that some decohesions that penetrated deeply while cycled at low stress amplitudes (~0.5 MPa) and did not propagate farther after the cycled stress amplitude was increased to ~2.3 MPa. This observation is an indication of a preferable sliding orientation within grain boundaries, i.e. that the first decohesions form on the most optimally oriented grain boundaries, with decohesions on less optimally oriented boundaries only forming at high stress amplitudes. Decohesions were also observed in specimens that had been crept before bending to failure. This is consistent with an earlier observation by Weiss and Schulson (Reference Weiss and Schulson2000) who observed decohesions during compressive creep experiments on columnar freshwater ice.
Decohesions were observed on both the top and bottom surfaces at −3, −10 and −25°C. We did not see any significant difference between decohesions obtained at different temperatures. Hence, it appears that the formation of these features is independent of temperature over the range examined.
Decohesions appear under both tension and compression. This became evident from the tests where samples were cycled in a non-reversed manner, i.e. one surface experienced only tensile stress and the other only compressive stress (maximum outer-fiber value of stress in these experiments was 1.5 MPa). A photograph of such a specimen after cycling for ~2000 times at a displacement rate of 0.1 mm s−1 at −10 °C is shown in Figure 11. As can be seen, decohesions (a–a and b–b for example), stem equally from the upper and lower surfaces, just as in the case of reversed cycling (Fig. 3 in Iliescu and others, Reference Iliescu, Murdza, Schulson and Renshaw2017).
Photograph showing a test specimen after the non-reversed-cycling (type II loading procedure) for ~2000 times at a maximum outer-fiber stress of 1.5 MPa, displacement rate of 0.1 mm s−1 and −10°C. Note decohesions (a–a and b–b, for example), stemming equally from the upper (compressive) and the lower (tensile) surfaces, again as in the case with reversed cycling (Fig. 3 in Iliescu and others (Reference Iliescu, Murdza, Schulson and Renshaw2017)). Vertical edge from the right is the fracture surface. The major loading direction (along the sample length) is horizontal on this image.

Figure 12 shows how decohesions advance as the imposed number of cycles increases. Photographs (a), (b) and (c) correspond to 10, 100 and 1000 cycles respectively. Additionally, we quantified decohesion development through counting decohesions within a section 4 cm × 8.4 cm (Fig. 12) at different time increments and constructed a graph where the number of decohesions (and corresponding areal density) that appear is shown as a function of number of cycles imposed (Fig. 13). This trend is somewhat similar to the trend in Figure 4, where the flexural strength is depicted as the number of cycles imposed. The areal density is calculated as:

where c i is the length of i-th decohesion and A is the area of interest.
Photographs showing decohesion appearance on the same section of one sample which was cycled for 10 (a), 100 (b) and 1000 cycles (c) respectively at 1.2 MPa stress amplitude, −10°C and 0.1 mm s−1 rate. The major loading direction is horizontal on these images.

The number of decohesions and the corresponding areal density within a section 4 cm × 8.4 cm of a sample in Figure 12 as a function of the number of cycles imposed.

It is reasonable to expect that the number of decohesions that develop during cycling will eventually saturate. The reason is that the number of grain boundaries within the sample is limited and, as is shown in Figure 10, decohesions appear only along grain boundaries.
4. Discussion
What is the origin of ice failure in our experiments? Owing to the higher value of the compressive strength of ice compared with the tensile strength, failure in ice in bending occurs on the surface that undergoes tensile deformation. Hence, in our work ice strength is always governed by tensile strength. This is consistent if we compare our results with the results obtained by Carter (Reference Carter1971) who provided measurements on the tensile strength of cylindrical samples of laboratory columnar freshwater ice loaded across the columns. Our flexural strength values, when divided by 1.7 to convert flexural strength to tensile strength (Ashby and Jones, Reference Ashby and Jones2013), agree well with Carter's values.
What governs tensile strength? Depending on the grain size, either crack propagation or crack nucleation controls the tensile strength of ice (Schulson and others, Reference Schulson, Lim and Lee1984). When grain size is larger than a critical size, crack nucleation governs the tensile strength as stress to nucleate cracks is greater than stress to propagate cracks. This is suggested by the absence of remnant cracks (which is consistent with the observation in Section 3.8), which are expected to be of a grain-size dimension in ice (Cole, Reference Cole1988; Schulson and Duval, Reference Schulson and Duval2009), within the parts of the broken sample. Hence, we conclude that nucleation of the first crack is followed by immediate propagation and creation of the fracture surface.
What is the nucleation mechanism in tension? Cracks nucleate to relieve stress concentrations that develop within the vicinity of grain boundaries (Gold, Reference Gold1972) following the imposition of a small amount of inelastic deformation. The process involves either grain boundary sliding or the piling up of dislocations against other boundaries following glide on the basal slip planes of the ice Ih grains. The present experiments and those of Iliescu and others (Reference Iliescu, Murdza, Schulson and Renshaw2017) offer direct evidence of grain boundary sliding during cycling and creep in the form of visible decohesion, and in situ X-ray topography studies by Liu and others (Reference Liu, Baker and Dudley1995) offer direct evidence of dislocation pileups. Thus, both mechanisms are possible, although at this juncture it is difficult to distinguish between the two. The common factor is that both processes lead to concentrations of stress high enough to overcome the surface energy obstacle to crack nucleation.
Why is the flexural strength linearly related to the stress amplitude during cycling? Based upon the nucleation process described above, we imagine that accompanying the buildup of local stress that ultimately nucleates a crack is the development of a back-stress, σ b, that opposes sliding and/or slip. The back-stress thus raises the level of the applied stress necessary to nucleate a crack. The higher the amplitude of the applied stress, the greater is the number of dislocations in the pileup and/or the greater is the displacement at the grain boundary and so the greater is the back-stress. The linear relationship suggests that under the conditions of our experiments where little inelastic strain was imparted, the back-stress scales linearly with stress amplitude. We do not have measures of the internal stress and so cannot quantify its magnitude, although this interpretation of strengthening implies that the back-stress is of the magnitude of the strength imparted by cycling; i.e. σ b = kσ a. The development of an internal back-stress, we suggest, also accounts for the strengthening imparted by creep (Section 3.7) and for the fact that bending to failure in a sense opposite to the sense of cyclic loading does not impart strengthening (Section 3.6).
There is an implication in accounting for strengthening in terms of the development of an internal back-stress. Given sufficient time at high homologous temperature, such stresses tend to relax. The implication, therefore, is that strength imparted through either cyclic loading or creeping is expected to be recoverable. We are currently exploring this point and will say more in due course.
Finally, returning to the observations noted in the Introduction, namely the sudden break-up of a floating ice cover under the action induced by oceanic waves, it is now clear that there is more to the process than simply flexural cycling. Perhaps, natural covers contain a population of fresh cracks so that fatigue life is governed not by the need to both nucleate and propagate cracks but only by crack propagation.
5. Conclusions
From new, systematic experiments on the flexural strength of S2 columnar-grained freshwater ice stressed principally across the columns through both reversed and non-reversed cyclic loading and creeping at temperatures from −25 to −3°C and frequencies from 0.03 to 2 Hz, it is concluded that:
(1) The new experiments confirm the results of preliminary experiments by Iliescu and others (Reference Iliescu, Murdza, Schulson and Renshaw2017) which indicated that cyclic loading strengthens ice.
(2) Upon cycling, the flexural strength of ice cycled at −10°C and a frequency of ~0.1 Hz scales linearly with the amplitude of the outer-fiber stress.
(3) Pre-conditioning through bending-induced static creep also increases the flexural strength of ice.
(4) The flexural strength saturates upon both cyclic loading and creeping; the time required for the saturation is similar (a few hundred cycles or ~103 s).
(5) Neither temperature (−25 to −3°C) nor frequency of cycling (0.01–1 mm s−1) has a large effect on cyclic strengthening, if an effect at all.
(6) The fundamental requirement for strengthening is that the surface that undergoes maximum tensile stress during failure must have been pre-stressed in tension.
(7) Cyclic strengthening is not imparted when, after non-reversed cycling, the ice is bent in the opposite sense.
(8) Cycling-induced grain-boundary sliding occurs under both tension and compression.
(9) Cyclic strengthening is attributed to the development of an internal stress that opposes the applied stress and thus raises the level of the applied stress that is required to nucleate a crack.
Acknowledgements
We acknowledge helpful discussions/communications with Professor Harold Frost, Dr Robert Gagnon and Dr Daniel Iliescu. We also thank the two anonymous reviewers whose comments/suggestions helped to improve and clarify this manuscript. This work was supported by the US Department of the Interior-Bureau of Safety and Environmental Enforcement (BSEE), contract no. E16PC00005.


 Open access