


Introduction
Since the early 2000s and, more particularly, the 2008 economic crisis, new extreme parties have emerged or reinforced their position in European party systems (Dalton, Reference Dalton2008; Kriesi et al., Reference Kriesi, Grande, Lachat, Dolezal, Bornschier and Frey2008; Moral, Reference Moral2017). Party polarization, or ‘the degree of ideological differentiation among political parties in a system’ (Dalton, Reference Dalton2008, p. 900), is often considered a threat to democracy. Scholars have established its effect on political gridlocks, outpartisan mistrust, decreasing democratic support and even regime breakdown (Kingzette et al., Reference Kingzette, Druckman, Klar, Krupnikov, Levendusky and Ryan2021; Mason, Reference Mason2018; Powell, Reference Powell1986; Sartori, Reference Sartori1976). Arguably, however, one of the positive effects of polarization could be to reactivate the electorate by providing voters with clear and genuine political alternatives. Perhaps one of the most striking examples of the mobilizing effect of party polarization is embodied in the 2020 US presidential elections, in which nearly 160 million Americans voted, the highest turnout in the past 50 years. Following the polarization of mainstream parties or the emergence of radical contenders, turnout reached record highs in Germany in 2017 with the entry of the Alternative für Deutschland (AfD) in the party system, after the radicalization of Orban's Fidesz in the 2018 elections in Hungary, the 2023 Polish elections, or most recently in the 2024 ‘snap’ parliamentary elections in France. Party polarization, in that sense, may actually improve the representativeness of our democracies by fostering an active electorate.
According to the literature on party competition and the spatial model, party polarization broadens the political offer and mobilizes new voters by clarifying party cues and enhancing congruence between party supply and voters’ demands (Abramowitz & Saunders, Reference Abramowitz and Saunders2008; Downs, Reference Downs1957; Hobolt & Hoerner, Reference Hobolt and Hoerner2020; Levendusky, Reference Levendusky2010). However, it is still debated whether the positive relationship between party polarization and turnout, mostly documented in the US two‐party system, is generalizable to multiparty contexts, such as European democracies, and across all kinds of voters. In fact, while most comparative evidence suggests a positive relationship between party polarization and turnout (Dalton, Reference Dalton2008; Dassonneville & Çakır, Reference Dassonneville and Çakır2021; Hobolt & Hoerner, Reference Hobolt and Hoerner2020; Moral, Reference Moral2017; Wilford, Reference Wilford2017), and even though extreme parties have become increasingly successful in European systems in the past two decades, turnout has steadily declined by 10 percentage points on average over the same period. In addition, this literature remains divided regarding which groups of voters may be mobilized by these broader political alternatives, while this matters to determine whether this phenomenon may be normatively desirable and improves the representativeness of our democratic systems. Party polarization may therefore further distort representation and over‐represent the preferences of specific groups of voters, such as the most extreme, partisan or politically aware.
In this article, I address this puzzle and contribute to these debates by assessing whether party polarization in European multiparty systems affects individuals’ propensity to turn out and, if so, who is mobilized. I argue that one important aspect of European multiparty systems has been overlooked by prior research on the mobilizing effect of party polarization: the degree of these systems’ multidimensionality. European party systems have been characterized by the emergence of a new, cultural dimension of political conflict, which does not necessarily align in a single left‐right political dimension traditionally stemming from historical divisions on economic issues (Hooghe & Marks, Reference Hooghe and Marks2018; Kriesi et al., Reference Kriesi, Grande, Lachat, Dolezal, Bornschier and Frey2008; Rovny & Whitefield, Reference Rovny and Whitefield2019). The approach undertaken in this study addresses this shortcoming by accounting for increasing divisions on this cultural dimension and its role in structuring party competition and political behaviour in these systems. I expect that polarization effectively broadens and clarifies political alternatives when parties polarize, especially on this new political dimension. In addition, this effect should be moderated by the degree of multidimensionality of the party system, which may reduce the clarity of new, polarized party supply. Finally, the multidimensionality of European party systems should have implications for which groups of citizens perceive and respond to party polarization on each dimension. More extreme citizens on one or several political dimensions should be mobilized when parties polarize on the corresponding issue dimension. Similarly, it remains unclear whether party polarization in two‐dimensional systems, which are more complex to grasp, clarifies the political offer to those usually most remote from party competition; or further distorts the representation of those who are more aware of and sensitive to party system changes. Therefore, I test whether polarization on each dimension improves the clarity of political alternatives and the congruence between parties’ offers and citizens’ demands by assessing whether all kinds of voters – more or less extreme, partisan or politically aware – are mobilized.
This article thus contributes to the recent literature that examines the potential ‘corrective effect’ in terms of participation and representation of recent shifts in party competition in European democracies, most often driven by the emergence of populist and radical right parties (Immerzeel & Pickup, Reference Immerzeel and Pickup2015; Leininger & Meijers, Reference Leininger and Meijers2021). Compared to these studies, its added value lies in its account of the party system as a whole, which also includes mainstream parties’ ideological shifts and accommodating strategies that are highly consequential for electoral behaviour (Abou‐Chadi, Reference Abou‐Chadi2016; Spoon & Klüver, Reference Spoon and Klüver2019). The main contribution of this study is to define party polarization beyond the left‐right divide by distinguishing the economic and cultural dimensions of party competition using an established measure of polarization (Dalton, Reference Dalton2008; Ezrow, Reference Ezrow2007; Lachat, Reference Lachat2008; Sigelman & Yough, Reference Sigelman and Yough1978; Taylor & Herman, Reference Taylor and Herman1971). I exploit the variation of polarization on these two dimensions in Europe across countries and over time to assess their respective relationship with electoral participation. I test my theoretical expectations in two stages through a cross‐sectional time‐series analysis and a multilevel approach. First, I conduct an analysis at the aggregate level using data from the Chapel Hill Expert Survey (CHES) and official turnout data in 23 European countries between 1999 and 2019. Then, I turn to the individual‐level mechanisms using the European Social Survey (ESS) in the same period with a subset sample of 21 countries.
These two analyses provide consistent and comparative evidence that solely party polarization on the cultural dimension is related to higher turnout, especially so in most unidimensional systems. In addition, these findings suggest that polarization on that dimension equally mobilizes all kinds of voters. Altogether, these results provide support to the hypothesis of a realignment of European party systems, where parties and voters’ core political conflict lies on the cultural dimension of party competition. This article thus contributes to the debate on the consequences of party polarization in European multiparty systems by showing that the multidimensionality and cultural alignment of these systems matter in explaining variations in electoral mobilization.
Party polarization on electoral mobilization
Since the seminal works of Sartori (Reference Sartori1976) developing the concept of polarized pluralism, party polarization, defined as ‘the degree of ideological differentiation among political parties in a system’ (Dalton, Reference Dalton2008, p. 900), has been observed both in two‐party and multiparty systems in the past decades. Much of the recent literature that studies the consequences of party polarization has focused on the US case, where scholars have observed the drastic increase of party divergence as early as the 1980s (Abramowitz, Reference Abramowitz2010; Bafumi & Shapiro, Reference Bafumi and Shapiro2009; Fiorina & Abrams, Reference Fiorina and Abrams2008; Hetherington, Reference Hetherington2001; Levendusky, Reference Levendusky2010; Rogowski, Reference Rogowski2014). In the European context, its study followed the new wave of extreme parties’ electoral success from the late 1990s (Dalton, Reference Dalton2008; Dassonneville & Çakır, Reference Dassonneville and Çakır2021; Hobolt & Hoerner, Reference Hobolt and Hoerner2020; Moral, Reference Moral2017; Wilford, Reference Wilford2017).
Party polarization in this variety of contexts was shown to have critical implications for political participation and turnout in particular. Most of the studies exploring this relationship argue that party polarization should foster electoral participation building on the spatial model of voting (Downs, Reference Downs1957). According to this model, party polarization, by broadening political alternatives along the ideological spectrum, should positively affect turnout by affecting the utility to vote through two main mechanisms – first, through enhancing parties’ cue clarity and, second, through greater congruence between parties’ supply and citizens’ demands.
Parties’ divergence should, first, improve the clarity of parties’ platforms as the utility of voting depends on each party's relative distance from the other(s). If parties’ policy positions are indistinguishable from each other, such as in a context of party convergence, for instance, the utility of turning out decreases drastically as the outcome of elections will remain virtually the same, regardless of which party wins the elections. Conversely, the polarization of parties clarifies the actual choice available to voters (Wessels & Schmitt, Reference Wessels and Schmitt2008). Second, party polarization enhances congruence by broadening the coverage of the political space. The spatial theory posits that voters are rational actors and that their relative distance from parties partly determines the utility of turning out. As parties’ offer broadens, more political space is covered by parties’ platforms, increasing the likeliness of a close political alternative for a wider range of voters. Several studies have supported these predictions. Focusing on the US 2004 elections (Abramowitz & Saunders, Reference Abramowitz and Saunders2008; Aldrich & Freeze, Reference Aldrich, Freeze, Highton and Sniderman2011; Hetherington, Reference Hetherington, Nivola and Brady2008), or its increasing level of polarization since 1952 (Romero & Romero, Reference Romero and Romero2021), these studies showed how citizens’ perceived greater divisions between the Republican and Democrat candidates relates to higher turnout. Beyond two‐party systems, comparative studies tend to support the finding of a positive relationship between polarization and turnout (Dalton, Reference Dalton2008; Dassonneville & Çakır, Reference Dassonneville and Çakır2021; Hobolt & Hoerner, Reference Hobolt and Hoerner2020; Moral, Reference Moral2017; Wilford, Reference Wilford2017).
Yet, the congruence mechanism has been heavily criticized, especially in the context of a two‐party system. According to Fiorina and colleagues (Fiorina & Abrams, Reference Fiorina and Abrams2008; Fiorina et al., Reference Fiorina, Abrams and Pope2010), while parties have diverged ideologically, the distribution of the electorate has remained relatively stable over time. In addition, when only two polarized party offers are available, moderate voters might feel alienated by the lack of a central political option. Consistent with these arguments, Rogowski (Reference Rogowski2014) finds a negative relationship between the polarization of candidates in the House and Congress races and turnout. Hence, congruence may not be improved in two‐party systems. In multiparty systems, however, the alienation of moderate voters should be less likely, as moderate alternatives remain available to voters, despite growing polarization. Aligned with this expectation, Hobolt and Hoerner (Reference Hobolt and Hoerner2020) use a time‐series cross‐national analysis and a natural experiment to show how the positive effect of party‐voter congruence on turnout increases as polarization rises in multiparty systems. Muñoz and Meguid (Reference Muñoz and Meguid2021), using the change of party polarization and citizens’ relative distance to parties’ positions in the two‐round French presidential elections, support the findings that both political alternatives and congruence matter in mobilizing new voters.
Despite this evidence suggesting a positive relationship between party polarization and electoral mobilization, the emergence of new extreme parties did not reverse the trend of ever‐decreasing turnout in European democracies. Furthermore, recent findings suggest that some groups beyond the moderates, such as the least politically aware, remain unaffected or even disproportionately demobilized by increasing polarization in multiparty systems (Lachat, Reference Lachat2008; Moral, Reference Moral2017). This is puzzling, as these voters should particularly benefit from the clarification of party cues in the context of party polarization (Zaller, Reference Zaller1992). In this paper, I argue that one of the main shortcomings of previous studies analysing the impact of party polarization in European systems on electoral behaviour has been to focus on the clarity and congruence mechanisms on a single left‐right dimension. This paper addresses this drawback by arguing that the multidimensionality of European party systems matters in order to assess both improved clarity and congruence induced by increasing polarization and heterogeneous effects among voters.
Polarization and turnout in multidimensional party systems
Most of the literature assessing the relationship between party polarization and turnout confined their polarization definition to a single left‐right dimension. However, starting from this premise ignores the recent shifts in European systems, namely the emergence of a new cleavage around non‐economic issues. Referred to as ‘materialist‐postmaterialist’ (Inglehart & Flanagan, Reference Inglehart and Flanagan1987), ‘libertarian‐authoritarian’ (Kitschelt, Reference Kitschelt1994), ‘GAL (Green, Alternative, Libertarian) ‐ TAN (Traditionalist, Authoritarian, Nationalist)’ (Hooghe & Marks, Reference Hooghe and Marks2018; Hooghe et al., Reference Hooghe, Marks and Wilson2002) a ‘cultural’ (Kriesi et al., Reference Kriesi, Grande, Lachat, Dolezal, Bornschier and Frey2008) or, more simply, a non‐economic dimension of party competition (Hellwig, Reference Hellwig2008; Steiner & Martin, Reference Steiner and Martin2012; Ward et al., Reference Ward, Kim, Graham and Tavits2015), this political continuum translates political conflicts on cultural and social issues such as law and order, immigration, environment or civil rights.
The distinction between the two dimensions becomes critical when analysing the impact of party system structures on public opinion and voting behaviour in European multiparty systems. For instance, Ares (Reference Ares2022) shows that class differences in political preferences widen or narrow depending on whether parties polarize and emphasize economic or cultural issues. Spies and Franzmann (Reference Spies and Franzmann2011) show how radical right parties’ electoral success depends on the opportunity structure of the party system and that these parties benefit the most when polarization is low on the economic dimension but high on the cultural dimension. Finally, Hillen and Steiner (Reference Hillen and Steiner2020) provided evidence on how turnout decreased for voters who combined both an economic‐left and cultural‐authoritarian position when lacking party supply. Bridging the polarization and party system multidimensionality literature, I expect party polarization to be positively related to turnout through the congruence and clarity mechanisms derived from the spatial model. However, I argue that the multidimensionality of European multiparty systems moderates the congruence and clarity derived from greater divergence between parties.
As Rovny and Polk (Reference Rovny and Polk2019) point out, there is a great deal of cross‐national and time variation in European countries in the way a new cleavage around non‐economic issues has emerged and its correlation with traditional economic conflicts. Given these different contexts, measuring party polarization solely on a left‐right axis might not accurately measure the broadening of political alternatives. This is so for two reasons. First, parties have not polarized equally across dimensions, which might explain why we do not observe rising turnout across Europe. While parties seem to have polarized on the cultural (GAL‐TAN) dimension of party competition (Dassonneville & Çakır, Reference Dassonneville and Çakır2021; Kriesi et al., Reference Kriesi, Grande, Lachat, Dolezal, Bornschier and Frey2008), there is more debate in the literature as to whether parties have converged on the economic dimension of party competition (Le Gall, Reference Le Gall2017; Steiner & Martin, Reference Steiner and Martin2012). Citizens might well be mobilized by both economic and GAL‐TAN polarization, but if parties do not polarize on one of these axes of party competition, citizens might not be more likely to turn out. This leads to the first dimensionality hypothesis below.
Polarization dimensionality hypothesis
H1: The greater the polarization of parties, the higher the turnout.
Second, according to the literature on the multidimensionality of European party systems, incremental changes in the social structures due to economic development and fulfilment of material needs, the intensification of globalization and socio‐educational shifts, or more sudden structural shocks, such as the migration crisis, have shifted preferences and the main line of conflict among social groups (Hooghe & Marks, Reference Hooghe and Marks2018; Inglehart & Flanagan, Reference Inglehart and Flanagan1987; Kitschelt, Reference Kitschelt1994; Kriesi et al., Reference Kriesi, Grande, Lachat, Dolezal, Bornschier and Frey2008). Rather than focusing on the economic left against economic liberals, this stream of research argues that political conflict has shifted to new and broader divisions on issues of immigration, the environment or law and order (Rovny & Whitefield, Reference Rovny and Whitefield2019). Under these conditions and given these indications of a realignment of party systems around the cultural dimension of party competition, citizens’ demands for clear and wide party alternatives may be greater regarding this new line of conflict. At the same time, the last two decades have been characterized by important economic shocks, most notably the 2008 economic crisis, that might as well revive economic divisions and demands for clear political alternatives on these issues. In this context, party polarization on the economic dimension might remain as mobilizing to voters as GAL‐TAN polarization. I, therefore, test whether the GAL‐TAN realignment expectation from the literature holds in my second hypothesis.
Realignment hypothesis
H2: Party polarization on the GAL‐TAN dimension has a stronger positive relationship with turnout compared to polarization on the economic dimension.
Another key element of multidimensionality in moderating the effect of party polarization on turnout is the extent to which the two dimensions of party competition are orthogonal to each other. As Sartori (Reference Sartori1976) himself argued, the multidimensionality of multiparty systems might complexify rather than simplify parties’ offer in multiparty systems:
When the voter is confronted with five or more parties, the information costs and the indeterminacies multiply exponentially, and some drastic simplification becomes a sheer necessity. In this context, the average voter should be a kind of computer if we expect him to relate – following Stokes – several dimensions of cleavage to several issue performances, and these performances to the issue platforms of several parties. (Sartori, Reference Sartori1976, p. 304)
This expectation goes against the clarity mechanism of party polarization, which may well be limited to unidimensional systems instead. This is because information on parties’ shifts in position and their relative divergence on both axes of party competition should become more costly as each dimension becomes more orthogonal to the other. For instance, this should be particularly prevalent when parties polarize simultaneously on both dimensions or choose to polarize on one dimension while maintaining their position on the second dimension. The clarity mechanism might thus be reversed in multidimensional systems, where each axis of party competition is entirely orthogonal to the other and could complexify the alternatives in a political system instead. This leads to the following party system clarity hypothesis:
Party system clarity hypothesis
H3: The greater the party system unidimensionality, the stronger the positive relationship between party polarization and turnout.
In addition to the party system multidimensionality moderating effect at the aggregate level, the polarization on two dimensions of party competition should also be consequential for the congruence and clarity mechanisms according to voters’ individual characteristics. First, the differential polarization on each dimension should mobilize disproportionately those for whom the political offer represents a congruent political choice, namely, the most extreme citizens on the same, polarized issue dimension. Second, polarization, by affecting the clarity of political alternatives, might disproportionately mobilize groups that have been identified in the literature as the most (least) sensitive to party cues and political shifts (Basinger & Lavine, Reference Basinger and Lavine2005; Fiorina & Abrams, Reference Fiorina and Abrams2008; Zaller, Reference Zaller1992). This should be especially true when parties polarize on several issue dimensions, where party cues become critical for the accessibility of political information on the political offer for these different groups of voters.
With regard to the first, congruence mechanism, one of the benefits of party polarization for electoral mobilization is that it offers broader political alternatives. This should give a new electoral choice to citizens who did not have their political views represented at the extreme ends of the political spectrum. For these citizens, this congruence mechanism should increase the incentives to vote but only when parties polarize on the issue dimension on which they hold their extreme views. In other words, I expect citizens with more extreme views on GAL‐TAN or economic issues to be disproportionately mobilized by the broadening of the political offer on the corresponding political dimension. I therefore test the following congruence hypothesis at the individual level:
Congruence hypothesis
H4: Extreme citizens on an issue dimension are more likely to turn out when parties polarize on the corresponding issue dimension.
When it comes to the role of polarization in fostering clarity, the literature has found contrasting findings regarding the extent to which electoral mobilization is concentrated among the ‘usual suspects’, the most partisans and politically aware, or those that are typically most remote from political conflict. A first group of scholars argued that the most partisan, activist, and politically aware citizens, were more likely to turn out as a result of party polarization, while the least politically aware citizens remained unaffected by elites’ division (Fiorina & Abrams, Reference Fiorina and Abrams2008). This is so because these more engaged groups of voters are more aware and sensitive to party shifts. This suggests that party polarization has a heterogeneous effect, such that only the more partisan and politically aware citizens should be more likely to turn out as polarization increases. In the context of party polarization on two dimensions where political information is more costly, this mechanism could be reinforced but remains so far untested in the literature.
On the other hand, a second group of scholars has argued that information on party positions becomes less costly and party cues more efficient as parties diverge (Abramowitz & Saunders, Reference Abramowitz and Saunders2008; Levendusky, Reference Levendusky2010; Zaller, Reference Zaller1992). Clearer information on parties’ positions should not necessarily disproportionately affect those who are usually the most attentive to politics. In fact, the level of turnout of the most partisan and politically aware citizens should be comparatively unaffected by increased cue clarity due to party polarization as they already possess the most information on parties’ positions, are less prone to updating their voting decision, and turn out to a greater extent regardless of the electoral context (Basinger & Lavine, Reference Basinger and Lavine2005; Zaller, Reference Zaller1992). Therefore, an alternative expectation could be that party polarization, by increasing cue clarity and making information about the political alternatives more readily accessible, should lead to increased turnout among the non‐partisan and least politically interested, especially in contexts where parties compete on multiple dimensions where this clarification becomes critical for voters. I test these two alternative hypotheses on each of the political dimensions by looking at heterogeneous effects among the most/least partisan and politically aware, respectivelyFootnote 1:
Political awareness versus cue clarity hypotheses
H5a: The more partisan citizens are more (less) likely to turn out than non‐partisans as party polarization increases.
H5b: The more politically aware citizens are more (less) likely to turn out than the less politically aware as party polarization increases.
In this article, I conduct two studies at the aggregate and individual levels, which enables me to test these hypotheses at the relevant level of analysis. While the first study enables me to test the party system polarization and unidimensionality hypotheses, the second study further confirms that these findings are not subject to ecological fallacy and test for individual‐level mechanisms and heterogeneous effects. To account for the nested structure of the data and accurately exploit the variation of polarization on the two dimensions of party competition at the country level over time, these two studies adopt a multilevel approach. The following section begins with the aggregate level analysis.
Analysis at the party system level: Party polarization and turnout in a multidimensional space
The first part of the analysis aims to test the aggregate‐level hypotheses. In particular, I test whether polarization on both dimensions is related to higher turnout and whether the clarity stemming from the unidimensionality of a system reinforces this relationship (Hypotheses 1–3). To test these hypotheses, I conduct a multilevel analysis of 23 European countries from 1999 to 2019, gathering indicators of polarization on both dimensions and turnout in 111 elections. Even though this study is conducted at the aggregate level, the multilevel approach enables me to account for the longitudinal structure of the data where several elections over time are nested in countries by including country random intercepts in the model.Footnote 2 The dependent variable is voter turnout of registered voters in parliamentary elections.
Measuring party polarization and electoral mobilization: An aggregate multilevel analysis
The main independent variables are the levels of party polarization on economic and cultural dimensions. Data from the Chapel Hill Expert Survey (Bakker et al., Reference Bakker, Vries, Edwards, Hooghe, Jolly, Marks, Polk, Rovny, Steenbergen and Vachudiva2015) have been selected to create a party polarization index by country and show their evolution through time on seven time points (1999, 2002, 2006, 2010, 2014, 2017, and 2019). This expert survey possesses four advantages. First, it provides data on party positions (on a 0–10 points scale) beyond the left‐right scale, notably by distinguishing parties’ positions on the economic and GAL‐TAN dimensions. Second, experts’ positioning of parties takes into account a broader range of information than parties’ statements in manifestos and does not conflate the measure of party position with issue salience for the party. Third, as the main interest of this study is citizens’ electoral behaviour as a result of party polarization, expert surveys have the advantage of correlating most strongly with citizens’ perceptions compared to other measures of party positions (Adams et al., Reference Adams, Ezrow and Somer‐Topcu2014; Bakker et al., Reference Bakker, Vries, Edwards, Hooghe, Jolly, Marks, Polk, Rovny, Steenbergen and Vachudiva2015).
An index distinguishing party polarization on these two dimensions has been developed following an established measure in the scholarship. As a control, a left‐right polarization index was also created. This measure of party polarization takes into account both the dispersion of parties on a given scale as well as their weight in the party system (Dalton, Reference Dalton2008; Ezrow, Reference Ezrow2007; Kriesi et al., Reference Kriesi, Grande, Lachat, Dolezal, Bornschier and Frey2008; Lachat, Reference Lachat2008; Sigelman & Yough, Reference Sigelman and Yough1978; Taylor & Herman, Reference Taylor and Herman1971). One of the strengths of this party polarization measure is that it accurately accounts for competitors’ relevance at the extremes without overestimating their weight in the overall party system. In addition, this measure focuses not only on extreme parties but also considers potential mainstream parties’ shifts, which matters when assessing the overall level of polarization in multiparty systems and its effect on voters’ behaviour (Abou‐Chadi, Reference Abou‐Chadi2016; Spoon & Klüver, Reference Spoon and Klüver2019). This approach is equivalent to the standard deviation of party positions weighted by their vote share, with the modification introduced by Dalton (Reference Dalton2008) where polarization ranges from 0 when all parties share the same position to the maximum value of 10 where all parties are on the extremes of the scale. The polarization index (PI) formula is as follows:
 $$\begin{equation*}PI\ = \ \sqrt {\sum_{i\ = \ 1} \left( {{{w}_i}*{{{\left( {\ \frac{{{{p}_i} - \ \bar{p}}}{5}} \right)}}^2}} \right),} \end{equation*}$$
where wi is the share of the vote received by party i, pi is the position of party i on the given scale and $\overline {p\ } $ is the weighted average position of the parties.
The sample includes all countries for which at least two observations for these polarization indexes were available as the variation of polarization within a country is the main independent variable of interest.Footnote 3 The final sample of 23 countries thus includes Austria (AT), Bulgaria (BG), Czech Republic (CZ), Germany (DE), Denmark (DK), Estonia (EE), Spain (ES), Finland (FI), France (FR), Great Britain (GB), Greece (GR), Hungary (HU), Ireland (IE), Italy (IT), Lithuania (LT), Latvia (LV), the Netherlands (NL), Poland (PL), Portugal (PT), Romania (RO), Sweden (SE), Slovenia (SI) and Slovakia (SK).
To measure party‐system unidimensionality and test the second hypothesis, I use a weighted correlation coefficient between parties’ positions on the economic and GAL‐TAN scales.Footnote 4 These positions are extracted from the CHES dataset for the same years and countries as the polarization index. These parties’ positions are weighted by parties’ vote shares to account for their importance in terms of visibility and for the party system competition without overestimating the role of smaller parties. Finally, and importantly, as this indicator aims to assess unidimensionality and not the directionality of the party competition axis, the coefficient strength (and not its sign) was used. This enables me to assess unidimensionality in post‐communist countries, where this correlation has an opposite sign compared to Western countries.Footnote 5 I thus use the absolute value of this correlation coefficient.Footnote 6
In addition to the main independent variables, the models control for potential confounders influencing electoral mobilization identified by the literature. I control for population size as a measure of citizenry homogeneity in smaller countries, unicameralism for the elections’ decisiveness, and the electoral system dummy for proportional representation (PR) systems, which were shown to systematically affect turnout (Blais, Reference Blais2006; Geys, Reference Geys2006; but see Stockemer, Reference Stockemer2017 regarding PR systems).Footnote 7 A post‐communist country control variable is included as many of the post‐communist systems are characterized by less stable party systems, higher electoral volatility, and systematically lower turnout levels compared to Western European democracies (Blais & Dobrzynska, Reference Blais, Dobrzynska, DeBardeleben and Pammett2009; Kostelka, Reference Kostelka2017; Tavits, Reference Tavits2008). Finally, as the CHES survey is conducted in several waves ranging from 2 to 4 year laps, election dates do not necessarily correspond to the year when experts were interviewed to determine the position of current parties. The two datasets were matched based on the election date, where the closest measure of party positions before the election was chosen in case where two waves of expert data on party positions were available. However, to account for the resulting time discrepancies between the measured party polarization and the election date across countries and elections, I include an indicator for the number of years between the expert survey and the election date.Footnote 8
Clear political alternatives and electoral mobilization: The role of polarization on the cultural dimension
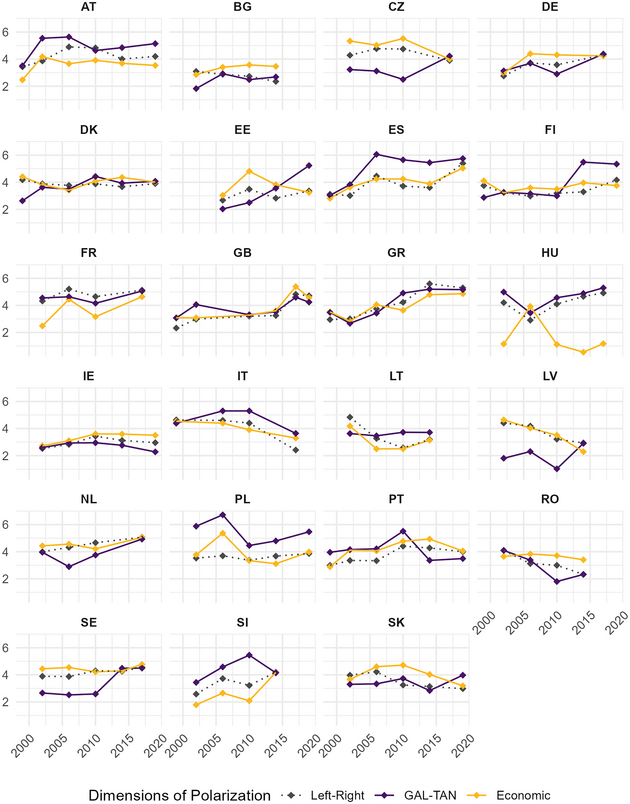
Why distinguish party polarization according to the different dimensions of party competition in the first place? I begin the analysis with some descriptive evidence confirming the high variation in trends of party polarization depending on the political dimension of interest. Figure 1 displays the evolution of the polarization indexes on the left‐right, economic and cultural scales over time in the 23 selected countries, where time is displayed on the x‐axis while the polarization indexes, ranging from a score of 2–6 according to national contexts, are displayed on the y‐axis.
Trends in left‐right, economic and GAL‐TAN polarization 1999–2019.
Note: Author's own calculations based on CHES data. Plots include party system polarization levels in each survey wave available. (See Supporting Information Table A3 for all the polarization indexes.)

A few observations can be drawn from this figure. First, in most countries, trends in polarization on the two dimensions or the conventional left‐right scale do not follow the same pattern.Footnote 9 While polarization on the economic or the left‐right dimension seems to be correlated to a greater extent, polarization on the GAL‐TAN dimension follows a more independent trend, except in the case of Hungary. However, some party systems display similar trends, such as the United Kingdom, Ireland and Italy. Second, parties seem to have polarized to a greater extent on the GAL‐TAN dimension than on other dimensions of party competition, with the noteworthy exceptions of Italy, as well as Portugal and Slovenia in recent years. In most of these party systems, this polarization on the cultural dimension took place following the 2010s (see, e.g., Sweden, Estonia, the Czech Republic and Sweden).
However, this trend has been visible since the early 2000s in other countries, such as Austria or Spain. As these patterns remain hard to grasp visually, I formally test this observation by regressing each party polarization index with time, including country fixed effects and clustered standard errors, and show that GAL‐TAN polarization significatively increases across waves of observation.Footnote 10
Finally, contrary to some authors’ claims in the field (see Hellwig, Reference Hellwig2008; Steiner & Martin, Reference Steiner and Martin2012), the figure also shows that there is no strong convergence trend on the economic axis. The polarization index on the economic dimension, on the contrary, is striking for its relative stability across national contexts. In some countries, such as France, Spain, the United Kingdom, Greece and Slovenia, polarization even increased in recent years, particularly following the economic crisis.
In accordance with the literature on the emergence of a new cleavage in European politics, this descriptive evidence confirms that (1) polarization on the two dimensions and the left‐right axis does not necessarily follow similar trends, (2) overall party polarization on the cultural scale has increased to a greater extent than polarization on the economic scale and (3) measuring polarization on the left‐right scale does not enable us to capture these shifts and variation in European multiparty systems. With these crucial clarifications in mind, I now turn to testing my hypotheses.
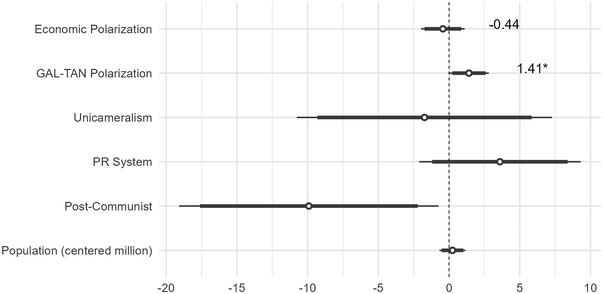
At the aggregate level, I expect party polarization to be related to higher turnout (H1), and particularly so on the cultural dimension (H2). In addition, this positive effect should become more substantial as the party system becomes more unidimensional (H3), since it should improve the clarity of political alternatives in multiparty systems. The coefficients of the first multilevel model displayed in Figure 2 partially support my first hypothesis. Party polarization is related to an increase in turnout levels, but only when parties polarize on the cultural (GAL‐TAN) dimension of party competition. As the figure shows, a one‐point increase in party polarization leads to a turnout increase of 1.41 percentage points, everything held constant. Conversely, party polarization on the economic scale is not significantly related to changes in turnout. This result holds when all country‐level relevant variables identified by the literature on electoral participation are included. In that regard, it seems important to note that once polarization indexes are included in the model, neither the decisiveness of elections (unicameralism), societal homogeneity (population size) or the representativeness of the party system (PR system) is statistically significant. The only statistically significant relationship to be found is in post‐communist systems, where turnout is lower by 10 percentage points on average, everything else held constant. In addition, further analysis shows that there is no relationship between party polarization and turnout when polarization is measured on the classical left‐right axis.
Coefficient plot – effect of dimensions of polarization on aggregate turnout.
Note: Estimates are from Supporting Information Table A7, Model 5. Multilevel model with country‐level random intercept and election year fixed effects. Effects are indicated with 0.9 (thin line) and 0.95 (thick line) confidence intervals.

This finding somewhat contradicts Hypothesis 1, where I expected polarization to always be positively related to turnout. By contrast, I find that not any type of party polarization is positively related to turnout but that only polarization on the second dimension of party competition fosters electoral participation, which supports my second hypothesis of the realignment of the party system on this dimension.
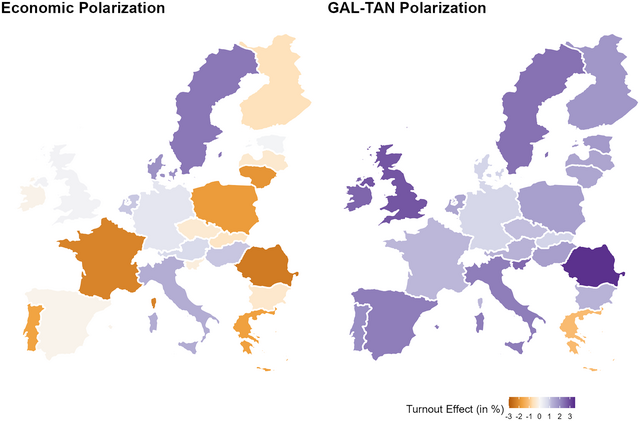
This result also holds across national contexts. Multilevel models allow me to account for random slopes of the relationship between polarization and turnout and enable a more detailed picture of this effect for each country, albeit calling for a cautious interpretation given the limitations of such estimates.Footnote 11 Figure 3 displays the coefficient of economic and GAL‐TAN polarization for each country of the sample. As the figure shows, there is a great deal of variation when it comes to the effect of party polarization on the economic scale. In most countries (e.g., the United Kingdom, Ireland, Spain, Germany, Estonia and Latvia, to cite a few), this effect is almost always null, and many countries display a negative relationship (see France, Portugal and Romania). The story is quite different when we look at the variation in the effect of GAL‐TAN polarization on turnout, where the relationship is positive in all countries of the sample, except Greece. Interestingly, some countries that have opposite relationships between party polarization and turnout (see Romania, France and Portugal) also share some important characteristics, namely a relatively higher level of polarization on the economic dimension, coupled with either stable (France) or decreasing polarization on the GAL‐TAN dimension (such as Portugal and Romania). This may be partly due to the presidential nature of these systems, which may fare less well in representing new parties driving polarization on the GAL‐TAN axis while maintaining the stronghold of mainstream parties focusing their traditional core of party competition on the economic dimension. A more fine‐grained, comparative case analysis with better suited data should explore this hypothesis, which goes beyond the scope of this paper. Overall, this figure further supports the findings stemming from the new cleavage literature and party system realignment (Hooghe & Marks, Reference Hooghe and Marks2018; Kriesi et al., Reference Kriesi, Grande, Lachat, Dolezal, Bornschier and Frey2008; Rovny & Whitefield, Reference Rovny and Whitefield2019) as party competition and polarization around the second dimension of party competition seem to structure electoral mobilization across a wide variety of European national contexts.
Country effect of dimensions of party polarization on turnout.
Note: The figure displays the country estimated effect of economic and GAL‐TAN party polarization on turnout. Estimates are based on Model 5 (Supporting Information Table A7). Coefficients and their standard errors for each country can be found in Supporting Information Table A9.

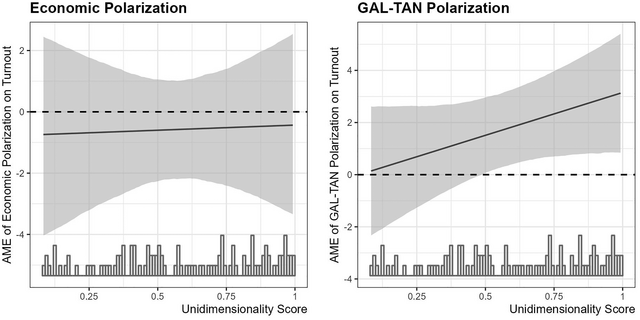
Can some of this variation be explained by another factor of party competition in European multiparty systems, more specifically, the degree of unidimensionality of their party systems? I answer this question by assessing the interaction of party polarization on each dimension with the (vote share) weighted correlation of parties’ economic and GAL‐TAN positions in the same year as the polarization indexes. According to my third hypothesis, polarization, coupled with party system unidimensionality, should clarify political alternatives and incentivize voting.
Figure 4 displays the average marginal effect (AME) of party polarization conditional on the level of unidimensionality between the two dimensions of parties’ positions. The figure confirms the lack of a relationship between economic polarization and turnout. Furthermore, it shows that the positive and significant effect of party polarization is concentrated at the highest levels of party system unidimensionality (correlation coefficient >0.5). Party polarization on the GAL‐TAN dimension is not related to turnout when party systems are highly multidimensional. With higher levels of unidimensionality, the positive effect of party polarization on turnout increases as the overlap between parties’ positions on the two dimensions grows. This finding supports the third hypothesis and provides evidence for a party system clarity hypothesis, where party polarization clarifies political alternatives when parties become more aligned on the economic and cultural dimensions of party competition. This provides further evidence that the multidimensionality of the party system matters as it is an important moderator of the party polarization effect on electoral mobilization.
Average marginal effect of dimensions of party polarization on turnout at different levels of party system unidimensionality.
Note: Average marginal effects and 95 per cent confidence intervals are shown. Estimates come from Model 3 in Supporting Information Table A10.

The following analysis turns to individual‐level mechanisms, which cannot be assessed using country‐level turnout rates. This second study more closely assesses congruence, political awareness and cue‐taking mechanisms to determine whether party polarization affects specific groups of voters heterogeneously.
Polarization and turnout at the individual level: Congruence, cue clarity or ‘usual suspects’?
The goal of this second study is twofold. First, I test whether the positive relationship between party polarization on the GAL‐TAN dimension and the likeliness to turn out holds at the individual level across national contexts. In the second stage, it assesses whether polarization fosters mobilization of the most extreme citizens on each issue dimension, as expected by the congruence mechanism (H4), and whether polarization mobilizes specifically the more partisan and politically aware through a political awareness mechanism or the less partisan and politically interested through a party cue‐taking mechanism (H5a and H5b).
Measuring and modelling individual mobilization
To examine these individual mechanisms, I now rely on a multilevel dataset combining the CHES‐based polarization index and aggregate‐level dataset merged with the ESS. This results in a subsample of countries and elections compared to the prior aggregate analysis, with 146,278 respondents nested in 81 elections and 21 countries from 1999 to 2018.Footnote 12 The merging of the two datasets follows the same approach as the aggregate level, where individual‐level responses are matched with the closest corresponding wave of the polarization index before the election date mentioned in the ESS survey.Footnote 13
The dependent variable becomes electoral mobilization at the individual level. I use respondents’ self‐reported turnout in the previous parliamentary election.Footnote 14 Respondents are coded 1 when declaring to have voted in previous elections, 0 if reporting the reverse, and ‘don't know’ or NA otherwise (notably those not eligible to vote). Because my dependent variable is dichotomous and strongly skewed towards the ‘turnout’ answer, logistic models were adopted. The nested structure of the data is taken into account by conducting multilevel models with random intercepts on the country/wave level nested in the country level, with fixed effects for each wave.Footnote 15 Following the recommendation for cross‐classified (country and time) data structure by Schmidt‐Catran and Fairbrother (Reference Schmidt‐Catran and Fairbrother2016), when testing for a cross‐level interaction, in particular for Hypotheses 4 and 5, I include a random slope for the interacting individual‐level variable.
To test the congruence hypothesis (H4), issue extremism on the cultural and economic dimensions is measured using attitude strength towards these issues. I selected attitudes towards economic redistribution from the state to measure extremism on the economic dimension, while I selected both positions on immigration and LGBT rights for the GAL‐TAN dimension, as there is not a single issue that encompasses the GAL‐TAN dimension, especially across contexts. These measures, ranging on alternatively 5‐point or 10‐point scales, have been folded at the mid‐point and rescaled between 0 and 1, where 0 indicates issue moderation and 1 indicates issue extremism. Answering ‘Don't Know’ to this question is considered equivalent to a lack of extremism on the issue for the individual and was coded as 0.Footnote 16 For the immigration issue, several attitude indicators were available. To enhance the reliability of this issue extremism measure, I rely on an additive index of three attitudes towards immigration (α = 0.72) before following the same folding and rescaling approach.Footnote 17
Finally, I test the alternative political awareness and cue clarity hypotheses using indicators of political interest and partisanship. I use political interest as a proxy for political awareness. Although ideally, a broader measure using factual political knowledge answers should have been used, I selected the proxy of political interest for its similar effect on political knowledge (Krosnick & Brannon, Reference Krosnick and Brannon1993), its reliability compared to self‐reported media use (Zaller, Reference Zaller1992), and the fact that it was not already part of my model (i.e., political participation being my dependent variable and education level being a control). This 4‐point scale was treated as a continuous variable and rescaled from 0 to 1. I measure partisanship, the second individual‐level moderator, using a continuous variable on a 5‐point scale rescaled from 0 to 1 using a party closeness indicator.
I control for the same variables at the aggregate level as the prior analysis. At the individual level, I rely on the work of Smets and van Ham (Reference Smets and Ham2013), who show that the classical resource model of turnout applies and that ‘those with jobs, a high income, and a high socioeconomic status are more likely to have a wider range of resources and are, thus, more likely to vote’ (Smets & van Ham, Reference Smets and Ham2013, p. 348). Therefore, education (1), unemployment (2), age (3) and gender (4) are included as controls in the models.
Electoral mobilization across groups: The widespread effect of polarization on the cultural dimension
Do the results identified above hold when we account for individual factors and cofounders of the relationship between party polarization and electoral mobilization? The individual‐level logistic models confirm that only party polarization on the GAL‐TAN axis is related to increased electoral participation, while party polarization on the economic axis seems unrelated to voter mobilization.
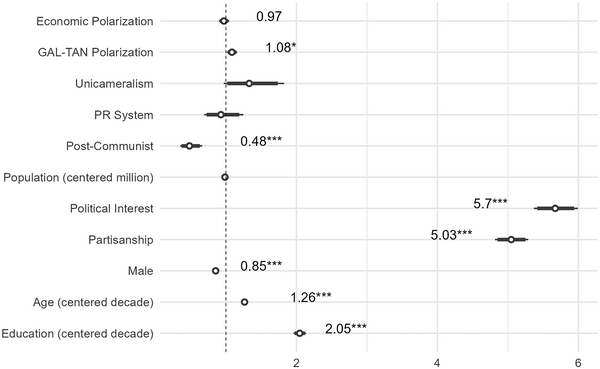
Figure 5 displays the odds of our multilevel model accounting for both contextual and individual factors. As the plot confirms, a one‐point increase in party polarization on the economic scale does not affect electoral mobilization. Party polarization on the GAL‐TAN axis is positively and significantly related to higher turnout at the individual level. A one‐point increase in party polarization on the cultural axis increases the odds of turnout by 1.08 points. More substantively, going from the low level of GAL‐TAN polarization of 3 (equivalent to the first quartile of the GAL‐TAN polarization distribution) to about 4.5 (the third quartile) increases the predicted probability to turn out by about 2 per cent. This finding might seem substantially small; however, the effect of a one‐point increase in party polarization on the GAL‐TAN axis is similar to the effect of an additional year of education.Footnote 18 Further tests indicate that this positive relationship, again, is not reducible to left‐right polarization and is driven by within‐country and not cross‐country variation of polarization.Footnote 19 I now turn to the individual mechanisms to explore whether increased polarization affects groups of citizens heterogeneously. As a reminder of my hypotheses, following a congruence mechanism (H4), I expect the most extreme citizens on economic or cultural issues to be disproportionately mobilized by party polarization on the corresponding issue dimension. In addition, following the debate between the cue clarity or political awareness mechanism (H5a, H5b), I test whether citizens most remote from party competition or the ‘usual suspects’ – the most partisan and politically interested – are more likely to turn out when party polarization increases.
Odds plot – the effect of dimensions of polarization on individual‐level turnout.
Note: Odds ratios from Model 3 in Supporting Information Table A12. Multilevel model with country‐level and country‐wave‐level random intercepts with CHES wave fixed effects. Effects are indicated with 0.9 (thin line) and 0.95 (thick line) confidence intervals. Non‐statistically significant odds are not shown.

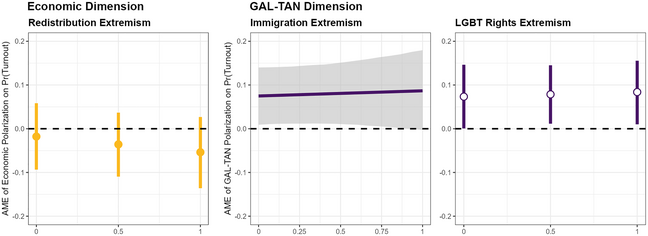
Does polarization enable the most extreme voters to express their preferences and motivate them to cast a vote? To answer this question, the multilevel models now include a cross‐level interaction between individuals’ extremism on economic and cultural issues and party polarization on the corresponding issue dimension. This interaction coefficient is not significant, suggesting that citizens are not more likely to turn out when holding a more extreme position on the issue dimension on which parties polarize. Figure 6 displays the average marginal effect of party polarization on the two dimensions at different levels of issue extremism. The left panel displays the marginal effect of economic polarization on the predicted probabilities of turnout at different levels (low, medium, high) of issue extremism on the state's economic redistribution role. The two right panels indicate the average marginal effect of GAL‐TAN polarization at different levels of extremism on the LGBT rights and immigration issues.
Average marginal effect of party polarization on individual turnout at different levels of extremism.
Note: Average marginal effects and 95 per cent confidence intervals are shown. Estimates come from Models 1–3, in Supporting Information Table A15.

Contrary to my expectations, economic polarization does not have a disproportionate mobilizing effect for citizens with the most extreme preferences in terms of economic policies; the lack of relationship between economic polarization and electoral mobilization is confirmed regardless of the level of extremism. Similarly, party polarization on the GAL‐TAN scale seems to mobilize moderate and extreme citizens to a comparable extent, regardless of the non‐economic issue considered. The results suggest that this positive effect is concentrated among the most extreme citizens on the LGBT rights issue and the most moderate on the immigration issue, but the confidence intervals clearly overlap across groups, which suggests no significant differences among moderate and extreme voters.
In the final models, I test the extent to which party polarization leads to the mobilization of citizens who are typically distanced from party competition. According to the party cue model, I would expect to find a significant negative interaction between polarization and the level of political interest and partisanship, since the mobilization effect would increase among the most politically remote citizens as they gain new and clearer information about parties’ positions. Conversely, according to theories suggesting the mobilization of the most politically aware, the interaction should be positive as these citizens should be the most sensitive to party shifts and higher stakes behind polarized elections.
However, the findings displayed in Figure 7 do not provide clear support for either of these two alternative hypotheses. The figure displays the average marginal effect of party polarization on the economic and GAL‐TAN axes among the most and least politically interested citizens in the left panels and at different levels of partisanship in the two right panels. The confidence intervals overlap across all groups of citizens, suggesting that there is no heterogeneous effect of party polarization according to levels of political interest and partisanship. A closer look at the effect of GAL‐TAN polarization suggests that the least politically interested seem to remain unaffected by the increase of polarization, which goes against the party cue hypothesis. However, the positive effect of GAL‐TAN polarization on the propensity to turn out seems to solely affect the weak and non‐partisan, which in turn contradicts the political awareness hypothesis and suggests a cue‐taking effect. Again, these groups’ differences should not be overstated, as the interaction coefficient of each of these models does not reach statistical significance. Overall, these findings still suggest that GAL‐TAN polarization fosters turnout across all groups of citizens, while party polarization on the economic dimension does not.
Average marginal effect of party polarization on individual turnout at different levels of political interest and partisanship.
Note: Average marginal effects and 95 per cent confidence intervals are shown. Estimates come from Models 1 (left) and 2 (right) in Supporting Information Table A14.

How robust are these findings? While being consistent at the aggregate and individual levels, I first assess whether the positive relationship between GAL‐TAN polarization and turnout rests upon the operationalization of the party polarization concept. While far from being a perfect measure of the overall party system polarization, I use the vote share of radical right parties as a proxy, given that these parties have been the main driver of polarization towards the traditional‐authoritarian‐nationalist end of the axis over the period studied, while remaining ambiguous on their economic position (Kriesi et al., Reference Kriesi, Grande, Lachat, Dolezal, Bornschier and Frey2008; Rovny, Reference Rovny2012). This approach shows similar results as the one presented above, although polarization on the cultural dimension, solely driven by radical right parties (overlooking the extent of party position shifts or polarizing movement from mainstream parties), is only weakly associated with turnout. This result also holds when accounting for economic polarization in the model or using radical left party vote share as a proxy for economic polarization.Footnote 20
Could my findings be driven by the fact that the political alternatives are enhanced by the mere number of parties, rather than their ideological spreading? I test this alternative mechanism in an additional analysis, using the Herfindhal index as a party system fragmentation indicator. These additional models show that party system fragmentation is never associated with turnout and that GAL‐TAN polarization is still significantly associated with higher electoral mobilization, even when accounting for fragmentation. This suggests that it is the hypothesized mechanism that is at play in mobilizing voters, meaning that it is the ideological spreading, and not the number of parties, that provides a clear choice to voters. Finally, further analyses available in the Supporting Information also show that these findings are not sensitive to the model specification, the multilevel model approach, and hold when excluding one country at a time from the sample. Overall, these additional analyses give further support to the findings presented above.Footnote 21
To summarize, I find that party polarization on the GAL‐TAN dimension is the only type of polarization that is associated with a higher likelihood to turn out. This positive effect is concentrated in more unidimensional party systems, suggesting that the clarity of political alternatives stemming from polarization is improved when parties’ economic and cultural positions overlap. However, contrary to my expectations at the individual level, I find no evidence of heterogeneous effects across groups of citizens. Party polarization on the GAL‐TAN issue mobilizes partisans and non‐partisans, the more and less politically aware, as well as moderate and extreme citizens on these issues. I discuss these findings and their implications further in the concluding section.
Conclusion: The mobilizing power of party polarization and alignment on the cultural dimension
Party polarization is increasing in European multiparty systems, and its consequences for electoral participation are important for the working of our representative democracies. This article draws a clearer picture of the relationship between party polarization and turnout through a comparative and longitudinal perspective. In particular, I show that taking into account the multidimensionality of party systems matters for understanding this relationship in European multiparty systems. I find that only party polarization on the cultural dimension of party competition is associated with increased turnout at the aggregate and individual levels. Furthermore, this effect becomes stronger the more parties align themselves around this new cultural line of conflict. This means that the multidimensionality of party systems is key to moderating the effect of party polarization on electoral mobilization. As parties compete on a more unidimensional scale, the new political alternatives should become clearer to citizens, leading to their electoral mobilization. This finding is consistent with a large body of works emphasizing the increasing importance of the cultural dimension in structuring party competition and the role of this emerging cleavage structure in European politics in shifting political behaviour (Ares, Reference Ares2022; Hillen & Steiner, Reference Hillen and Steiner2020; Hooghe & Marks, Reference Hooghe and Marks2018; Inglehart & Flanagan, Reference Inglehart and Flanagan1987; Kriesi et al., Reference Kriesi, Grande, Lachat, Dolezal, Bornschier and Frey2008; Lipset & Rokkan, Reference Lipset and Rokkan1967; Steiner & Martin, Reference Steiner and Martin2012).
What is more, and perhaps surprising for the literature, is that polarization on the cultural dimension appears to mobilize all kinds of voters equally. First, I show that party polarization on the GAL‐TAN axis increases the likelihood of voting for both the most moderate and the most extreme citizens on cultural issues alike. This finding runs counter to a congruence mechanism, where one would expect that citizens who were not represented on these issues (i.e., the most extreme) would be mobilized to a greater extent when offered ‘true alternatives’ on this issue‐dimension. This finding could be explained by an alternative mechanism, where both moderate and extreme citizens perceive higher stakes in elections when political alternatives broaden on the increasingly important cultural dimension. An alternative way to test this mechanism would be to assess the salience of economic and cultural issues for citizens. Citizens for whom cultural issues are more important, regardless of their position, should feel that there is more at stake in participating in an election where parties polarize extensively on this issue dimension. In this case, however, we are limited by the data available in this comparative quantitative analysis as no individual salience indicator was available in the ESS data to test this alternative explanation. Further research should test this alternative mechanism.
Second, while there are strong expectations stemming from the literature that groups of citizens should be affected heterogeneously by growing party polarization, I find no evidence of differential effects according to citizens’ levels of partisanship or political interest. These null findings at the individual level suggest two explanations that have different normative implications for the working of our representative democracies. On the one hand, this result could further support the idea that we are experiencing a new alignment and shift of the political system towards a new cleavage where citizens would be electorally mobilized if parties offered greater alternatives on new (non‐economic) issues. On the other hand, it seems quite surprising that this new type of polarization affects all kinds of citizens, while previous research points towards heterogeneous effects across groups (Fiorina & Abrams, Reference Fiorina and Abrams2008; Fiorina et al., Reference Fiorina, Abrams and Pope2010; Lachat, Reference Lachat2008; Rogowski, Reference Rogowski2014; Zaller, Reference Zaller1992). An alternative mechanism to the one explored in this study could be that polarization on these issues not only increases the perception of broader ideological alternatives but also is related to identity and affect divisions. Polarization over immigration, the environment, or law and order, as opposed to economic issues, may do more than highlight and clarify policy alternatives, such as increasing perceived divisions and negative affect between social groups (Ellger, Reference Ellger2023). This paper cannot rule out the possibility that it is affective and not only ideological polarization that drives electoral mobilization. In that case, the surge of voter turnout may not be such a normatively desirable outcome, especially if the driver of mobilization is not related to the perception of broader political alternatives, but rather to social groups’ divisions and affects. Further research should examine individuals’ perceptions of parties’ ideological polarization in order to assess their broader normative implications for political participation.
Finally, this analysis based on cross‐sectional and observational data is not exempt from some limitations. The most important weakness of this analysis is that although the model specification was careful in assessing turnout after shifts in party polarization and includes a coherent set of potential cofounders of this relationship, this analysis – based on observational data without a causal identification strategy – cannot rule out the possibility that changes in turnout, or predicted electoral mobilization, leads to shifts in parties’ positions. The conclusions from this analysis, and the directionality of the relationship, should be further explored using a more causal and experimental approach. However, the strength of this study lies in its comparative and time trend approach, which enables it to draw more generalizable conclusions than an experiment or causal design based on a specific case or a natural experiment at a given point in time would allow. Overall, this study shows that the positive relationship between party polarization on the cultural dimension and turnout holds across European contexts. This suggests that new research should move away from the analysis of party shifts and voters’ response in terms of the classical left‐right definition of party competition rooted in the economic cleavage.
Acknowledgements
I would like to thank the anonymous reviewers for their excellent and constructive comments. Earlier versions of this manuscript were presented at the 2019 Economics and Politics (EP@L) workshop, the 2020 Leuven‐Montréal Winter School on Elections, the EUI Political Behavior Workshop, as well as to the Qualidem UCLouvain and the Center of Civil Society Research WZB research teams. I would like to thank all those who provided feedback on those occasions. I am particularly grateful to Virginie Van Ingelgom, Ellen Immergut, Hanspeter Kriesi and Rune Slothuus as well as to Daniel Bischof, Ruth Dassonneville, Levente Littvay, Raul Magni‐Berton and Alina Vranceanu, for their careful reading and detailed feedback on earlier versions of this article.
Data Availability Statement
Data and the reproducible code for the analysis are available on OSF Registries through the following link: https://doi.org/10.17605/OSF.IO/XPHTF
Online Appendix
Additional supporting information may be found in the Online Appendix section at the end of the article:
Table A1: Matching CHES year, election date, ESS interview date and year
Table A2: Main variables wording and variable transformations
Table A3: Summary statistics Individual and Aggregate level
Table A4: Polarization indexes
Table A5: Unidimensionality Scores: Absolute (Pearson) Weighted Correlation (by party vote share) of Economic and GAL‐TAN Party Positions
Table A6: (Pearson) Correlation Coefficients – Polarization Indexes and Unidimensionality scores
Table A7: REML – Effect of Dimensions of Polarization on Aggregate Turnout
Table A8: Aggregate Linear Model – Time Effect on Polarization (Country FE and clustered standard errors)
Table A9: Effect of Party Polarization on Turnout – Country Coefficients and Standard Errors
Table A10: Aggregate Linear Model – Interaction Effects of dimensions of polarization and Unidimensionality on Aggregate Turnout
Table A11. A: Principal Component Analysis
Table A11.B: Immigration Index Cronbach Alpha
Table A12: Multilevel Logistic Model (With country random intercepts) – Effect of Party Polarization on Individual Turnout
Table A13: Logistic multilevel model – Effect of (centered and mean) dimensions of polarization on turnout
Table A14: Logistic multilevel models – Interaction effect of political interest and partisanship with dimensions of polarization on turnout
Table A15: Logistic multilevel models – Interaction effect of issue extremism with dimensions of polarization on turnout
Table A16: OLS Model with Fixed Effects and Country Clustered Standard Errors – Effect of Dimensions of Polarization on Aggregate Turnout
Table A17: OLS model with country clustered standard errors – Effect of dimensions of polarization on turnout
Table A18: Logistic model with country clustered standard errors – Effect of dimensions of polarization on turnout
Table A19: Aggregate and Individual Models – Effect of dimensions of polarization on turnout (Mandatory Voting Control)
Table A20: Logistic multilevel models – Interaction effect of issue extremism with dimensions of polarization on turnout (double interaction)
Figure A21: Significance Jackknifed GAL‐TAN Estimator
Table A21: Jackknife Test for GAL‐TAN Estimator
Table A22: Aggregate Model – Interaction Effects of dimensions of polarization and dimensional association (Rovny & Polk, Reference Rovny and Polk2019) indicator on aggregate turnout
Figure A22: Average Marginal Effect of Dimensions of Party Polarization on Turnout at Different Levels of Party System Dimensional Association
Table A23: Aggregate Models – Effect of party system fragmentation (Herfindahl index) on turnout
Table A24: Logistic multilevel models – Radical Right (RR) parties vote share effect on turnout
Table A25: Logistic multilevel models – Interaction effect of recoded (‘Don't Know’ as NAs) issue extremism with dimensions of polarization on turnout


 Open access