


1. Introduction and problem clarification
Engineering tasks have become more and more complex over the last decades (INCOSE, 2023). The growing capabilities of information and communication technology (ICT) have a particularly large impact on this (Reference Parra-Moyano, Schmedders and PentlandParra-Moyano et al., 2020). Examples include the need to integrate intelligent, digital, and connected components into physical products in cyber-physical systems (CPS) in order to enable real-time data acquisition and analysis, the rise of new business models like the combination of products and related services in product-service systems (PSS), and the re-utilization of data generated during the entire lifetime of a product so as to gain valuable insights during the development phase for the next generation in the context of data-driven design (DDD). The integration and management of these data-related advancements into systems design is therefore inevitable (Reference Machchhar, Toller, Bertoni and BertoniMachchhar et al., 2022).
Given the growing role of data exchange and digital components, modeling approaches that support interdisciplinary understanding of system data flows are crucial, as they provide a shared representation that enables coordinated interpretation and informed decision-making (Reference Bolshakov, Badenko, Yadykin, Tishchenko, Rakova, Mohireva, Kamsky and BarykinBolshakov et al., 2023).
In this context, Model-based Systems Engineering (MBSE) is now being intensively discussed as an approach to cope with current advancements in the designing of systems that are growing increasingly complex. MBSE aims to deliver models that allow for the integration of all relevant stakeholders from different domains into the engineering process to ensure targeted development of modern, complex systems (INCOSE, 2023). While modeling approaches typical of MBSE – such as Systems Modeling Language (SysML) – mainly evolved from the engineering perspective, both Graph Theory and the methods of Dependency and Structure Modeling (DSM) are known as possible interdisciplinary approaches for enhancing the engagement of stakeholders across domains within MBSE (Reference Madni and AugustineMadni and Augustine, 2023).
Graph Theory and DSM are closely related to each other. Though they originate from a similar mathematical description, the manner in which they visualize the underlying system differs. While a graph shows the system elements as nodes with connecting vertices, a DSM uses a matrix approach showing the elements as rows and columns of the matrix. Entries in the connecting matrix cell serve as the description of the element’s interaction (Reference Eppinger and BrowningEppinger & Browning, 2012). The view provided by a particular visualization may be more suitable depending on the perspective from which a system’s model is analyzed, e.g., depending on the level of detail with which the system is investigated (Reference MaurerMaurer, 2017).
While existing applications show the potential of using DSM or Graph Theory to model data flows in smart, complex system environments (Reference Pannunzio, Friday, Kipouros, Clarkson and BraynePannunzio et al., 2023; Reference Brovar, Menshenin, Knoll, Fortin, Canciglieri Junior, Noël, Rivest and BourasBrovar et al., 2022; Reference Gutierrez, Jensen and RiazGutierrez et al., 2016; Reference Langner, Paliyenko, Roth and KreimeyerLangner et al., 2025a; Reference Langner, Paliyenko, Roth and KreimeyerLangner et al., 2025b), a detailed investigation whether combining them can provide additional benefits by creating a shared interdisciplinary understanding that serves as a basis for informed decision-making across multiple domains, is yet to be undertaken. This paper therefore aims to investigate the following research question: How does a combined DSM and graph-based modeling approach, compared to standalone DSM or graph models, support interdisciplinary decision-making by revealing critical data dependencies in the design of complex, data-centric systems?
2. Approach to research - case study and expert interviews
Figure 1 describes the approach to answering the research question, whereby expert interviews (EI) conducted with a broad variety of experts across different domains play a key role. To assess the approaches as accurately as possible, it is necessary to present the interviewees with a suitable detailed model in the context of a project they are currently working on. This work is based in particular on an interdisciplinary development project dealing with autonomous public transportation. In this project, the interdisciplinary design of the systems, especially concerning the autonomous bus and the required data communication within the public transportation network, is a major challenge (Reference Langner, Rehberg, Tüzün, Roth and KreimeyerLangner et al., 2024).
To present a well-detailed model, an approach with industry workshops (IWS) is selected, since structural system and data dependency knowledge is typically distributed across organizations and only implicit, rather than being capturable through document analysis alone. Still, in addition, existing data models and VDV recommendations are screened, as is literature on (autonomous) public transportation. Reference Langner, Paliyenko, Roth and KreimeyerLangner et al. (2025b) present the data acquisition process in detail. Building on this rigorous process, all sources are merged into one dataset describing the system “autonomous public transportation”.
For creating and analyzing the models, the software Lattix is used for DSM and Gephi for the graph.
The results of the analysis are used as the input for a total of 16 EI lasting approximately 1.5 hours each. EI are used to evaluate the modeling approaches because the posed research question addresses interdisciplinary decision-making and model usability, which require reflective judgment by practitioners rather than quantitative measurement. The diversity of interviewee roles and experience levels was prioritized to capture multiple disciplinary perspectives. Resulting, the interviewees come from a variety of backgrounds including product and service engineering, data and systems management, marketing, consulting, and strategy management. In addition, they represent different levels of experience and hierarchy. They are therefore well-suited to representing the multiple domains and disciplines involved in the complex system of autonomous buses in public transportation. Figure 1 characterizes the participants in more detail. The EI are conducted as follows: The interviewees are first shown the included entities in order to introduce them to the system, then the logic, the steps involved in building the model, and the analysis possibilities of a DSM and graph model are explained to them. The detailed case study models, shown in the following chapter, are subsequently presented. The discussion and assessment phases are guided by existing requirements mapped onto approaches for modeling data communication in complex stakeholder networks derived from Reference Langner, Paliyenko, Roth and KreimeyerLangner et al. (2025a): comprehensiveness (representation of all relevant stakeholders and data flows), comprehensibility (ease of understanding and usability by individuals unfamiliar with the model), applicability (application across a range of problems in the area of complex stakeholder networks), usefulness (actionable and practical analyses), extensibility (allowing for additional entities, parameters, or aspects), adaptivity (facilitating customization to reflect the unique conditions of the network), complexity reduction (breaking the overall problem down into smaller units), objectivity (valid results across different analysts), and flexibility (uniform detailing but allowing for some summaries). The models in this project are built for one case study only and by the authors themselves following an extensive data-gathering process. The aspects of the applicability across numerous use cases and the objectivity are not used for this project, since they cannot be assessed by the interviewees or indeed more generally in this context.
Approach to research

Figure 1 Long description
Panel A: The diagram begins with data gathering through two workshop series. Workshop series 1 focuses on identifying stakeholders and data needs, involving entities like the public transportation association, bus operating company, and bus manufacturer. Workshop series 2 details the data communication with identified stakeholders. Panel B: The complete dataset is merged from various sources including results from workshops, data models from project partners, literature on autonomous public transport, and recommendations from VDV. Panel C: The dataset is modeled using tools like LaTeX for DSM models and Gephi for graph models. Panel D: The analysis involves algorithms such as the Leiden algorithm for clustering and the betweenness centrality algorithm for sorting entities based on their importance within the system. Panel E: Interviews with industry experts are conducted, detailing their backgrounds, working fields, and companies. Panel F: Insights derived from the analysis are categorized based on criteria like comprehensiveness, usefulness, adaptivity, and flexibility.
3. System model building and analysis
The graph model is constructed using Gephi, and the DSM model using Lattix, building on the dataset from Reference Langner, Paliyenko, Roth and KreimeyerLangner et al. (2025b). This dataset describes all relevant entities, their subsystems, and their input communication by showing both the entity from which a data transfer is coming and the information contained in the transfer. It also differentiates between the current status quo with a conventional bus and the predicted future scenario with an autonomous bus, therefore making it possible to build two different states and form comparisons. In addition, it is important to note that both the graph and the DSM model use the exact same dataset and therefore show the exact same data.
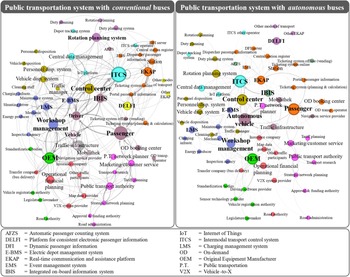
The graph model supports the understanding of the complex system with its visualizations in Figure 2. Clustering allows for a better understanding of the system by showing the most important entities and their relations to other adjacent entities. The differentiation between the conventional bus system and the autonomous bus system makes it possible to quickly understand how the system changes. Since this is a directed graph (meaning entity A can send information to entity B, but B does not have to send something to A as well), the Leiden algorithm first introduced by Reference Traag, Waltman and van EckTraag et al. (2019) is most suitable for application. This has been shown by Reference Anuar, Abas, Yunos, Zaki, Hashim, Mokhtar, Asmai, Abidin and NizamAnuar et al. (2021) by comparing it to the Louvain algorithm of Reference Blondel, Guillaume, Lambiotte and LefebvreBlondel et al. (2008), which is the second well-known clustering algorithm for directed graphs. 11 clusters are identified for the conventional dataset and 10 for the autonomous dataset; these are marked with a distinctive color in Figure 2. This difference is due to the integration of the rotation and planning systems into the cluster of the control center and disposition systems: Since drivers no longer have to be scheduled, their related data flow is reduced in comparison to the others.
Investigated system with conventional buses (left) and autonomous buses (right)

However, at first glance, it is clear that most relations stay close to the previous state, with the main differences being the disappearance of the driver and the vehicle in different clusters. They are replaced by the autonomous vehicle as the core entity of the future system. Another important observation concerns the passenger: Having previously been closely related to the driver as a source of information, they are now linked much more with the real-time communication and assistance platform (EKAP) and the integrated on-board information system (IBIS). This underlines the importance of investigating the needs and possibilities to provide the passenger with all the necessary assistance in autonomous vehicles.
The other important entities remain unchanged, namely the intermodal transport control system (ITCS) for monitoring and controlling bus and/or rail operations, which enables operations control system dispatchers to intervene and restore normal operations in the event of disruptions to traffic operations; the control center, which is now also responsible for the technical supervision of the autonomous vehicles; the workshop management, responsible for depot planning and fleet management for the transport company; the related depot management system (E-BMS), which is the core system for automating operational processes in the depot and optimizing vehicle deployment, and the charging management system (LMS); the original equipment manufacturer (OEM), who manufactures the autonomous vehicle and is key to integrating the new important players of driving software provider and sensor technology provider; the public transport authority, which in principle is the political “client” of the public transportation services; and the traffic infrastructure.
This demonstrates how an overview of the system and the changes in its major structure can quickly be derived from the graph, a substantial basis for decision-making, as core data dependencies, as well as integral changes are identified, helping to prioritize next steps. As described earlier, a correlating DSM can also be built. Figure 3 shows this by displaying the autonomous bus system with the clusters from Figure 2. When transferring a graph into a DSM, the sequence of the clusters and entities must be defined. In this case, it is helpful to put the most important entities first and sort the remainder downward in order. Since the investigation relates to data communication in the network, the role the various entities play in communication within the overall system is one possible way of defining importance.
This can be derived from the betweenness centrality metric. It depicts entities with elevated centrality serving as pivotal intermediaries within a system, functioning either as bridges or potential bottlenecks that regulate the transmission of information and the establishment of connections. The elimination of such nodes can lead to substantial disturbances in the overall system integrity. As a result, this measure is instrumental in detecting structurally significant nodes (Reference Barrat, Barthélemy, Pastor-Satorras and VespignaniBarrat et al., 2004).
The betweenness centrality of each entity is therefore used to establish the order in the DSM, based on the common related algorithm of Reference BrandesBrandes (2001). In this way, Figure 3 also provides a system overview: The most “central” clusters can be derived not only from the order, but also from the number of interactions in the row and column outside the cluster. In addition, the DSM model indicates clusters with high internal data communication, such as the autonomous systems.
DSM view for the autonomous network on the cluster level

Besides these aspects of general systems understanding, a more detailed investigation of individual entities or interfaces is needed when designing complex systems. The DSM model supports this via its structured architecture, which enables a quick and detailed review of selected entities’ interactions. Figure 4 shows this through the example of the autonomous bus: all required interfaces can be quickly identified by reading across the row (inputs) and the column (outputs). To dive deeper, Lattix makes it possible to click on a selected interaction and show all parameters offered by the dataset – in this case, a description of the individual information transferred through this interface. This can also be used to describe the origin of the weighting of the interfaces: If multiple information exchanges are defined between two entities, the counter increases accordingly.
Investigating the most important input and output entities to/from the autonomous bus

Figure 4 Long description
The matrix illustrates the dependency strengths between different entities in a public transportation system with autonomous buses. It has 26 rows and 43 columns, each representing different entities and their interactions. The rows are categorized into Passenger information, Autonomous vehicle, Workshop management, Depot charging, and Control center. The columns are labeled with numbers from 1 to 43. Each cell in the matrix contains a numerical value indicating the dependency strength between the corresponding row and column entities. For example, the dependency strength between the passenger and the autonomous vehicle is 17, with passengers receiving information such as action instructions, call answers, signaling, and warnings. The matrix is symmetrical, with the diagonal elements representing the dependency of each entity with itself.
These detailed investigation options enhance the design of the smart systems involved by deriving the necessary interfaces; for example, these could be translated into requirements for the development. To visualize the findings in this case, Figure 5 displays the autonomous bus as one system to be developed, the derived most important stakeholders with whom data communication is needed, and the correlating technical systems derived from the detailed analysis with the combined DSM/graph approach.
Derived important data communication interfaces of the autonomous bus in operation

Concluding, this combined modeling approach transitions from a quick, overall, shared understanding of the system to specific characterizations such as showing the most important entities and their relation. It also permits a very detailed description of each interface in a single modeling approach, which helps not only from a technical perspective but also in other ways such as the organizational design of the multi-stakeholder network – especially useful for decision-making at the level of strategic management.
4. Evaluation by industry experts
As outlined above, the interviewees are presented not only with the analysis described in the previous chapter, but also with general possibilities and possible extensions of the DSM and graph methods. The feedback discussion is guided by the described requirements. Figure 6 provides separate summaries of the experts’ feedback on the DSM and the graph. This is in order to identify the specific strengths and weaknesses of each concept and to derive its role in a combined DSM/graph approach. Overall, the experts emphasize the comprehensive representation of the system “autonomous bus in public transportation” and the suitability of modeling this system with the concepts used. While experts with an engineering background raise other approaches like SysML and suggest utilizing these as alternatives, interviewees with a non-technical background in particular are in favor of the easy-to-understand logic of a DSM and the powerful visualizations of a graph.
Assessment of DSM and graph based on the feedback of the expert interviews

Figure 7 summarizes the insights drawn from the investigations conducted during this case study. While the graph delivers a fast system overview through its powerful and intuitive visualizations with a high degree of complexity reduction, it lacks depth or needs adaptations to the model in order to investigate more detailed aspects of the system. The exact opposite is the case for the DSM: Where the experts tended to “get lost” in the sprawling overall matrix, or at least needed more guidance to navigate through it, the concise representation of all interfaces in a single view with a clear structure was emphasized as a powerful characteristic of the DSM. In addition, the experts highlighted how the structured framework provided by the DSM for data capture ensures that no dependencies in the system are missed.
It can therefore be concluded that a combined approach joins the strengths of both concepts and counteracts the respective weaknesses. The development of a detailed framework that describes when to use which model, which perspectives can be satisfied by which visualization, the possible analyses, and the practical implementation is thus one of the necessary subsequent steps. The derived framework in Figure 7 combines the insights discussed and lays the ground for further investigations.
Derived insights and framework for combined DSM/graph modeling approach

5. Conclusion, discussion and outlook
As an overall finding and answer to the research question, it can be derived that a combined DSM/graph approach enables more effective support for interdisciplinary decision-making than applying either approach in isolation, particularly by making critical data dependencies and their structural relationships explicit in complex, data-centric systems. While DSM provides a highly structured framework for systematically capturing and documenting data dependencies in a complete and consistent manner, it offers limited intuitive accessibility for rapid interdisciplinary system understanding. By contrast, graphs enable fast and intuitive visualization of system structure and core dependencies, but lack the same level of structured completeness, making the combination of both approaches particularly effective for supporting interdisciplinary decision-making in complex, data-centric systems.
It is important to emphasize that the work described here only constitutes one case study. While being well-documented and extensive, the models are constructed by the authors. This may cause perspective-related bias and limits generalizability. However, the aim of the study is not to produce a universally valid framework, but to compare modeling approaches and identify their respective strengths and limitations in a real application context. Therefore, this work still presents valid insights. Nevertheless, further case studies are needed in order to profoundly generalize the findings.
Still, the interviewed experts represent a broad interdisciplinary range of stakeholders involved in the design of the case study’s complex system, “autonomous bus in public transportation.” They can therefore be considered well-suited to delivering profound opinions on the matter under investigation.
Based on the expert interviews, the combined modeling approach was found to enable a shared interdisciplinary view of the future system and to support discussions on implementation-related challenges. The acquired dataset allowed for a detailed analysis of the system, making it possible to provide a shared understanding of the future system to all industry partners and gain valuable insights about the future implementation of autonomous buses.
Looking beyond the scope of the present study, several directions for further development can be derived from criticisms, possibilities, and wishes for further extensions that were raised, in particular with regard to the current mixture of stakeholders and technical systems in the model. This could be solved through an approach using multiple-domain matrices (MDM), which have been implemented successfully to describe the integration of several domains into one model (Reference Eppinger and BrowningEppinger & Browning, 2012). Additional desired improvements are the ability to identify the most “critical” interface or dataflow in the system, the option of differentiating real-time data flows from others, or the option of deriving more concrete recommendations for actions – not just on a system level, but also for each entity. Since these criticisms also concern the dataset, which must be extended to answer those questions, they are not limited to the approach that underpins the concept. This not only makes it necessary to extend the dataset with the parameters required to detail the case study, but can also have an impact on the framework needed.
While a combined framework was derived from the gained insights, it is important to emphasize a few related aspects. The derived framework does not aim to replace existing domain-specific models, the domain-specific views must of course be considered, especially when analyzing the system’s details. Rather, it delivers the desired interdisciplinary framework. It is important to investigate the domain-specific views more closely and establish how they can be integrated into a universal methodology for system analysis with a data-centric focus. A universally valid investigation must therefore derive all necessary interdisciplinary views on a yet-to-be-developed system, the domain-specific goals and wishes (i.e., the “questions” asked of a related system model), and the parameters discussed in the context of analyzing the system’s data communication. These findings must be integrated into a generic logic to describe and analyze such complex systems, including multiple characteristic parameters. As mentioned, this could possibly be done through a multiple-domain matrix (MDM) approach. In addition, further investigation must identify a suitable way to derive correlating graphs beyond a “simple” representation of the same DSM/MDM visualization. The universal framework must subsequently be developed in detail.
In summary, this study demonstrates the value of combining DSM and graph-based modeling to support interdisciplinary decision-making in the design of complex, data-centric systems. By explicitly contrasting the strengths and limitations of both approaches in a real application context, the work provides guidance on when and how each modeling paradigm can be applied most effectively. While further validation across additional case studies is required, the presented insights contribute to a more informed and transparent use of system modeling approaches in interdisciplinary engineering practice.
Acknowledgements

The authors would like to thank Frank Waldman and Code Clinic LLC for kindly providing a license of the Lattix software at a reduced price for academia.
This research was funded by the Federal Ministry of Transport of Germany (BMV) on the basis of a decision of the German Bundestag with ∼ 12.7 million euros as part of the project MINGA in the framework of the funding guideline “autonomous and connected driving in public transports”.



 Open access

