

Mental illnesses, especially depression, are an increasingly important public health concern, making up three of the ten leading causes of disease burden in low- and middle-income countries. Reference Anwar, Mpofu, Matthews, Shadoul and Brock1 Whereas the cardiopulmonary effects of air pollution have been well established, Reference Lin, Guo, Zheng, Di, Liu and Xiao2,Reference Qiu, Sun, Tsang, Wong, Lee and Schooling3 growing concern has focused on its mental health effects. Several studies have examined the association between exposure to ambient particulate matter with an aerodynamic diameter ⩽2.5 μm (PM2.5) and depressive symptoms. Reference Wang, Eliot, Koutrakis, Gryparis, Schwartz and Coull4–Reference Zijlema, Wolf, Emeny, Ladwig, Peters and Kongsgård6 However, limited studies have been conducted in low- and middle-income countries where higher air pollution levels generally exist. Besides air pollution, tobacco smoking is another important risk factor causing enormous public health burden in low- and middle-income countries. Although the individual effects of both air pollution and smoking have been widely studied, literature on their joint effects has been sparse. Reference Wong, Ou, Lee, Chan, Thach and Chau7,Reference Pope, Burnett, Thurston, Thun, Calle and Krewski8 One Hong Kong study suggested that smoking could enhance the short-term mortality effects of air pollution; Reference Wong, Ou, Lee, Chan, Thach and Chau7 and Pope et al reported an additive interaction between air pollution and smoking on cardiovascular mortality. Reference Pope, Burnett, Thurston, Thun, Calle and Krewski8 Given that both air pollution and smoking have been associated with mental health, Reference Boden, Fergusson and Horwood9 we hypothesise that ambient PM2.5 and smoking may have both independent and combined associations with depression. Here we examined the relationship between exposure to ambient PM2.5, smoking and depression among participants in six low- and middle-income countries from the World Health Organization (WHO) Study on global AGEing and adult health (SAGE) Wave 1. We further investigated the potential interaction between PM2.5 exposure and tobacco smoking on depression.
Method
Study participants
Details about the SAGE study design and data collection have been reported elsewhere. Reference Kowal, Chatterji, Naidoo, Biritwum, Fan and Ridaura10 Briefly, SAGE is a longitudinal cohort study with national samples of adult participants in six low- and middle-income countries: China, Ghana, India, Mexico, Russia and South Africa. Reference Kowal, Chatterji, Naidoo, Biritwum, Fan and Ridaura10 This analysis was conducted on cross-sectional data from SAGE Wave 1, which was implemented from 2007 to 2010. The surveys were carried out via a face-to-face household interview using a stratified, multistage, random cluster sampling design. The primary sampling units were stratified by region and location (for example urban/rural) and, within each stratum, enumeration areas were selected. The survey included questions about sociodemographic characteristics, economic situation, behavioural risk factors and health status. This study was approved by the research review boards of the WHO Ethical Review Committee. Informed consent was obtained from each participant.
Depressive symptoms
Depressive symptoms were measured using questions derived from the World Mental Health Survey version of the Composite International Diagnostic Interview. Diagnosis of depression was based on meeting any of the three criteria: (a) self-reported depressive symptoms during the past 12 months; (b) diagnostic criteria for research for depressive episodes; and (c) having received depression-related healthcare services.
PM2.5 and smoking
Remote-sensing data were used to estimate the annual concentrations of PM2.5 using the method developed by van Donkelaar et al to estimate the global distribution of ambient PM2.5. Reference Van Donkelaar, Martin, Brauer, Kahn, Levy and Verduzco11 The method was based on a combination of observations from the Moderate Resolution Imaging Spectroradiometer and Multiangle Imaging Spectroradiometer instruments from the Terra satellite, and simulations with the GEOS-Chem chemical transport model. The location of the participants' residential community in SAGE was geocoded using Google Earth and used to match the estimated PM2.5 concentrations. The word ‘community’ in the six countries may have different meanings, it is the township or community in China, enumeration area in Ghana and South Africa, village or census enumeration block in India, the Basic Geo-Statistical Area in Mexico, and atenum in Russia. In the main model, the 3-year averaged concentrations of PM2.5 before the survey were used as the exposure variable. Reference Lin, Guo, Zheng, Zhao, Cao and Rigdon12
In this study, four metrics were used for smoking: smoking status (never or ever), frequency (non-smoking, occasional or daily), duration (never, less or more than 15 years) and amount (never, less or more than eight cigarette equivalents per day).
Covariates
Several covariates were considered, including demographic (age, gender, body mass index (BMI)), socioeconomic (education, annual household income) and lifestyle factors (alcohol consumption, physical activity and cooking-related indoor air pollution). Weight and height were measured to calculate BMI, expressed as weight/height2 (kg/m2). Alcohol consumption was categorised into non-drinkers and ever drinkers. To obtain the information about indoor air pollution, participants were asked about their fuel types most frequently used for domestic cooking, and usage of ventilation in indoor cooking spaces. Two fuel types were mainly used: ‘clean fuels’, including electricity and natural gas, and ‘unclean fuels’, such as coal, wood, dung and agricultural residues.
The Global Physical Activity Questionnaire was used to measure the intensity, duration, and frequency of physical activity as described elsewhere. Reference Lin, Guo, Di, Zheng, Kowal and Xiao13 The total time spent in physical activity during the previous week, including the number of days and intensity, was used to generate low, moderate and high categories of physical activity levels.
The country-level indicators were considered, including gross domestic product (GDP) per capita, which was obtained from the Central Intelligence Agency's World Factbook, the percentage of the urban population, per capita healthcare expenditure and the Gini coefficient, a measure of income inequality.
Statistical analysis
A three-level logistic regression model was used with participants being the first-level units, community being the second-level units and country being the third-level units in order to account for the nested structure of the data. In line with previous studies, we calculated the effect estimates for each 10 μg/m3 increase in PM2.5. Multivariate models were conducted to control for some important covariates, including age, gender, BMI, smoking, alcohol drinking, marital status, urbanity, household income, education, domestic fuel type and ventilation. To account for the seasonal pattern of ambient PM2.5, we also included the month of the survey administration in the model as one covariate.
To examine the concentration-response relationship between exposure to ambient PM2.5 and depression, we used a quadratic spline smoothing function in the regression model, and visually examined the shape of the concentration-response relationship. We further examined the possible interaction between PM2.5 and smoking (smoking status, frequency, duration and amount) in relation to the risk of depression. We assessed their interactions using both multiplicative and additive models. Multiplicative interaction was examined by adding a product term between PM2.5 and smoking into the regression models. Addictive-scale interactions were assessed with the synergy index. Reference Andersson, Alfredsson, Källberg, Zdravkovic and Ahlbom14,Reference Zhang, Xie, Chen, Li, Lu and Mei15 We classified PM2.5 exposure into two categories using the median value as the cut-point. In the additive model, a new variable was constructed to represent the combination of these two variables. Using smoking status (ever, never) as an example, the categories for this variable were as follows: (a) low PM2.5 exposure and non-smoker; (b) low PM2.5 and smoker; (c) high PM2.5 and non-smoker; and (d) high PM2.5 and smoker. The synergy index (SI) can be specified as:

where OR11 represents the risk in category of high PM2.5 and smoker, OR01 is the risk in category of low PM2.5 and smoker, and OR10 is the risk in category of high PM2.5 and non-smoker. A synergy index greater than one denoted a synergetic interaction, meaning that the joint effects of PM2.5 and smoking was greater than the sum of their individual effects. A synergy index smaller than one suggested an antagonistic interaction, indicating that in the presence of two exposures, one factor decreased the effect of the other. Reference Andersson, Alfredsson, Källberg, Zdravkovic and Ahlbom14
Several sensitivity analyses were conducted. First, although country remains as a random effect in the models, additional covariates were further adjusted, including GDP, percentage of residents living in urban areas, per capita healthcare expenditure and Gini coefficient. Second, different PM2.5 exposure definitions (1- and 5-year averaged concentration before the survey) were used as the exposure variable. We also conducted sensitivity analyses by dividing the six countries into two groups: one group including only China and India and the other including the other four countries (as China and India had the highest air pollution levels among the six countries). All analyses were conducted using R version 3.2.2. A P-value < 0.05 was considered statistical significant.
Results
A total of 53 426 participants aged 18 years and older were initially contacted and 47 443 agreed to participate and were recruited in this survey, giving a response rate of 88.8%. Among them, 5581 participants were excluded because of missing information about depression, and the other 77 had missing values for age, gender or other important covariates, the remaining 41785 participants were included in this analysis (Table 1). The 3-year averaged PM2.5 concentration in the six countries was 23.75 μg/m3. South Africa had the lowest level with a mean concentration of 5.97 μg/m3; whereas China and India had the highest concentrations (32.87 and 30.87 μg/m3, respectively). The average age of the participants ranged from 50.0 years in India and 63.1 years in Mexico.
Description of population and air pollution characteristics, by country.
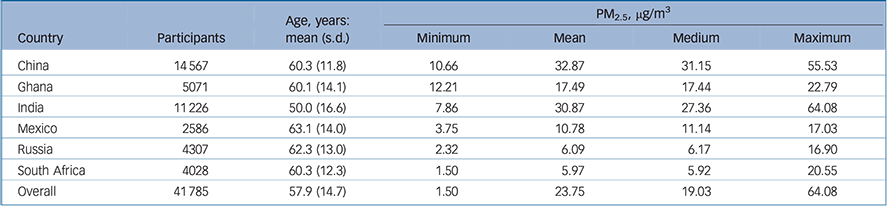
| Country | Participants | Age, years: mean (s.d.) |
PM2.5, μg/m3 | |||
|---|---|---|---|---|---|---|
| Minimum | Mean | Medium | Maximum | |||
| China | 14567 | 60.3 (11.8) | 10.66 | 32.87 | 31.15 | 55.53 |
| Ghana | 5071 | 60.1 (14.1) | 12.21 | 17.49 | 17.44 | 22.79 |
| India | 11226 | 50.0 (16.6) | 7.86 | 30.87 | 27.36 | 64.08 |
| Mexico | 2586 | 63.1 (14.0) | 3.75 | 10.78 | 11.14 | 17.03 |
| Russia | 4307 | 62.3 (13.0) | 2.32 | 6.09 | 6.17 | 16.90 |
| South Africa | 4028 | 60.3 (12.3) | 1.50 | 5.97 | 5.92 | 20.55 |
| Overall | 41785 | 57.9 (14.7) | 1.50 | 23.75 | 19.03 | 64.08 |
Among the 41 785 participants, 3189 (7.63%) had depressive symptoms. Table 2 shows that participants with depressive symptoms (the depression group) were statistically older than the referent participants (the referent group, 59.8 v. 57.8 years), and were exposed to higher PM2.5 levels (23.80 v. 23.15 μg/m3); the referent group had higher BMI values (24.30 v. 23.45 kg/m2). The depression group were more likely to be women, unmarried, living in rural areas, without formal education and reporting higher physical activity compared with those without such symptoms. Those in the referent group were more likely to have higher household income and reported consuming alcohol, using clean fuels for domestic cooking and having better ventilation at home compared with the depression group. In particular, we found a significant difference between the two groups in terms of smoking with more individuals in the depression group ever having used tobacco, smoking more frequently, for longer and with a greater tobacco consumption per day.
Comparison of sociodemographic and major risk factors between participants with depressive symptoms and those without such symptoms

| Variables | Referent group, n (%) |
Depression group, n (%) |
P a |
|---|---|---|---|
| Age, years: mean (s.d.) | 57.8 (14.7) | 59.8 (13.9) | 0.01 |
| BMI, kg/m2: mean (s.d.) | 24.30 (7.21) | 23.45 (7.76) | 0.01 |
| PM2.5, μg/m3: mean (s.d.) | 23.15 (15.56) | 23.80 (16.09) | 0.03 |
| Gender, n (%) | |||
| Male | 16 944 (43.90) | 1085 (34.02) | |
| Female | 21 652 (56.10) | 2104 (65.98) | 0.01 |
| Marital status, n (%) | |||
| Married | 27 571 (71.44) | 1985 (62.25) | |
| Unmarried | 11 024 (28.56) | 1204 (37.75) | 0.01 |
| Residence, n (%) | |||
| Urban | 18 542 (48.04) | 1370 (42.96) | |
| Rural | 20 052 (51.96) | 1819 (57.04) | 0.01 |
| Education, n (%) | |||
| No formal education | 16 946 (43.91) | 1975 (61.93) | |
| Primary school | 9498 (24.61) | 543 (17.03) | |
| Middle school | 10 014 (25.95) | 550 (17.25) | |
| College or higher | 2138 (5.54) | 121 (3.79) | 0.01 |
| Household income, n (%) | |||
| Low | 18 977 (49.17) | 1798 (56.38) | |
| High | 19 619 (50.83) | 1391 (43.62) | 0.01 |
| Drinking, n (%) | |||
| Non-drinker | 25 120(65.08) | 2158 (67.67) | |
| Drinker | 13 476 (34.92) | 1031 (32.33) | 0.01 |
| Physical activity, n (%) | |||
| Low | 11 686(30.28) | 1001 (31.39) | |
| Moderate | 8072 (20.91) | 593 (18.60) | |
| High | 18 838 (48.81) | 1595 (50.02) | 0.01 |
| Fuel type, n (%) | |||
| Clean | 19 644 (50.90) | 1228 (38.51) | |
| Unclean | 18 952 (49.10) | 1961 (61.49) | 0.01 |
| Ventilation, n (%) | |||
| No | 30 780 (79.75) | 2737 (85.83) | |
| Yes | 7816 (20.25) | 452 (14.17) | 0.01 |
| Smoking status, n (%) | |||
| Never | 25 316 (65.59) | 1923 (60.30) | |
| Ever | 13 280 (34.41) | 1266 (39.70) | 0.01 |
| Smoking frequency, n (%) | |||
| Never | 25 316 (65.59) | 1923 (60.32) | |
| Occasional | 4031 (10.46) | 413 (12.95) | |
| Daily | 9203 (23.87) | 852 (26.73) | 0.01 |
| Smoking duration, n (%) | |||
| Never | 25 316 (73.98) | 1923 (69.32) | |
| 0–15 years | 2074 (6.06) | 226 (8.15) | |
| > 15 years | 6831 (19.96) | 625 (22.53) | 0.01 |
| Smoking amount, n (%) | |||
| Never | 25 316 (65.59) | 1923 (60.30) | |
| 0–8 | 7717 (19.99) | 795 (24.93) | |
| > 8 | 5563 (14.41) | 471 (14.77) | 0.01 |
BMI, body mass index; PM2.5, fine particulate matter pollution.
a. χ2-tests for categorical variables and t-tests for continuous variables.
The concentration-response curve between ambient PM2.5 and depression, although not perfect, showed an approximately linear relationship (online Fig. DS1). Table 3 showed significant associations of depression with PM2.5 and smoking. The unadjusted odds ratio (OR) was 1.09 (95% CI 1.01–1.17) for each 10 μg/m3 increase in ambient PM2.5. After adjusting for various covariates, the OR was 1.10 (95% CI 1.02–1.19). Smoking was also found to be significantly associated with depression. The odds of depression for ever smokers was 1.11 (95% CI 1.03–1.20) and 1.26 (95% CI 1.15–1.37) in the univariate and multivariate models. There was a significant increasing trend with higher frequency, duration and amount of tobacco smoking; for example, compared with non-smokers, the odds of depression of occasional and daily smokers was 1.33 (95% CI 1.18–1.50) and 1.22 (95% CI 1.10–1.35), respectively; the OR for a smoking duration of fewer than 15 years and more than 15 years was 1.18 (95% CI 1.01–1.38) and 1.21 (95% CI 1.08–1.37), respectively; higher consumption of tobacco was also associated with higher risk of depression (OR = 1.02, 95% CI 0.90–1.16 for those who smoked less than eight cigarette per day, and 1.27, 95% CI 1.13–1.43 for those who smoked more than eight cigarette per day).
Crude and adjusted odds ratio for the prevalence of depressive symptoms associated with long-term exposure to ambient fine particulate matter pollution (PM2.5) and smoking (n = 41 785)
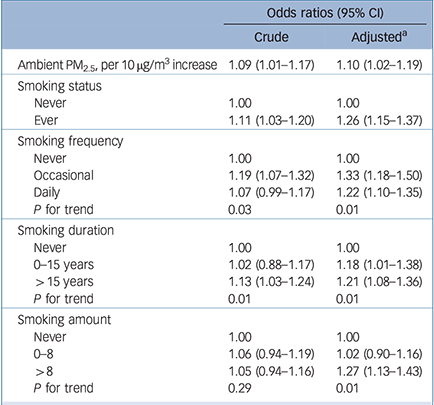
| Odds ratios (95% CI) | ||
|---|---|---|
| Crude | Adjusted a | |
| Ambient PM2.5, per 10 μg/m3 increase | 1.09 (1.01–1.17) | 1.10 (1.02–1.19) |
| Smoking status | ||
| Never | 1.00 | 1.00 |
| Ever | 1.11 (1.03–1.20) | 1.26 (1.15–1.37) |
| Smoking frequency | ||
| Never | 1.00 | 1.00 |
| Occasional | 1.19 (1.07–1.32) | 1.33 (1.18–1.50) |
| Daily | 1.07 (0.99–1.17) | 1.22 (1.10–1.35) |
| P for trend | 0.03 | 0.01 |
| Smoking duration | ||
| Never | 1.00 | 1.00 |
| 0–15 years | 1.02 (0.88–1.17) | 1.18 (1.01–1.38) |
| > 15 years | 1.13 (1.03–1.24) | 1.21 (1.08–1.36) |
| P for trend | 0.01 | 0.01 |
| Smoking amount | ||
| Never | 1.00 | 1.00 |
| 0–8 | 1.06 (0.94–1.19) | 1.02 (0.90–1.16) |
| > 8 | 1.05 (0.94–1.16) | 1.27 (1.13–1.43) |
| P for trend | 0.29 | 0.01 |
a. Adjusted for age, gender, body mass index, smoking (for effect of PM2.5), PM2.5 (for smoking), alcohol drinking, marital status, urbanity, household income, education level, domestic fuel type and ventilation.
Table 4 showed the interaction between PM2.5 and smoking on depression using the low PM2.5-non-smoking participants as the reference. The interaction was not significant in multiplicative models. However, the additive models for different smoking metrics showed larger joint effects than the sum of the individual effects. For instance, the individual effect of PM2.5 and ever smoked was 1.29 (95% CI 1.09–1.51) and 1.23 (95% CI 1.09–1.39), whereas their joint effect was 1.64 (95% CI 1.38–1.95) with a synergistic index of 1.23. A similar pattern was also observed for smoking frequency, duration and amount with the corresponding synergistic index being 1.32, 1.61 and 1.28, respectively.
The combined effects between ambient fine particulate matter pollution (PM2.5) exposure and smoking on the risk of depressive symptoms

| Odds ratios (95% CI) | ||
|---|---|---|
| Category | Crude | Adjusted a |
| PM2.5–smoking status | ||
| Low–non-smoker | 1.00 | 1.00 |
| Low–smoker | 1.10 (0.98–1.22) | 1.23 (1.09–1.39) |
| High–non-smoker | 1.27 (1.09–1.48) | 1.29 (1.09–1.51) |
| High–smoker | 1.42 (1.21–1.67) | 1.64 (1.38–1.95) |
| Synergy index | 1.16 | 1.23 |
| P for multiplicative interaction | 0.76 | 0.67 |
| PM2.5–smoking frequency | ||
| Low–non-smoking | 1.00 | |
| Low–occasional | 1.25 (1.06–1.47) | 1.33 (1.12–1.59) |
| Low–daily | 1.02 (0.90–1.16) | 1.18 (1.02–1.35) |
| High–non-smoking | 1.27 (1.09–1.48) | 1.29 (1.09–1.51) |
| High–occasional | 1.45 (1.19–1.76) | 1.70 (1.38–2.09) |
| High–daily | 1.41 (1.19–1.67) | 1.61 (1.34–1.93) |
| Synergy index b | 1.42 | 1.32 |
| P for multiplicative interaction | 0.44 | 0.57 |
| PM2.5–smoking duration | ||
| Low–non-smoking | 1.00 | 1.00 |
| Low–short | 1.03 (0.83–1.29) | 1.25 (0.98–1.59) |
| Low–long | 1.04 (0.90–1.19) | 1.12 (0.96–1.32) |
| High–non-smoking | 1.25 (1.07–1.46) | 1.27 (1.08–1.49) |
| High–short | 1.25 (1.00–1.56) | 1.45 (1.15–1.84) |
| High–long | 1.50 (1.25–1.79) | 1.63 (1.34–1.98) |
| Synergy index b | 1.76 | 1.61 |
| P for multiplicative interaction | 0.14 | 0.22 |
| PM2.5–smoking amount | ||
| Low–non-smoking | 1.00 | 1.00 |
| Low–small | 1.13 (0.99–1.28) | 1.20 (1.07–1.33) |
| Low–large | 1.04 (0.8–1.22) | 1.33 (1.15–1.52) |
| High–non-smoking | 1.27 (1.09–1.48) | 1.28 (1.12–1.47) |
| High–small | 1.44 (1.22–1.71) | 1.56(1.34–1.82) |
| High–large | 1.39(1.15–1.68) | 1.78 (1.51–2.11) |
| Synergy index b | 1.26 | 1.28 |
| P for multiplicative interaction | 0.72 | 0.66 |
a. Adjusted for age, gender, body mass index, alcohol drinking, marital status, urbanity, household income, education level, domestic fuel type and ventilation.
b. The synergy index for PM2.5 with smoking frequency, duration and amount was for the combination of high PM2.5 exposure with highest levels of smoking variables (smoking daily, more than 15 years and more than eight cigarette equivalents per day).
The sensitivity analyses suggested that the effect estimates in the main models were robust (online Table DS1). When further adjusting for country-level covariates, we observed a comparable association between PM2.5 and depression with an OR of 1.09 (95% CI 1.01–1.18) per 10 μg/m3 increase in PM2.5. Similar results were also observed when using 1- and 5-year averaged PM2.5 concentrations as the exposure variable. We observed significant associations in both country groupings, with a smaller effect in China and India (OR = 1.09, 95% CI 1.01–1.18) than in the other four countries (OR = 1.46, 95% CI 1.01–2.12).
Discussion
Main findings
This study revealed an association of depression with both PM2.5 exposure and tobacco smoking among the adult participants in six low- and middle-income countries. Additionally, using four different smoking metrics of tobacco smoking, the additive models suggested that tobacco smoking may enhance the effect of ambient PM2.5 on depression.
Consistent associations were observed in the analyses of the two groups of countries as well as in the combined six countries. However, heterogeneity in the estimated effect magnitude existed with a smaller effect in the group of China and India, although these two countries had the highest concentration levels and the largest ranges of PM2.5 levels. The concentration-response relationship between PM2.5 and depression might lend some insights into this observation. Although we obtained an approximately linear relationship between ambient PM2.5 and depression, we did find a large slope in the countries with low PM2.5 concentrations, and a relatively smaller slope in the countries with medium PM2.5 concentrations among the six countries. It was also possible that people in both China and India might be more adaptive to the high exposure to PM2.5; another possibility is the differences in the chemical compositions of PM2.5. Reference Lin, Tao, Du, Liu, Qian and Tian16 Further studies exploring these differences are warranted.
Using data from participants in six low- and middle-income countries provided a unique opportunity to tease out the relationship between ambient PM2.5 and depression. We recruited a large diverse population, which were representative of the population in the six countries. An additional advantage was the large geographical coverage and diverse spectrum of PM2.5 concentrations in the study areas. Furthermore, high-quality survey data were secured through tremendous efforts regarding homogenising the study design, with standardised data collection, and training and certifying data collectors. Reference Kowal, Chatterji, Naidoo, Biritwum, Fan and Ridaura10
Comparison with findings from previous studies
Consistent with several previous studies, we found a significant association between smoking and depression. Reference Boden, Fergusson and Horwood9 On the other hand, only a few epidemiological studies have investigated the effects of ambient PM2.5 on depression. Both the Nurses' Health Study and a cohort study in Seoul, South Korea showed a positive association between outdoor PM2.5 and depressive disorders, which was consistent with our study. Reference Kim, Lim, Bae, Kim, Jung and Hong5,Reference Power, Kioumourtzoglou, Hart, Okereke, Laden and Weisskopf17 One recent study found that blood cadmium levels (one important metal component of PM2.5) were associated with depressive symptoms in elderly people in Seoul. Reference Han, Lim and Hong18 These findings were also consistent with significant depression effects associated with short-term exposure to air pollution. Reference Szyszkowicz, Kousha, Kingsbury and Colman19 Our findings on positive associations between depression and PM2.5 exposure were also supported by literature in the wider context of research on the association between mental health and air pollution. For example, prenatal exposure to air pollution has been associated with increased risk of mental health problems in both human and animal studies. Reference Fonken, Xu, Weil, Chen, Sun and Rajagopalan20,Reference Bolton, Huff, Smith, Mason, Foster and Auten21 On the other hand, one study from Boston, USA and one large European cohort study did not find significant association between PM2.5 and depressive symptoms. Reference Wang, Eliot, Koutrakis, Gryparis, Schwartz and Coull4,Reference Zijlema, Wolf, Emeny, Ladwig, Peters and Kongsgård6 The inconsistent results might be the result of differences in the demographic characteristics of the populations and particle composition in different areas, which has been shown to cause heterogeneity in health effects of particulate pollution. Reference Dai, Zanobetti, Koutrakis and Schwartz22
Explanation for our findings
The mechanisms for the association between PM2.5 and depression remain largely unknown. One potential mechanism may be DNA methylation, which has been used as a diagnostic biomarker of depression, and has been related to exposure to ambient PM2.5. Reference Madrigano, Baccarelli, Mittleman, Sparrow, Spiro and Vokonas23 Other possible pathways included the elicitation of oxidative stress and systemic proinflammatory responses, resulting in systemic inflammation and circulation of inflammatory mediators. The mediators may interact with and activate the cytokine receptors in the brain endothelial cells, generating autoantibodies to cell junction and neural proteins. These auto-antibodies have the ability to disrupt the blood-brain barrier, and thus lead to neuroinflammation, brain oxidative stress and neurochemical changes. Reference Hasler24 The fine particles have the potential to cross the epithelium, enter the systemic circulation and reach the brain, leading to inflammation and oxidative stress in the nervous system; these inflammatory factors have been closely related to the development of some depressive disorders, Reference Dantzer, O'Connor, Freund, Johnson and Kelley25 and observed in human post-mortem brain tissues in individuals chronically exposed to high air pollution levels. Reference Calderon Garciduenas, Reed, Maronpot, Henriquez-Roldán, Delgado-Chavez and Calderon-Garciduenas26
Our study observed that ambient PM2.5 and smoking had a synergistic interaction on depression in the additive model. The underlying mechanism might be the result of the similar pathophysiological pathways of their health effects, such as inflammatory response, interacting with cytokine receptors in brain endothelial cells, causing neuroinflammation and brain oxidative stress. Reference Pope, Burnett, Thurston, Thun, Calle and Krewski8 It is also thought that smoking may decrease the clearance and increase the deposition and retention of fine particles, and thus enhance the health effects. Reference Möller, Kohlhäufl, Häussinger, Stahlhofen and Heyder27
Limitations
Our study also had some limitations. Being a cross-sectional study, we cannot identify the temporal relationship between exposure and outcome, and thus, it is impossible for us to establish a causal relationship between PM2.5 and depression. We used a 3-year average of satellite-based PM2.5 concentration as a surrogate for exposure to ambient PM2.5. These measurements were more likely to reflect the background air pollution levels and may not reflect direct levels of individual exposure. Another limitation was that we had an 11.2% non-participation rate as well as some missing information. However, SAGE aimed to study the overall health status among the populations in the six countries, rather than to specifically determine any impact on health from air pollution. The participants were unaware of the objective of the current study. Thus, differential participation by exposure status was unlikely. It was possible, though, that some individuals with more serious depression may have a higher refusal rate, and thus possibly created a bias in the results. Furthermore, although we considered some important potential confounding factors in data analyses in this study, some residual confounding cannot be totally excluded because of the lack of data on some other important covariates, such as history of depression, noise exposure and neighbourhood environment.
Previous studies have shown that depression was associated with an increased risk of deleterious health behaviours, such as cigarette smoking and alcohol use. Reference Boden, Fergusson and Horwood9 Thus, the history of depression may be a potential confounder that would influence both current depression and smoking behaviour. We will study this research question when the SAGE follow-up data are available. Finally, we were not able to examine health effects of other ambient air pollutants, such as ozone, on depression, nor control for potential confounding of these other ambient air pollutants because we did not have any exposure data for these other pollutants.
Implications
This study may have some practical implications. The results provide evidence that PM2.5 should be considered as one risk factor for depression and more strict air pollution controlling measures should be considered by environmental professionals, especially for China and India where the presence of higher PM2.5 exposure existed. However, caution is needed regarding this policy implication, considering that average exposure to air pollution varied greatly among the six study countries, and that socioeconomic factors may be strongly associated with exposure to PM2.5. The combined effects of PM2.5 and smoking on depression suggested that avoiding high levels of ambient PM2.5 may prevent depression among smokers; and more importantly, quitting smoking and reducing the amount smoked are highly recommended to reduce the risk of depression. In summary, the present study provides evidence of a positive association between ambient PM2.5 exposure and depression in six low- and middle-income countries, and tobacco smoking may enhance this effect.
Funding
Funding for SAGE was provided by WHO, the US National Institute on Aging through Interagency Agreements (; ; ) and through a research grant ().
Acknowledgements
The authors thank the respondents and survey teams from the six SAGE countries.


eLetters
No eLetters have been published for this article.