


1. Introduction
Over the past two decades, the dietary supplement market has grown rapidly. Approximately half of U.S. adults report taking at least one dietary supplement, reflecting growing interest in the potential health benefits of these products (Bailey et al., Reference Bailey, Gahche, Miller, Thomas and Dwyer2013). Product variety has expanded as well, with roughly 1000 new supplements introduced each year (Shneeman et al., Reference Shneeman, Azarnoff, Christiansen, Clark, Farnsworth, Gansler and Gibson2005). As the market grows, consumers face an increasingly wide set of brand options that broadly fall into two types: national brands (NBs) and private labels (PLs). NBs are owned and marketed by recognizable firms and are widely distributed nationwide, whereas PLs are owned and sold exclusively by the retailers. Price differences between NBs and PLs can be understood through a vertical-differentiation framework, where retailers choose PL quality and pricing to segment consumers and manage competition with NBs (Matos and do Vale, Reference Matos and do Vale2016).
In recent years, many retailers have moved from a single PL line to multi-tier PL strategies. Premium PL (PPL) products often feature higher perceived quality, upgraded packaging, and more specialized formulations (Geyskens et al., Reference Geyskens, Gielens and Gijsbrechts2010). Expanding PL portfolios gives retailers more control over assortments, supports profitability, and can strengthen store loyalty (Keller et al., Reference Keller, Dekimpe and Geyskens2022). Retailers also use premium tiers to reach quality-seeking consumers, commonly pricing PPLs above standard PLs and positioning them closer to mainstream NBs (Geyskens et al., Reference Geyskens, Gielens and Gijsbrechts2010; Gielens et al., Reference Gielens, Ma, Namin, Sethuraman, Smith, Bachtel and Jervis2021). PPLs thus occupy the upper end of the store-brand spectrum and enable more direct competition with NBs (Bazoche et al., Reference Bazoche, Giraud-Héraud and Soler2007). Related studies also indicate that well-designed multi-tier PL portfolios raise perceived quality and price fairness, increasing purchase intentions, and store loyalty (Vazquez-Casielles and Cachero-Martinez, Reference Vazquez-Casielles and Cachero-Martinez2018). This evidence raises the question of how supplement consumers allocate spending across NBs and multi-tier PLs.
During the COVID-19 pandemic, many households became more focused on health and wellness. Demand for vitamin supplements increased as consumers looked for ways to support immune health. Within the category, Vitamins C and D drew particular attention because of their widely discussed links to immune function and general health maintenance (Ahmed et al., Reference Ahmed, Hossain, Chakrabortty, Arafat, Hosen and Khan2023). Still, we know relatively little about how the pandemic changed demand for these supplements, and it remains unclear whether the change reflects category-wide growth or a reallocation of spending across brand tiers. We address these questions with a brand-tier demand analysis of Vitamins C and D supplements. The analysis distinguishes NBs, PPLs, and standard private labels (SPLs). We first estimate aggregate category demand after the pandemic began. We then report an aggregate benchmark for NB–PL substitution by collapsing PL tiers. Next, we examine how the COVID-period indicator and sociodemographic characteristics relate to tier budget shares. Lastly, we quantify tier-specific expenditure and price elasticities, as well as substitution patterns.
We use NielsenIQ Homescan Panel data (2012–2022) to estimate a censored demand system that accounts for nonrandom selection and endogenous expenditure. This framework allows us to assess COVID-period shifts in budget shares and recover tier-level price and expenditure elasticities. Conceptually, the analysis clarifies how standard and PPLs compete with NBs in a credence-good category by mapping tier-specific substitution patterns. It also documents how budget shares differ across household socioeconomic profiles, which provides inputs for retail strategy and targeted public health outreach on disparities in supplement consumption.
2. Literature review
Understanding consumer demand is essential for evaluating market dynamics, informing pricing and positioning, and designing targeted marketing interventions. In differentiated product markets, demand analysis quantifies price sensitivity, brand loyalty, and substitution across alternatives, providing a foundation for managerial decision-making. Most demand system studies stay at the category level and describe overall substitution, but fewer identify elasticities separately for NBs and PLs. Aggregation can therefore mask tier-specific competition and the heterogeneity in substitution patterns across consumer groups.
Turning to the COVID-19 period, studies document noticeable shifts in purchasing between NBs and PLs as economic uncertainty rose. Mookherjee et al. (Reference Mookherjee, Malampallayil, Mohanty and Tran2024) find that although sales of both NBs and PLs increased during the pandemic peak, NB growth later slowed while PLs continued to expand, implying a more persistent move in preferences toward PLs. Consistent with this pattern, Chen and Lim (Reference Chen and Lim2024) show that consumers’ willingness to pay for major brands over PLs declined during COVID-19 and remained lower into 2021–2022, suggesting reduced pricing power for major brands. More broadly, economic downturns can push consumers toward PLs as cost-saving alternatives, and improvements in PL quality may strengthen loyalty when consumers perceive PL quality as comparable to NBs (Czeczotko et al., Reference Czeczotko, Górska-Warsewicz, Laskowski and Rostecka2021; Roggeveen and Sethuraman, Reference Roggeveen and Sethuraman2020). In the vitamin category, this motivates the question of whether shocks like COVID-19 similarly shifted budget shares between NBs and PLs.
In the supplement context, existing research suggests that supplement intake is associated with overall diet quality and that both diet and supplement use differ predictably across demographic and lifestyle groups in the United States. Schroeter et al. (Reference Schroeter, Anders and Carlson2013) identify a positive relationship between supplement intake and the Healthy Eating Index (HEI), with diet quality shaped by demographics and food culture (race/ethnicity, eating location, household size, income, age). Related work shows clear differences in supplement use across population groups. Supplement consumption is higher among women, more educated consumers, and those reporting healthier lifestyles (Gunther et al., Reference Gunther, Patterson, Kristal, Stratton and White2004). Antioxidant intake from supplements also varies systematically with sex, race, age, income, and exercise (Chun et al., Reference Chun, Floegel, Chung, Chung, Song and Koo2010). These patterns motivate our analysis of how sociodemographics are associated with brand-tier budget shares for vitamin supplements.
Regarding NB and PL purchasing behavior, prior work shows that brand-type choice varies with consumer characteristics and economic conditions (Volpe, Reference Volpe2014). Lower-income households tend to buy PLs more often, consistent with tighter budgets and higher price sensitivity (Akbay and Jones, Reference Akbay and Jones2005). Along the same lines, Sethuraman and Gielens (Reference Sethuraman and Gielens2014) indicate that lower-income consumers and larger household size are more likely to purchase PLs due to financial constraints. In the U.S. fluid milk market, Chen et al. (Reference Chen, Saghaian and Zheng2018) find that higher-income households are more likely to shift from PL conventional milk to branded conventional milk. More broadly, Baltas and Argouslidis (Reference Baltas and Argouslidis2007) describe how the image of store brands has evolved and note growing endorsement among higher socioeconomic status consumers. Attitudes toward PLs also differ across settings. For instance, Czeczotko et al. (Reference Czeczotko, Górska-Warsewicz, Laskowski and Rostecka2021) document cross-country differences between Polish and British consumers in PL-related perceptions and motivations, with patterns that vary by age, income, and how long consumers have been purchasing PLs. Finally, Shukla et al. (Reference Shukla, Banerjee and Adidam2013) show that income and education can shape how deal proneness and related tendencies translate into attitudes toward PLs.
While sociodemographic factors shape budget allocation, competitive boundaries between brand tiers are defined by price elasticities and substitution patterns. Collins and George (Reference Collins and George2017) report that consumers often exhibit greater sensitivity to PL prices than to NB prices, though this varies by product category. For example, NBs are highly price sensitive in frozen vegetables and cooking oil, but much less so in pasta and salad dressing (Akbay and Jones, Reference Akbay and Jones2005). Similarly, in categories such as cheese, both lower- and higher-income consumers have been found to be more sensitive to NB prices than to PL prices (Huang et al., Reference Huang, Jones and Hahn2007). These sensitivities also vary with the nature of the good (e.g., luxury vs. necessity) and may be especially important for credence goods, where quality is difficult to verify even after purchase. While substitution between PLs and NBs is common in major food categories (Akbay and Jones, Reference Akbay and Jones2005; Cotterill and Putsis, Reference Cotterill and Putsis2000), some specialized categories, such as conventional milk, show evidence of complementarity between tiers (Chen et al., Reference Chen, Saghaian and Zheng2018). In the vitamin supplement market, where quality is difficult to verify even after purchase and brands often serve as cues for perceived efficacy, tier-level elasticity estimates are important for characterizing substitution patterns.
3. Model
We analyze demand for vitamin C and vitamin D supplements across brand tiers using the QUAIDS model (Banks et al., Reference Banks, Blundell and Lewbel1997), a quadratic extension of the AIDS framework (Deaton and Muellbauer, Reference Deaton and Muellbauer1980). The expenditure share equation of the QUAIDS model is as follows: ${w_{ijh}} = {\alpha _{ij}} + \sum\limits_{j = 1}^J {{\gamma _{ij}}} \ln {p_{ijh}} + {\beta _i}\left( {\ln {x_h} - \ln a(P)} \right) + {\lambda _i}{{{{\left( {\ln {x_h} - \ln a(P)} \right)}^2}} \over {b(P)}} + {u_{ijh}}$
The QUAIDS price aggregators are defined as $\ln a(P) = {\alpha _0} + \sum\limits_i {{\alpha _i}} \ln {p_i} + {1 \over 2}\sum\limits_i {\sum\limits_j {{\gamma _{ij}}} } \ln {p_i}\ln {p_j},$ $ \ln b(P) = \sum _{i} \beta _i \ln p_i, $
where P = (p 1,…,p n ) denotes the vector of prices, a(P) is the translog price index, and b(P) is a Cobb-Douglas-type price index. The price aggregator is:
 $$b(P) = \exp \left( {\sum\limits_{j = 1}^J {{\beta _j}} \ln {p_j}} \right)$$
where w ijh is the budget share for good i, brand j, for household h; p ijh is the average unit value for good i, brand j, for household h; x h is total household expenditure for household h; and u ijh is the residual.
The corresponding model parameters are α i , γ ij , β i , λ i , and d i . These parameters satisfy three sets of restrictions:
 $$\sum\limits_i {{\alpha _i}} = 1,\quad \sum\limits_i {{\beta _i}} = 0,\quad \sum\limits_i {{\gamma _{ij}}} = 0,\quad \sum\limits_j {{\gamma _{ij}}} = 0,\quad {\rm{and}}\quad {\gamma _{ij}} = {\gamma _{ji}}.$$
Following (Pollak and Wales Reference Pollak and Wales1978), we incorporate sociodemographics linearly: ${w_{ijh}} = {\alpha _{ij}} + \sum\limits_{j = 1}^J {{\gamma _{ij}}} \ln {p_{ijh}} + {\beta _i}\left( {\ln {x_h} - \ln a(P)} \right) + {\lambda _i}{{{{\left( {\ln {x_h} - \ln a(P)} \right)}^2}} \over {b(P)}} + {d_{ij}}{D_h} + {u_{ijh}}$
where D h is a vector of household sociodemographic characteristics for household h.
The sample exhibits a censoring issue due to zero expenditures. Such zeros may reflect low preferences, budget constraints, limited availability, or infrequent purchasing. Failing to address the censored dependent variable may lead to biased estimation results (Caro et al., Reference Caro, Melo, Molina and Salgado2021). To correct the censoring issue, we apply two-step estimation techniques proposed by Heien and Wesseils (Reference Heien and Wesseils1990). The first step involves performing a probit regression to determine the probability that households consume a specific type of brand. The inverse Mills ratio (IMR) is then computed for each household and incorporated linearly in the second step of the demand system estimation: ${w_{ijh}} = {\alpha _{ij}} + \sum\limits_{j = 1}^J {{\gamma _{ij}}} \ln {p_{ijh}} + {\beta _i}\left( {\ln {x_h} - \ln a(P)} \right) + {\lambda _i}{{{{\left( {\ln {x_h} - \ln a(P)} \right)}^2}} \over {b(P)}} + {d_{ij}}{D_h} + {\nu _{ij}}{\rm{IM}}{{\rm{R}}_{ij}} + {u_{ijh}}$
Total expenditure may be endogenous if unobserved household characteristics affect both expenditure and demand behavior. To address this concern, we use the logarithm of disposable household income as an instrumental variable, and apply a control-function approach following (Blundell and Robin, Reference Blundell and Robin1999). Log income is commonly used as an instrument in expenditure-allocation settings where income is plausibly exogenous (Bakhtavoryan et al., Reference Bakhtavoryan, Cheng, Capps and Dharmasena2022; Fashogbon and Oni, Reference Fashogbon and Oni2013; Zheng and Henneberry, Reference Zheng and Henneberry2010).Footnote 1 In the first stage, we regress total expenditure on all exogenous variables and the instrument, and then include the first-stage residual as an additional regressor in the demand system.
Expenditure, uncompensated, and compensated elasticities are derived by differentiating Equation (6) with respect to expenditure x and price p. The elasticities are defined as follows:
Expenditure elasticities: ${\eta _i} = {{{\mu _i}} \over {{w_i}}} + 1$
Uncompensated own-price and cross-price elasticities: $\varepsilon _{ij}^u = {{{\mu _{ij}}} \over {{w_i}}} - {\delta _{ij}}$
Compensated own-price and cross-price elasticities: $ \varepsilon _{ij}^{c} = \varepsilon _{ij}^{u} + \eta _i w_j $
where ${\mu _i} = {\beta _i} + {{2{\lambda _i}} \over {b(P)}}\log \left( {{{x - a(P)} \over {a(P)}}} \right)$ ${\mu _{ij}} = {r_{ij}} - {\mu _i}\left( {{a_j} + \sum\limits_{k = 1}^J {{\gamma _{jk}}} \log ({p_k})} \right) - {{{\lambda _i}{\beta _j}} \over {b(P)}}{\left( {\log \left( {{{x - a(P)} \over {b(P)}}} \right)} \right)^2},$
and δ ij is the Kronecker delta, which equals 1 if i = j and 0 otherwise.
4. Data
We use NielsenIQ Homescan Consumer Panel data, a common source for studying consumer choice, firm strategy, and price measurement (Dubois et al., Reference Dubois, Griffith and O’Connell2022). The panel is nationally representative and reports comprehensive sociodemographic information for each household, along with details for every shopping trip, including quantities purchased, total expenditure, promotion use, and retail channels.
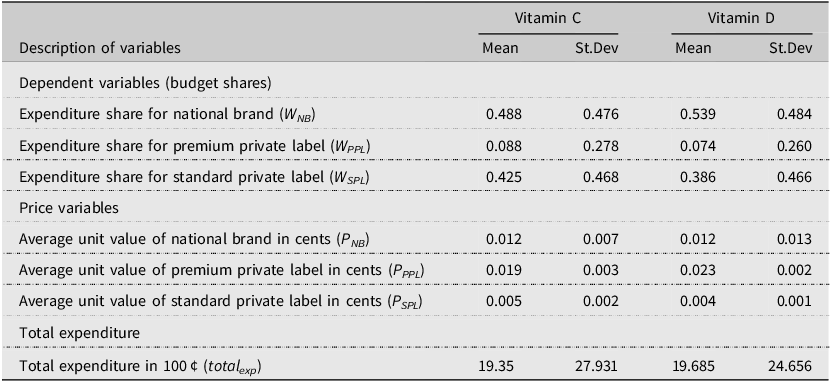
For this study, we used NielsenIQ Homescan panel data from 2012 to 2022. The final sample includes 23,504 shopping trips for Vitamin C across 11,448 households and 23,117 shopping trips for Vitamin D across 11,843 households. Table 1 reports summary statistics for the key variables in the QUAIDS model. For each household and trip, we computed a unit value by dividing total expenditure by total quantity purchased; these unit values serve as proxies for retail prices. However, prices are missing for non-purchase observations, so we imputed them following standard practice in demand estimation with unit values (Heien and Wesseils, Reference Heien and Wesseils1990; Kyureghian et al., Reference Kyureghian, Capps and Nayga2011; Zhen et al., Reference Zhen, Finkelstein, Nonnemaker, Karns and Todd2014). Specifically, we regressed observed unit values on household sociodemographic characteristics, Census region indicators, and the COVID-19 indicator using a semi-log specification. We then exponentiated the fitted values to obtain predicted unit values. We estimated this regression separately for each vitamin and each brand tier, and used the resulting predictions to replace missing prices. Similar imputation strategies have been applied in recent household- and micro-demand settings (Bakhtavoryan et al., Reference Bakhtavoryan, Cheng, Capps and Dharmasena2022; Capps et al., Reference Capps, Jia, Mishra and Ogieriakhi2024; Zheng and Henneberry, Reference Zheng and Henneberry2010).
Descriptive statistics of key variables in QUAIDS model

Table 1 Long description
A table comparing summary statistics of key variables in the QUAIDS model for Vitamin C and Vitamin D. The table has 11 rows and 6 columns. The columns are Description of variables, Vitamin C Mean, Vitamin C St.Dev, Vitamin D Mean, and Vitamin D St.Dev. The rows are grouped into Dependent variables (budget shares), Expenditure share for national brand, Expenditure share for premium private label, Expenditure share for standard private label, Price variables, Average unit value of national brand in cents, Average unit value of premium private label in cents, Average unit value of standard private label in cents, Total expenditure, and Total expenditure in 100 cents. Row 1: Dependent variables (budget shares), , , , . Row 2: Expenditure share for national brand, 0.488, 0.476, 0.539, 0.484. Row 3: Expenditure share for premium private label, 0.088, 0.278, 0.074, 0.260. Row 4: Expenditure share for standard private label, 0.425, 0.468, 0.386, 0.466. Row 5: Price variables, , , , . Row 6: Average unit value of national brand in cents, 0.012, 0.007, 0.012, 0.013. Row 7: Average unit value of premium private label in cents, 0.019, 0.003, 0.023, 0.002. Row 8: Average unit value of standard private label in cents, 0.005, 0.002, 0.004, 0.001. Row 9: Total expenditure, , , , . Row 10: Total expenditure in 100 cents, 19.35, 27.931, 19.685, 24.656.
To assess heterogeneity by income, we classified households into three income categories. We applied the federal poverty line (FPL) guidelines determined by the Department of Health and Human Services (HHS) for each year, as it adjusts the income threshold based on household size (Creamer et al., Reference Creamer, Shrider, Burns and Chen2022). “Lower” income households are those that earn up to 200 percent of the federal poverty guidelines for their household size. Households earning between 200 percent and 400 percent of the federal poverty guidelines are classified as the “middle” income. Households earning over 400 percent of federal poverty guidelines are considered the “high” income. This classification has been used in prior studies (Echeverría et al., Reference Echeverría, Vélez-Valle, Janevic and Prystowsky2014; Wiener et al., Reference Wiener, Sambamoorthi, Hayes and Chertok2016). In addition, since the NielsenIQ data does not provide exact income values for each household, but instead offers income ranges, we used the median value within each range as a proxy for actual income. For instance, for households in the income range between 70, 000 and 99, 999, we used 84, 999.5 as their representative income.
To distinguish the brand tiers, we employed a two-tier scheme for PLs (Bazoche et al., Reference Bazoche, Giraud-Héraud and Soler2007; Geyskens et al., Reference Geyskens, Gielens and Gijsbrechts2010; Keller et al., Reference Keller, Dekimpe and Geyskens2022). Note that, NielsenIQ Homescan panel data masked all the private-label brands’ information and grouped them under controlled brands (“CTL BR” in the dataset). Due to the limitations of the brand information, we differentiated PLs based on their unit prices. Following the summary by Keller et al. (Reference Keller, Dekimpe and Geyskens2022), PLs were classified as “premium” if their average unit price was equal to or greater than 80% of the average unit price of NBs. PLs with an average unit price lower than 80% of the average NB price were then classified as “standard.”Footnote 2 Footnote 3 As shown in Table 1, NBs and standard PLs vitamin C comprise similar budget shares, and as expected, PPLs take up the smallest share. For vitamin D, NBs account for the dominant expenditure share, followed by standard PLs.
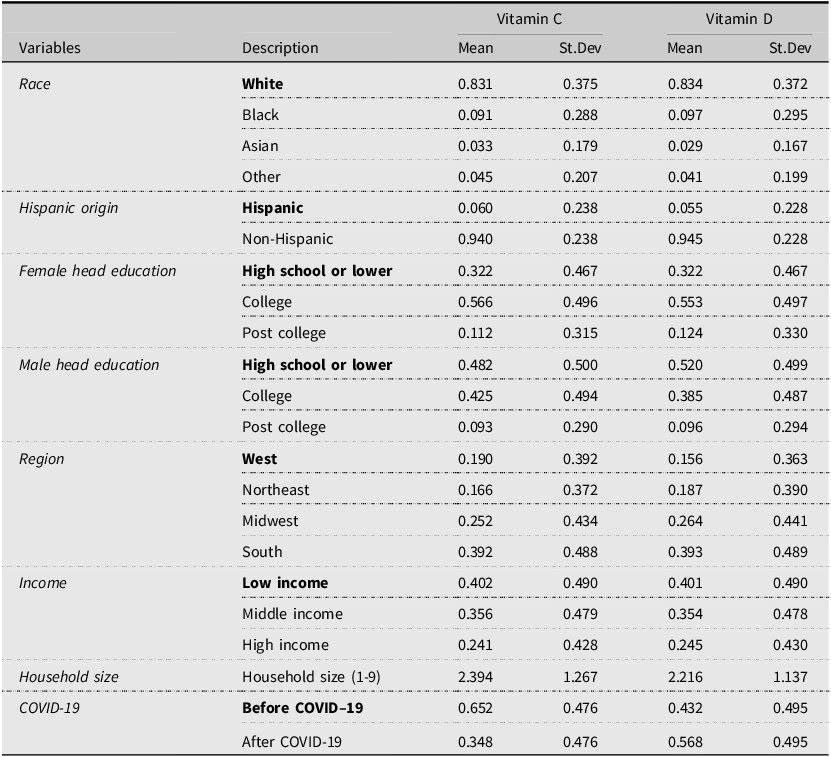
Descriptive statistics of the key explanatory variables are shown in Table 2. The sociodemographic variables incorporated into the demand system are: race, ethnicity, female household head education level, male household head education level, residence region, and income. In addition to sociodemographic variables, we added an indicator variable for COVID-19, where 1 represents a shopping trip that occurred on or after March 11, 2020, the date on which the World Health Organization (WHO) declared the COVID-19 outbreak a global pandemic, and 0 if the purchase occurred before that date.
Descriptive statistics for explanatory variables in the QUAIDS model
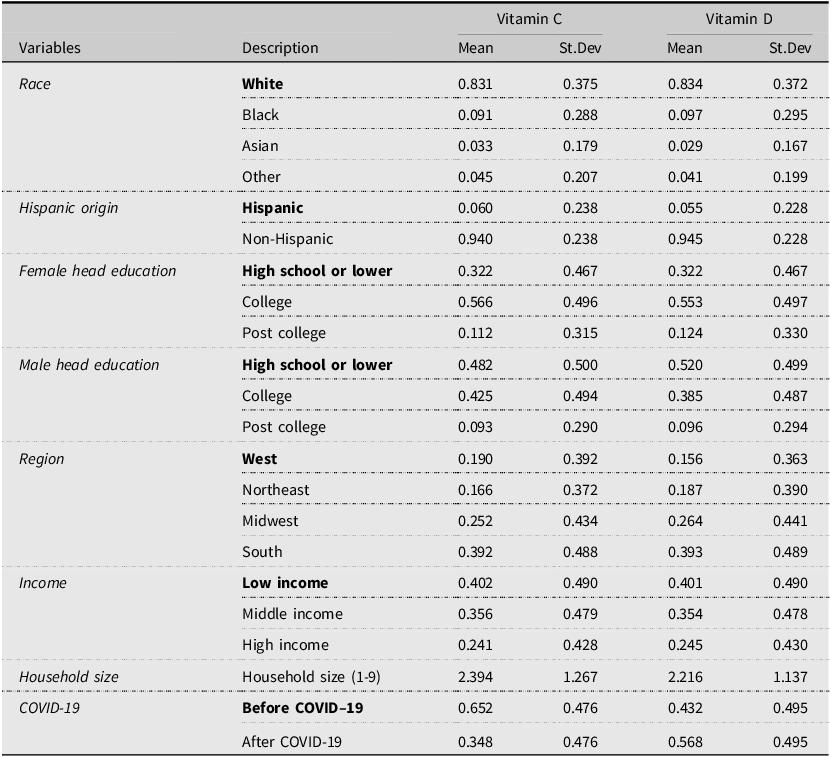
Table 2 Long description
A table with descriptive statistics for explanatory variables in the QUAIDS model. The table has 10 rows and 8 columns. The columns are labeled as Variables, Description, Vitamin C Mean, Vitamin C St.Dev, Vitamin D Mean, and Vitamin D St.Dev. The rows are grouped under different categories: Race, Hispanic origin, Female head education, Male head education, Region, Income, Household size, and COVID-19. Each row provides the mean and standard deviation for Vitamin C and Vitamin D. For example, under the Race category, the row for White shows a Vitamin C mean of 0.831 and a standard deviation of 0.375, and a Vitamin D mean of 0.834 and a standard deviation of 0.372. The table captures various sociodemographic variables and their impact on Vitamin C and Vitamin D statistics.
Note: The reference group in each category is in boldface.
5. Empirical results
5.1. Aggregate demand shifts during COVID-19
Before analyzing brand-tier allocation, we first examined whether aggregate category demand shifted after the pandemic’s onset. For each vitamin supplement, we aggregate the purchases to the month level, compute the total quantity Q
m
and an average paid unit price P
m
. We then estimate the following log-linear model: log Q
m
= α + βlog P
m
+ δ Post
m
+ θ
month(m) + u
m
which includes month-of-year fixed effects and HC1-robust standard errors. We obtain
 $$\hat \delta = 0.314$$
(s.e. 0.0415, p < 0.001) for Vitamin C and
$$\hat \delta = 0.314$$
(s.e. 0.0415, p < 0.001) for Vitamin C and
 $$\hat \delta = 0.268$$
(s.e. 0.106, p = 0.0127) for Vitamin D, implying about a 37.0% and 30.8% increase in monthly category quantity in the post-pandemic onset, respectively (e
0.314 − 1 ≈ 0.370; e
0.268 − 1 ≈ 0.308). The log P
m
term serves only as a control for equilibrium price in the aggregate market. The results point to an increase in category-level demand, which motivates our subsequent analysis of how households reallocated spending across brand tiers.
$$\hat \delta = 0.268$$
(s.e. 0.106, p = 0.0127) for Vitamin D, implying about a 37.0% and 30.8% increase in monthly category quantity in the post-pandemic onset, respectively (e
0.314 − 1 ≈ 0.370; e
0.268 − 1 ≈ 0.308). The log P
m
term serves only as a control for equilibrium price in the aggregate market. The results point to an increase in category-level demand, which motivates our subsequent analysis of how households reallocated spending across brand tiers.
5.2. Econometric specification and demand system diagnostics
To analyze the dynamics of the multi-tier market, we estimated QUAIDS by iterated linear least squares using aidsills in Stata (Blundell and Robin, Reference Blundell and Robin1999; Lecocq and Robin, Reference Lecocq and Robin2015). Because total expenditure may be endogenous, we instrumented it with log disposable income in the first stage and included the fitted residual in each share equation. We handled censoring using a separate participation equation and included the inverse Mills ratio (IMR) in all share equations. Following standard demand system practice, the adding-up condition is imposed during estimation. We then formally tested the remaining fundamental neoclassical restrictions: homogeneity and Slutsky symmetry. When a restriction is supported, we re-estimated a restricted system that imposes the supported condition. In the restricted systems, the implied elasticities satisfy the standard identities to numerical tolerance: Engel aggregation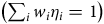 $\left (\sum _i w_i\eta _i = 1\right )$
, price adding–up
$\left (\sum _i w_i\eta _i = 1\right )$
, price adding–up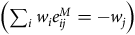 $\left (\sum _i w_i e^M_{ij} = -w_j\right )$
, homogeneity
$\left (\sum _i w_i e^M_{ij} = -w_j\right )$
, homogeneity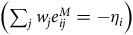 $\left (\sum _j w_j e^M_{ij} = -\eta _i\right )$
, and Slutsky symmetry/adding–up
$\left (\sum _j w_j e^M_{ij} = -\eta _i\right )$
, and Slutsky symmetry/adding–up $\left (w_i e^H_{ij} = w_j e^H_{ji},\ \sum _j w_j e^H_{ij} = 0\right )$
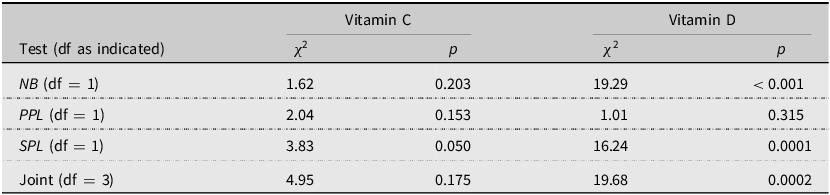
. For Vitamin C, the unrestricted system does not reject symmetry and does not reject homogeneity; the joint test also fails to reject. For Vitamin D, the unrestricted system rejects symmetry (all pairs) and rejects homogeneity in two equations; the joint test rejects. Accordingly, we reported and interpreted the restricted systems that enforce adding–up and the set of non-rejected restrictions. Full Wald statistics (pairwise symmetry; equation-level and joint homogeneity) are reported in Appendix Tables A1 and A2.
$\left (w_i e^H_{ij} = w_j e^H_{ji},\ \sum _j w_j e^H_{ij} = 0\right )$
. For Vitamin C, the unrestricted system does not reject symmetry and does not reject homogeneity; the joint test also fails to reject. For Vitamin D, the unrestricted system rejects symmetry (all pairs) and rejects homogeneity in two equations; the joint test rejects. Accordingly, we reported and interpreted the restricted systems that enforce adding–up and the set of non-rejected restrictions. Full Wald statistics (pairwise symmetry; equation-level and joint homogeneity) are reported in Appendix Tables A1 and A2.
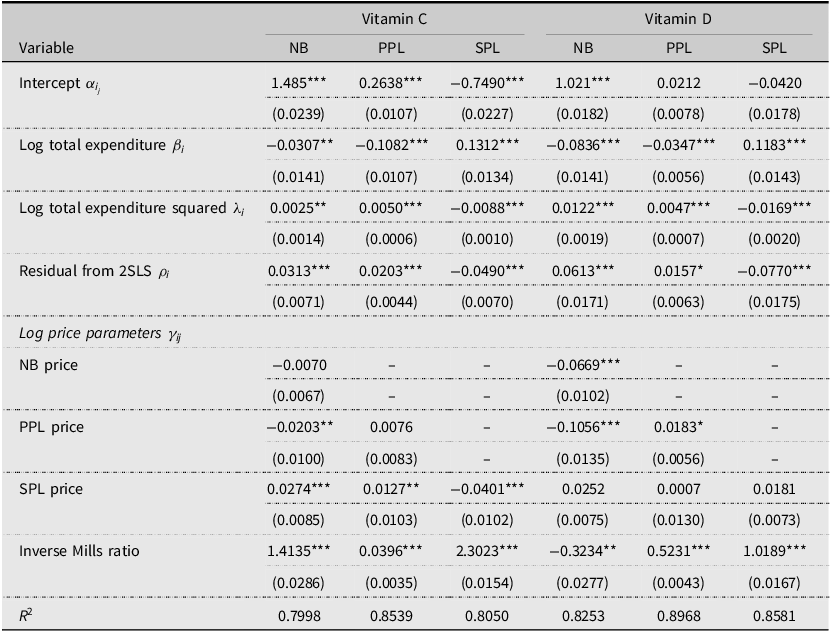
Table 3 presents the parameter estimates, corresponding standard errors, and the goodness-of-fit for the QUAIDS demand system. Most of the parameters are statistically different from zero at the conventional significance levels. The significance of the squared log total expenditure supports the quadratic extension relative to the AIDS specification. We included IMR when estimating the QUAIDS model because the unobserved component in the share equation can be correlated with the purchase incidence decision; ignoring this bias would typically lead to a substantial underestimation of expenditure elasticities and qualitative misestimation of substitution effects (Alviola and Capps, Reference Alviola and Capps2010; Kharisma et al., Reference Kharisma, Hasanah, Soemitro Remi and Sanjaya2024; Zheng and Henneberry, Reference Zheng and Henneberry2010). Under the standard control–function assumptions (correctly specified first stage, valid exclusion, and joint normality of the selection and outcome errors), the inclusion of the IMR yields consistent QUAIDS parameters and elasticities. The significance of IMR indicates selection bias is present; it does not mechanically “prove the bias is removed,” but the control-function approach yields consistency under the standard assumptions. Empirically, we jointly test whether all IMR terms equal zero across the three share equations. For Vitamin C the null is decisively rejected (χ 2(6) = 50, 747.63, p < 0.001), and likewise for Vitamin D (χ 2(6) = 48, 289.89, p < 0.001). This strong statistical evidence confirms the presence of substantial nonrandom participation in our data, making the IMR correction important for consistent estimation under standard assumptions.
Parameters for QUAIDS model
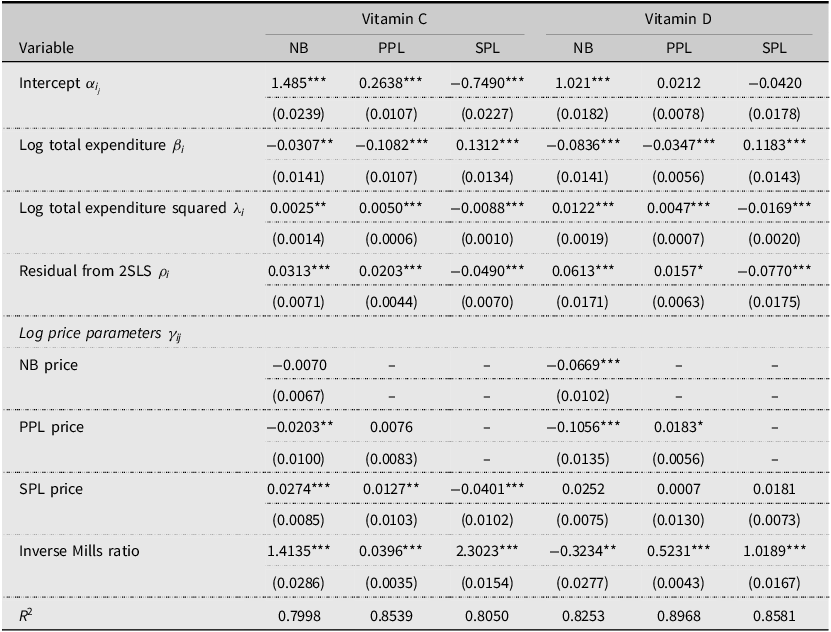
Table 3 Long description
The table presents parameter estimates for Vitamin C and Vitamin D across different models, including NB, PPL, and SPL. It has 14 rows and 7 columns. The columns are labeled as follows: Variable, Vitamin C NB, Vitamin C PPL, Vitamin C SPL, Vitamin D NB, Vitamin D PPL, and Vitamin D SPL. The rows include variables such as Intercept, Log total expenditure, Log total expenditure squared, Residual from 2SLS, NB price, PPL price, SPL price, and Inverse Mills ratio. Each cell contains a value and a standard error in parentheses. Notable trends include significant values for Intercept, Log total expenditure, Log total expenditure squared, and Residual from 2SLS across all models. The Inverse Mills ratio shows significant values for all models except Vitamin D SPL. The table also includes R-squared values at the bottom for each model.
Note: Standard errors in parentheses. ***, **, * indicate significant at 1%, 5%, and 10%, respectively.
We used log disposable income as an instrumental variable for total category expenditure. It shifts category spending (budget size) but, conditional on total expenditure and controls, should not directly affect within-category brand-tier allocation. We assess instrument validity along two dimensions. First, in the first-stage regressions of total expenditure on the instrument (log income) and controls, the excluded-instrument F-statistics are strong (Vitamin C: F 1, 11428 = 11.12, p = 0.0009; Vitamin D: F 1, 11823 = 25.64, p < 0.001), exceeding the common weak-IV heuristic of F > 10 (Stock and Yogo, Reference Stock and Yogo2005). Second, OLS “balance” regressions of the instrument on the full set of controls have low explanatory power (Vitamin C: R 2 = 0.0192 with joint test F 18, 11428 = 10.73, p < 0.001; Vitamin D: R 2 = 0.0203 with joint test F 18, 11823 = 12.07, p < 0.001), indicating the instrument is not merely a proxy for observables. These diagnostics support the instrument’s credibility for identifying variation in total expenditure. Taken together, the two-step estimation approach for the QUAIDS demand system is well justified.
5.3. Aggregate substitution between national brands and private labels
We next assess substitution between NBs and PLs at the aggregate brand-type level by collapsing premium and standard PLs into a single PL and re-estimating the demand system using the same model specification. At the aggregate level, own-price elasticities are elastic for both brand types in both vitamins. The uncompensated own-price elasticity is −1.049 for NB and −1.150 for PL in Vitamin C, and −1.055 for NB and −1.210 for PL in Vitamin D, indicating that quantities respond strongly to price changes at the brand-type level. Cross-price elasticities are positive and statistically significant, confirming the NB–PL substitution in aggregate. In compensated terms, the cross-price elasticity is 0.613 (NB with respect to PL price) and 0.586 (PL with respect to NB price) for Vitamin C, and 0.578 and 0.688 for Vitamin D. Taken together, this aggregate benchmark indicates meaningful substitution between NBs and PLs, consistent with prior literature documenting substitution between PLs and NBs in retail categories (Akbay and Jones, Reference Akbay and Jones2005; Cotterill and Putsis, Reference Cotterill and Putsis2000; Huang et al., Reference Huang, Jones and Hahn2007). Because this benchmark collapses PL tiers, it masks within-PL heterogeneity. The tier-level results below reveal that substitution patterns differ across standard and PPLs.
5.4. Sociodemographic heterogeneity in brand-tier budget shares
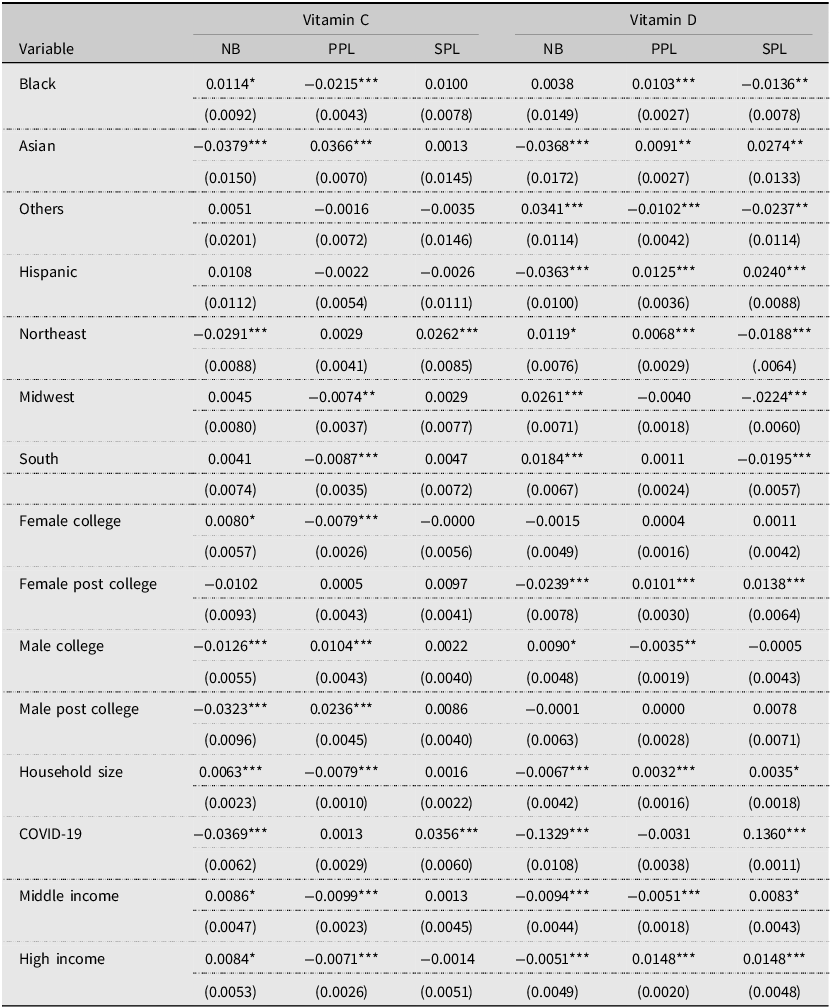
Table 4 reports the estimated effects of the COVID-period indicator and household characteristics on brand-tier budget shares. Conditional on total expenditure and controls, the COVID-19 indicator is significantly negative for NBs and significantly positive for SPLs for both vitamins, while the effect for PPLs is not statistically significant. This pattern reveals a within-category reallocation of budget shares away from NBs and toward SPLs.
QUAIDS estimation: sociodemographic covariates and COVID-period indicator

Table 4 Long description
The table presents the estimated effects of the COVID-period indicator and household characteristics on brand-tier budget shares for vitamins C and D. It includes columns for different variables such as Black, Asian, Others, Hispanic, Northeast, Midwest, South, Female college, Female post college, Male college, Male post college, Household size, COVID-19, Middle income, and High income. Each variable is analyzed across three brand tiers: NB, PPL, and SPL for both Vitamin C and Vitamin D. The table lists the estimated effects and their standard errors for each variable and brand tier. Notable trends include significant negative effects of the COVID-19 indicator for NBs and significant positive effects for SPLs for both vitamins, indicating a reallocation of budget shares within categories.
Note: Standard errors in parentheses. ***, **, * indicate significance at 1%, 5%, and 10%, respectively.
Beyond the pandemic effect, several sociodemographic factors are associated with budget allocation across tiers. Compared to White households, Black households have a higher budget share for NB vitamin C and a lower budget share for SPL vitamin D. Asian households allocate a larger budget share to PPLs for both vitamins and a smaller budget share to NBs. Households of Hispanic origin have a smaller budget share for NB vitamin D and a larger budget share for SPLs. There is no significant difference in the budget share of vitamin C for households of Hispanic origin.
Regional patterns vary by vitamin and brand tier. The budget share for NB vitamin C is lower, but it is higher for SPLs among households living in the Northeast compared to those residing in the West. Conversely, for vitamin D, the budget share is significantly higher for NBs but lower for SPLs. In the Midwest, households allocate a higher budget share to NB vitamin D and a lower budget share to SPL vitamin D. Households in the South have a higher budget share for NB Vitamin D but a smaller budget share for SPLs. No statistically significant differences are observed for NB and SPL vitamin C between households in the South and those in the West.
The association between household size and the budget shares of NBs differs across vitamin C and D. For vitamin D, larger households allocate a lower budget share to NBs and higher shares to both PPLs and SPLs (all statistically significant). In contrast, for vitamin C the NB share is positively associated with household size, while the PPL share is negatively associated; the SPL coefficient is small and not statistically different from zero. A plausible interpretation is that larger households economize on routine vitamin D via PLs, while vitamin C purchases (often more episodic) remain NB-leaning due to perceived quality differences or pack-size effects.
Education patterns are heterogeneous across vitamins and tiers. Female household heads with postcollege education exhibit lower NB and higher PL (SPL and PPL) shares for vitamin D. For vitamin C, male household heads with college degrees allocate lower NB and higher PPL shares. The effects are modest or not statistically significant elsewhere. These findings are broadly consistent with evidence suggesting that more educated consumers are more prone to purchasing private labels as they rely less on brand names as extrinsic cues (Lybeck et al., Reference Lybeck, Holmlund-Rytkönen and Sääksjärvi2006; Richardson et al., Reference Richardson, Jain and Dick1996). Where differences from prior work appear, they likely reflect category-specific credence attributes and pandemic-era search/assortment frictions.
Income gradients also differ by vitamin. For vitamin D, both middle- and high-income households allocate more of their budget to SPLs and less to NBs than low-income households. Middle-income households also have lower PPL shares, whereas high-income households allocate relatively more to PPLs. For vitamin C, middle- and high-income households devote a larger budget share to NBs and a smaller share to PPLs than low-income households, with SPL shares not significantly different across income groups. Notably, higher income is associated with a lower NB share for vitamin D but a higher NB share for vitamin C.
5.5. Brand-tier elasticities and substitution patterns
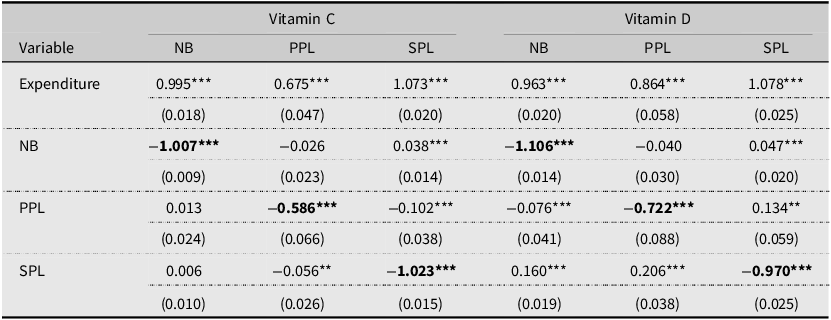
We reported the expenditure elasticities and uncompensated (Marshallian) own- and cross-price elasticities in Table 5. Adding-up holds by construction; minor deviations reflect rounding and evaluation at sample means. The total-expenditure elasticities are positive and statistically significant for all tiers in both vitamins. NB and SPL elasticities are near unity, indicating that quantities scale roughly proportionally with category spending, whereas PPL elasticities are smaller. For example, a 1% increase in total expenditure is associated with an approximately 0.995% increase in the quantity demanded of NB vitamin C.
Total expenditure, uncompensated (Marshallian) elasticities for vitamin C and vitamin D
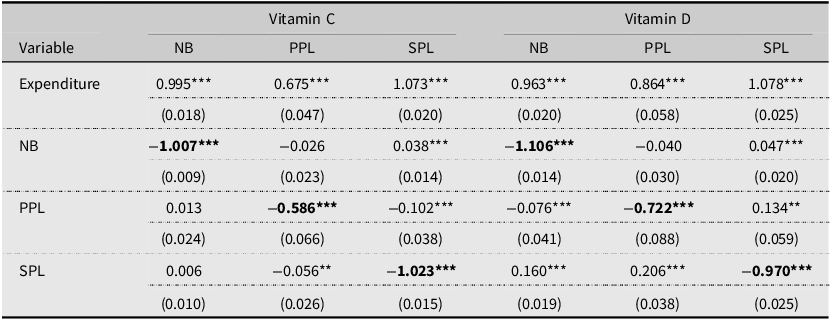
Table 5 Long description
The table presents the total expenditure, uncompensated (Marshallian) elasticities for vitamin C and vitamin D. It has 7 rows and 7 columns. The columns are labeled as Expenditure, NB, PPL, SPL for both Vitamin C and Vitamin D. The rows are labeled as Expenditure, NB, PPL, SPL. Row 1: Expenditure, 0.995, 0.675, 1.073, 0.963, 0.864, 1.078. Row 2: NB, -1.007, -0.026, 0.038, -1.106, -0.040, 0.047. Row 3: PPL, 0.013, -0.586, -0.102, -0.076, -0.722, 0.134. Row 4: SPL, 0.006, -0.056, -1.023, 0.160, 0.206, -0.970. The table includes standard errors in parentheses below each value.
Note: Standard errors in parentheses. *** and ** indicate significance at the 1% and 5% levels, respectively.
Own-price elasticities are negative and statistically significant across tiers. NB own-price elasticities are −1.007 for Vitamin C and −1.106 for Vitamin D, while SPL elasticities are −1.023 and −0.970, respectively, indicating strong price responsiveness in these tiers. By contrast, PPL own-price elasticities are smaller in magnitude, pointing to weaker price sensitivity. Overall, NB and SPL demand is elastic for both vitamins, whereas PPL demand is inelastic, consistent with an upmarket positioning that relies more on perceived quality than price-based competition (Ter Braak et al., Reference Ter Braak, Geyskens and Dekimpe2014). This pattern is informative given that prior evidence on whether NBs are more or less price sensitive than PLs is mixed and category-dependent (Bijmolt et al., Reference Bijmolt, Van Heerde and Pieters2005; Cotterill and Putsis, Reference Cotterill and Putsis2000; Huang et al., Reference Huang, Jones, Hahn and Leone2012; Maynard and Veeramani, Reference Maynard and Veeramani2003).
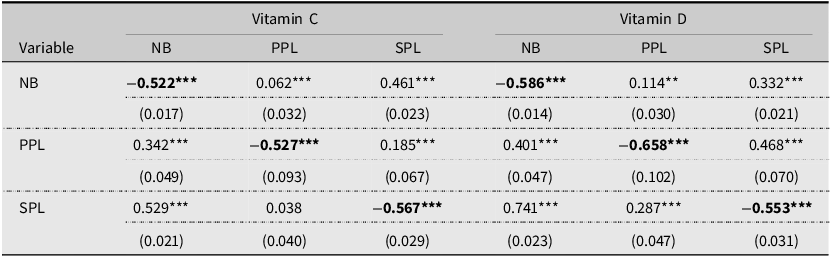
Table 6 reports compensated (Hicksian) elasticities, which hold utility constant and thus isolate substitution effects. Most cross-price elasticities are positive and significant at conventional significance level. Substitution is asymmetric between NBs and PPLs: PPL demand responds strongly to NB price increases, while NB demand responds weakly to PPL price increases. For example, a 1% increase in NB price raises PPL demand by 0.342% in Vitamin C and 0.401% in Vitamin D, while a 1% increase in PPL price raises NB demand by only 0.062% and 0.114%, respectively. Substitution between NBs and SPLs is also statistically significant and is typically stronger than the NB–PPL channel. This stronger NB–SPL substitution is consistent with tiered private-label competition: SPLs (value-oriented) are positioned closer to NBs on price, whereas PPLs (quality-oriented) tend to differentiate more on quality and positioning (Ter Braak et al., Reference Ter Braak, Dekimpe and Geyskens2013a, Reference Ter Braak, Geyskens and Dekimpe2014)
Compensated (Hicksian) own price and cross-price elasticities for vitamin C and vitamin D
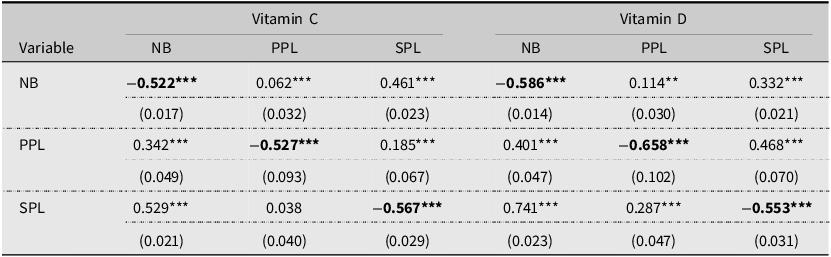
Table 6 Long description
The table presents compensated (Hicksian) own price and cross-price elasticities for vitamin C and vitamin D. It has six columns and four rows, including headers and labels. The columns are labeled as NB, PPL, and SPL for both Vitamin C and Vitamin D. The rows are labeled as NB, PPL, and SPL. The table includes the following data: Row 1: NB, -0.522***, 0.062***, 0.461***, -0.586***, 0.114**, 0.332***; Row 2: PPL, 0.342***, -0.527***, 0.185***, 0.401***, -0.658***, 0.468***; Row 3: SPL, 0.529***, 0.038, -0.567***, 0.741***, 0.287***, -0.553***. The values are accompanied by their respective standard errors in parentheses.
Note: Standard errors in parentheses. *** and ** indicate significance at the 1% and 5% levels, respectively.
Vitamin C and Vitamin D show different tier responses, consistent with differences in purchase motives. Vitamin D supplementation is often routine and long-term (daily maintenance), whereas Vitamin C purchases tend to be more episodic and tied to short-term health concerns (Bailey et al., Reference Bailey, Dodd, Gahche, Dwyer, Cowan, Jun and Eicher-Miller2019; Wolpowitz and Gilchrest, Reference Wolpowitz and Gilchrest2006). In line with this distinction, the NB own-price elasticity is larger in magnitude for Vitamin D (−1.106) than for Vitamin C (−1.007), indicating slightly greater price sensitivity for the maintenance-oriented product. This difference also appears in substitution: compared to Vitamin C, demand shifts toward SPLs more strongly when NB prices increase in the Vitamin D category, suggesting greater willingness to trade down for the routine supplement. Overall, the elasticity and substitution patterns imply that the routine purchases are more price responsive than episodic purchases.
To compare the substitution strength between brands, we test differences between compensated cross-price elasticities using a conservative z-test that treats the two estimates as independent. For Vitamin C, NB demand responds more strongly to SPL than to PPL prices (0.461 vs. 0.062; difference = 0.399, z ≈ 10.13), and SPL demand responds more to NB than does PPL demand (0.529 vs. 0.342; difference = 0.187, z ≈ 3.51). For Vitamin D, NB demand likewise responds more to SPL than to PPL prices (0.332 vs. 0.114; difference = 0.218, z ≈ 5.96). In the reverse direction, SPL demand responds more to NB than to PPL prices (0.741 vs. 0.401; difference = 0.340, z ≈ 6.50). Together, these results indicate that multiple PL tiers substitute for NBs, with standard PL exerting the stronger competitive pressure than PPL for both vitamins.
6. Discussion and conclusions
While most research on vitamin supplements focuses on health outcomes, labeling, or broad marketing effects, relatively few studies quantify brand-tier demand and substitution in vitamins (Abe-Matsumoto et al., Reference Abe-Matsumoto, Sampaio and Bastos2018; Chou et al., Reference Chou, Chen and Shen2024; Dickinson et al., Reference Dickinson, Blatman, El-Dash and Franco2014; Speakman et al., Reference Speakman, Michienzi and Badowski2021). In this study, we address this gap by examining U.S. household demand for Vitamins C and D supplements. Using NielsenIQ Homescan Panel data through 2022, we estimate the effects of macro-level shocks, including COVID-19. We then apply a censored QUAIDS system to quantify brand-tier demand and examine how price competition and sociodemographic factors shape household budget allocation across tiers. Our results indicate that the COVID-19 period was associated with an expansion in category-level demand for Vitamins C and D supplements. During COVID, households shifted budget shares from NBs toward SPLs, with little evidence of a shift in PPLs. We observe heterogeneity by sociodemographics in tier preferences and switching patterns. Price responses differ across brand tiers. Demand for NBs and SPLs is elastic, indicating the quantity demanded responds strongly to price changes, whereas PPL demand is relatively price-insensitive. Substitution patterns are asymmetric. SPLs exert stronger competitive pressure on NBs than do PPLs. The patterns also differ across vitamins. Vitamin D exhibits slightly higher price sensitivity and stronger substitution; Vitamin C shows relatively stronger brand persistence and weaker price-driven reallocation.
This study makes several contributions. Theoretically, we extend understanding of brand-tier competition in a credence-good category by documenting asymmetric substitution across tiers. The estimated elasticities highlight different roles for PLs within retailer assortments. In our estimates, SPLs compete mainly through price-driven switching away from NBs, while PPLs compete more through quality-based differentiation. This suggests retailers can use tiered PLs to attract price-sensitive shoppers with value tiers while maintaining margins through premium tiers. We also relate these substitution patterns to whether supplementation is routine or episodic, which helps explain differences in brand loyalty and price sensitivity across vitamins. On the methods side, we implement a practical demand system framework that deals with censoring and endogeneity using NielsenIQ Homescan data through 2022. To our knowledge, this is among the first studies to combine NielsenIQ Homescan data through 2022 with a censored QUAIDS framework for vitamin supplements. We estimate a censored QUAIDS system and correct for selection using IMRs. We then instrument total expenditure to address endogeneity, which makes the implied elasticities more credible to interpret. This approach can be applied to other supplement categories and credence goods where zero expenditure is common. Overall, the framework supports clearer inference on tier-level substitution and reallocation by reducing concerns about nonrandom selection and biased expenditure measurement.
The findings have practical implications for retailers, manufacturers, and policymakers. The budget share shift toward PLs during COVID-19 suggests that major economic shocks may weaken national-brand attachment. This informs marketing and loyalty strategies for retaining consumers during disruptions and the subsequent recovery period. Prior work suggests that when consumers try a lower-priced option for the first time, they may perceive comparable quality relative to some NB alternatives, which may strengthen loyalty to PLs. In that sense, shocks can give retailers an opportunity to reshape perceptions through stronger positioning of both value and PPL tiers, and to adjust PL strategy or launch new programs. Accordingly, retailers should ensure the availability of lower-cost alternatives during future disruptions. Regarding competitive brand-tier strategy, our results reinforce that retailers should manage standard and PPL tiers separately, since multi-tier PL can influence retailers’ marketing actions toward NBs (Akcura et al., Reference Akcura, Sinapuelas and Wang2019). Stores can enhance PPL profitability and store image by emphasizing positioning, verified quality cues, and format innovation (Gielens et al., Reference Gielens, Ma, Namin, Sethuraman, Smith, Bachtel and Jervis2021). Because the demand for NBs and SPLs is more price elastic, retailers may use more frequent price promotions to drive volume and capture trading down segments.
For NB manufacturers, the strong NB–SPL substitution highlights the need to manage brands across the entire purchase funnel (Lemon and Verhoef, Reference Lemon and Verhoef2016). In addition to consumer-facing differentiation, manufacturers may consider strategic collaboration with retailers (e.g., supplying PL products) as part of relationship management and shelf-access strategy, as evidence suggests PL production can increase the likelihood of securing shelf presence for NBs in discounter settings (Ter Braak et al., Reference Ter Braak, Deleersnyder, Geyskens and Dekimpe2013b). This underscores how brand-building and differentiation help NBs defend market share against both lower-priced and niche competitors (Sethuraman, Reference Sethuraman2003). At the segmentation level, our results align with and extend evidence that vitamin purchasing is heterogeneous (Liu and Zhang, Reference Liu and Zhang2025). This helps retailers match customer segments to the right brand tiers, predict how different segments respond to price and promotions, and tailor pricing and loyalty strategies accordingly. From a policy perspective, the sociodemographic heterogeneity suggests that public health efforts may be more effective when they move beyond one-size-fits-all messaging and instead use targeted, culturally appropriate outreach in access and consumption across groups.
Despite these contributions, several limitations remain. First, the data span 2012–2022, so extending coverage, especially beyond 2022, would enable a clearer view of longer-run post-pandemic dynamics and strengthen robustness. Second, the analysis does not incorporate potential substitution with whole foods that provide similar micronutrient (e.g., fruits and vegetables). Consequently, future research should also examine interrelationships between supplements and nutrient-rich foods when suitable data become available. Further, a direct proxy for household health consciousness (such as the share of health-related products in the shopping basket or a product-level health index) is not implemented because the current dataset lacks consistently coded health-related product tags across retailers and years. As a result, we treat health consciousness as an unobserved factor. Future work should construct and integrate such a proxy as a sociodemographic shifter in the demand system. Finally, the conclusion comes from a single country (United States). Private-label penetration, pricing structures, and retailer strategies differ across markets. Several European countries show higher private-label prevalence across many categories, as documented in prior work (Lamey et al., Reference Lamey, Deleersnyder, Dekimpe and Steenkamp2007; Sethuraman and Gielens, Reference Sethuraman and Gielens2014). External validity is therefore limited, and replication with European or multi-country panel data would be valuable for assessing generalizability and for quantifying how market-level PL prevalence conditions substitution between NBs and private-label tiers.
Data availability statement
Not Applicable.
Acknowledgements
Researchers’ own analyses calculated (or derived) based in part on data from Nielsen Consumer LLC and marketing databases provided through the NielsenIQ Datasets at the Kilts Center for Marketing Data Center at The University of Chicago Booth School of Business.
The conclusions drawn from the NielsenIQ data are those of the researchers and do not reflect the views of NielsenIQ. NielsenIQ is not responsible for, had no role in, and was not involved in analyzing and preparing the results reported herein.
Author contributions
Conceptualization: K.L., Y.Y.Z.; Data Curation: K.L.; Methodology: K.L., Y.Y.Z; Formal Analysis: K.L.; Writing Original Draft: K.L.; Writing Reviewing and Editing: K.L., Y.Y.Z; Supervision: Y.Y.Z.
Financial support
This research received no specific grant from any funding agency, commercial or not-for-profit sectors.
Competing interests
The authors declare no competing interests.
AI contributions to research
The authors used an AI-based tool only for grammar and language proofreading.
Appendix
Wald tests for Slutsky symmetry (unrestricted systems)

Table A1 Long description
A table comparing Wald test results for Vitamin C and Vitamin D across different models. The table has 3 rows and 6 columns. The columns are labeled Test (df = 1), Vitamin C χ², Vitamin C p, Vitamin D χ², and Vitamin D p. The row labels are NB-PPL, NB-SPL, and PPL-SPL. Row 1: Test (df = 1), NB-PPL; Vitamin C χ², 0.04; Vitamin C p, 0.843; Vitamin D χ², 12.75; Vitamin D p, 0.0004. Row 2: Test (df = 1), NB-SPL; Vitamin C χ², 2.91; Vitamin C p, 0.088; Vitamin D χ², 16.03; Vitamin D p, 0.0001. Row 3: Test (df = 1), PPL-SPL; Vitamin C χ², 2.91; Vitamin C p, 0.089; Vitamin D χ², 8.61; Vitamin D p, 0.0033.
Wald tests for homogeneity (unrestricted systems)
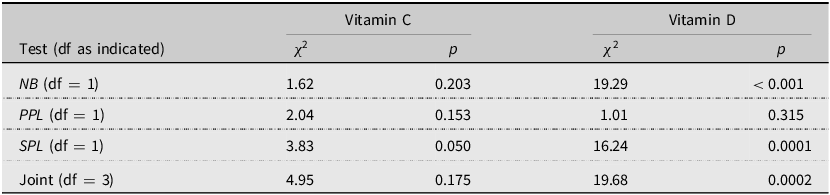
Table A2 Long description
A table comparing statistical tests for Vitamin C and Vitamin D, including chi-square values and p-values. The table has four rows and six columns. The columns are labeled Test, Vitamin C chi-square, Vitamin C p-value, Vitamin D chi-square, and Vitamin D p-value. The rows are labeled NB, PPL, SPL, and Joint, with degrees of freedom indicated in parentheses. Row 1: NB (df = 1), Vitamin C chi-square 1.62, Vitamin C p-value 0.203, Vitamin D chi-square 19.29, Vitamin D p-value <0.001. Row 2: PPL (df = 1), Vitamin C chi-square 2.04, Vitamin C p-value 0.153, Vitamin D chi-square 1.01, Vitamin D p-value 0.315. Row 3: SPL (df = 1), Vitamin C chi-square 3.83, Vitamin C p-value 0.050, Vitamin D chi-square 16.24, Vitamin D p-value 0.0001. Row 4: Joint (df = 3), Vitamin C chi-square 4.95, Vitamin C p-value 0.175, Vitamin D chi-square 19.68, Vitamin D p-value 0.0002.


 Open access

