

Functional synbiotic foods are commonly based on a mixture comprising live microorganisms and substrate(s) selectively utilized by host microorganisms that confer a health benefit on the host (Swanson et al., Reference Swanson, Gibson, Hutkins, Reimer, Reid, Verbeke, Scott, Holscher, Azad, Delzenne and Sanders2020). Fermented dairy products (FDPs), especially yogurts, are popular milk products. Yogurts are manufactured using a protocooperative culture of Streptococcus thermophilus and Lactobacillus delbrueckii subsp. bulgaricus, however, not all yogurts can be considered functional food (Nyanzi et al., Reference Nyanzi, Jooste and Buys2021). On the other hand, FDPs are traditional carriers of probiotics and prebiotics that enhance their health benefits (Lourens-Hattingh and Viljoen, Reference Lourens-Hattingh and Viljoen2001). These health benefits are considered to mainly include gut health (irritable colon, constipation, protective effect on colorectal cancer), immune system, regulation of lipid and cholesterol metabolism, optimization of lactose intolerance and improved absorption of some nutrients (Tzortzis and Vulevic, Reference Tzortzis, Vulevic, Charalampopoulos and Rastall2009; Mei et al., Reference Mei, Yan and Li2022).
Most prebiotics are based on nondigestible oligosaccharides with different degrees of polymerization. The application of inulin and fructooligosaccharides predominates, followed by the use of galactooligosaccharides (GOS) (Rosa et al., Reference Rosa, Matheus, Carmo, Balthazar, Guimarães, Esmerino, Freitas, Silva, Pimentel and Cruz2021). Inulin-type oligosaccharides and GOS mixtures have proven themselves in infant formula, as they increase fecal Bifidobacterium and Lactobacillus, whilst significantly decreasing clostridia (Sierra et al., Reference Sierra, Bernal, Blasco, Martínez, Dalmau, Ortuño, Espín, Vasallo, Gil, Vidal, Infante, Leis, Maldonado, Moreno and Román2015; Vandenplas et al., Reference Vandenplas, Zakharova and Dmitrieva2015). Li et al. (Reference Li, Wang, Sun, Ye, Hu and Zeng2015) demonstrated higher selective stimulation of GOS toward bifidobacteria compared with FOS that showed better stimulation toward lactobacilli. It follows that the presence of GOS in synbiotic FDP is a promising alternative to the hitherto predominant application of inulin and FOS in these products.
Preparation of GOS is based on the transgalactosylation activity of β-galactosidases, which are enzymes used to produce lactose-free dairy products. GOS is a mixture of compounds containing from two to eight monosaccharide units. Galactose units are connected to terminal glucose, disaccharides can contain two units of galactose (Tzortzis and Vulevic, Reference Tzortzis, Vulevic, Charalampopoulos and Rastall2009). The yield of GOS generally depends mainly on lactose concentration (water activity) and enzyme origin. GOS synthesis is also influenced by reaction conditions, the medium that is used (e.g. presence of different ions), and the use of a free or immobilized enzyme. It is also important to stop the enzyme reaction at a specific level of lactose conversion because after reaching the maximum content of GOS, their re-hydrolysis occurs (Fischer and Kleinschmidt, Reference Fischer and Kleinschmidt2018).
GOS show favorable application properties. They are water-soluble, and their sweetness is 0.3–0.6 relative to sucrose. GOS are also characterized by low-calorie content (1.73 kcal g−1), low cariogenicity, and glycemic index (Tzortzis and Vulevic, Reference Tzortzis, Vulevic, Charalampopoulos and Rastall2009). Several authors have attempted to produce yogurt with GOS using the action of β-galactosidase directly on the raw material for yogurt. However, the GOS concentration achieved typically ranges from 0.3 to 0.9% due to the initial low concentration of lactose (Martins et al., Reference Martins, Manera, Monteiro, Burkert and Burkert2011; Vénica et al., Reference Vénica, Bergamini, Rebechi and Perotti2015; Raza et al., Reference Raza, Iqbal, Ullah, Khan and Imran2018). Our hypothesis is based on the possibility of preparing a material with a high GOS content from a raw material with a high concentration of lactose and its applicability to yogurt-type FDPs with a probiotic culture. The aim of the work was also to determine the properties and stability of FDP during storage. The Nurica (DuPont-Danisco) β-galactosidase was chosen for the preparation of GOS. Nurica was launched at the end of 2019, and to the best of our knowledge, no works related to its application have been published in the scientific literature. Nurica is a truncated β-galactosidase from Bifidobacterium bifidum that exhibits high transgalactosylation activity, making it suitable for the proposed application (Larsen and Cramer, Reference Larsen and Cramer2013; Tams, Reference Tams2023)
Materials and methods
Galactooligosaccharide preparation
To make 1 kg of galactooligosaccharide preparation (GOSP), 300 g of dried whey (Nutrihouse, Rudná u Prahy, Czech Republic) was mixed with 50 g dried skim milk (Nutrihouse, Rudná u Prahy, Czech Republic) and 650 g of demineralized water. The enzyme, Nurica (Danisco, Copenhagen, Denmark), was added. The dosage was based on previous experiments (3.5 g per 100 g lactose, enzyme activity declared by the producer is 540–760 BLU per 1 g). The mixture was incubated in a shaking water bath NB-303 (N-Biotek, Bucheon, Korea) at 42°C for 90 min. The enzyme was inactivated by heating at 85°C for 20 min after the reaction.
Fermented dairy product manufacture
Yogurt-type FDP was prepared from UHT milk containing 1.5% (w/v) fat (Pragolaktos a. s., Prague, Czech Republic) supplemented by skim milk powder (Moravia Lacto a. s., Jihlava, Czech Republic) at a level of 50 g per kg. This milk mixture was pasteurized at 85°C for 10 min. After cooling, it was mixed with GOS preparation to create 0 (control), 2, 10, and 20% (w/w) mixtures, which were heated to 30°C and inoculated by 0.1% (w/w) of CCDM 176 yogurt starter and by 1% (w/w) of CCDM 93 probiotic starter. The liquid yogurt starter, CCDM 176, which contains Streptococcus thermophilus, Lactobacillus delbrueckii ssp. bulgaricus, and the probiotic culture of Bifidobacterium animalis ssp. lactis (CCDM 93) were provided by the culture collection of dairy microorganisms (CCDM: Laktoflora®, Tábor, Czech Republic). The inoculated mixture was filled at 50 or 100 g into sterilized containers and was set to ferment at 30°C for 15–18 h. At the end of fermentation (pH 4.5), the FDPs were transferred to 5°C and stored for 9 weeks. Chemical, microbiological, rheological and sensory parameters were monitored for FDPs during storage at three-week intervals. The entire experiment was repeated twice.
Microbiological analysis
The total number of yogurt bacteria was enumerated according to ISO 7889/IDF 117 (2003). Quantification of Lactobacillus delbrueckii subsp. bulgaricus was conducted using the plate pour method and the following cultivation conditions: cultivation medium MRS agar, temperature 37°C, under anaerobic conditions for 72 h. Streptococcus thermophilus was determined under the same conditions except for the medium used, which was M17 agar. The enumeration of presumptive bifidobacteria was performed according to ISO 29981/IDF 220 (2010) using the plate pour method with TOS agar as cultivation medium. Sample adjustments and preparation of tenfold dilutions were performed according to ISO 6887-1 (2017). Microbiological analyses were performed for both batches of FDPs, for fresh samples and also samples stored for 3, 6 and 9 weeks. The data were averaged between both batches and expressed as logCFU per 1 g of FDP.
Saccharide analysis
Preparation of samples for the saccharide analysis involved mixing 140 μg of sample with 1 ml of 1.48 mg/l solution of ribose (internal standard) in 87.5% (v/v) ethanol. The mixture of the sample and internal standard was centrifuged at a speed of 9000 × g for 10 min (Witeg CF-10, Wertheim, Germany) and filtered through 0.22 μm polyvinylidene difluoride (PVDF) syringe filters (Watrex, Prague, Czech Republic). Samples were prepared in duplicate.
The saccharides were analyzed by HPLC using bioinert Infinity 1260 (Agilent Technologies, Santa Clara, USA). The monosaccharides were determined on ion exclusion H+ Polymer column (Watrex, Prague, Czech Republic) using a refractive index detector. Cosmosil Sugar-D HILIC column (Nacalai Tesque Inc., Kyoto, Japan) and an evaporative light scattering HPLC detector were used for the oligosaccharide analysis. The chromatographic conditions of both methods are described in Botvynko et al. (Reference Botvynko, Bednářová, Henke, Shakhno and Čurda2019). The yield of GOS was calculated as the percentage of the initial amount of lactose converted to GOS (the sum of disaccharides other than lactose plus tri-, tetra- and pentasaccharides).
Organic acids analysis
The FDP sample (140 mg) was mixed with 1 ml of 96% (v/v) ethanol (Lach:ner, Neratovice, Czech Republic). The mixture was incubated for 30 min at room temperature and centrifuged to precipitate and separate the protein fraction. The supernatant was filtered through a 0.22 μm PVDF syringe filter. The analysis of organic acids was conducted using the Infinity 1260 HPLC system (Agilent Technologies, Santa Clara, USA), which was equipped with a H+ polymer column (Watrex, Prague, Czech Republic) and a diode array detector. The mobile phase was 0.009 M H2SO4, with a flow rate of 0.5 ml/min, column temperature was 60°C. Organic acids were detected at 210 nm.
Rheological analysis
The rheological properties of the FDPs were determined using a Viscotester iQ rheometer (Thermo Haake, Germany) with FL22 vane geometry described in Marhons et al. (Reference Marhons, Hyršlová, Stetsenko, Jablonská, Veselý, Míchová, Čurda and Štĕtina2023). The time dependence of the torque at rotations 100 min−1 was determined. The measurement simulated the mixing of the product by the consumer. The gel strength was determined from the local maximum torque at the beginning of the measurement and expressed as apparent stress by multiplying by a factor stated for the given geometry dimensions (Krulis and Rohm, Reference Krulis and Rohm2004). The apparent viscosity after 5 min of stirring was calculated from the calibration of torque dependence on the viscosity of Newtonian test fluids range from 2 to 15 Pa⋅s (E2000, E6000, and E15000, Thermofisher Scientific, USA). The gel strength and apparent viscosity data are relative values that depend on the measurement technique. The five parallel samples were evaluated in two independent trials one day after the FDP preparation and after 6 weeks of storage at 5°C.
Sensory analysis
The 12-member panel evaluated the following descriptors of the organoleptic properties on a seven-point intensity scale from 1 (very low) to 7 (very high): viscosity, yogurt flavor, saltiness, sourness and sweetness. Textural acceptance and overall flavor acceptance were assessed on a hedonic scale from 1 (unacceptable) to 7 (excellent). Results are expressed as median ratings. A ranking test was also performed in terms of overall product preference according to ISO (2006).
Physicochemical analysis
Fat content, dry mass, ash content, crude protein, true protein and titratable acidity were determined according to the ISO/IDF or DIN standards listed together with the results in the online Supplementary Table S1.
Statistical evaluation
As the experiment was repeated twice, a one-way analysis of variance (ANOVA) was performed to test the significance of the influence of GOSP addition or differences occurring during storage within samples with same the addition of GOSP. Significance level was set at α < 0.05 for significant differences. T-test was performed to establish particular differences between samples. The results of the sensory analysis were statistically evaluated using the Friedman test (ISO 8587, 2006).
Results and discussion
Galactooligosaccharide preparation
The substrate for GOS preparation (GOSP) was mixed from dried sweet whey, skimmed milk powder and water so that the resulting substrate contained approximately 25% (w/w) lactose. Dried sweet whey is a secondary product of the dairy industry that is obtained after casein precipitation from milk. Unlike sour whey, sweet whey has a pH of 6.0–6.5, which is optimal for most β-galactosidases including Nurica. Moreover, dried whey contains around 65% lactose, which is important to maximize the yield of GOS. Figure 1 represents the composition of GOS preparation after treatment by the Nurica enzyme. Chromatograms illustrating the composition of saccharides in the substrate and in the GOSP are provided in the online Supplementary Fig. S1. The concentration of oligosaccharides in GOSP, exceeding 14% (w/w), indicates a yield of 56%, representing the conversion of lactose to GOS. It is comparable with the higher yields reported in the literature (Fischer and Kleinschmidt, Reference Fischer and Kleinschmidt2018), exceeded only by enzymes isolated from Bacillus circulans that are specifically used for the industrial production of GOS. The proportion of monosaccharides in GOSP is presented in online Supplementary Fig. S2. The relatively high Glc/Gal ratio of 10.97 indicates that most of the galactose is incorporated into GOS and that the enzyme exhibits high transgalactosylation activity. GOS mixture contains oligosaccharides with the degree of polymerization (DP) from 2 to 5. The prebiotic effect of GOS increases greatly with each monomer (Gosling et al., Reference Gosling, Stevens, Barber, Kentish and Gras2010). Notably, non-lactose disaccharides were also detected. Trisaccharides predominate in the prepared mixture. Enzymes derived from β-galactosidase of bifidobacteria mainly produce 3′-galactosyl lactose (Tzortzis and Vulevic, Reference Tzortzis, Vulevic, Charalampopoulos and Rastall2009; Tams, Reference Tams2023). With the considered maximum addition of GOSP (20% w/w), this represents 2.8–5.6 g of GOS, that is to say, a safe dose of GOS when consuming 100–200 g of FDP. Ito et al. (Reference Ito, Deguchi, Miyamori, Matsumoto, Kikuchi, Matsumoto, Kobayashi, Yajima and Kan1990) reported that a dose of up to 10 g d−1 of GOS is considered to be well tolerated and 15 g led to excessive fullness. Vulevic et al. (Reference Vulevic, Juric, Tzortzis and Gibson2013) demonstrated that the intake of 5.5 g d−1 of GOS induced changes in the intestinal microbiota. Prepared FDPs with the addition of 10 and 20% GOSP thus have a considerably higher GOS content, compared to the direct application of β-galactosidase to milk. Martins et al. (Reference Martins, Manera, Monteiro, Burkert and Burkert2011) and Vénica et al. (Reference Vénica, Bergamini, Rebechi and Perotti2015) reported values up to 0.62%. Raza et al. (Reference Raza, Iqbal, Ullah, Khan and Imran2018) found up to 0.97% GOS, but their content is determined only by calculation. The advantage of the proposed synbiotic yogurt-type FDP is its clean label status, achieved through the addition of a prebiotic derived solely from milk ingredients.
Composition of galactooligosaccharide preparation (GOSP).
The impact of GOSP addition on the content of basic FDP components
The composition of GOSP (Fig. 1) differs from the composition of the milk mixture for the control product (1,48% (w/w) of fat, 5.96% (w/w) of lactose, 4,5% (w/w) of true protein, and 1,11% (w/w) of ash) and therefore its addition modifies the composition of the product, especially at a dose of 20% (w/w). While the protein and fat contents are similar and only slightly reduced by the addition of GOSP (P > 0.05), the lactose and ash contents increase significantly with the addition of 10 and 20% GOSP (P < 0.01, see online Supplementary Table S1). Due to the buffering properties of salts (Salaun et al., Reference Salaun, Mietton and Gaucheron2005), the addition of GOSP also increases the titratable acidity of the raw material by up to 4.5 Soxhlet-Henkel degrees, which is 40% of the original milk mixture. Online Supplementary Fig. S3 illustrates chromatograms of the saccharide composition of yoghurt with different GOSP additions.
Total bacterial number
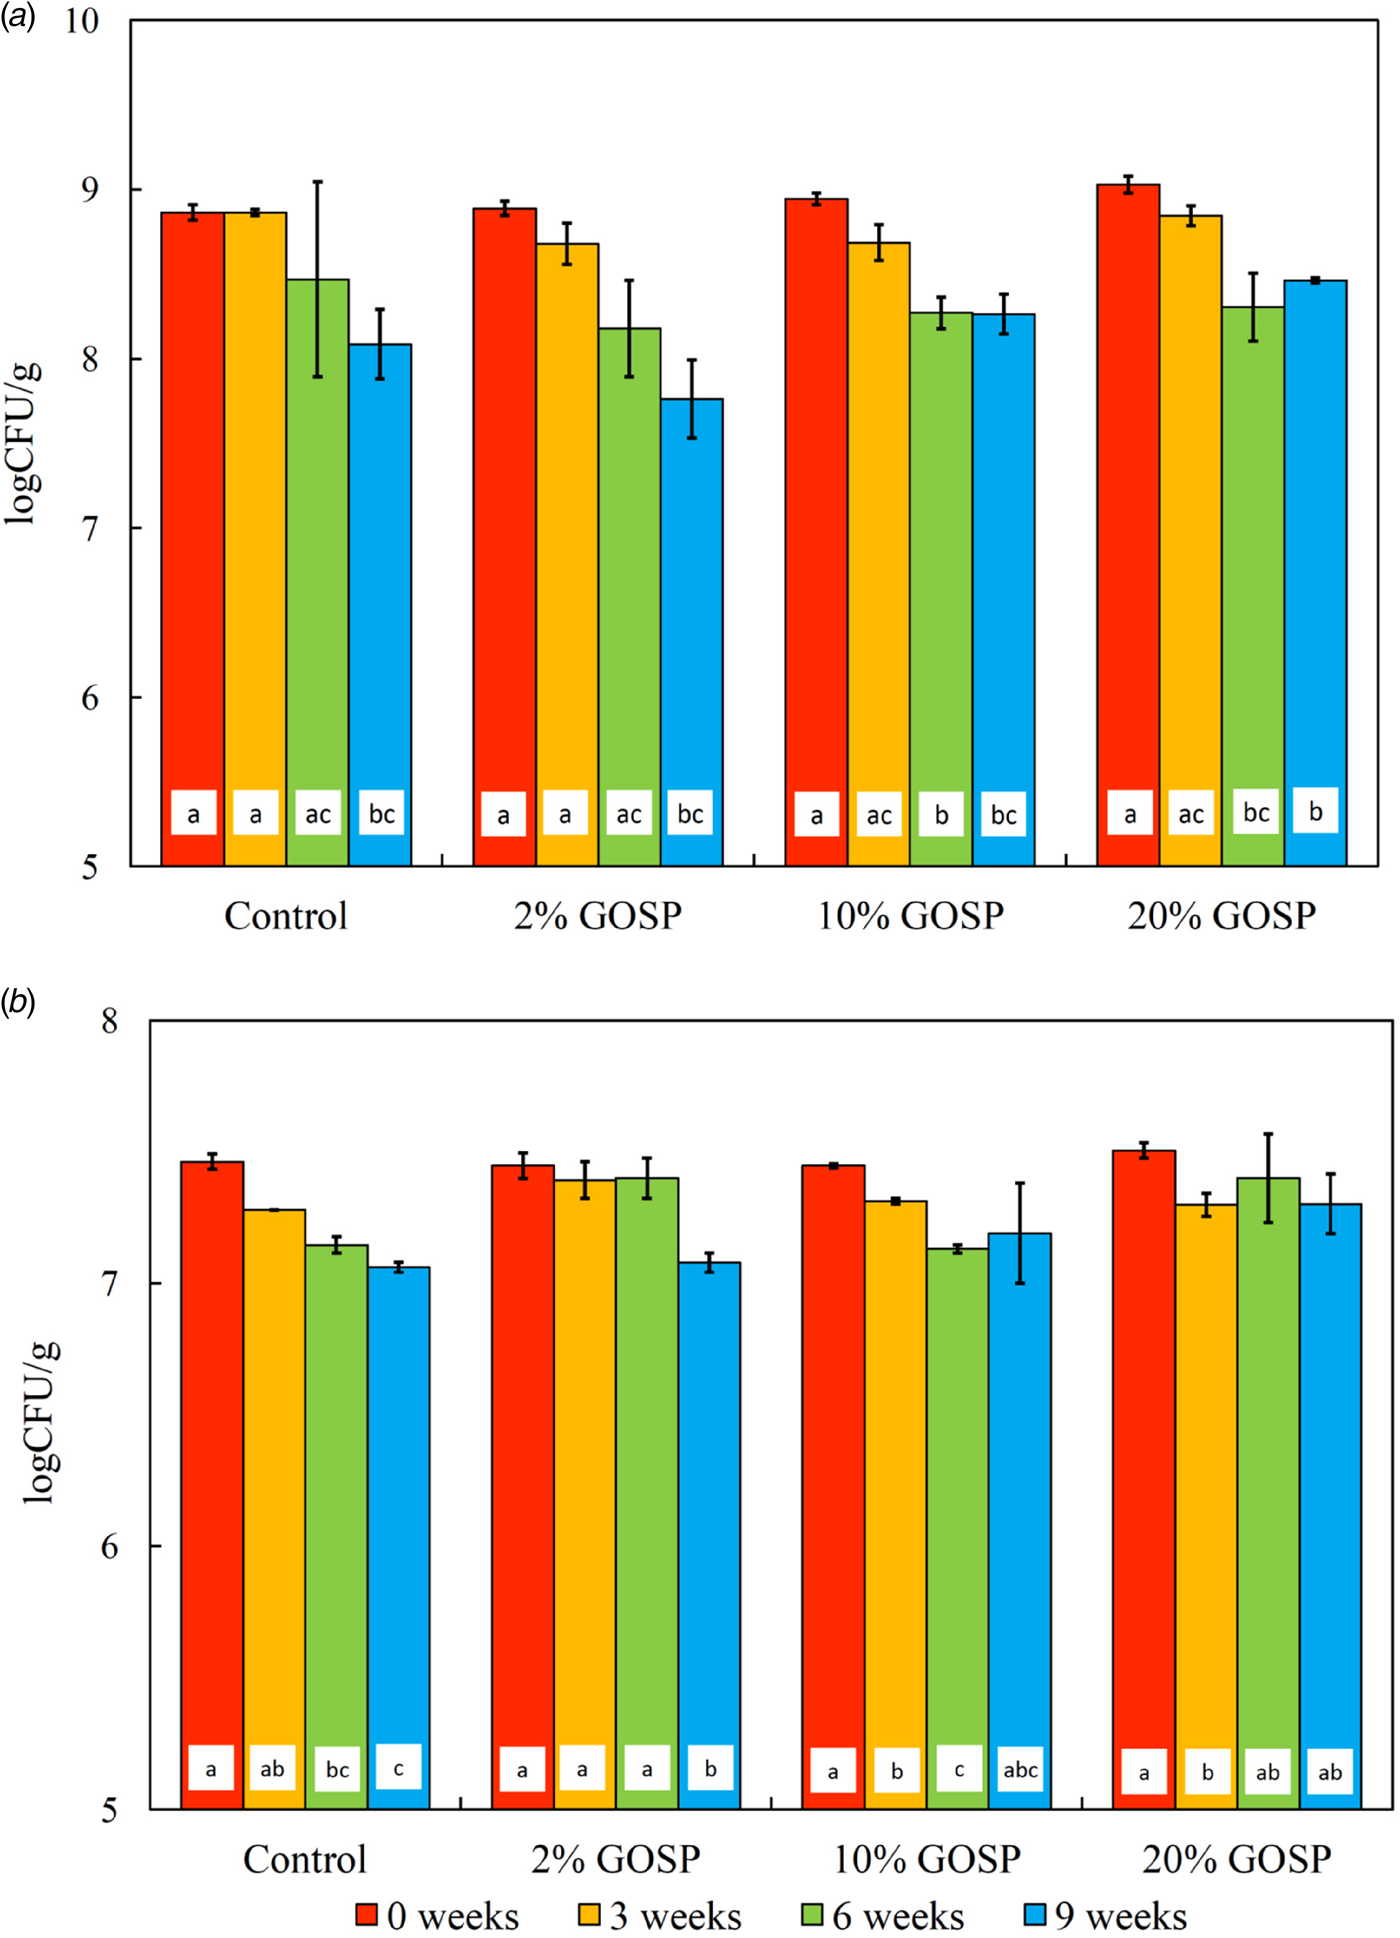
As evident from Fig. 2, the addition of GOS preparation has insignificant impact on bacterial growth during FDP fermentation (P > 0.05; ANOVA). It is important to note that the increased buffering capacity of milk after the addition of GOSP (Kim et al., Reference Kim, Sejong and Jee-Young2018) may have an impact on the total count of bacteria. According to our findings, this effect on the number of microorganisms was not observed, the addition of GOSP did not significantly affect the concentration of lactic acid either (Fig. 3a). Overall, according to the literature (Delgado-Fernández et al., Reference Delgado-Fernández, Corzo, Olano, Hernández-Hernández and Moreno2019), GOS addition itself does not display any significant impact on bacterial growth in vitro, which was confirmed by our findings.
Influence of GOSP addition and storage time on the total number of yogurt bacteria (a) and bifidobacteria (b) in fermented dairy products (FDPs). Average values from two FDP batches. Error bars represent the range of results. Values with different small letters inside the bars are significantly different (P < 0.05) during storage of same type of sample.
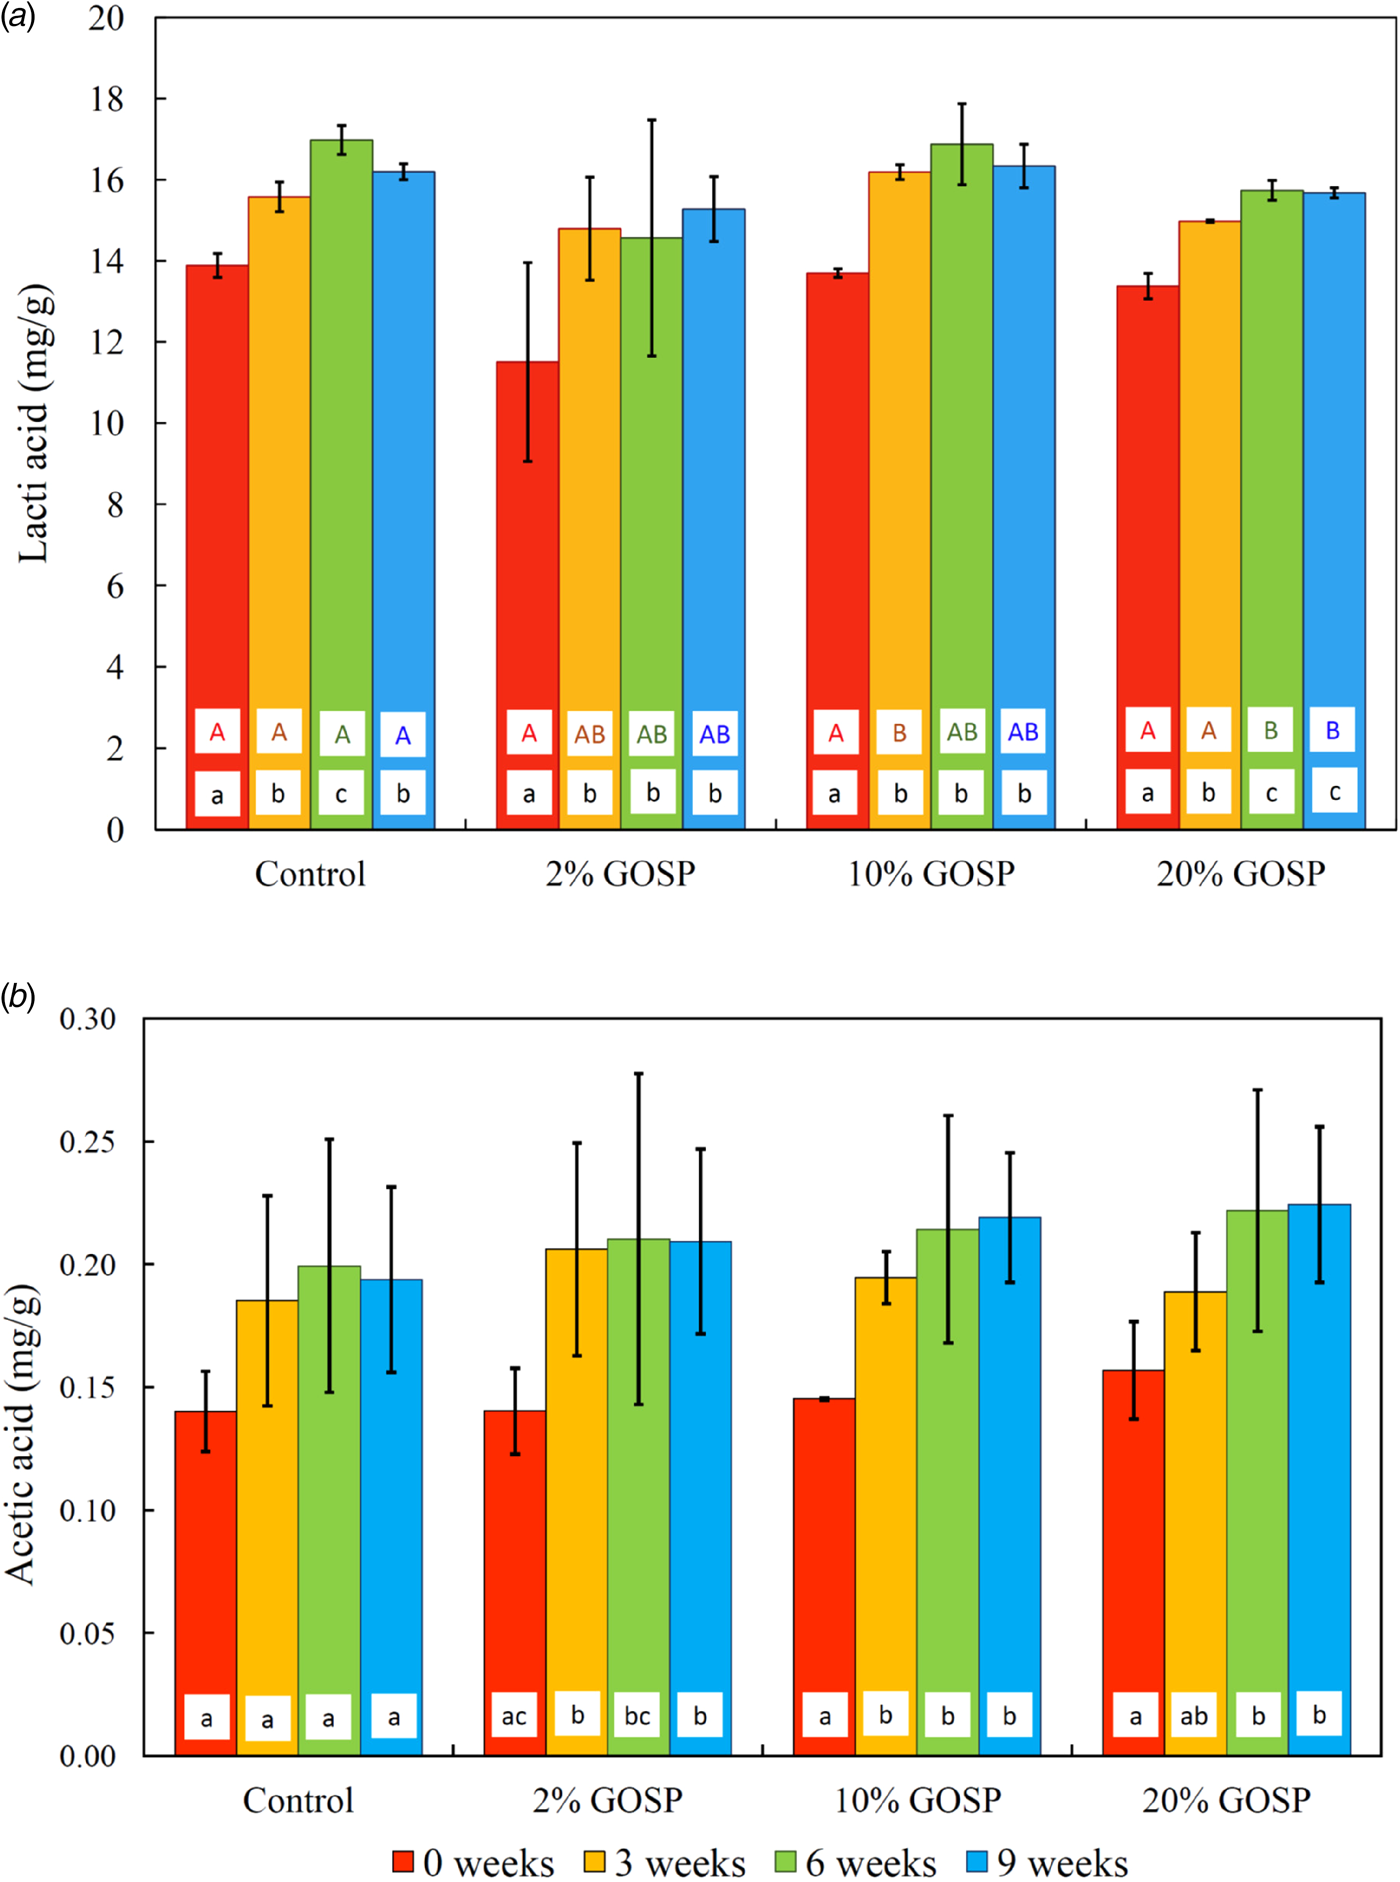
Influence of GOSP addition and storage time on the content of lactic acid (a) and acetic acid (b) in fermented dairy products (FDPs). The average numbers of both FDP batches. Error bars represent the range of results. Values with different small letters inside the bars are significantly different (P < 0.05) during storage of same type of sample. Values with different capital letters inside the bars are significantly different (P < 0.05) within the same storage time.
During storage, there was a slight decrease in the content of yogurt culture bacteria (P < 0.05; ANOVA). However, the decrease in bifidobacteria content in samples with GOSP content of 10 and 20% (w/w) was not statistically significant. The bifidobacteria showed counts higher than 106 CFU/g throughout the storage period. There is no statistical significance of the positive effect of GOSP on the viability of the bifidobacteria. The numbers of yogurt bacteria and bifidobacteria after production and storage met the legislative limits of most countries (Mukherjee et al., Reference Mukherjee, Gómez-Sala, O'Connor, Kenny and Cotter2022).
Stability of GOS in FDP
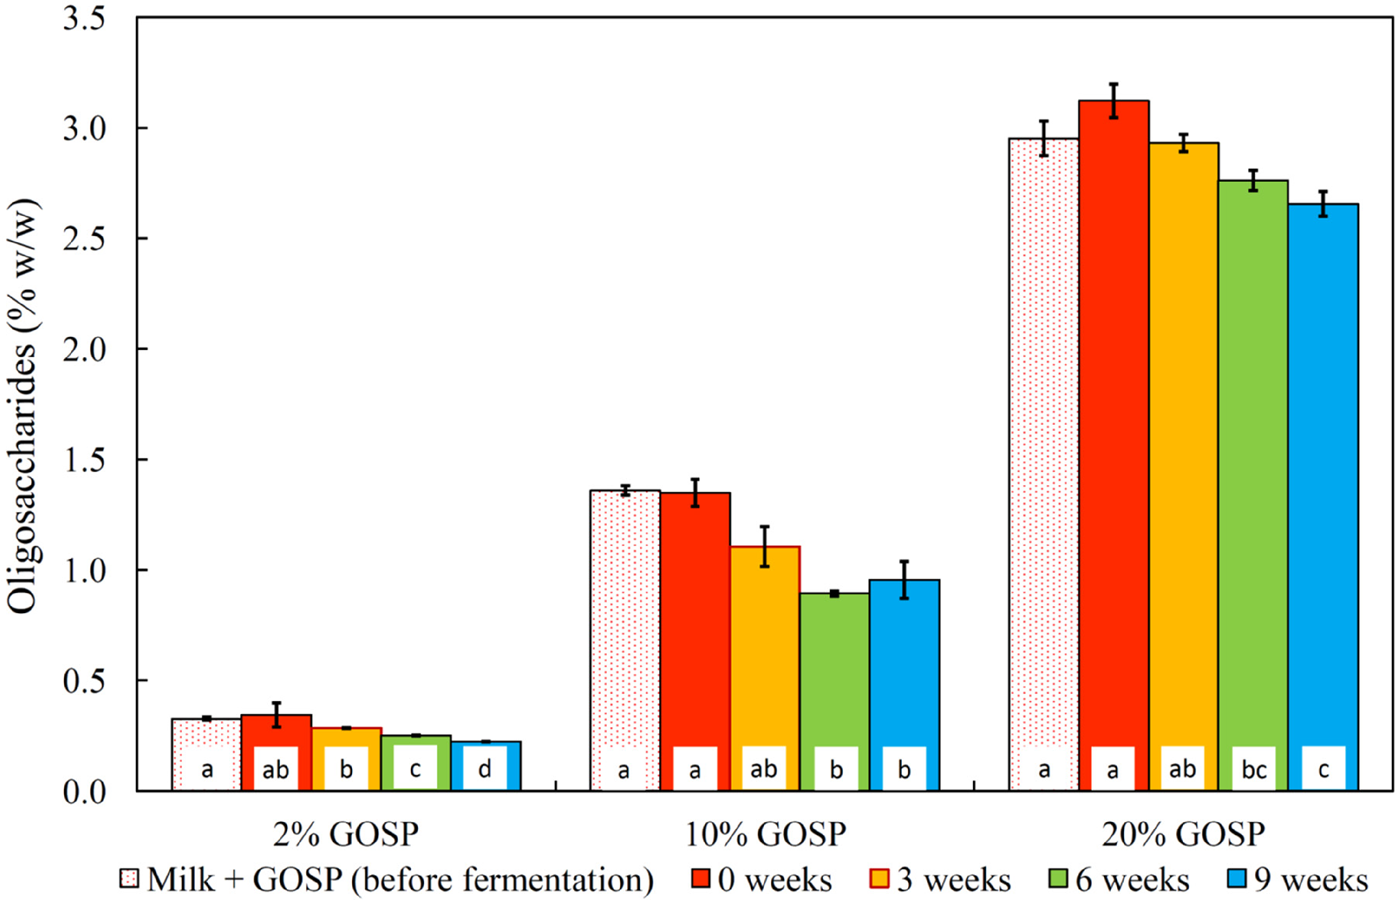
The data shown in Fig. 4 are consistent with observations in the literature (Delgado-Fernández et al., Reference Delgado-Fernández, Corzo, Olano, Hernández-Hernández and Moreno2019) whereby yogurt bacteria and bifidobacteria do not digest GOS during the fermentation step. It appears that there is a preference for metabolizing simpler sugars such as lactose and glucose, which are found in both milk and GOSP. However, during storage, statistically significant changes (P < 0.05; ANOVA) in oligosaccharide content were noted in FDPs with 10 and 20% (w/w) GOSP addition. During 9 weeks of storage, the amount of oligosaccharides dropped only by 9.5% compared to the amount recorded in freshly made FDP. GOSP thus fulfills one of the basic requirements for prebiotics, namely stability to food processing treatments (Wang, Reference Wang2009).
GOS content in fermented dairy products (FDPs) during 9 weeks of storage. No oligosaccharides were detected in control probes. The average numbers of both FDP batches. Error bars represent the range of results. Values with different small letters inside the bars are significantly different (P < 0.05) during storage of same type of sample.
Organic acids
Monitoring of lactic acid and acetic acid content helped to evaluate the efficiency of fermentation and changes during storage. GOSP had no significant effect on the amount of lactic acid nor the acetic acid content compared to the control product (Fig. 3). This is in line with what is commonly reported in the literature (Delgado-Fernández et al., Reference Delgado-Fernández, Corzo, Olano, Hernández-Hernández and Moreno2019). During the initial six weeks of storage, a marginal increase in lactic and acetic acids was observed (P < 0.05). This increase in acetic acid can be associated with the higher amount of bifidobacteria present in these FDPs.
Titratable acidity measurements (online Supplementary Table S1) demonstrated that the addition of GOSP had no significant effect on the acidity of FDPs. During the initial 6 weeks of storage, the acidity of FDPs gradually increased. Nevertheless, during the last 3 weeks of storage there were no further significant changes in acidity. The changes correspond well with measured changes in lactic acid concentration.
Rheology
Based on the data (Fig. 5), it can be concluded that the rheological properties of FDP are to some extent affected by the addition of the GOS preparation. GOSP reduces the gel strength and apparent viscosity (P < 0.05; ANOVA) by up to 27 and 37%, respectively. The addition of GOS itself probably has a very limited impact on the rheology of yogurt (Ng et al., Reference Ng, Nguyen, Bhandari and Prakash2018). However, the addition of GOSP slightly reduces the protein and increases the salt content in the product, which can have a greater effect (Anema, Reference Anema2008; Ramasubramanian et al., Reference Ramasubramanian, Restuccia and Deeth2008).
Influence of GOSP addition and storage time on the content of gel strength (a) and apparent viscosity (b) of fermented dairy products. Bars represent the average value of two independent trials (each trial, 5 measurements). Error bars represent the standard deviations. Values with different letters inside the bars are significantly different (P < 0.05) within the same storage time. Sample marked by * inside the bars are significantly different (P < 0.05) during storage.
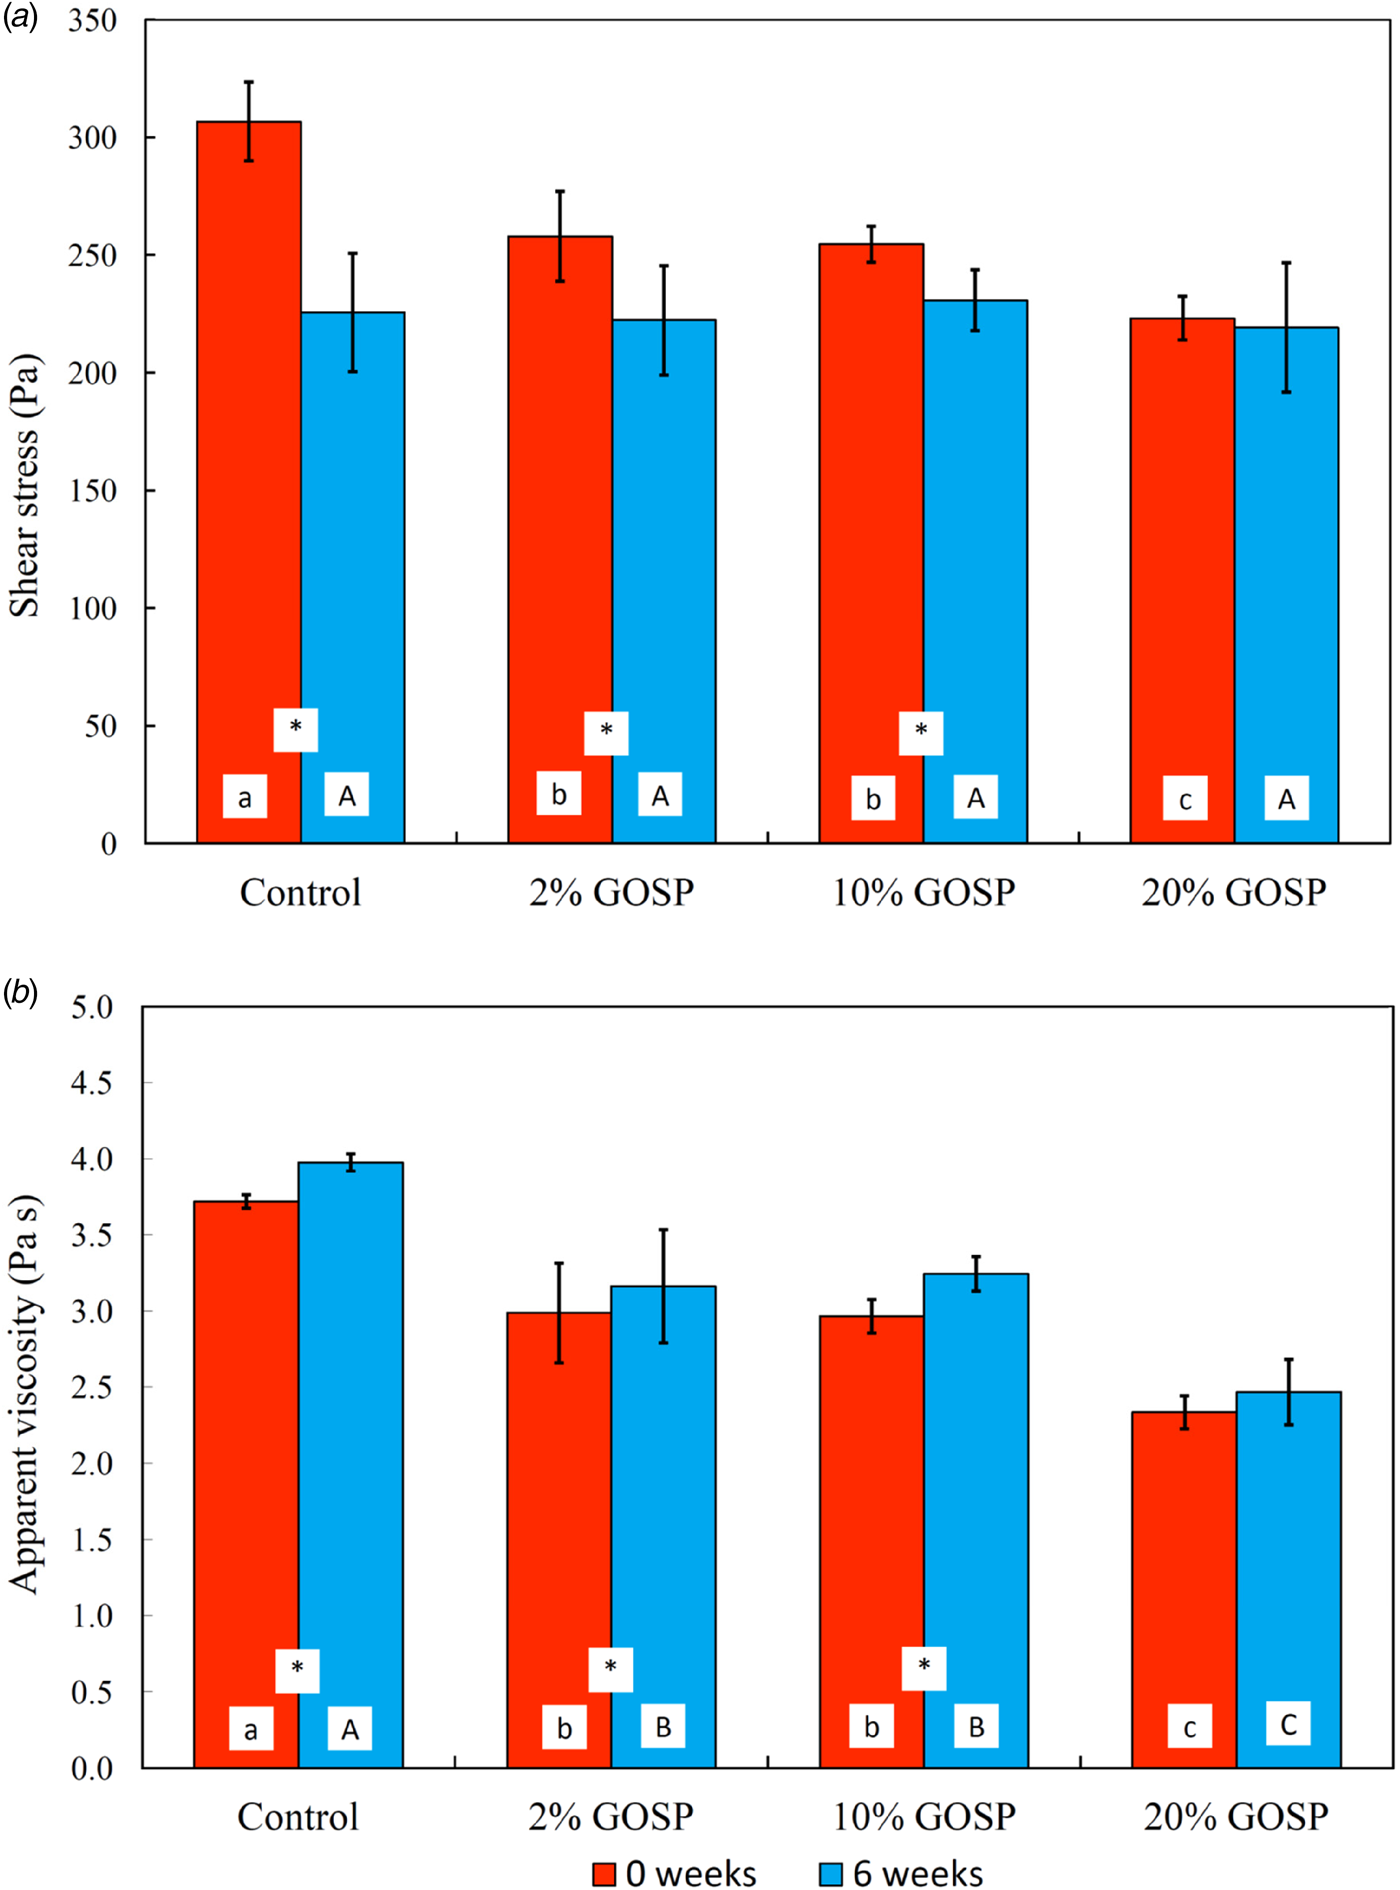
During 6 weeks of storage, there was a significant reduction in gel strength (up to 26%) and, conversely, an increase in apparent viscosity (P < 0.05; ANOVA). The same phenomenon was reported by Damin et al. (Reference Damin, Minowa, Alcântara and Oliveira2008) as a consequence of the reorganization of the gel structure. However, the decrease in gel strength was affected by the addition of GOSP. The largest change was in the control production, but with a content of 20% (w/w) GOSP, it was no longer detectable. As a result, after storage, the effect of GOSP on gel strength was no longer statistically significant (P > 0.05; ANOVA), while in the case of apparent viscosity, it remained significant.
Sensory analysis
The freshly prepared FDP exhibited a high degree of acidity, with pH values approximating 3.8–4.0. Excessive sourness was a common remark from the majority of panel members. From Fig. 6a, it is apparent that FDP with a 20% (w/w) addition of GOS was perceived as significantly less sour while being sweeter (both P < 0.05; Friedman test) than the rest of the FDPs. That can be attributed to its greatly increased sugar content. Statistical analysis reveals that there are significant differences in individual flavors. 20% and 2% (w/w) GOSP had significantly lower viscosity and sourness compared to control, and 10% (w/w) GOSP (P < 0.05). Significant yogurt flavor differences were noted between FDPs with 2 and 10% (w/w) GOSP (P < 0.05). The FDP with the highest GOSP concentration had sweetness and saltiness significantly higher (P < 0.05) compared to control, 2 or 10% (w/w) GOSP addition. Overall flavor and texture of all FDPs were perceived more or less the same and certainly not significantly different.
Sensory analysis of fresh fermented dairy products (FDPs) (a) and FDPs after 6 weeks of storage (b). The median of a twelve-member sensory panel. Viscosity, Yogurt flavor; Saltiness, Sourness, and Sweetness – intensity scale from 1 (very low) to 7 (very high); Texture acceptance and overall flavor acceptance – hedonic scale from 1 (unacceptable) to 7 (excellent).
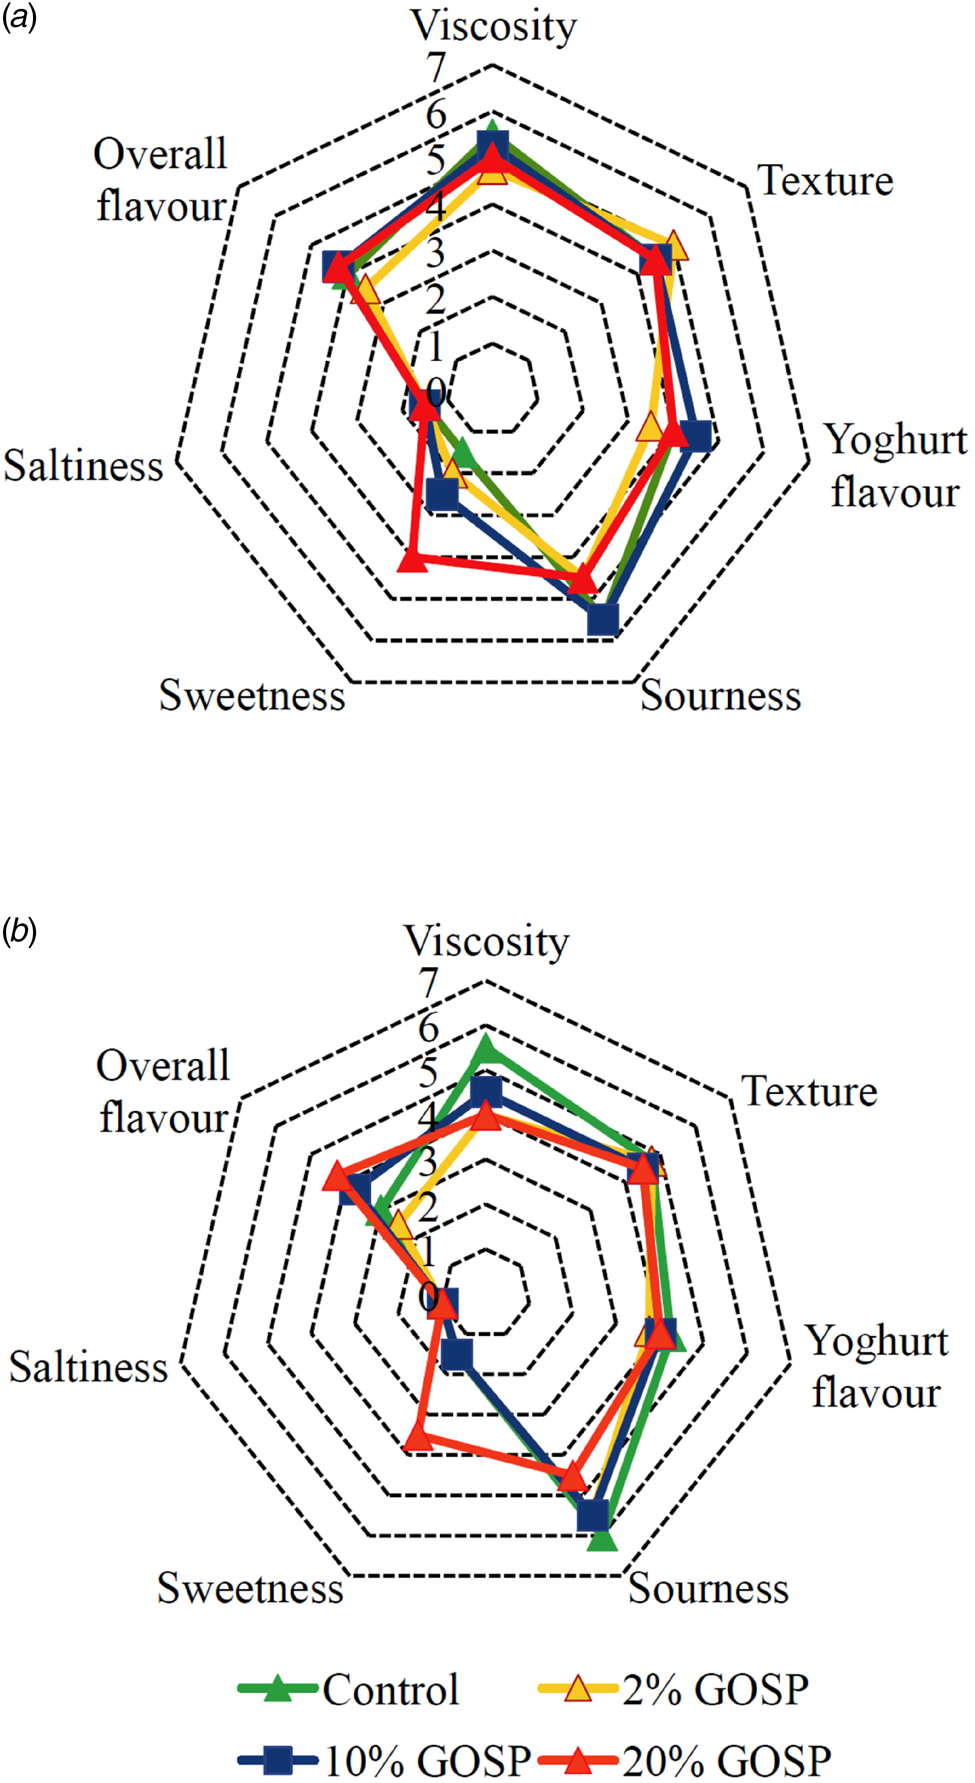
Statistical analysis of ranking test results reveals that there are no significant differences between samples in the acceptance of flavor and texture. Therefore, the addition of GOSP does not affect the sensory properties of the product negatively or positively.
After 6 weeks of storage, not much has changed (Fig. 6b). Panel members again noted a lower sourness and higher sweetness of the FDP with 20% (w/w) GOSP, whilst the higher viscosity of the control sample was also statistically significant (all P < 0.05, Friedman test). Contrarily, the decreased overall flavor acceptance of all samples, excluding the 20% (w/w) GOSP, was not statistically significant. FDP with 10% (w/w) GOSP was the best evaluated in the overall quality ranking test (P < 0.05; Friedman test).
Most of the changes noted by the panel members were regarding high acidity or sweetness. In general, the addition of fiber itself does not affect the sensory properties of yogurts (Staffolo et al., Reference Staffolo, Bertola and Martino2004). However, the addition of GOSP reduced the sour taste and increased the sweetness of the product, and the FDP had good sensory properties.
In conclusion, this study describes the successful creation of the galacto-oligosaccharide preparation (GOSP) using cheap, common dairy substrates (dried whey and milk) and a novel β-galactosidase, with high transgalactosylating activity, namely Nurica isolated from Bifidobacterium sp. The preparation contained a high amount of GOS, comparable with the highest conversion rates reported in the literature. GOSP was successfully used in different proportions for the preparation of synbiotic yogurt-type FDPs, supplemented with probiotic culture. The obtained product contained nutritionally significant amounts of GOS and was found to be palatable in sensory analysis and stable during storage. Using only dairy ingredients for the production of FDP allows for clean labelling, which has the potential to increase consumer acceptability of product.
Supplementary material
The supplementary material for this article can be found at https://doi.org/10.1017/S0022029925000093
Acknowledgment
Open Access funding provided thanks to the CzechELib agreement with Cambridge University Press. The Ministry of Agriculture of the Czech Republic (project QK22010186) supported this research.


 Open access