


Introduction
Glaciers in Norway cover 0.7% of the land area and have importance for hydropower, water management and tourism. The glaciers are sensitive climate indicators, in particular Norway's present-day ice caps are highly vulnerable to surface mass-balance changes due to their ice cap hypsometry (e.g. Åkeson and others, Reference Åkeson, Nisancioglu, Giesen and Morlighem2017). Diminishing glaciers affect mountain areas by changing their visual appearance (Beniston and others, Reference Beniston2018). Reported changes in glaciers in Norway have affected the frequency of glacier lake outburst floods (e.g. Engeset and others, Reference Engeset, Schuler and Jackson2005; Kjøllmoen, Reference Kjøllmoen2018) and will affect future runoff (Engelhardt and others, Reference Engelhardt, Schuler and Andreassen2013; Hanssen-Bauer and others, Reference Hanssen-Bauer2015). Historical glacier length fluctuations are natural indicators of past climate change (e.g. Nussbaumer and others, Reference Nussbaumer, Nesje and Zumbühl2011; Leclercq and others, Reference Leclercq2014).
Accurate maps of glaciers are essential for mass-balance calculations and change assessments. The glaciological mass balance gives annual and seasonal variations as points and is interpolated to glacier wide averages, whereas the geodetic method gives changes over the time period between two surveys for the entire glacier, also inaccessible areas. Although studies have shown that it is possible to get annual and even seasonal signals from the geodetic method (Geist and others, Reference Geist, Elvehøy, Jackson and Stötter2005; Belart and others, Reference Belart2017; Klug and others, Reference Klug2018), a repeated survey every decade is recommended for glaciological mass-balance programmes (Zemp and others, Reference Zemp2013). With such a period, standard density conversions can in most cases be used to convert from elevation changes to mass balance (Huss, Reference Huss2013). Geodetic mass-balance assessments can be useful for many purposes: validate and calibrate glaciological mass-balance measurements (e.g. Jóhannesson and others, Reference Jóhannesson2013; Andreassen and others, Reference Andreassen, Elvehoy, Kjøllmoen and Engeset2016), validating modelled glacier mass balance (Kronenberg and others, Reference Kronenberg2016) and surveying unmeasured glaciers (e.g. Brun and others, Reference Brun, Berthier, Wagnon, Kääb and Treichler2017). Archives of aerial photographs of glaciers can be reprocessed and topographic maps can be digitised to help fill gaps in knowledge of regional of glacier change (Fox and others, Reference Fox and Cziferszky2008; Barrand and others, Reference Barrand, Murray, James, Barr and Mills2009; Magnússon and others, Reference Magnússon, Muñoz-Cobo Belart, Pálsson, Ágústsson and Crochet2016). Knowledge of regional similarities and differences is valuable to check the representability of glaciers with long-term mass-balance programmes.
Systematic observations of glaciers in Norway started ~1900, with length change observations on a number of glaciers (Rekstad, Reference Rekstad1902; Øyen, Reference Øyen1906; Andreassen and others, Reference Andreassen, Elvehøy, Kjøllmoen, Engeset and Haakensen2005). Some of the series have been reconstructed back in time using paintings and photographs (Nussbaumer and others, Reference Nussbaumer, Nesje and Zumbühl2011). Historical maps and end moraine positions are also used to document changes in glacier length and area, revealing a marked shrinkage of Norwegian glaciers in the 20th century (e.g. Winsvold and others, Reference Winsvold, Andreassen and Kienholz2014; Stokes and others, Reference Stokes, Andreassen, Champion and Corner2018; Weber and others, Reference Weber, Boston, Lowell and Andreassen2019). Surface mass-balance measurements began with Storbreen in 1949 and continued with a number of other glaciers from the 1960s, some short term, others long term (Table S1). Detailed surveys using vertical aerial photos from the 1950s and highly accurate laser scannings (LiDAR – Light Detection And Ranging) since the 2000s are available for many glaciers. The repeated surveys were used to calculate geodetic mass balance (e.g. Haakensen, Reference Haakensen1986; Kjøllmoen and Østrem, Reference Kjøllmoen and Østrem1997; Andreassen and others, Reference Andreassen, Elvehøy and Kjøllmoen2002; Haug and others, Reference Haug, Rolstad, Elvehøy, Jackson and Maalen-Johansen2009). Reanalysis of the ten longest glaciological mass-balance series revealed discrepancies between the glaciological and geodetic methods for some glaciers, partly attributed to internal and basal ablation, and resulted in a calibration of several of the glaciological mass-balance series (Andreassen and others, Reference Andreassen, Elvehoy, Kjøllmoen and Engeset2016).
In this paper, we give an assessment of glacier length changes, mass balance and surface elevation changes in Norway with focus on the period from the 1960s to 2018. Our sources are the NVE archives of map surveys, glaciological mass balance and length change observations complemented with new and yet unpublished results from geodetic assessments.
Setting
This study targets glaciers in mainland Norway, hereafter referred to as Norway (Fig. 1). The most recent inventory of Norwegian glaciers estimates a total glacier area of 2692 ± 81 km2 based on Landsat imagery from the period 1999–2006 (Andreassen and others, Reference Andreassen, Winsvold, Paul and Hausberg2012b). We use this inventory as a basis when we refer to glacier identifiers (IDs 1-3143), and glacier regions (1–36) in the tables and text. Some glacier names have changed their ending on official maps, e.g. Storbreen was changed to Storbrean (Andreassen and others, Reference Andreassen, Winsvold, Paul and Hausberg2012b), but the glacier ID is the unique identifier. Table 1 gives further details on the geodetic surveys covering the glaciers. Table S1 gives an overview of the mass-balance glaciers. Table S2 gives details of the length change glaciers. The study glaciers range from Langfjordjøkelen in the northern part to Folgefonna 1300 km further south, and from Ålfotbreen situated near the west coast in maritime conditions to Gråsubreen 150 km to the east situated in the continental interior (Fig. 1).
Location map of studied glaciers in mainland Norway. Red colour shows laser scanned glacier areas, blue shows glaciers from the glacier inventory (Andreassen and others, Reference Andreassen, Winsvold, Paul and Hausberg2012b). Insets show close up on some regions. LAN, Langfjordjøkelen; STB, Storsteinsfjellbreen; BLÅ, Blåmannisen; SVV, Vestre Svartisen; SI, Svartisheibreen; ÅLF, Ålfotbreen; JOB, Jostedalsbreen with outlet glaciers; T, Tunsbergdalsbreen; N, Nigardsbreen; A, Austdalsbreen; HAB, Harbardsbreen; SPB, Spørteggbreen; JOF, Jostefonni; J, Juvfonne; S, Storbreen; H, Hellstugubreen; G, Gråsubreen; M, Memurubreene; Jotun, Jotunheimen; HAJ, Hardangerjøkulen; and FOL, Folgefonna. Green square shows extent of Pléiades imagery used for SVV and SI.

Overview of surveys used in this study
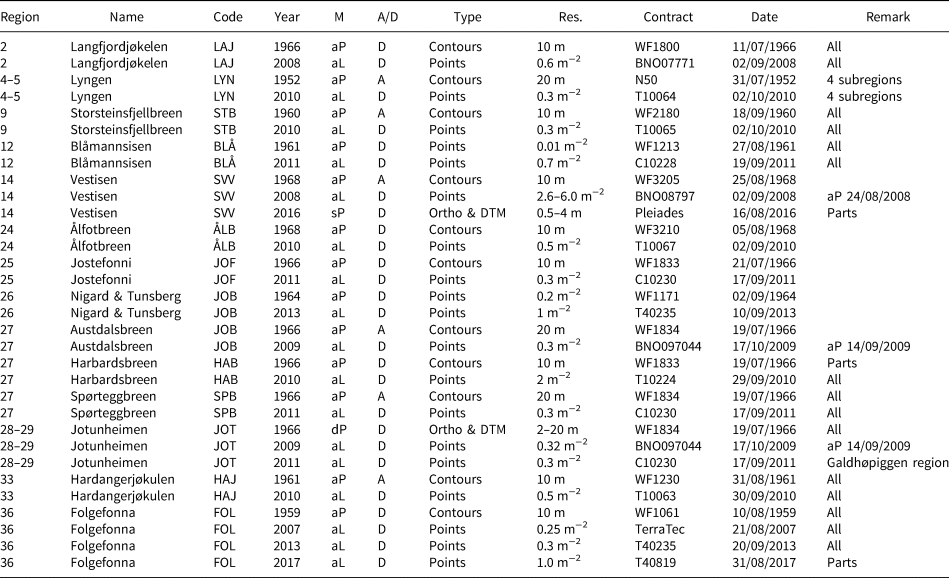
Methods (M) are abbreviated as follows: t, terrestrial; a, airborne; s, satellite; P, photogrammetry; L, laser scanning; A, analogue; D, digital.
For some regions aerial photos can have been acquired over multiple dates and even multiple years. Lyngen imagery were acquired 1952–1954.
Data and methods
Length change observations
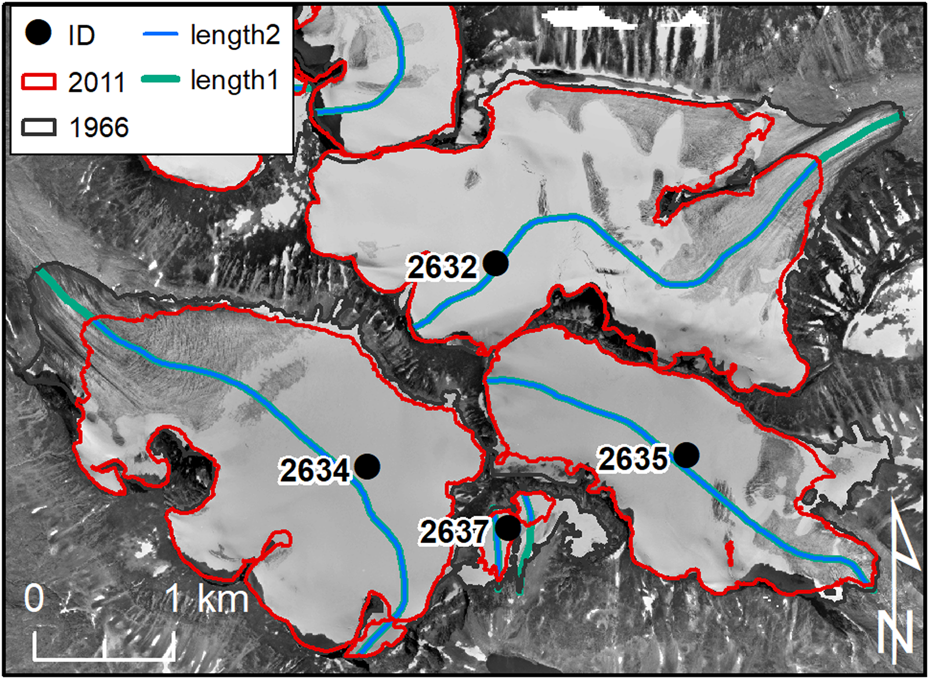
The glacier length change is derived from annual or multi-annual measurements of the distance between the glacier terminus and fixed reference points. Length change observations up to and including 2003 were summarised in Andreassen and others (Reference Andreassen, Elvehøy, Kjøllmoen, Engeset and Haakensen2005), and 58 series were described. Since then some series have been terminated, new series have started and in addition series measured by others have been included or updated (Fleig and others, Reference Fleig2013; Kjøllmoen and others, Reference Kjøllmoen, Andreassen, Elvehøy and Jackson2019). In this paper, we focus on 49 glaciers that have records available from the 1960s and onwards. In 2018, 39 of these glaciers are still measured, whereas ten have been discontinued. A complete record of annual measurements exists from Briksdalsbreen up to 2015, but this record was terminated as the glacier retreated into a location where length change variations could not be measured. Other glaciers with recently terminated front observations due to change of terminus hindering accurate measurements, include Bødalsbreen (−2015), Bøyabreen (−2014), Store Supphellebreen (−2014), Kjenndalsbreen (−2009) and Bergsetbreen (−2006). The series of Briksdalsbreen and Stigaholtbreen were homogenised due to differences between length changes measured on maps and the field observations (Kjøllmoen and others, Reference Kjøllmoen2007, Reference Kjøllmoen, Andreassen, Elvehøy and Jackson2019). As some of the newer series are relatively short, we have added map observations to obtain longer time series (Table S2). In these cases, outlines from the surface elevation maps were used together with automatically generated flowlines derived by Winsvold and others (Reference Winsvold, Andreassen and Kienholz2014), but in many cases modified to be appropriate for the glacier outlines we used in this paper that often featured new nunataks or different terminus forms (Fig. 2).
Digitised glacier outlines and basins for a subsection of the study glaciers in Jotunheimen. Digitised outlines are from 1966 and 2011 in this part. The background is orthophoto derived from the 1966 aerial photographs. Length1 and length2 are flowlines used to calculate the length change from maps. Glacier IDs are from the latest inventory (Andreassen and others, Reference Andreassen, Winsvold, Paul and Hausberg2012b).
Geodetic surveys
The surveys used to calculate surface elevations changes and geodetic mass balances in this study were constructed from various sources and with different methods (Table 1). We focus on two baselines, the ‘1960s’ and the ‘2010s’, but also show results for sub-periods of Søndre (southern) Folgefonna to illustrate temporal development of the mass balance. The 2010s surveys consist of laser scannings conducted over the period 2007–2013 on a number of glaciers including all glaciers with longer mass-balance surveys (Table 1). Aerial photographs were also usually acquired together with the laser scanning. The derived orthophotos were used to manually digitise the glacier outlines. In a few cases, laser scanning was conducted without orthophotos (Folgefonna: 2007, Langfjordjøkelen: 2008, Vestre Svartisen: 2008). In such cases, we used laser intensity values, Landsat imagery or orthophotos from www.norgeibilder.no to create glacier outlines. In addition, we have used Pléiades satellite stereo-images from 2016 covering the southern part of Vestre Svartisen (SVV) including Engabreen, most of Storglombreen, Fonndalsbreen and Svartisheibreen (@CNES & Airbus D&S). The satellite data were processed using the Ames Stereo Pipeline (Shean and others, Reference Shean2016). No Ground Control Points (GCPs) were included, the geolocation being based solely on orbital data (Berthier and others, Reference Berthier2014). Both the digital terrain model (DTM) and orthophoto had small areas with no data, and small areas in the DTMs had what were clearly erroneous values. The DTM was compared and co-registered to the 2008 DTM based on airborne laser scanning by comparison of stable ground outside the glacier. Compared with dGNSS-measurements at Engabreen on 4 August, 12 days prior to the satellite acquisition on 16 August, the accuracy of the co-registered DTM was assessed as ±0.5 m. The glacier outlines were digitised from the Pléiades orthophotos and supplemented using orthophotos from 2013 and 2014 (available in www.norgeibilder.no) where the outline was difficult to assess in the Pléiades imagery due to snow cover or missing data.
Most of the surveys from the first baseline of the 1960s are contour maps constructed from vertical aerial photographs using analogue photogrammetry. Typically, the contour maps have 10 m interval on the glacier and 20 or 50 m interval outside the glacier. These maps were later digitised. Some of these analogue maps were in recent years reconstructed using digital photogrammetry creating continuous point clouds (e.g. the 1968 survey of Ålfotbreen and Hansebreen and the 1964 survey of Nigardsbreen) to improve the surveys (Kjøllmoen, Reference Kjøllmoen2016a, Reference Kjøllmoen2016b). To obtain elevation changes for more glaciers we also digitised contour lines from maps of the Norwegian Mapping Authority. These maps have 20 m contours. The glacier outlines are previously digitised for glacier change assessments (Winsvold and others, Reference Winsvold, Andreassen and Kienholz2014). Here we use the same georeferenced maps and digitised glacier contours and some contours outside the glacier.
For one region, Jotunheimen, we created digital elevation models directly from digitised analogue aerial photos. The photos were taken in 1966 at a scale of 1:30 000 and were delivered scanned by the Norwegian Mapping Authority, giving a ground sampling distance of ~0.5 m. Totally 52 photos were used to cover the region. We obtained the calibration certificate of the camera used, to constrain the interior orientation of the photographs, and we constrained the exterior orientation of the photographs by picking up 31 GCPs from the LiDAR DTMs in 2 × 2 m from 2009/2011, visualised as a hillshade with similar light conditions as the aerial photographs. The workflow carried out for processing the scanned analogue photographs was as described in Magnússon and others (Reference Magnússon, Muñoz-Cobo Belart, Pálsson, Ágústsson and Crochet2016). The point clouds were refined with stereoscopic vision. A 20 × 20 m DTM was created from the point clouds. Finally, a mosaic of orthophotos was created with a 2 m resolution. This mosaic was used to manually digitise the glacier outlines (Fig. 2).
For the surveys available as digitised contour maps, the contour lines were converted to elevation points at vertices along contour lines. Elevation differences were calculated between the reference DTM and the elevation points, and elevation differences were interpolated for the glacier area. For gridded maps, elevation differences were calculated by DTM differencing on a cell by cell basis. Change analysis was done with two different programmes, Surfer and ArcGIS, but inter-comparison tests revealed near identical results, as also found by Andreassen and others (Reference Andreassen, Elvehoy, Kjøllmoen and Engeset2016).
To check for misalignments and shifts of the DTMs, the older contour maps/DTMs were compared with the laser scanned DTMs of the 2010s following the co-registration routine by Nuth and Kääb (Reference Nuth and Kääb2011), and corrected if needed as described in Andreassen and others (Reference Andreassen, Elvehoy, Kjøllmoen and Engeset2016). The vertical elevation differences were compared in stable terrain outside the glacier.
For the further processing, DTMs were created from the contour maps using digitised vertices along the contour lines together with elevation points from the map to convert contour maps to regular grids (5 or 10 m cell size) aligning to the 2010s DTM.
We calculated the geodetic mass balance, B geod, by

where A is the average glacier area of the two surveys assuming a linear change in time and ΔV is the volume change. The glacier area derived from the homogenised ice divides based on the latest laser scanning was used as a calculation basis. We used a conversion factor, f ΔV, of 850 ± 60 that is considered appropriate to use for converting volume change to mass change for a wide range of conditions (Huss, Reference Huss2013).
When comparing glaciological and geodetic balances it is important to adjust for generic differences in the methods, such as adjusting for ablation and accumulation between the glaciological and the geodetic surveys. This can be done using stake readings or modelling. We have not accounted for these factors in our results, and the elevation changes and derived mass balances are therefore a measure for the period between the two surveys. For glaciers mapped in mid-July in the 1960s and in September and October in the 2010s, this can cause an underestimation of geodetic mass balance (more negative), but due to the long time period of survey (~50 years), it will seldom amount to more than −0.02 m w.e. a−1. For shorter periods, however, this can constitute more. As our purpose is to study the elevation changes and volume changes over a longer time period, and not to reanalyse glacier mass balance, we have not adjusted for this in the present study.
Uncertainties were calculated following Andreassen and others (Reference Andreassen, Elvehoy, Kjøllmoen and Engeset2016). The largest uncertainties in the geodetic mass balance were for those involving digitised old contour maps. Here we conservatively estimated an accuracy of 5 m for the Lyngen maps of the 1950s, and 2–3 m for the analogue maps from the 1960s. The uncertainty in laser scanning was 0.3 m and Pléiades 0.5 m. This results in overall geodetic uncertainties ranging between 0.04 and 0.09 m w.e. a−1 for the period from the 1960s to the 2010s. The overall uncertainty for all of Norway is estimated to be ±0.05 m w.e. a−1.
Surface mass-balance observations
NVE's surface mass-balance series contain annual (net), winter and summer balances. To calculate glacier-wide winter (B w), summer (B s) and annual (B a) balances, the point measurements were interpolated to area-averaged values. The methods used to measure the mass balance in the field have in principle remained unchanged over the years, although the number of measurements has varied (Andreassen and others, Reference Andreassen, Elvehøy, Kjøllmoen, Engeset and Haakensen2005). Glaciological balances are reported as conventional surface balances, i.e. internal and basal balances have not been part of the observational programme and are not accounted for in the published mass-balance records. Surface mass-balance observations up to and including 2003 were summarised in Andreassen and others (Reference Andreassen, Elvehøy, Kjøllmoen, Engeset and Haakensen2005), where 42 series were described (their Table 1). Here we present data from 1962 to 2018 for 43 glaciers (Table S1). The data cover a total area of 518 km2, about 20% of the total glacier area in Norway. Data of the ten longest series have been homogenised for the period between mappings, and some of the series are calibrated (Andreassen and others, Reference Andreassen, Elvehoy, Kjøllmoen and Engeset2016). In addition, 18 of the short term records have been homogenised (Kjøllmoen, Reference Kjøllmoen2017). The steps in homogenising of a surface mass-balance series will differ from glacier to glacier according to the richness of the data material as well as the time available for the analysis; see Andreassen and others (Reference Andreassen, Elvehoy, Kjøllmoen and Engeset2016) and Kjøllmoen (Reference Kjøllmoen2017) for details. The remaining shorter time series have not been changed from their original values as they were already considered homogeneous (Svelgjabreen and Blomstølskardsbreen), will be homogenised later (Storglombreen and Tretten-null-tobreen), or are lacking metadata needed for homogenisation. All data are flagged with a reanalysis status in the NVE database (NVE, 2019). Further details on the observation programme including maps of the annual monitoring network and original values are documented in NVE's report series, Glaciological investigations in Norway (NVE, 1964–2019). All reports are available at www.nve.no/glacier. The data are also reported to the World Glacier Monitoring Service and published in their database (e.g. WGMS, 2017). An assessment of uncertainties in the annual glaciological mass-balance records (point measurement, spatial interpolation and glacier reference area) for the ten longest records are given in Andreassen and others (Reference Andreassen, Elvehoy, Kjøllmoen and Engeset2016, their Table 4).
Results
Glacier length changes
A selection of glaciers with length change records shows frontal development over the past 6 decades (Fig. 3). Many of the series displayed were extended for this study with map surveys and connected in time using linear interpolation, and thus miss annual fluctuations in the interpolated parts. For example, for the glaciers Bondhusbrea, Botnabrea and Rembesdalskåka measurements are lacking in the 1980s and 1990s and therefore the start of the advance in the 1990s is not shown. Among the other glaciers, Nigardsbreen and Engabreen have marked advances, followed by distinct retreat, whereas Storbreen and Hellstugubreen in southern Norway and Rundvassbreen, Steindalsbreen, Koppangsbreen and Langfjordjøkelen in northern Norway have steadily retreated. Among the Folgefonna glaciers, Bondhusbrea and Buerbreen (not shown) had clear advances, Svelgjabreen had only minor retreat, whereas Gråfjellsbrea retreated markedly.
Length change for a selection of glaciers in southern Norway (left) and northern Norway (right). Map surveys have been used to extend the series. Dotted lines are used to connect discontinuous measurements. See Figure 1 for locations and Table S2 for details.

Looking at the overall retreat of the glaciers from the 1960s, the mean reduction is 572 m or 12 m a−1 in 30 glaciers (Table S2). All studied glaciers have retreated, the smallest retreat is for Blomstølskardsbreen with 52 m, whereas Langfjordjøkelen and Lodalsbreen retreated 1.4 and 1.7 km, respectively, over the ~50 year period. Comparing sub periods is challenging as the sample of glaciers vary due to terminations of records of some glaciers, start of other series and as not all glaciers are measured every year (e.g. if terminus is snow covered). Although the values will vary with the samples involved, we see that for the period 1982–2000 that include advance of many glaciers, our sample of 24 glaciers had an annual change of −2 m a−1, whereas for the period 2000–2018 our sample of 29 glaciers had an annual change of −20 m a−1 (Table 2). For the last decade, 2008–2018, a larger sample of 37 glaciers shows an annual retreat of 19 m a−1. Results also show a rapid retreat of the glaciers over the last few years. During the period 2017–2018 (1 year), 32 glaciers had an average retreat of 33 m. All the measured glaciers are now at their minimum extent since measurements began and no glacier show any sign of a new advance in the near future.
Total and annual length change from the 1960s to 2018. Note that the sample of glaciers (n) varies for each period. See Table S2 for details on individual glaciers. Negative values represent glacier front retreat

Among the 49 length change glaciers, 27 of them advanced in the 1990s, defined as a continuous advance of >10 m during at least 3 years or advances documented by photos, maps, or other sources (Fig. 4). Five other glaciers are also known to have advanced, e.g. the advance of ID 957 of Blåmannsisen can be seen in the surface elevation change map of Blåmannsisen (Fig. 5). Another example is ID 2104 Sørsendalbreen, a small valley glacier west of Jostedalsbreen, that has evidence in the form of a defined moraine inside the extent of the 1967 aerial imagery, but outside the glacier extent of 2005. Melkevollbreen (ID 2324), an outlet of Jostedalsbreen, has photographic records that show an advance (Winkler and others, Reference Winkler, Elvehøy and Nesje2009). The glaciers with advances are found in all the regions studied, except for the northernmost regions (Storsteinsfjellbreen, Lyngen and Langfjordjøkelen). Advances may still have occurred in these regions, as measurements are sparse. What is to be recorded as an advance can be difficult to assess in some cases. For example Blomstølskardsbreen has had minor fluctuations since the onset of measurements in 1994, but no clear advance. Maps from 1959, 1995, 1997, 2007, 2013 and 2017 indicate a stable glacier with only minor changes (2007–2013–2017 is shown in Fig. 6). This outlet is known to have its Little Ice Age maximum extent as late as at about 1940 (Tvede, Reference Tvede1994). Photo records reveal an active advancing glacier in 1994, and we therefore marked Blomstølskardsbreen as a glacier with advance in the 1990s.
Recorded advances in the 1990s for glaciers measured since the 1960s. Five glaciers with other evidence of advance are also marked (advance other: ID 957 from Blåmannsisen, ID 1097 Fonndalsbreen, ID 2104 Sørsendalsbreen, 2324 Melkevollbreen and ID 2778 Surtningsbreen). In the inset glaciers are shaded in white. For name explanations, see Figure 1. For details on glaciers, see Table S2.

Elevation changes (m) of selected ice caps Blåmannsisen (BLÅ), Jostefonni (JOF), Spørteggbreen (SPB), Hardangerjøkulen (HAJ) and Folgefonna (FOL) from the ~1960s to ~2010s. Mass-balance glaciers and front position glaciers marked: Ru: Rundvassbreen, Sv: Svelgjabreen, Bl: Blomstølskardsbreen, Bu: Buerbreen, Bo: Bondhusbrea, Gr: Gråfjellbrea, Br: Breidablikkbrea, Mi: Midtdalsbreen, Re: Rembesdalskåka. ID 957 of Blåmannsisen is also marked. The scale varies. See Figure 1 for Location and Table 2 and S3 for results.

Elevation changes of southern part of Søndre (southern) Folgefonna 2007–2013 and 2013–2017. Glacier basins of Svelgjabreen (Sv) and Blomstølskardsbreen (Bl) are marked. See Figure 5 for Folgefonna 1959–2013.

Grouping the glaciers into annual advance (>2 m), retreat (<−2 m) and no change (±2 m), the advance period in the 1990s is clearly shown (Fig. 7). For a short period in the 1990s, the majority of the glaciers in the small sample measured advanced. After 2000, the glacier advance period was over, and almost all glaciers had annual retreats. The 1990s advances renewed the interest in the length change measurements, and the observing programme has been revitalised by NVE and others since the mid-1990s resulting in a better regional coverage. After a minimum of observed glaciers in 1992, a steady increase in the number of measurements has followed and today 30–40 glaciers are measured annually.
Stacked diagram of the number of length change observations measured annually from 1960 to 2018. Diagram shows glaciers with advance (>2 m), retreat (<−2 m) and no change (±2 m).

Comparing length changes based on flowlines from maps from the 1960s with maps from the 2010s for the 25 outlets of southern and northern Folgefonna (excluding mid-part which does not have distinct outlets), the total length of the outlets was reduced by 380 m (8%) from 1959 to 2013. For Hardangerjøkulen, the overall length reduction was 320 m (8%) from 1961 to 2010. For Jotunheimen, the mean length of 33 glaciers was reduced by 205 m from 1966 to 2009/2011 (9%). Thus, ice cap outlets from Folgefonna and Hardangerjøkulen and individual glaciers in Jotunheimen have retreated about the same in relative length. The length reduction of Hardangerjøkulen is similar to the 8% reduction found by Weber and others (Reference Weber, Boston, Lowell and Andreassen2019).
Glacier area changes
The total area of all glaciers in the geodetic sample decreased from 817 km2 in the 1960s to 734 km2 in the 2010s, an area loss of 84 km2. This 10% reduction in the glacier area is similar to the 11% area reduction Winsvold and others (Reference Winsvold, Andreassen and Kienholz2014) found for all glaciers from the 1960s to 1999–2006 when comparing inventory data from topographic maps and a Landsat inventory.
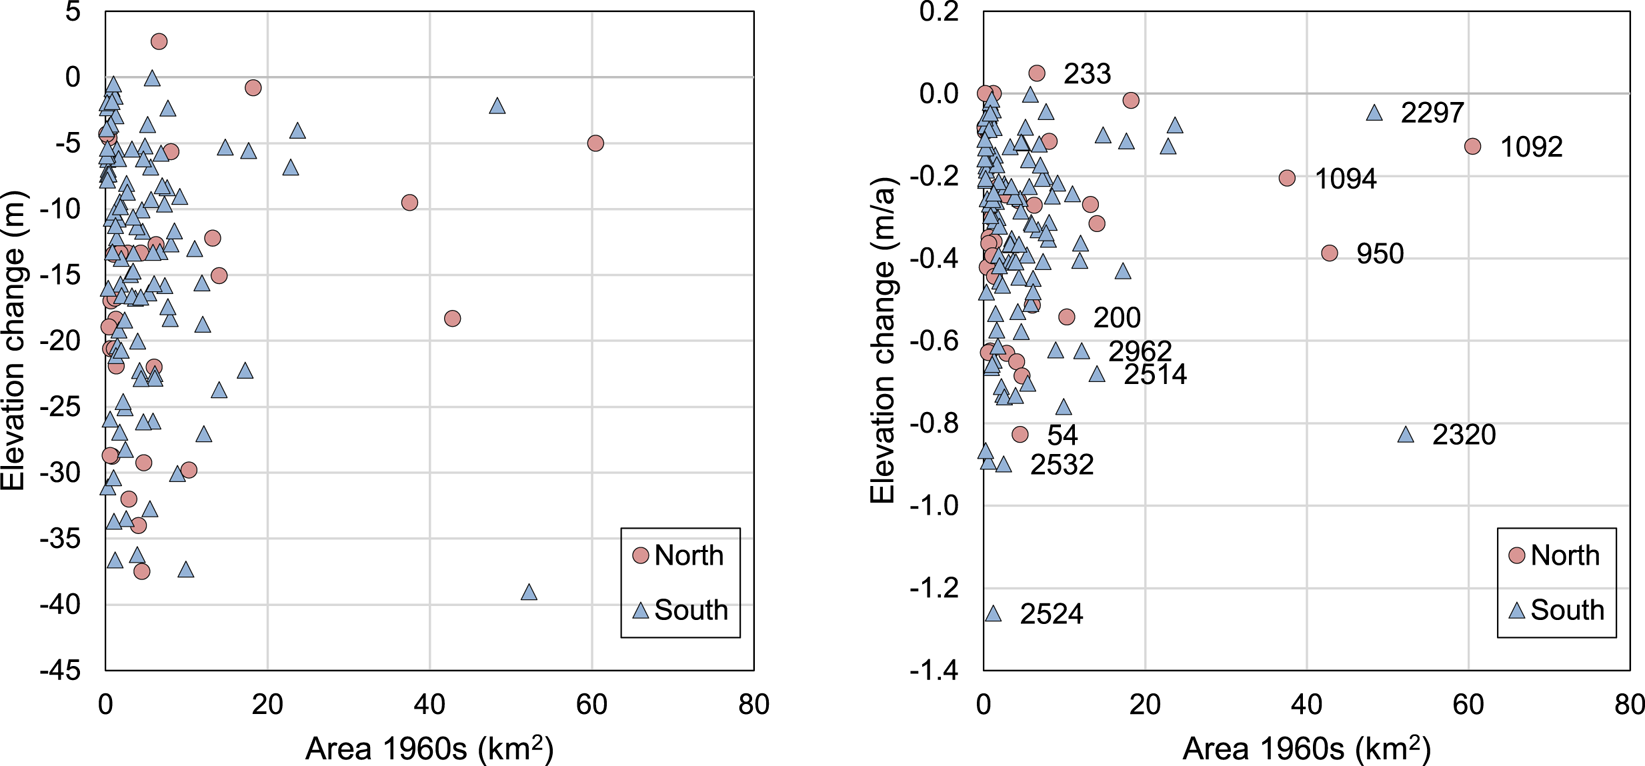
All but two of the 137 glaciers in our sample have decreased in area. One exception is a western outlet of Blåmannsisen (ID 957), where the glacier terminus had advanced up to 350 m and the glacier has thickened over the 50 year period (Fig. 5). However, recent aerial photos show that this outlet is also retreating. Despite the advance of this outlet, the overall area of Blåmannisen was reduced from 87.8 to 80.3 from 1961 to 2011, a reduction of 9% in 50 years. The other exception is a small unnamed glacier (ID 393) in Troms. This glacier has significantly thinned so small changes in area may be due to interpretation of snow along the perimeter. For all glacier units the average (median) change in area is −0.61 (−0.43) km2 or −19% (−17%). There is no distinct difference between glaciers in southern Norway and northern Norway. The largest percentage changes in area were found for the smallest glacier units (Fig. 8). Larger glaciers typically have a smaller relative change than the smaller glaciers. The absolute changes, however, are greatest for the larger glaciers in this region (Table S3).
Area change in % vs initial area in the 1960s. See Table S3 for details. Glaciers are divided into North (ID <1200) and South (ID >2000).

Glacier surface elevation changes and geodetic mass balances
The surface elevation of all glaciers in the sample has been fallen, except for Fornesbreen (ID 233) (Fig. 9, Table S3). Results from Fornesbreen are likely to be erroneous due to unreliable elevation contours in the 1950s map.
Elevation change from the 1960s to the 2010s in m to the left and m/a to the right vs initial area in the 1960s. Some glacier IDs are shown for reference. See Table S3 for details. Glaciers are divided into North (ID <1200) and South (ID >2000).
The arithmetic mean of the surface elevation change for all 137 glaciers in our sample is −16.8 m for the period, which is equivalent to −0.34 m a−1. Area-weighting over the total glacier area of all glaciers, the surface elevation is less negative, −15.5 m or −0.32 m a−1. Converted to the geodetic mass balance, this gives a mean geodetic balance of −0.27 ± 0.05 m w.e. a−1. The values would be less negative if calculated for the maximum area due to the area reduction of the glaciers. Using the maximum area instead would give values for the surface elevation change of −14.7 m and −0.30 m a−1 and the geodetic mass balance of −0.25 m w.e. a−1.
Overall, glaciers have shrunk significantly in their terminus areas, less in upper parts (Fig. 5). The only exception is the western outlet of Blåmannsisen that has advanced and grown in the period between mappings. This is in contrast to the other, thinning parts of Blåmannsisen.
Grouping glaciers by regions and glacier complexes reveal that Langfjordjøkelen had the most negative mass balance with −0.50 m w.e. a−1 (Table 3, Fig. 10). The least negative region is Vestre Svartisen with −0.15 m w.e. a−1. Other glaciers that thinned considerably are Harbardsbreen (−0.45 m w.e. a−1), Midtre Folgefonna (−0.40 m w.e. a−1) and Jostedalsbreen (−0.39 m w.e. a−1). Overall, all regions have a negative geodetic mass balance, the other regions ranging between −0.21 and −0.32 m w.e. a−1. Within the regions, there can be large local variability. Jostedalsbreen is the largest glacier in mainland Europe. We only have results for three outlet glaciers from Jostedalsbreen, amounting to about 22% of the total area of 474 km2 in 2006 (Andreassen and others, Reference Andreassen, Winsvold, Paul and Hausberg2012b). The three glaciers differ in the surface elevation change and geodetic mass balance. Whereas Nigardsbreen (ID 2297) had a small mean surface elevation change of −2.2 m from 1964 to 2013, Tunsbergdalsbreen (ID 2320) in the same period had a mean surface lowering of 40 m. The change of Austdalsbreen (ID2478) was −17.4 m for the shorter period 1966–2009.

Changes in area (ΔA), surface elevation (Δh) and volume (ΔV) and geodetic mass balance (B geod) with related uncertainty (σ) for glaciers grouped in complexes or regions. See Table S3 for further details

The Folgefonna glaciers have been mapped repeatedly. The overall pattern from 1959 to 2013 is a strong reduction of the outlets and most parts have thinned (Fig. 5). The eastern parts have some areas with thickening in upper parts. These may be artefacts from the old maps. However, as already noted Blomstølskardsbreen has a much smaller reduction and the glacier that had the smallest length retreat in our sample. Looking at the southern part of Søndre Folgefonna in more detail, differencing the DTM's from 2007, 2013 and 2017 shows that the southern outlets thinned from 2007 to 2013, thereafter they thickened in the upper parts (Fig. 6). These DTM's were based on laser scannings that are very accurate, also in the flat snow covered parts, in contrast to aerial photographs. Such short-term changes are hidden in the overall pattern from the 1960s to 2010s.
Glaciological mass balance
The annual balance values for the period 1962–2018, when 43 glaciers have been measured, show a great inter-annual variability (Fig. 11). The only series that start before 1962 is Storbreen (started in 1949) and Kjølbreen and Glombreen (period 1954–1956, 3 years). Simply taking the arithmetic mean for all observations over the 1962–2018 period gives a mean of −0.27 m w.e. a−1 for all glaciers. Accounting for the volume they represent, yields a less negative balance, −0.08 m w.e. a−1.
Annual balance values for all glaciers with mass-balance records in Norway 1962–2018. IDs sorted from north to south. B a values are colour coded, reddish colours showing deficits, bluish colours showing years with surplus. Light yellow colour denotes B a values between −0.3 and +0.3. Boldface marks the ten longest series. Modelled values for Langfjordjøkelen for 1994 and 1995.

In the period 1989–1995 all glaciers but Langfjordjøkelen gained mass. From 2001 and onwards most years have had a negative mass balance, with great deficits in some years such as 2002, 2003, 2006, 2010, 2011, 2014 and 2018. On the other hand, 2015 was a year with surplus on all glaciers, except Langfjordjøkelen. Despite being the most positive year since the early 1990s, the 2015 average B a did not counterbalance more than the average annual loss since 2000.
For the period 1989–2000, the mean mass balance for the ten glaciers having continuous series (Langfjordjøkelen modelled for 1994 and 1995), is +0.24 m w.e. a−1, whereas for the period 2001–2018 the mean mass balance is −0.83 m w.e. For the period 1989–2018 the average is −0.40 m w.e. a−1. Looking at the 3 last decades for the same ten glaciers, they show that 1991–2000 had a slight surplus, (+0.07 m w.e. a−1), 2001–2010 is the most negative (−0.97 m w.e. a−1) and 2011–2018 (period is 8 years) is also clearly negative (−0.65 m w.e. a−1).
The correlation between the mass-balance glaciers is investigated by comparing B a values (Table S4). For the ten glaciers in Norway with the longest mass-balance series in the period 1989–2018 (30 years, modelled values are given for Langfjordjøkelen 1994 and 1995), the glaciers in southern Norway have a glacier-to-glacier correlation of 0.70 or greater (thus explaining 49% or more of the variance) between the glaciers. Neighboring glaciers correlate best, e.g. the correlation between Hansebreen and Ålfotbreen is 0.96. Langfjordjøkelen correlates best with Engabreen (0.76) and the maritime glaciers in southern Norway, but the correlation weakens with distance from the coast. Our results are in overall agreement with previous studies (e.g. Rasmussen, Reference Rasmussen2007; Andreassen and others, Reference Andreassen, Kjøllmoen, Rasmussen, Melvold and Nordli2012a). The centred mass balances, where each annual value is subtracted from the glacier's average (Vincent and others, Reference Vincent2017), reveal the overall good agreement, but also interannual variations (Fig. 12). The spread was larger in the first part of period, but was less in later years when the mass balance has been more negative (Fig. 12).
Centred glacier-wide annual mass balance for ten glaciers in Norway over 1989–2018. Mean is arithmetic mean of the ten glaciers.

Discussion
How accurate are the old maps?
In this paper, we compare older glacier maps with highly accurate laser scannings to obtain changes in surface elevation and calculate geodetic mass balance for a period. It is difficult to assess how accurate these contour maps actually are. Although the uncertainty will vary from the different maps due to snow conditions etc, here we compare two independent datasets derived from the same aerial photographs from 1966 of Austre and Vestre Memurubrean in the Jotunheimen region (Fig. 1). Whereas we produced a new DTM and orthophotos from 1966, two analogue maps that were constructed in 1967 and published as paper maps by NVE in 1968 (NVE, 1968a, 1968b) were also available. These maps were scanned, georeferenced and contour lines and glacier outlines were digitised (Kjøllmoen, Reference Kjøllmoen2017). The work was done independently of the digital photogrammetry and digitisation of glacier outlines from the scanned and orthomosaicked 1966 aerial photos. The glacier outlines match well, but differences occur over snow fields along the terminus, ice divides and debris covered parts of the glacier (Fig. 13). The area of Austre Memurubrean in 1966 was larger as digitised from othophoto than from the glacier map, whereas the area of Vestre Memurubrean was smaller (Table 4). The ice divide of Hellstugubreen/Vestre Memurubrean vary, as the one digitised from the orthophotos used the current ice divide calculated from the laser scanning of 2009, instead of the one used for the calculations at the time of the mass-balance measurements. Homogenisation of the ice divide for Vestre Memurubrean reduces the difference in area, which is within ±1.2% or 0.11 km2 (Table 4). The difference in elevation was also calculated by subtracting the point elevations digitised from the analogue contours with the 1966 DTM value at the same location (Fig. 13). For Austre (Vestre) Memurubrean the elevation difference based on 7411 (11 623) points was 0.55 m (0.93 m). The largest differences were found at high elevations, in the southern cirque of Austre Memurubrean and northern cirque of Austre Memurubrean (Fig. 13). Interpolating the dHpoints to a difference DTM gives a mean difference of −2.0 m of Vestre Memurubrean and +0.4 m of Austre Memurubrean. Thus, the digitised glacier map of 1966 is lower than the DTM 1966 for Vestre Memurubrean, caused by larger differences in one part. Using the analogue map instead of the new DTM when calculating dH for 1966–2009, results in a larger difference for Vestre Memurubrean, and a smaller for Austre Memurubrean. Results from this comparison show that larger uncertainties are to be expected in the mapping of snow covered parts on glaciers from aerial photographs, and that they affect the overall uncertainty. Our results are within our estimated surface elevation uncertainty of ±3–5 m for the oldest maps.
Mapping Vestre (to the left) and Austre Memurubrean (to the right) for two independent surveys using the same aerial photos from 1966. Left figure shows the glacier outlines digitised from the orthophotos derived from digital photogrammetry in this study (1966 ortho dig.) and the outlines digitised from the analogue maps (1966 map dig.). Right figure shows contour points of 1966 vs new DTM of 1966. Negative values show where the analogue map values are lower than the digital photogrammetry DTM and vice versa.

Area (km2) of glaciers Austre Memurubrean and Vestre Memurubrean in 1966 from two independent mappings

Ortho dig. is area from digitising outlines on screen from the orthophotos. Map dig. is area from scanning and digitising the glacier map from 1966. The area obtained by using a homogenised ice divide for Map. dig. is given by*.
Representativeness of mass-balance glaciers
The ten long-term mass-balance glaciers cover an area of 131 km2, which is 5% of the total glacier area of 2692 km2. Their combined area-elevation distribution curve displays a bi-modal distribution (Fig. 14a), similar to the bi-modal distribution found for all the Norwegian glaciers that illustrate the predominant location of glaciers in northern (1000–1300 m a.s.l.) and southern Norway (1400–1600 m a.s.l.) (Andreassen and others, Reference Andreassen, Winsvold, Paul and Hausberg2012b). The area-elevation distribution of the ten mass-balance glaciers follows the main characteristics of glaciers in Norway, but has more relative area of higher elevations, reflecting that eight of ten glaciers (91 km2 and 70% of the glacier area) are located in southern Norway. Of the total glacier area in Norway, the percentages are 57% in southern Norway and 43% in northern Norway (Andreassen and others, Reference Andreassen, Winsvold, Paul and Hausberg2012b). The area-elevation curve for the geodetic surveys 1960s to 2010s presented in this paper is slightly lower than the curve for all of Norway, but also follow the distribution of all of Norway (Fig. 14a).
(a) Upper figures: Area-elevation distribution curves of the ten reference glaciological mass-balance glaciers (glac mb 10 gl) compared with the larger sample of glaciers used for geodetic mass-balance calculations (geod mb) and the total glacier area for Norway (Norway). Left figure shows absolute values, right figure shows scaled relative area of the same samples. Area refers to 2010s. The area of Norway refers to the latest glacier inventory from 1999–2006 (Andreassen and others, Reference Andreassen, Winsvold, Paul and Hausberg2012b). (b) Lower figure: Area-elevation distribution curves of Nigardsbreen, Tunsbergdalsbreen and Austdalsbreen in the 1960s and 2010s.

Having a larger sample of geodetic observations allows the comparison of the glaciers used for the glaciological mass-balance measurements with other glaciers of the same ice cap or their region. Langfjordjøkelen east (54) is most negative of the outlets of Langfjordjøkelen (Table S3). Rundvassbreen is slightly more negative than the overall for the ice cap (Table S3, Fig. 5). Rembesdalskåka is the least negative of the outlets of Hardangerjøkulen (Table S3, Fig. 5). On Jostefonni, the mass-balance glaciers (ID 2146 and ID 2148) have more negative geodetic results than the other units. Looking at Jostedalsbreen, the already mentioned difference between Nigardsbreen and Tunsbergdalsbreen is striking (Table S3). The third outlet from Jostedalsbreen in our sample, Austdalsbreen, has results in between the two. This glacier calves into a lake that has been regulated since 1988 and the ablation is enhanced due to this. Since the mass balance of this glacier is influenced to some extent by this regulation, this glacier is not used as a reference glacier for climate studies (Fleig and others, Reference Fleig2013) and without the calving the figures might be less negative and more comparable with Nigardsbreen. The large thinning of Tunbergdalsbreen is remarkable compared to the near balance of Nigardsbreen. The area-elevation distributions of the three outlets of Jostedalsbreen differ, Nigardsbreen has a large part at high elevations, whereas Tunsbergdalsbreen has a larger part at lower elevations. Austdalsbreen has an even distribution, is lower located than the other two and is much smaller (Fig. 14b). The three glaciers from Jostedalsbreen cover only about 20% of the total area, so here more data are needed to obtain the geodetic mass balance of the whole ice cap. Using very high-resolution satellites such as Pléiades or World View (Porter and others, Reference Porter2018) could be a good option to extend the surveys and obtain results for larger parts of Jostedalsbreen and Vestre and Østre Svartisen. In addition, the aerial photographs from the 1960s could be used to reconstruct an accurate DTM. For Vestre Svartisen, the small valley glacier Svartisheibreen (ID 1135), adjacent to the large ice cap, has twice the negative geodetic mass balance compared to the three ice cap outlets Engabreen, Fonndalsbreen and Storglombreen. Svartisheibreen calves in a lake, resulting in increased mass loss due to calving. Monitoring of the then advancing outlet (ID 957) of Blåmannsisen, instead of Rundvassbreen as NVE measured, would give different results. What caused the advance of ID 957 is difficult to say as we have no in situ measurements, but changes in ice divide, glacier dynamics, precipitation or wind drift patterns may cause the difference. Observed patterns in surface elevation changes may be caused by significant variations in ice dynamics (Belart and others, Reference Belart2019). Nevertheless, the results clearly show why it is useful to repeatedly survey larger regions to obtain a geodetic mass balance for a larger sample of glaciers.
There is no distinct regional pattern of the geodetic mass balance in South Norway, and there is no clear gradient in the mass balance with more positive balances for the maritime glaciers in the west compared to the continental glaciers in the east. All glaciers are thinning and shrinking, and topographic controls as well as lake enhanced melt may explain much of the variability between neighboring glaciers.
Mass-balance estimates of all of Norway
Glaciological and geodetic mass balances are not directly comparable, as the glaciological method measures the surface mass balance, whereas the geodetic method includes surface, internal and basal mass balances. Internal and basal melt can be substantial for temperate glaciers (Alexander and others, Reference Alexander, Shulmeister and Davies2011; Oerlemans, Reference Oerlemans2013). This was also found for maritime glaciers with a large elevation range in Norway, with Nigardsbreen and Engabreen having estimated internal ablation of up to −0.16 and −0.15 m w.e. a−1 (Andreassen and others, Reference Andreassen, Elvehoy, Kjøllmoen and Engeset2016). The reanalysed and calibrated glaciological series show a more consistent signal of the glacier change over the period of observations than previously reported as the mass surplus of several maritime glaciers were reduced.
The presented study here showed that the arithmetic mean of all glaciological mass-balance series over 1962–2018 was −0.27 m w.e. The area-weighted sum was less negative: −0.08 m w.e. The arithmetic mean of all geodetic studies was −0.29 ± 0.05 m w.e., and the area weighted mean was −0.27 ± 0.05 m w.e. The difference between the area-weighted means can be due to different periods and different samples, but also reflects that much of the glacier area in the glaciological studies is large maritime outlet glaciers where the internal balance is a significant generic difference between the glaciological and geodetic mass balance.
Engelhardt and others (Reference Engelhardt, Schuler and Andreassen2013) used mass-balance data to model the mass balance of all of Norway and found −0.02 m w.e. a−1 for the full period 1961–2010. Although the period is comparable with ours, they used original data prior to the homogenisation and calibration of many series (Andreassen and others, Reference Andreassen, Elvehoy, Kjøllmoen and Engeset2016; Kjøllmoen, Reference Kjøllmoen2017) which probably gives a too positive balance. However, their results show positive trends of the winter balance between 1961 and 2000 followed by a remarkable decrease in both summer and winter balances which resulted in an average annual balance of −0.86 ± 0.15 m w.e. a−1 between 2000 and 2010 after 4 decades of zero to slightly positive annual mass balances (Engelhardt and others, Reference Engelhardt, Schuler and Andreassen2013).
Two recent global studies give results for the GTN-G (RGI) region Scandinavia, thus including both mainland Norway and Sweden, whereby Sweden's area amounts to 10% of Norway's glacier area and 5% of its glacier volume (e.g. Beniston and others, Reference Beniston2018). Zemp and others (Reference Zemp2019) found annual rates for Scandinavia from 2006 to 2016 of −0.49 ± 0.27 m w.e. using ASTER and ArcticDEM for the period 2000–2017. Their datasets differ from our geodetic dataset so it is difficult to compare directly. Only a few of our geodetic surveys cover this subperiod. Wouters and others (Reference Wouters, Gardner and Moholdt2019) used GRACE-derived mass balances for Scandinavia. Their values were positive for Scandinavia over the period 2002–2016. Their results showed good agreement with in situ annual mass balances in the year-to year variability, but were more positive than observed (Wouters and others, Reference Wouters, Gardner and Moholdt2019). From our glaciological mass-balance dataset we obtain values of −0.21 (area weighted) and −0.47 (arithmetic mean) m w.e. a−1 for the period 2006/07–2015/16. Similarly, we obtain values of −0.39 (area weighted) and −0.68 (arithmetic mean) m w.e. a−1 for the period 2002/03–2014/15.
The total Norwegian ice volume was estimated to be 271 ± 28 km3 for the mid-2000s, derived from interpolated volume for surveyed glaciers and a distributed model for remaining glaciers (Andreassen and others, Reference Andreassen, Huss, Melvold, Elvehøy and Winsvold2015). The mean thickness of all glaciers was estimated to be 97 m. Assuming our geodetic sample is representative, our mean loss of 16 m between the 1960s and the 2010s, show an overall volume loss of 13 ± 3%. The mean loss is 0.7 gigaton (GT) per year. With the increased melt since the 2000s, glaciers in Norway now loose about 2.2 GT per year.
Glacier retreat, and temporal and spatial variation in mass balance
Previous studies have shown that winter precipitation is more important for the annual balance of maritime glaciers whereas summer temperatures are more important for continental glaciers, in view of the relationship between the standard deviations of the individual components sB w, sB s and sB a (Andreassen and others, Reference Andreassen, Elvehøy, Kjøllmoen, Engeset and Haakensen2005; Marzeion and Nesje, Reference Marzeion and Nesje2012; Trachsel and Nesje, Reference Trachsel and Nesje2015). Revisiting this relationship over the common period 1989–2018 for ten glaciers showed that the relative importance of the winter balance is greatest for Engabreen, Ålfotbreen and Rembesdalskåka, and lowest for Storbreen, Hellstugubreen and Gråsubreen (Fig. 15). The relative importance of the summer balance is greatest for Langfjordjøkelen, Gråsubreen and Hellstugubreen, but also relatively most important for Nigardsbreen and Hansebreen. Naturally, the relationship will vary within the studied period.
Relative contribution of B w and B s to the fluctuation of B a calculated as the ratios sB w/sB a and sB s/sB a, where sB w, sB s and sB a are the standard deviations of the individual components. The period is 1989–2018. Langfjordjøkelen (Lan) and Engabreen (Eng) are located in the north, Ålfotbreen (Ålf) to Gråsubreen (Grå) are sorted from west (maritime) to east (continental). Langfordjøkelen is modeled values for 1994 and 1995. See Figure 1 for location and Table 1 for geographical coordinates.

The mass balance of Norway's glaciers is influenced by variations in circulation and wind patterns of the North Atlantic Oscillation (NAO), in particular for glaciers in southwestern Norway (e.g. Nesje and others, Reference Nesje, Lie and Dahl2000). When the NAO-index is positive (that is, Azores pressure greater than Iceland pressure), winds from the west are strong, and snow accumulation at altitude in Scandinavia is high. However, the relationship between NAO and winter balances is lost only considering years with a below-median NAO-index (Trachsel and Nesje, Reference Trachsel and Nesje2015). Trachsel and Nesje (Reference Trachsel and Nesje2015) found that sB w/sB a was higher for years with above-median NAO for most glaciers than for the entire series, and lower for years with below-median NAO for most glaciers. Although the NAO index is more commonly used, Rasmussen (Reference Rasmussen2007) found better correlations for the winter balance with the Arctic Oscillation (AO), a climate index of the state of the atmosphere circulation over the Arctic, than NAO for nine of the ten longest mass-balance glaciers in Norway using data up to and including 2003. Revisiting this relationship for the ten glaciers for their common period of observations 1989–2018, clearly reveal that the winter and annual balance of the northernmost glaciers, Langfjordjøkelen and Engabreen, are better correlated with AO than NAO (Table 5). For the glaciers in southern Norway, the correlations are similar for NAO and AO, and reduced with distance to the coast. This is in accordance with previous studies (e.g. Nesje and others, Reference Nesje, Lie and Dahl2000; Rasmussen, Reference Rasmussen2007; Marzeion and Nesje, Reference Marzeion and Nesje2012; Mutz and others, Reference Mutz, Paeth and Winkler2016). NAO and AO correlations with seasonal and annual balances for the ten longest series for the period 1989–2018 (30 years) showed the best correlations for almost all glaciers with the shorter period December–March than October–April (Table 5). The period with mass surplus from 1989 to 1995 coincides with a period of strongly positive NAO (e.g. Pohjola and Rogers, Reference Pohjola and Rogers1997; Nesje and others, Reference Nesje, Lie and Dahl2000; Rasmussen and others, Reference Rasmussen, Andreassen, Baumann and Conway2010; Trachsel and Nesje, Reference Trachsel and Nesje2015). The NAO has also been positive of several recent years, in particular in 2012, 2014 and 2015 (Fig. 16). The less negative mass balance, e.g. comparing 2001–2010 and 2011–2018, and as demonstrated for Folgefonna (Fig. 6), is thus likely partly attributed to large scale circulation and stronger westerly winds over this period resulting in high winter precipitation. However, similar weather patterns may result in different amounts of precipitation and in different levels of temperature, thus not only weather patterns, but also variations in them play a role (e.g. Küttel and others, Reference Küttel, Luterbacher and Wanner2011; Trachsel and Nesje, Reference Trachsel and Nesje2015).
NAO and AO index for December–March and the arithmetic mean (minimum and maximum) annual balance for ten glaciers with records for 1989–2018. NAO and AO data were downloaded from the NOAA Center for Weather and Climate Prediction (http://www.cpc.ncep.noaa.gov/).

Correlation with NAO and AO index for ten glaciers for 1989–2018
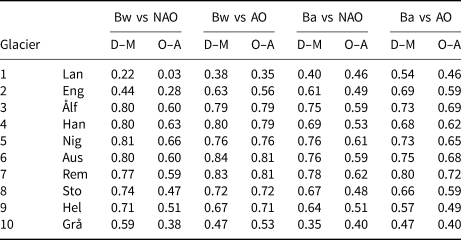
Langfjordjøkelen lacks values for 1994 and 1995. D–M: December through March, O–A: October through April. NAO and AO data were downloaded from the NOAA Center for Weather and Climate Prediction (http://www.cpc.ncep.noaa.gov/).
Conclusions
In this paper we summarised major changes of glaciers in Norway over the past 5 decades covering the period from ~1960 to 2018. Map surveys and field observations all show that glaciers in Norway have shrunk in area (10%), reduced their lengths (10 m a−1), thinned (−16 m) and lost mass (−0.27 ± 0.5 m w.e. a−1). The glaciers are now at a minimum stage since measurements began ~1900. There are both regional and temporal variations over this period. Frontal advances have been recorded in all regions except for the northernmost in Troms and Finnmark (Storsteinfjellbreen, Lyngen and Langfjordjøkelen). The glaciers have retreated and thinned markedly since 2000. Despite increased melt since 2000, years with a positive mass balance still occur, likely attributed to large scale circulation and periods of stronger westerly winds.
Supplementary material
The supplementary material for this article can be found at https://doi.org/10.1017/jog.2020.10.
Data availibility
NVE's glaciological mass balance and length change data can be downloaded from www.nve.no/glacier (NVE, 2019). NVE's length change records have been updated with the length change data extracted from maps as presented here. Our length change and mass-balance data are submitted annually to the World Glacier Monitoring Service.
Acknowledgements
The dataset of Norwegian glaciers would not be possible without all the observers who helped collecting them. We thank colleagues at NVE, our front position observers and personnel from hydropower companies. We thank Rune V. Engeset, NVE, for providing input to the manuscript. We thank John Brittain, NVE, for English corrections. We thank two anonymous reviewers for input to the manuscript, and editor C. Schneider for handling the manuscript. Statkraft is thanked for partly funding the laser scannings. We thank Trygve Snøtun and Goeffrey D. Corner for providing information on length change advances and records. Torgeir Ferdinand Klingenberg helped digitising some of the glacier outlines. We thank Etienne Berthier for providing Pléiades (@CNES & Airbus D&S) imagery of Svartisen 2016 and processing the data resulting in orthophotos and DTMs. We thank the Norwegian Mapping Authority (Kartverket) for proving orthophotos through norgeibilder.no, a valuable source for glacier status. The work is a contribution to the CryoClim, Svali and Copernicus Glacier Service projects, and internal NVE project ‘Massebalanse’.
Author contribution
LMA, BKJ and HAE calculated mass-balance data and surface elevation changes. JB prepared DTM and orthophoto for Jotunheimen 1966. HAE prepared length change data. LMA prepared all figures and tables with aid from BKJ and HAE. LMA analysed results and wrote text with contributions from BKJ, HAE and JB.


 Open access