

The Dawes Reviews are substantial reviews of topical areas in astronomy, published by authors of international standing at the invitation of the PASA Editorial Board. The reviews recognise William Dawes (1762–1836), second lieutenant in the Royal Marines and the astronomer on the First Fleet. Dawes was not only an accomplished astronomer, but spoke five languages, had a keen interest in botany, mineralogy, engineering, cartography and music, compiled the first Aboriginal-English dictionary, and was an outspoken opponent of slavery.
1 INTRODUCTION
It is appropriate to consider the properties of extrasolar planet and brown dwarf atmospheres together because they have many similarities. Planets and brown dwarfs cover similar temperature ranges and have similar radii. Planets extend up from very low temperatures (such as those of the ice giants Uranus and Neptune in our Solar system) to effective temperatures of ~ 3 000 K in hot Jupiters, while new discoveries are continually pushing down the temperature of the coolest known brown dwarfs. The recently discovered Y dwarf class have temperatures as low as ~ 300 K (Cushing et al. Reference Cushing2011).
The important processes that occur in these atmospheres are also similar as these are determined primarily by effective temperature. Molecules, chemistry and clouds are important in determining the opacities and hence structure of all these objects. At any temperature below about ~ 2 000 K, solid and liquid condensates can start to form, resulting in considerable complications compared with higher temperatures where only gas phase processes need to be considered. More complex molecules such as methane (CH4) become important and the excitation of high vibrational and rotational levels mean that vast numbers of spectral lines are needed to model the opacity. The modelling of these atmospheres thus presents new challenges compared with those encountered in conventional stellar atmosphere models, and these challenges are largely common to the modeling of both exoplanets and brown dwarfs. The differences between giant exoplanets and brown dwarfs include the generally lower mass (and hence gravity) in exoplanets, and the difference in environment. An exoplanet orbits a star, and the stellar illumination can have a significant influence on its structure and properties, particularly for close in planets such as hot Jupiters. The presence of the host star also impacts on our ability to observe the planet. While some observations can be easier for planets than brown dwarfs (e.g. determining mass and radius), spectroscopy to characterise the atmospheres is usually extremely challenging for exoplanets while relatively straightforward for brown dwarfs.
The structure of this review will be to begin with looking at brown dwarf atmospheres. This reflects the fact that these are better observed and understood objects, without the complications that are introduced by the presence of the host star in exoplanet systems, but nevertheless illustrate many of the processes that are also important in giant exoplanets. Exoplanet atmospheres will be considered next, with a brief look at the giant planets in our own solar system as a guide. Observations relevant to atmospheric structure and composition are now being obtained by a number of methods primarily for giant exoplanets. These will be outlined and the results of these methods discussed.
The next section will look at the modelling of brown dwarf and exoplanet atmospheres. The techniques are very similar for both classes of objects. A final section will look at the possibilities of detecting extrasolar habitable planets and searching for signatures of life on such planets.
2 BROWN DWARFS
2.1 History and properties
The existence of brown dwarfs was predicted long before they were recognised observationally. Kumar (Reference Kumar1963) and Hayashi & Nakano (Reference Hayashi and Nakano1963) showed that there was a lower limit to the mass of a main-sequence star below which hydrogen burning could not occur. Kumar referred to the objects below this limit as ‘black’ dwarfs, but the name ‘brown dwarf’ proposed by Tarter (Reference Tarter1975) is the one that has been adopted. More recent models set the hydrogen burning mass limit at 0.072–0.075 M⊙ for a solar composition and somewhat higher for lower metallicities (Chabrier & Baraffe Reference Chabrier and Baraffe1997; Burrows et al. Reference Burrows, Hubbard, Lunine and Liebert2001).
Because brown dwarfs do not have a continuing nuclear energy source, their evolution is a process of cooling and decreasing luminosity with age. Unlike stars on the main sequence whose properties are determined primarily by their mass, the temperature and luminosity of a brown dwarf are determined by both mass and age. This is illustrated in Figure 1 where the effective temperatures of low mass objects with masses between 0.0005 and 0.1 M⊙ are plotted as a function of age. The evolutionary models used here are those of Baraffe et al. (Reference Baraffe, Chabrier, Barman, Allard and Hauschildt2003) but similar general trends would be obtained with other recent models (e.g Chabrier et al. Reference Chabrier, Baraffe, Allard and Hauschildt2000a; Burrows et al. Reference Burrows, Hubbard, Lunine and Liebert2001; Baraffe et al. Reference Baraffe, Chabrier, Allard and Hauschildt2002; Saumon & Marley Reference Saumon and Marley2008).
Evolution of effective temperature for objects from 0.0005 to 0.1 M⊙ based on the models of Baraffe et al. (Reference Baraffe, Chabrier, Barman, Allard and Hauschildt2003). The red tracks are for stars with masses above the hydrogen burning limit. The magenta tracks are for brown dwarfs, and the blue tracks are for objects below the deuterium burning limit (planets or sub brown dwarfs) The tracks plotted from top to bottom are masses of (Stars: 0.1, 0.09, 0.08, 0.075 M⊙) (Brown Dwarfs: 0.07, 0.06, 0.05, 0.04, 0.03, 0.02, 0.015 M⊙), (Planets: 0.01, 0.005, 0.003, 0.002, 0.001, 0.0005 M⊙).

The four tracks at the top of Figure 1 are for objects massive enough to be stars, so their effective temperature eventually stabilises to a near constant value. However, for brown dwarfs the effective temperature continues to decrease with increasing age. It can be seen from this diagram that a determination of effective temperature alone is not sufficient to determine whether an object is a star or a brown dwarf. An object with T eff = 2 200 K, for example, can be a young brown dwarf or an older star.
This age-mass degeneracy complicated the early observational search for brown dwarfs, and while several candidates were found (e.g. GD165b Becklin & Zuckerman Reference Becklin and Zuckerman1988) it was not possible to confirm them as brown dwarfs. That changed in 1995 with the discovery of Gl 229b (Nakajima et al. Reference Nakajima, Oppenheimer, Kulkarni, Golinowski, Matthews and Durrance1995; Oppenheimer et al. Reference Oppenheimer, Kulkarni, Matthews and Nakajima1995), an object sufficiently cool to be unambiguosly a brown dwarf, and with the use of the lithium test to confirm the brown dwarf nature of several objects in the Pleiades cluster (Rebolo, Zapatero-Osorio, & Martin Reference Rebolo, Zapatero-Osorio and Martin1995; Rebolo et al. Reference Rebolo, Martín, Basri, Marcy and Zapatero-Osorio1996; Basri, Marcy, & Graham Reference Basri, Marcy and Graham1996). The lithium test (Rebolo, Martín, & Magazzu Reference Rebolo, Martín and Magazzu1992) relies on the fact that lithium is destroyed by nuclear reactions down to masses just below the hydrogen burning limit. Since cool dwarfs are fully convective, lithium would be removed from the photosphere if these reactions occurred. Hence the presence of lithium in the spectrum can be used to confirm that an object is a brown dwarf.
The deuterium burning mass limit which is at about 13 M J or 0.0125 M⊙ (Saumon et al. Reference Saumon, Hubbard, Burrows, Guillot, Lunine and Chabrier1996; Burrows et al. Reference Burrows1997; Chabrier et al. Reference Chabrier, Baraffe, Allard and Hauschildt2000b) is usually considered to be the lower mass limit for brown dwarfs. Objects below this mass limit that orbit stars are generally agreed to be designated as planets. There is less consensus on how to refer to object below this mass limit that do not orbit a star. While these are sometimes referred to as ‘free-floating planets’ (Lucas & Roche Reference Lucas and Roche2000; Delorme et al. Reference Delorme2012) it has also been argued that such objects should not be referred to as planets but as ‘sub-brown dwarfs’ or some other designation (see Boss et al. Reference Boss, Basri, Kumar, Liebert, Martin, Reipurth and Zinnecker2003; Basri & Brown Reference Basri and Brown2006, for a discussion of the issues involved in this controversy).
The electron degeneracy in the cores of brown dwarfs results in their radius varying little with mass as can be seen in Figure 2. All brown dwarfs (except at very young ages) have radii not far from 0.1 R⊙ or about 1 Jupiter radius. A consequence of this is that surface gravity (g = GM/R 2) varies with mass from more than 1 000 m s−2 (log g = 5 in cgs units) to around 30 m s−2 for Jupiter mass objects as shown in the lower panel of Figure 2.
Radius and surface gravity (log g in cgs units) as function of mass for the models of Baraffe et al. (Reference Baraffe, Chabrier, Barman, Allard and Hauschildt2003) at ages of 1 Gyr, 5 GYr and 10 Gyr.

Brown dwarfs are objects whose atmospheric composition is dominated by molecular gas, as opposed to atoms and ions in the case of hotter stars. This is apparent from Figure 3 which shows the chemical equilibrium composition of a solar composition gas (using the abundances of Grevesse, Asplund & Sauval Reference Grevesse, Asplund and Sauval2007). It shows the division of the material by mass fraction into ions, atoms, gas-phase molecules and solid or liquid condensates as calculated by the chemical model of Bailey & Kedziora-Chudczer (Reference Bailey and Kedziora-Chudczer2012). It can be seen that molecules become dominant over atoms for temperatures below about 3 500 K. Helium and other noble gases persist as atoms at all temperatures, but other elements are mostly in the form of molecules. Below about 2 000 K condensed phases start to appear, and become a significant fraction of the material. At lower pressures, as shown in the lower panel, the pattern is similar but shifted to lower temperatures.
Equilibrium composition of a gas with solar elemental abundances as a function of temperature at two different pressures using the chemical model of Bailey & Kedziora-Chudczer (Reference Bailey and Kedziora-Chudczer2012).

The number of ultracool dwarfsFootnote 1 has increased rapidly over the years since the recognition of the first brown dwarfs in 1995. Most of the objects have come from deep surveys such as the Sloan Digital Sky Survey (SDSS — Fan et al Reference Fan2000; Hawley et al. Reference Hawley2002) and the Canada-France Brown Dwarfs Survey (CFBDS — Delorme et al. Reference Delorme2008a; Albert et al. Reference Albert, Artigau, Delorme, Reylé, Forveille, Delfosse and Willott2011) and particularly from infrared surveys such as the Deep Near-Infrared Sky Survey (DENIS — Delfosse et al. Reference Delfosse1997; Martín, Delfosse, & Guieu Reference Martín, Delfosse and Guieu2004), the 2 Micron All Sky Survey (2MASS — Kirkpatrick et al. Reference Kirkpatrick2000; Burgasser et al. Reference Burgasser2002, Reference Burgasser, McElwain, Kirkpatrick, Cruz, Tinney and Reid2004), and the UKIRT Infrared Deep Sky Survey (UKIDSS — Pinfield et al. Reference Pinfield2008; Burningham et al. Reference Burningham2010, Reference Burningham2013).
The most recent additions have come from the Wide-field Infrared Survey Explorer (WISE — Wright et al. Reference Wright2010). This Earth orbiting NASA mission surveyed the entire sky at four wavelengths (3.4, 4.6, 12 and 22 μm). The first of these wavelengths probes a deep CH4 absorption band in brown dwarfs. WISE has proved effective in identifying the coolest brown dwarfs. It has led to the discovery of many T dwarfs (Kirkpatrick et al. Reference Kirkpatrick2011; Mace et al. Reference Mace2013) and to the first Y dwarfs (Cushing et al. Reference Cushing2011; Kirkpatrick et al. Reference Kirkpatrick2012; Tinney et al. Reference Tinney, Faherty, Kirkpatrick, Wright, Gelino, Cushing, Griffith and Salter2012).
Other recent discoveries from WISE are that of a binary brown dwarf (Luhman Reference Luhman2013) and an extremely cool brown dwarf (Luhman Reference Luhman2014) both at distances of around 2pc. WISE J104915.57 − 531906.1 (also known as Luhman 16) consists of an L7.5–L8 primary and T0.5–T1.5 secondary (Burgasser, Sheppard, & Luhman Reference Burgasser, Sheppard and Luhman2013; Kniazev et al. Reference Kniazev2013). Its brightness and proximity are likely to make it an important object for future detailed studies. WISE J088510.83 − 071442.5 (Luhman Reference Luhman2014) appears to be the coldest brown dwarf known based on its absolute magnitude and colours. These two systems are the closest brown dwarf systems, and the third and fourth closest systems to the Earth (after the α Centauri system and Barnard’s star).
2.2 Brown dwarf spectral sequence
The study of brown dwarfs has led to a significant extension of the traditional spectral sequence from O-M that was adopted more than 100 years ago (Cannon & Pickering Reference Cannon and Pickering1901). Objects such as GD 165B and Gl 229B clearly had quite different spectra and were cooler objects than any M dwarfs. This was recognised by the adoption of the new spectral classes L and T. The motivation for this and the reasons for the choice of those letters are described by Kirkpatrick et al. (Reference Kirkpatrick1999). The sequence has been further extended by the recent recognition of even cooler objects that have been assigned to the new spectral class Y (Cushing et al. Reference Cushing2011).
Figure 4 shows the main features of the spectral sequence from M9 to T7.5 with the main absorbing species indicated.
Spectra of ultracool dwarfs from M9 to T7.5. The species responsible for the main absorption features are indicated. Spectral data is from Burgasser et al. (Reference Burgasser, Kirkpatrick, Liebert and Burrows2003), Cushing, Rayner, & Vacca (Reference Cushing, Rayner and Vacca2005), Geballe et al. (Reference Geballe, Saumon, Leggett, Knapp, Marley and Lodders2001), Geballe et al. (Reference Geballe2002), Leggett et al. (Reference Leggett2000), Leggett et al. (Reference Leggett, Allard, Geballe, Hauschildt and Schweitzer2001), Leggett et al. (Reference Leggett2002), Rayner, Cushing, & Vacca (Reference Rayner, Cushing and Vacca2009), Ruiz, Leggett, & Allard (Reference Ruiz, Leggett and Allard1997)

2.2.1 M dwarfs
The M spectral classification has been recognised from the early days of astronomical spectroscopy. While most M dwarfs are stars, young objects of late M spectral types can be brown dwarfs (as shown in Figure 1). The modern classification scheme for M-dwarfs is based on that of Boeshaar (Reference Boeshaar1976) extended by Boeshaar & Tyson (Reference Boeshaar and Tyson1985) and Kirkpatrick, Henry & McCarthy (Reference Kirkpatrick, Henry and McCarthy1991) to spectral type M9.5. The Kirkpatrick et al. (Reference Kirkpatrick, Henry and McCarthy1991) spectral classification is based on the spectral region from 630–900 nm. The spectral standards chosen for late M types are listed in Table 1.
Mean properties and spectral standards for late M to Y dwarfs

References. First reference is to adoption of the spectral standard, and the second reference is to the source of the mean absolute magitudes.
1. Kirkpatrick et al. (Reference Kirkpatrick, Henry and McCarthy1991), 2. Kirkpatrick et al. (Reference Kirkpatrick1999), 3. Kirkpatrick et al. (Reference Kirkpatrick2010) 4. Burgasser et al. (Reference Burgasser, Geballe, Leggett, Kirkpatrick and Golimowski2006a), 5. Cushing et al. (Reference Cushing2011), 6. Kirkpatrick et al. (Reference Kirkpatrick2012), 7. Dupuy & Liu (Reference Dupuy and Liu2012), 8. Dupuy & Kraus (Reference Dupuy and Kraus2013)
Notes.
Mean effective temperatures are from the data of Figure 6. Spectral standards are those adopted for optical classification up to spectral class L8, and for near-IR classification for L9 and later. Near-IR spectral standards for earlier types can be found in Kirkpatrick et al. (Reference Kirkpatrick2010). Spectral data is available for download for most of these objects (and other late-type dwarfs) at:
SpeX Prism Spectral Libraries (A. Burgasser)
IRTF Spectral library (M.R. Cushing)
L and T dwarf data archive (S.K. Leggett)
NIRSPEC Brown Dwarf Spectroscopic Survey (I.S. McLean)
Keck LRIS specra of late-M, L and T dwarfs (I.N. Reid)
The M spectral class is characterised by the presence of bands of TiO and VO. TiO bands increase in strength up to spectral type M6, and VO becomes strong in the latest types.
In the near infrared (near-IR) M dwarfs show broad absorptions due to H2O centred around 1.4 and 1.9 μm increasing in strength with later spectral types. Late M dwarfs also show Na I and K I absorptions in the 1.15–1.25 μm region. FeH absorption is present in the Wing-Ford band at 1 μm as well as the E-A band in the 1.6 μm region (Hargreaves et al. Reference Hargreaves, Hinkle, Bauschlicher, Wende, Seifahrt and Bernath2010). CO absorption is present at 2.3 μm.
2.2.2 L dwarfs
The L dwarf class is disinguished by the weakening and disappearance of the TiO and VO bands that are distinctive of M dwarfs. TiO has disappeared by L6 and VO by L4. A classification scheme for L dwarfs based on the optical spectral region (630–1000 nm) is described by Kirkpatrick et al. (Reference Kirkpatrick1999). It lists spectral standards for classes L0 to L8 (see Table 1) and classification is based on the weakening TiO and VO bands, changes in CrH and FeH bands (CrH is strongest at L5) and the alkali metals, with Cs I and Rb I lines increasing in strength to later types.
Spectral classification of L dwarfs in the near-IR is discussed by Reid et al. (Reference Reid, Burgasser, Cruz, Kirkpatrick and Gizis2001), Geballe et al. (Reference Geballe2002) and Nakajima, Tsuji, & Yanagisawa (Reference Nakajima, Tsuji and Yanagisawa2004). Kirkpatrick et al. (Reference Kirkpatrick2010) defined a set of spectral standards for the near-IR for spectral types M0 – L9. The near-IR region shows broad absorption bands of H2O increasing in strength towards later spectral types.
While methane in the 1–2.5 μm region is not seen until spectral type T, the stronger methane ν3 band in the 3.3 μm region is observable in late L dwarfs (Noll et al. Reference Noll, Geballe, Leggett and Marley2000; Schweitzer et al. Reference Schweitzer, Gizis, Hauschildt, Allard, Howard and Kirkpatrick2002; Stephens et al. Reference Stephens2009).
The physical basis for the M-L transition is thought to be the formation of condensates. At temperatures just below 2000 K the condensation of Ti bearing species such as CaTiO3 (perskovite) and Ti2O3 removes TiO from the gas phase, and at slightly lower temperatures VO condenses as solid VO (Burrows & Sharp Reference Burrows and Sharp1999; Lodders Reference Lodders2002). Species such as enstatite (MgSiO3), forsterite (Mg2SiO4), spinel (MgAl2O4) and solid iron also condense and these produce the dust clouds that are necessary to explain the spectra and colours of L dwarfs (Allard et al. Reference Allard, Hauschildt, Alexander, Tamanai and Schweitzer2001; Marley et al. Reference Marley, Seager, Saumon, Lodders, Ackerman, Freedman and Fan2002; Tsuji Reference Tsuji2002)
2.2.3 T dwarfs
The T dwarf class is characterised by the appearance of methane (CH4) absorption features in the near-IR region (1–2.5 μm) . Methane first becomes apparent in early T dwarfs due to features at 1.67 and 2.2 μm which represent the Q-branches of the strongest methane bands 2ν3 at 1.67 μm and ν2 + ν3 at 2.2 μm. This is accompanied by weakening of the CO absorption at 2.3 μm.
At later types broad methane absorptions develop due to the complex methane band systems, the octad (8 ground-state bands in the 2.1–2.4 μm region; Hilico et al. Reference Hilico, Robert, Loete, Tuomi, Pine and Brown2001) and the tetradecad (14 ground-state bands in the 1.6–2.0 μm region; Nikitin et al. Reference Nikitin, Boudon, Wenger, Albert, Brown, Baurecker and Quack2013a). These ground-state bands are associated with large numbers of hot bands. Methane absorption is also present at around 1.4 μm (the icosad – 20 ground-state bands) and 1.15 μm (the triacontad – 30 ground-state bands). Bailey, Ahlsved, & Meadows (Reference Bailey, Ahlsved and Meadows2011) provides a more detailed description of the methane spectrum.
In late T dwarfs the broad CH4 and H2O absorptions deepen and combine to leave a spectrum defined by approximately triangular peaks at 1.08 μm, 1.27 μm and 1.58 μ (the ‘windows’ between the deep absorptions), as well as a weaker peak at about 2.1 μm. T dwarf spectra are also shaped by the collision-induced absorption due to H2 – H2 pairs (Borysow Reference Borysow2002; Abel et al. Reference Abel, Frommhold, Li and Hunt2011) which depresses the 2 μm peak, and by the far wings of very strong Na I and K I lines in the optical (Burrows & Volobuyev Reference Burrows and Volobuyev2003; Allard et al. Reference Allard, Allard, Hauschildt, Kielkopf and Machin2003) which absorb at wavelengths up to ~ 1 μm.
Classification schemes for T dwarfs based on near-IR spectra, were developed by Burgasser et al. (Reference Burgasser2002) and Geballe et al. (Reference Geballe2002) and the two schemes were unified in Burgasser et al. (Reference Burgasser, Geballe, Leggett, Kirkpatrick and Golimowski2006a). That work gives a set of spectral standards for T0–T8 (see Table 1). The main features used for classification are the increasing depths of the H2O and CH4 bands towards later classes. A parallel optical classification scheme based on the 630–1010 nm region is described by Burgasser et al. (Reference Burgasser, Kirkpatrick, Liebert and Burrows2003) and is based on some of the same spectral standards used in the near-IR.
The transition from L to T is associated with the switch in chemical equlibirum between CO and CH4 (Lodders Reference Lodders2002; Burrows & Sharp Reference Burrows and Sharp1999) that occurs at about 1400 K at 1 bar pressure, with CO being more stable above this temperature, and CH4 being favoured at lower temperatures. However, the transition is also associated with a clearing of the dust clouds that are important in L dwarfs (Allard et al. Reference Allard, Hauschildt, Alexander, Tamanai and Schweitzer2001; Burgasser et al. Reference Burgasser2002).
2.2.4 Y dwarfs
The possible existence of objects even cooler than the T dwarfs was investigated in models by Burrows, Sudarsky, & Lunine (Reference Burrows, Sudarsky and Lunine2003). Among the features suggested as marking the transition to a new spectral class, were the appearance of NH3 absorption, the condensation of H2O clouds, and the development of redder near-IR colours reversing the trend in T dwarfs. A number of of very cool dwarfs were found in the CFBDS and UKIDSS surveys (Warren et al. Reference Warren2007; Delorme et al. Reference Delorme2008b; Burningham et al. Reference Burningham2008). Lucas et al. (Reference Lucas2010) reported the discovery of an even cooler object UGPS 0722 − 05 which they suggested should be classified as T10, and could in the future be regarded as the first example of a new spectral type.
In 2011, Cushing et al. (Reference Cushing2011) reported the ‘Discovery of Y-dwarfs’. Several objects identified using the WISE satellite were found to be of later spectral types than UGPS 0722 − 05. They reclassified UGPS 0722 − 05 as the T9 spectral standard, and classified six new objects as Y dwarfs with WISE 1738+27 as the Y0 standard. Kirkpatrick et al. (Reference Kirkpatrick2012) report several more Y dwarfs and added a spectral standard for the Y1 class (see Table 1). Other reported Y dwarfs are WISE J1639 − 68 (Tinney et al. Reference Tinney, Faherty, Kirkpatrick, Wright, Gelino, Cushing, Griffith and Salter2012) and the white dwarf companion WD 0806 − 661 B (Luhman, Burgasser, & Bochanski Reference Luhman, Burgasser and Bochanski2011; Luhman et al. Reference Luhman, Burgasser, Labbé, Saumon, Marley, Bochanski, Monson and Pearson2012). The high proper motion object WISE J085 510.83 − 071 442.5 (Luhman Reference Luhman2014) has absolute magnitude and colours suggesting it is the coolest known Y dwarf with an effective temperature of 225 – 260 K.
All Y dwarfs are very faint objects (J mag of 19 or fainter) and so the quality of available spectra are limited. They resemble the late T dwarfs, but the ‘window’ features (particularly that at 1.27 μm) become increasingly narrow with later spectral types. The NH3 absorptions expected at ~ 1.53 and ~ 1.03 μm are not seen at the levels predicted by equilibrium chemistry (Leggett et al. Reference Leggett, Morley, Marley, Saumon, Fortney and Visscher2013).
2.3 Photometry
Photometric data on ultracool dwarfs in the near-IR is available for a large number of objects. The database of L, T and Y dwarfs at DwarfArchives.org, for example, lists 1 281 objects most of which have JHK magnitudes. When interpreting photometric data at JHK it is important to note that there are several different JHK systems in use. In particular the 2MASS (Carpenter Reference Carpenter2001) and MKO (Simons & Tokunaga Reference Simons and Tokunaga2002) systems are both widely used in brown dwarf research. The 2MASS system uses a significantly shorter wavelength and narrower K s band compared to the K band of the MKO system. Transformations between the systems derived from data on stars (Carpenter Reference Carpenter2001) are unlikely to be valid for the unusual energy distributions seen particularly in the T dwarfs. Stephens & Leggett (Reference Stephens and Leggett2004) provide a set of transformations between photometric systems specifically for L and T dwarfs that can be used if the spectral type is known.
Much of the energy in ultracool dwarfs is in the mid infrared, and photometry for these wavelengths has become increasingly available from Spitzer/IRAC (Patten et al. Reference Patten2006; Leggett et al. Reference Leggett, Saumon, Marley, Geballe, Golimowski, Stephens and Fan2007, Reference Leggett2010) and the WISE all sky catalog (Wright et al. Reference Wright2010).
These objects are relatively nearby and so parallax measurements of good quality are generally feasible allowing absolute magnitudes to be derived. Conventional CCD parallax methods can be used for the earlier type objects (e.g. Dahn et al. Reference Dahn2002; Vrba et al. Reference Vrba2004; Andrei et al. Reference Andrei2011). Infrared parallaxes can be measured for the latest type objects (Tinney, Burgasser, & Kirkpatrick Reference Tinney, Burgasser and Kirkpatrick2003; Dupuy & Liu Reference Dupuy and Liu2012; Marsh et al. Reference Marsh, Wright, Kirkpatrick, Gelino, Cushing, Griffith, Skrutskie and Eisenhardt2013). The recent compilation by Dupuy & Liu (Reference Dupuy and Liu2012) includes absolute magnitudes in the near and mid infrared for 314 objects with known parallaxes. Mean absolute magnitudes from this compilation in the MKO JHK systems are given in Table 1 supplemented by those of Dupuy & Kraus (Reference Dupuy and Kraus2013) for the latest spectral types.
Figure 5 shows the J − K against M K colour magnitude diagram for M to Y dwarfs. A distinctive feature of the diagram is the behaviour at the L/T transition. Generally the J − K colour becomes slowly redder with later spectral types through M and L, but then rapidly turn bluer through the early T spectral types. The limited photometry available for Y dwarfs suggests a turn back to redder colours.
Colour magnitude diagram (J − K against M K ) for late type dwarfs. Most of the data is taken from Dupuy & Liu (Reference Dupuy and Liu2012). Data on late T and Y dwarfs is from Dupuy & Kraus (Reference Dupuy and Kraus2013) and has been roughly converted to the 2MASS system according to Stephens & Leggett (Reference Stephens and Leggett2004). Additional data on earlier type M dwarfs has been added from the compilation of Reid (http://www.stsci.edu/~lnr/cmd.html) based on photometry from Leggett (Reference Leggett1992) and converted to the 2MASS system using relations in Carpenter (Reference Carpenter2001).

In the J band a significant brightening with later spectral type can be seen (Dahn et al. Reference Dahn2002; Tinney, Burgasser, & Kirkpatrick Reference Tinney, Burgasser and Kirkpatrick2003). In the mean data of Table 1 it can be seen that types L9 to T2 are all brighter at J than L6 and L7. Tsuji & Nakajima (Reference Tsuji and Nakajima2003) suggested that this may be an artifact of observing objects with different masses and ages, and not a feature seen in a single cooling track. Studies of binary brown dwarfs whose components straddle the L/T boundary, however, show ‘flux reversals’ where the cooler component is brighter in the 1 – 1.3 μm region (Burgasser et al. Reference Burgasser, Kirkpatrick, Cruz, Reid, Leggett, Liebert, Burrows and Brown2006b; Liu et al. Reference Liu, Leggett, Golimowski, Chiu, Fan, Geballe, Schneider and Brinkmann2006; Looper et al. Reference Looper, Gelino, Burgasser and Kirkpatrick2008) showing that the effect is a real intrinsic features of the L/T transition.
2.4 Effective temperatures
The effective temperature of ultracool dwarfs can be determined by two main methods. The first way is to use photometry and parallax measurements to determine the bolometric luminosity. A temperature can then be derived if the radius is known. We don’t have direct radius measurements for most of these objects, but as shown in Figure 2, models predict that the radius of brown dwarfs varies little with mass and age, so model based radius constraints can be used to determine effective temperature.
The other way to determine effective temperatures is to fit observed spectra to those predicted by model atmospheres. This is likely to be most reliable if the observations cover a large wavelength range that includes a substantial fraction of the luminosity, and for brown dwarfs this means including the mid-IR as well as the near-IR (e.g. Stephens et al. Reference Stephens2009).
Figure 6 is a compilation of effective temperature measurements from the literature using both of these methods. It shows reasonable agreement betwee the various determinations. A feature of this diagram is that, while the general trend is decreasing temperature with later spectral type, the temperature actually changes little over the L/T transition from about L6 to T4. This suggests that the spectral changes seen over this range are due to the clearing of dust rather than to the direct effect of changing temperatures.
Effective temperatures plotted against spectral type. The effective temperatures are determined from bolometric luminosities (Vrba et al. Reference Vrba2004; Golimowski et al. Reference Golimowski2004; Nakajima, Tsuji, & Yanagisawa Reference Nakajima, Tsuji and Yanagisawa2004; Dupuy & Kraus Reference Dupuy and Kraus2013) or from fitting models to observed spectra (Stephens et al. Reference Stephens2009; Leggett et al. Reference Leggett and Johns-Krull2011; Cushing et al. Reference Cushing2011; Sorahana & Yamamura Reference Sorahana and Yamamura2012; Rajpurohit et al. Reference Rajpurohit, Reylé, Allard, Homeier, Schultheis, Bessell and Robin2013). Optical spectral types are used up to L8, and infrared spectral types for L9 and later. Late T and Y dwarf spectral types are from Kirkpatrick et al. (Reference Kirkpatrick2012). Spectral types are shown with error bars of ± 0.5 subtypes. Mean values are given for spectral types that had more than 3 measurements. Where no error estimate was given in the original publication an error bar of ± 100 K has been shown.

The mean effective temperatures for each spectral type from the data of Figure 6 have been included in Table 1.
The L/T transition shows up particularly clearly when the near-IR colours and spectral types are plotted against effective temperature using the mean values given in Table 1. The J − K and J − H colours and the spectral type all vary dramatically over the effective temperature range from 1200–1500 K, and show much less variability at other temperatures as shown in Figure 7. The changes are thought to be mostly due to the disappearance of dust clouds as the atmospheres cool, but it is not clear why this should appear as such a sharp transition. Cloud models (to be described in Section 4.4 — the red and blue lines) show much more gradual changes than those observed.
The L/T Transition. Over the small range of effective temperature from 1200–1500 K the observed colours and spectral types of ultracool dwarfs (black) vary through a large range. Models (red and blue lines, see section 4.4) show much more gradual changes. The data for this plot are that of Table 1. Model results are from the BT-Settl models (Allard et al. Reference Allard, Allard, Homeier, Kielkopf, McCaughrean and Spiegelman2007, Reference Allard, Homeier, Freytag and Sharp2012) for log g = 5 (solid red line) and for a 3 Gyr isochrone (red dashed line), and the Unified Cloudy Model (Tsuji Reference Tsuji2002, Reference Tsuji2005) for log g = 5 and T cr = 1800 K (blue line).

2.5 Variability
Variability has been reported in a number of L dwarfs (Clarke, Tinney, & Covey Reference Clarke, Tinney and Covey2002; Koen Reference Koen2006; Lane et al. Reference Lane2007; Heinze et al. Reference Heinze2013). The amplitudes are typically ~ 1% and the variations are quasi-periodic with periods of a few hours. The variability is generally attributed to rotational modulation either due to patchy clouds, or magnetic spots.
Two early T dwarfs have been observed to show larger amplitude variability (Artigau et al. Reference Artigau, Bouchard, Doyon and Lafrenière2009; Radigan et al. Reference Radigan, Jayawardhana, Lafreniere, Artigau, Marley and Saumon2012). In the case of the T2.5 dwarf 2MASS 2139+02 an amplitude of up to 26% was observed with a period of 7.72 hours. The large amplitude in these early T objects is suggested to be indicative of patchy cloud regions arising during the clearing of clouds associated with the L/T transition as suggested by Marley, Saumon, & Goldblatt (Reference Marley, Saumon and Goldblatt2010). A further example reported recently (Gillon et al. Reference Gillon, Triaud, Jehin, Delrez, Opitom, Magain, Lendl and Queloz2013) is variability in the cooler component of the 2 pc binary brown dwarf WISE J1049 − 53 (Luhman 16).
Buenzli et al. (Reference Buenzli2012) have reported Spitzer and HST observations of variability with a 1.4 hr period in the T6.5 dwarf 2MASS 2228 − 43, confirming a ground-based detection of this period by Clarke et al. (Reference Clarke, Hodgkin, Oppenheimer, Robertson and Haubois2008). They find phase shifts between variations at different wavelengths which can provide a probe of the vertical atmospheric structure.
Recently Crossfield et al. (Reference Crossfield2014) have used time resolved near-infrared spectroscopy around the rotation period to derive a global 2D map of the brighteness distribution of Luhman 16B using Doppler imaging techniques. The map reveals structure that may be due to patchy clouds.
3 EXOPLANETS
3.1 History and properties
Since the discovery of the first planets orbiting normal stars (Mayor & Queloz Reference Mayor and Queloz1995; Marcy et al. Reference Marcy, Butler, Williams, Bildsten, Graham, Ghez and Jernigan1997) the rate of discovery has steadily increased to more than 1 800 confirmed planets according to The Extrasolar Planets Encyclopedia (exoplanet.eu — Schneider et al Reference Schneider, Dedieu, Le Sidaner, Savalle and Zolotukhin2011) as at July 2014. In addition more than 3 000 planet candidates have now been found by the Kepler mission (Batalha et al. Reference Batalha2013). The latter are not yet confirmed planets, but it is estimated that the false positive rate for Kepler planet candidates is likely to be ~ 10% (Morton & Johnson Reference Morton and Johnson2011; Fressin et al. Reference Fressin2013).
While there are a large number of planets, observations of their atmospheres are much more difficult than for the brown dwarfs just considered. The vast majority of planet detections and observations are by indirect methods, such as radial velocity measurements of the host star, and transit measurements. These provide information on the orbit, mass and radius (for transitting planets). However, apart from a small number of directly imaged planets, we don’t yet have the capability to resolve planets from their stars in order to measure their spectra. At present most of our data on the spectra of exoplanets comes from analysis of unresolved planets that require extracting signals that are a small fraction of that from the host star.
A recent review of exoplanet detection methods is given by Wright & Gaudi (Reference Wright, Gaudi, Oswalt, French and Kalas2013). All methods currently used are subject to biases. The radial velocity (RV) technique that has been used for the majority of exoplanet discoveries favours the detection of massive planets and short period orbits. The majority of RV detected planets are therefore giant planets, but at short periods this method can detect planets down to a few Earth masses. When corrections are made for incompleteness the statistics show that planet frequency increases for decreasing mass (Howard et al. Reference Howard2010; Wittenmyer et al. Reference Wittenmyer, Tinney, Butler, O’Toole, Jones, Carter, Bailey and Horner2011). This is consistent with the increasing planet frequency at small sizes shown by analysis of the Kepler planet candidates (Howard et al. Reference Howard2012). Ground-based transit searches (e.g. Bakos et al. Reference Bakos, Noyes, Kovács, Stanek, Sasselov and Domsa2004; Pollacco et al. Reference Pollacco2006) are strongly biased toward finding large short period planets (i.e. hot Jupiters).
Our current ability to characterise exoplanet atmospheres is largely limited limited to giant planets and to planets with high temperatures (T > ~ 1 000 K). In most cases these are hot Jupiters, i.e. massive planets that are hot because they are close to their star, or are directly imaged massive planets that are hot because they are young planets still cooling. There are a few cases of lower mass planets, for example Neptune/Uranus mass planets such as GJ 3470b and GJ 436b and two examples of transiting super-Earths, GJ 1214b (Charbonneau et al. Reference Charbonneau2009) and HD 97658b for which characterisation observations have been made.
3.2 Solar system giant planets
We do, however, know of several giant planets that have been studied in considerable detail, the giant planets in our own Solar system. It is useful to briefly review their properties. All the giant planets have atmospheres composed of hydrogen and helium and are enriched in heavy elements with respect to the solar composition. In the case of Jupiter measurements with the Galileo probe show C, N, S, Ar, Kr, and Xe enriched by factors of 2 to 4 relative to solar abundances (Owen et al. Reference Owen, Mahaffy, Niemann, Atreya, Donahue, Bar-Nun and de Pater1999; Wong et al. Reference Wong, Mahaffy, Atreya, Niemann and Owen2004). Carbon is enriched relative to its solar value by 7 times in Saturn (Flasar et al. Reference Flasar2005) and by 30–40 times in Uranus and Neptune (Lodders & Fegley Reference Lodders and Fegley1994).
All the Solar system giant planet atmospheres have directly measured temperature structures from radio occultation measurements (Lindal Reference Lindal1992), and from the Galileo probe (Seiff et al. Reference Seiff1998) in the case of Jupiter (see Figure 8). All the planets have clouds with the main cloud deck at about 0.75 bar in Jupiter (Banfield et al. Reference Banfield, Gierasch, Bell, Ustinov, Ingersoll, Vasavada, West and Belton1998; Kedziora-Chudczer & Bailey Reference Kedziora-Chudczer and Bailey2011), 2.5 bar in Saturn (Fletcher et al. Reference Flectcher, Baines, Momary, Showman, Irwin, Orton, Roos-Serote and Merlet2011) and ~ 2 bar in Uranus and Neptune (Irwin, Teanby, & Davis Reference Irwin, Teanby and Davis2010).
Temperature profiles of the Solar system giant planet atmospheres from Voyager radio occultation measurements (Lindal Reference Lindal1992), and from the Galileo probe for Jupiter (dashed line – Seiff et al. Reference Seiff1998).

Near-IR spectra of the giant planets are shown in Figure 9. All of these are dominated by absorption band systems due to methane (CH4) centred around 1.15, 1.4, 1.7 and 2.3 μm, and are bright in the window regions between these absorptions. In this respect the spectra resemble those of late T dwarfs, and the T9 dwarf UGPS 0722-05 is shown in Figure 9 for comparison. Jupiter also show absorption due to NH3 at around 1.55 μm. All the planets also show collision induced absorption due to H2 – H2 pairs, which at these low temperatures shows up as a distinctive broad feature at around 2.12 μm. This depresses the brightness in the methane window that would otherwise be present at around 2 μm, and makes all the planets quite faint in the K-band compared with the J and H bands.
Near-IR reflected light spectra of the Solar system giant planets Jupiter, Saturn, Uranus and Neptune (plotted as radiance factor I/F). The data are from IRIS2 on the Anglo-Australian Telescope as described by Kedziora-Chudczer & Bailey (Reference Kedziora-Chudczer and Bailey2011). The red curves show the weak K-band spectra of Jupiter and Saturn scaled up by factors of 10 and 20. The spectrum of the T9 dwarf UGPS 0722-05 is shown for comparison using data from Bochanski et al. (Reference Bochanski, Burgasser, Simcoe and West2011).

Other species present in the atmospheres at trace levels and detected in longer wavelength spectra include PH3 and AsH3 in Jupiter and Saturn (Fletcher et al. Reference Flectcher, Baines, Momary, Showman, Irwin, Orton, Roos-Serote and Merlet2011), and hydrocarbons such as C2H2 and C2H6 in the stratospheres (Hesman et al. Reference Hesman2009; Greathouse et al. Reference Greathouse, Richter, Lacy, Moses, Orton, Encrenaz, Hammel and Jaffe2011).
3.3 Observing exoplanet atmospheres
3.3.1 Direct spectroscopy of resolved planets
A number of ‘planets’ have been discovered through direct imaging of young objects using ground-based adaptive optics or the Hubble Space Telescope. These include the companion of the brown dwarf 2MASSW J1207 334 − 393 254 (usually referred to as 2M 1207b — Chauvin et al. Reference Chauvin, Lagrange, Dumas, Zuckerman, Mouillet, Song, Beuzit and Lawrence2005), and the four planets of HR 8799 (Marois et al. Reference Marois, Macintosh, Barman, Zuckerman, Song, Patience, Lafreniere and Doyon2008, Reference Marois, Zuckerman, Konopacky, Macintosh and Barman2010).
The classification of some of these objects as planets is controversial. Although 2M 1207b was announced as the first directly imaged extrasolar planet by its discoverers, it can be argued that it is not a planet because it orbits a brown dwarf, not a star, or because it is unlikely that it formed through the normally understood planet formation process from a disk around its primary object (Soter Reference Soter2006). 2M 1207b is usually referred to as a ‘planetary mass object’ in recent literature.
The classification of such objects as planets also depends on the masses determined by application of evolutionary models, and this critically depends on the age. Marois et al. (Reference Marois, Zuckerman, Konopacky, Macintosh and Barman2010) use age ranges from 20 – 160 Myr for HR8799 to derive masses for the planets in the range 5 – 13 M Jup placing them most likely below the deuterium burning limit. However, an age as high as ~ 1 Gyr is suggested by asteroseismology methods (Moya et al. Reference Moya, Amado, Barrado, Hernández, Aberasturi, Montesinos and Aceituno2010) which would make the objects brown dwarfs rather than planets. A number of recent studies based on dynamics (Moro-Martín, Rieke, & Su Reference Moro-Martín, Reike and Su2010; Sudol & Haghighipour Reference Sudol and Haghighipour2012) and a direct radius determination for HR 8799 (Baines et al. Reference Baines2012) favour a young age and planetary masses for the companions.
Near-IR spectra have been obtained for 2M 1207b (Mohanty et al. Reference Mohanty, Jayawardhana, Huélamo and Mamajek2007; Patience et al. Reference Patience, King, de Rosa and Marois2010), the HR 8799 planets (Bowler et al. Reference Bowler, Liu, Dupuy and Cushing2010; Barman et al. Reference Barman, Macintosh, Konopacky and Marois2011a; Oppenheimer et al. Reference Oppenheimer2013; Konopacky et al. Reference Konopacky, Barman, Macintosh and Marois2013) and β Pic b (Chilcote et al. Reference Chilcote2014). Spectra of 2M 1207b and HR 8799 b and c are shown in Figure 10. The spectra show the CO bandhead at 2.3 μm, and H2O absorption at 1.4 and 1.9 μm (deepest in HR 8799b). CH4 absorption is either absent or possibly weakly present in HR 8799b. The spectral features are similar to those of mid to late L dwarfs, which would imply objects of Teff ~ 1400–1600 K.
Spectra of the direct imaged planets (or planetary mass objects) 2M 1207b (Patience et al. Reference Patience, King, de Rosa and Marois2010), HR 8799b (Barman et al. Reference Barman, Macintosh, Konopacky and Marois2011a) and HR 8799c (Konopacky et al. Reference Konopacky, Barman, Macintosh and Marois2013). The CO bandhead at 2.3 μm is apparent in all three objects as well as H2O absorption at ~ 1.9 and ~ 1.4 μm.

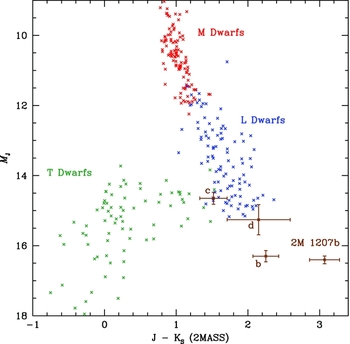
However, photometry of 2M 1207b shows it to be very red in J − K and underluminous compared with L dwarfs (Figure 11). This led Mohanty et al. (Reference Mohanty, Jayawardhana, Huélamo and Mamajek2007) to suggest that grey extinction by an edge-on disk may be the cause of the underluminosity. Photometry of HR 8799b show that it is similarly underluminous. Barman et al. (Reference Barman, Macintosh, Konopacky and Marois2011b) have shown that it is possible to model the spectrum of 2M 1207b with a cool (Teff ~ 1 000 K) model by including clouds and a departure from chemical equilibrium due to vertical mixing that inhibits the formation of methane. Similar models have been fitted to the spectra of HR 8799b (Barman et al. Reference Barman, Macintosh, Konopacky and Marois2011a) and c (Konopacky et al. Reference Konopacky, Barman, Macintosh and Marois2013).
Colour magnitude diagram for 2M 1207b and the b, c and d planets of HR 8799 (photometry from Chauvin et al. Reference Chauvin, Lagrange, Dumas, Zuckerman, Mouillet, Song, Beuzit and Lawrence2005; Marois et al. Reference Marois, Macintosh, Barman, Zuckerman, Song, Patience, Lafreniere and Doyon2008; Mohanty et al. Reference Mohanty, Jayawardhana, Huélamo and Mamajek2007) compared with field M, L and T dwarfs (from the same data sources as Figure 5).
Spectroscopy of β Pic b in the H band (Chilcote et al. Reference Chilcote2014) taken with the Gemini Planet Imager shows spectral structure indicating H2O absorption and atmospheric model fits give Teff = 1 650 ± 50 K and log g = 4.0 ± 0.25.
A detection of methane (Janson et al. Reference Janson2013) has been reported in the planetary mass companion GJ 504b (Kuzuhara Reference Kuzuhara2013). This was achieved using Spectral Differential Imaging with the HiCAIO adaptive optics camera on the Subaru telescope. The companion was found to be much fainter in the CH4 absorption band at ~ 1.7 μm than in other bands indicating a deep methane absorption comparable to that in late T dwarfs.
3.3.2 High resolution cross correlation techniques
Spectral features due to an unresolved extrasolar planet can be detected using high-resolution spectroscopy, and cross correlation techniques to pick out the faint signal due to the planet from the much brighter contribution of the host star. The technique was first used to attempt to detect the reflected light signal in high-resolution optical spectra of hot Jupiters. A possible detection of a planetary signal in τ Boo was reported (Collier Cameron et al. Reference Cameron, Horne, Penny and James1999) but was not confirmed (Charbonneau et al. Reference Charbonneau, Noyes, Korzennik, Nisenson, Jha, Vogt and Kilbrick1999; Leigh et al. Reference Leigh, Cameron, Horne, Penny and James2003a) and is inconsistent with the subsequent infrared detections by Brogi et al. (Reference Brogi, Snellen, de Kok, Albrecht, Birkby and de Mooij2012) and Rodler, Lopez-Morales, & Ribas (Reference Rodler, Lopez-Morales and Ribas2012). These studies set upper limits on the geometric albedo of τ Boo b of 0.3 at 480 nm (Charbonneau et al. Reference Charbonneau, Noyes, Korzennik, Nisenson, Jha, Vogt and Kilbrick1999) and 0.39 over 400–650 nm (Leigh et al. Reference Leigh, Cameron, Horne, Penny and James2003a). Other reflected light studies for a number of the brighter hot Jupiter systems (Collier Cameron et al. Reference Collier Cameron, Horne, Penny and Leigh2002; Leigh et al. Reference Leigh, Cameron, Udry, Donati, Horne, James and Penny2003b; Rodler, Kurster, & Henning Reference Rodler, Kurster and Henning2008, Reference Rodler, Kurster and Henning2010; Langford et al. Reference Langford, Wyithe, Turner, Jenkins, Narita, Liu, Suto and Toru2011) result in similar upper limits on geometric albedo.
Much more successful have been similar studies in the near-IR where it is possible to search for specific molecular absorption features either in the transmission spectrum during transit (Snellen et al. Reference Snellen, de Kok, de Mooij and Albrecht2010a) or in the thermal emission from the planet (which does not require a transiting planet). In these studies the telluric and stellar absorption features are removed as best as possible and the remaining signal is cross correlated with a template spectrum. The large radial velocity amplitude of the planet causes the absorption features to shift with orbital phase, so that a cross correlation peak can be searched for as a function of radial velocity amplitude (K P ) and systemic velocity (Vsys ) as shown in Figure 12 (Brogi et al. Reference Brogi, Snellen, de Kok, Albrecht, Birkby and de Mooij2012).
Carbon monoxide cross correlation signal for τ Boo b (Brogi et al. Reference Brogi, Snellen, de Kok, Albrecht, Birkby and de Mooij2012) as a function of systemic velocity (Vsys ) and radial velocity amplitude of the planet (KP ). A 6.2σ signal is seen at KP = 110 ± 3.2 km s−1 corresponding to an inclination i = 44.5° ± 1.5 and a planet mass MP = 5.95 ± 0.28MJup — Reprinted by permission from Macmillan Publishers Ltd: Nature, 486, 502–504, © (2012).

The method determines K P and thus provides a direct measurement of the planet’s mass and the orbital inclination, removing the sin i uncertainty for non-transiting planets. If the planet is transiting the results can be checked against those determined from transit analysis. The systemic velocity is also determined and should agree with that measured for the host star. Table 2 list the detections reported. For two objects (τ Boo b and HD 189733b) there are independent results from two studies that are in good agreement.
High-Resolution Cross Correlation Detections

a Transmission spectrum during transit. All others are dayside emission detections.
Most of the objects observed in this way are hot Jupiters, but essentially the same method has also been applied to the directly imaged exoplanet β Pic b (Snellen et al. Reference Snellen, Brandl, de Kok, Brogi, Birkby and Schwarz2014). In this case it was possible to detect rotational broadening of about 25 kms−1 in the CO cross correlation signal indicating a rapid rotation for the planet.
All detections so far are either for carbon monoxide or water. In HD189733b (de Kok et al. Reference de Kok, Brogi, Snellen, Birkby, Albrecht and de Mooij2013) CO2, CH4 and H2O were searched for in the 2 μm region but not detected. However, H2O was detected in HD 189733b using longer wavelength (3.2 μm) observations (Birkby et al. Reference Birkby, de Kok, Brogi, de Mooij, Schwarz, Albrecht and Snellen2013). While CO is expected to be strong feature in these planets, part of the reason it is most easily detected may be that as a diatomic molecule it has a simpler spectrum and better quality line lists. Difficulty in detecting other species may, in part, be due to errors in the template spectra due to problems with the line lists, such as errors in line positions (see discussion in Barnes et al. Reference Barnes2010) and incompleteness. Methane line lists used for atmospheric modelling are known to be missing many hot bands that are needed at the high temperatures of these objects.
3.3.3 Secondary eclipse photometry and spectroscopy
The secondary eclipse (or occultationFootnote 2 ) occurs when a planet passes behind the star. If the planet is sufficiently bright a measurable dip in the light curve is seen, and the fractional depth of the dip is a direct measurement of the flux from the planet as a fraction of that from the star. In most cases such measurements detect thermal emission from the dayside of the planet, and so contrasts are greatest at infrared wavelengths.
The first detection of a secondary eclipse was made at 24 μm for HD 209458b using the Spitzer Space Telescope (Deming et al. Reference Deming, Seager, Richardson and Harrington2005). Since then a substantial number of mostly hot Jupiter type systems have had their secondary eclipse depth measured in the Spitzer/IRAC bands (3.6 μm, 4.5 μm, 5.8 μm and 8.0 μm). There are also a number of measurements at shorter wavelengths from ground-based telescopes. The broad band eclipse depth results are summarised in Table 3. This lists secondary eclipse depths measured in the four Spitzer/IRAC bands and in the K s band (2.15 μm). Where there are multiple measurements in a band the one with the smaller quoted error is listed, but references to all measurements are given. The ‘Other’ column lists other bands in which eclipse depths have been measured and the references to these are also given.
Secondary eclipse depth broadband measurements (%)

a Value from Croll et al. (Reference Croll, Lafreniere, Loic, Jayawardhana, Fortney and Murray2011) as corrected by Crossfield et al. (Reference Crossfield, Barman, Hansen, Ichi and Kodama2012b)
b Values from Campo et al. (Reference Campo2011) as corrected by Crossfield et al. (Reference Crossfield, Barman, Hansen, Ichi and Kodama2012b)
References 1. Deming et al. (Reference Deming2011), 2. Gillon et al. (Reference Gillon2009), 3. Rogers et al. (Reference Rogers, Apai, López-Morales, Sing and Burrows2009), 4. Snellen et al. (Reference Snellen, de Mooij and Albrecht2009), 5. Deming et al. (Reference Deming2011), 6. Gillon et al. (Reference Gillon2010), 7. Snellen et al. (Reference Snellen, de Mooij and Burrows2010b), 8. Deming et al. (Reference Deming, Harrington, Laughlin, Seager, Navarro, Bowman and Horning2007), 9. Stevenson et al. (Reference Stevenson2012), 10. Charbonneau et al. (Reference Charbonneau, Knutson, Barman, Allen, Mayor, Megeath, Queloz and Udry2008), 11. Knutson et al. (Reference Knutson2012), 12. Deming et al. (Reference Deming, Harrington, Seager and Richardson2006), 13. Deming et al. (Reference Deming, Seager, Richardson and Harrington2005), 14. Knutson et al. (Reference Knutson, Charbonneau, Allen, Burrows and Megeath2008), 15. Crossfield et al. (Reference Crossfield, Knutson, Fortney, Showman, Cowan and Deming2012a), 16. Todorov et al. (Reference Todorov, Deming, Harrington, Stevenson, Bowman, Nymeyer, Fortney and Bakos2010), 17. de Mooij et al. (Reference de Mooij, de Kok, Nefs and Snellen2011), 18. Todorov et al. (Reference Todorov2013), 19. Todorov et al. (Reference Todorov2012), 20 Christiansen et al. (Reference Christiansen2010), 21. Désert et al. (Reference Désert2011a), 22. Fortney et al. (Reference Fortney2011), 23. Charbonneau et al. (Reference Charbonneau2005), 24. O’Donovan et al. (Reference O’Donovan, Charbonneau, Harrington, Madhusudhan, Seager, Deming and Knutson2010), 25. Croll et al. (Reference Croll, Jayawardhana, Fortney, Lafrenière and Loic2010a), 26. Fressin et al. (Reference Fressin, Knutson, Charbonneau, O’Donovan, Burrows, Deming, Mandushev and Spiegel2010), 27. de Mooij & Snellen (Reference de Mooij and Snellen2009), 28. Croll et al. (Reference Croll, Loic, Lafreniere, Jayawardhanan and Fortney2010b), 29. Knutson et al. (Reference Knutson, Charbonneau, Burrows, O’Donovan and Mandushev2009a), 30. Zhao et al. (Reference Zhao, Monnier, Swain, Barman and Hinkley2012a), 31. Beerer et al. (Reference Beerer2011), 32. Cáceres et al. (Reference Cáceres2011), 33. Baskin et al. (Reference Baskin2013), 34. Cubillas et al. (Reference Cubillas2013), 35. Campo et al. (Reference Campo2011), 36. Croll et al. (Reference Croll, Lafreniere, Loic, Jayawardhana, Fortney and Murray2011), 37. Crossfield et al. (Reference Crossfield, Barman, Hansen, Ichi and Kodama2012b), 38. Zhao et al. (Reference Zhao, Milburn, Barman, Hinkley, Swain, Wright and Monnier2012b), 39. Cowan et al. (Reference Cowan, Machalek, Croll, Shekhtman, Burrows, Deming, Greene and Hora2012b), 40. López-Morales et al. (Reference López-Morales, Coughlin, Sing, Burrows, Apai, Rogers, Spiegel and Adams2010), 41. Anderson et al. (Reference Anderson2011), 42. Nyemeyer et al. (Reference Nyemeyer2011), 43. Maxted et al. (Reference Maxted2013), 44. Anderson et al. (Reference Anderson2013), 45. Gibson et al. (Reference Gibson2010), 46. Lendl et al. (Reference Lendl, Gillon, Queloz, Alonso, Fumel, Jehin and Naef2013), 47. Burton et al. (Reference Burton, Watson, Littlefair, Dhillon, Gibson, Marsh and Pollacco2012), 48. Smith et al. (Reference Smith2012), 49. Mahtani et al. (Reference Mahtani2013), 50. Deming et al. (Reference Deming2012), 51. de Mooij et al. (Reference de Mooij, Brogi, de Kok, Snellen, Kenworthy and Karjaleinen2013), 52. Smith et al. (Reference Smith, Anderson, Skillen, Collier-Cameron and Smalley2011), 53. Blecic et al. (Reference Blecic2014), 54. Machalek et al. (Reference Machalek, McCullough, Burke, Valenti, Burrows and Hora2008), 55. Machalek et al. (Reference Machalek, McCullough, Burrows, Burke, Hora and Johns-Crull2009), 56. Machalek et al. (Reference Machalek, Greene, McCullough, Burrows, Burke, Hora, Johns-Krull and Deming2010), 57. Zhou et al. (Reference Zhou, Kedziora-Chuczer, Bayliss and Bailey2013), 58. Stevenson et al. (Reference Stevenson2010), 59. Agol et al. (Reference Agol, Cowan, Knutson, Deming, Steffen, Henry and Charbonneau2010), 60. O’Rourke et al. (Reference O’Rourke2014), 61. Blecic et al. (Reference Blecic2013), 62. Zellem et al. (Reference Zellem2014), 63. Chen et al. (Reference Chen, van Boekel, Madhusudhan, Wang, Nikolov, Seeman and Henning2014a), 64. Rostron et al. (Reference Rostron2014), 65. Chen et al. (Reference Chen, van Boekel, Wang, Nikolov, Seemann and Henning2014b), 66. Wang et al. (Reference Wang, van Boekel, Madhusudhan, Chen, Zhao and Henning2013), 67. Zhou et al. (Reference Zhou, Bayliss, Kedziora-Chudczer, Salter, Tinney and Bailey2014)
For a few of the brighter systems it is possible to go further and obtain spectra of the dayside emission using the secondary eclipse depth. Such results are listed in Table 4. Figure 13 shows the combined data from broad band and spectroscopic observations for some of the best studied cases.

Dayside emission spectroscopy from secondary eclipses.

With secondary eclipse data of sufficient quality it is possible to map the brightness distribution across the disk of the planet (Williams et al. Reference Williams, Charbonneau, Cooper, Showman and Fortney2006). This has been attempted for HD 189733b by Majeau, Agol, & Cowan (Reference Majeau, Agol and Cowan2012) and de Wit et al. (Reference de Wit, Gillon, Demory and Seager2012). The results show a bright spot shifted east from the subsolar point in agreement with results from the full phase light curve (Knutson et al. Reference Knutson2007a)
While the infrared secondary eclipse shows the thermal emission from the planet, observations of the secondary eclipse at visible wavelengths can show the planet through light reflected from its star. However, if the planet is very hot, thermal emission may still be present even at visible wavelengths. Table 5 summarises measurements so far, mostly from observations with Kepler, in a broad band covering 400–850 nm. These observations provide a measure of the geometric albedo of the planet, and show that some of these planets are quite dark, while others have geometric albedos up to ~ 0.4. In the case of HD 189733b observations have been made with STIS showing the planet to be dark at 450–570 nm, but with an albedo of 0.4 at 290–450 nm, the blue colour being indicative of a Rayleigh scattering haze (Evans et al. Reference Evans2013). Low albedos in the visible are to be expected for clear atmospheres due to the broad sodium and absorption lines, whereas higher albedos can result if clouds are present (Sudarsky, Burrows, & Pinto Reference Sudarsky, Burrows and Pinto2000).
Geometric albedo measurements from optical secondary eclipses.

All measurements are with Kepler (400–850 nm) except for HD 209458b observed with MOST (350–700 nm) and HD 189733b observed with HST/STIS.
3.3.4 Transit spectroscopy
Observations during transit (or primary eclipse, when the planet passes in front of the star) also provide information on the atmospheres. The depth of the primary eclipse is a measure of the radius of the planet, and will be larger where absorption is strongest.
Spectroscopy during transits can reveal absorption features in the transmission spectrum of the planet’s atmosphere. Transit spectroscopy samples the terminator of the planet and the long tangent path length means that it is sensitive to higher levels in the atmosphere than dayside emission spectroscopy from secondary eclipses.
The first detection of an exoplanet atmosphere was in observations of the transits of HD 209458 (Charbonneau et al. Reference Charbonneau, Brown, Noyes and Gilliland2002) that showed absorption in the sodium doublet at 589.3 nm. Transit spectroscopy (other than studies of Na line absorption) studies are listed in Table 6. In addition to these spectroscopy observations there are numerous transit measurements in broad band filters, including measurements in the Spitzer/IRAC bands that extend coverage to longer wavelengths. HD 189733b is a particularly well studied system, and the various space observations have been combined by Pont et al. (Reference Pont, Sing, Gibson, Aigrain, Henry and Husnoo2013) to give the transmission spectrum shown in Figure 14. It shows increasing absorption to the blue indicating the presence of a Rayleigh scattering haze. Wasp 12b (Sing et al. Reference Sing2013) also shows a similar increase to the blue attributed to Rayleigh scattering from aerosols.
Transmission spectrum of HD 189733b from HST and Spitzer transit observations, showing increase to the blue interpreted as due to a Rayleigh scattering haze. — Figure 9 from ‘The prevalence of dust on the exoplanet HD189733b from Hubble and Spitzer observations’, Pont, F. et al., 2013, MNRAS, 432, 2917.

Transmission spectroscopy during transit.

a According to reanalysis by Barman (Reference Barman2007).
Transmission spectra in the near-IR for three systems are shown in Figure 15, showing water vapour absorption at ~ 1.4 μm. As is conventional, these observations are plotted as R P /R S (i.e. the radius of the planet divided by the radius of the star as determined from the transit). This gives an inverted spectrum compared with conventional spectroscopy, since absorption features increase the apparent radius of the planet.
HST/WFC3 observations of the transmission spectra of HD209458b and XO-1b (Deming et al. Reference Deming2013) and HAT-P-1b (Wakeford et al. Reference Wakeford2013) showing absorption at ~ 1.4 μm attributed to H2O. The spectrum of the brown dwarf Kelu-1 showing the same absorption feature is shown for comparison in the bottom panel. The exoplanet spectra are inverted compared with the brown dwarf spectra since absorption features increase the radius of the planet as seen in transit observations.

Measurements of the Sodium D-line absorption are listed in Table 7. Results are listed here where the absorption is detected at greater than the 3-sigma level. There are also a number of unsuccesful attempts at detections. Potassium absorption has been reported in XO-2b (Sing et al. Reference Sing2011b).
Sodium (589 nm) detections from transit spectroscopy.

a 7.0 ± 1.1 × 10⁻⁴ (0.15 nm band), 13.5 ± 1.7 × 10⁻⁴ (0.075 nm band)
Atomic and atomic ion species have also been detected in a number of transiting planets in the unbound portion of the atmosphere, or exosphere. The best studied case is HD 209458b where H I, C II, O I, and Si III have been observed (Vidal-Madjar et al. Reference Vidal-Madjar, Lecavelier des Etangs, Désert, Ballester, Ferlet, Hébrard and Mayor2003, Reference Vidal-Madjar2004; Linsky et al. Reference Linsky, Yang, France, Froning, Green, Stocke and Osterman2010). Exosphere detections have also been reported in HD 189733b (Lecavelier Des Etangs et al. Reference Lecavelier des Etangs2010; Jensen et al. Reference Jensen, Redfield, Endl, Cochran, Koesterke and Barman2012) and Wasp-12b (Fossati et al. Reference Fossati2010).
3.3.5 Full phase photometry
As well as observations of the transits and eclipses, information on a planet’s atmosphere can be obtained from observations of the full phase light curve. In the infrared a hot Jupiter will show variations around the cycle due to the variation of temperature across its surface. In the optical where reflected light is seen, variations will occur due to the change in the illuminated fraction of the disk, as well as due to phase angle dependent scattering processes (Seager, Whitney, & Sasselov Reference Seager, Whitney and Sasselov2000). In some cases the light curves are complicated by ellipsoidal variations in the star (e.g. Welsh et al. Reference Welsh2010) or the planet (e.g. Cowan et al. Reference Cowan, Machalek, Croll, Shekhtman, Burrows, Deming, Greene and Hora2012b). Systems with full phase light curves at infrared wavelengths showing significant variation around the cycle are listed in Table 8. In addition full phase light curves due to reflected light are observed in many of the systems listed in Table 5.
Full phase infrared photometry of exoplanets.

Analysis of these light curves has been used to derive maps of the temperature distribution of HD 189733b (Knutson et al. Reference Knutson2007a) showing a hot spot offset from the substellar point (consistent with models, see Section 4.1.3). In the case of Kepler-7b, the reflected light phase curve observed by Kepler is interpreted as showing the presence of patchy clouds (Demory et al. Reference Demory2013).
3.3.6 Polarimetry
Reflected light from extrasolar planets will be polarised as a result of scattering from cloud and haze particles and from molecules. Normal stars are generally found to have very low intrinsic polarisations (Kemp et al. Reference Kemp, Henson, Steiner and Powell1987; Bailey, Lucas, & Hough Reference Bailey, Lucas and Hough2010). In a hot Jupiter system the polarisation in the combined light of the unresolved star and planet is expected to be in the range 10−5–10−6 (Seager, Whitney, & Sasselov Reference Seager, Whitney and Sasselov2000), and will vary around the orbital cycle with the changing phase angle.
While the expected polarisations are small, polarisation is a differential measurement that can be made to high sensitivity wth ground-based telescopes, and instruments capable of measuring stellar polarisation at the one part per million level have been developed (Hough et al. Reference Hough, Lucas, Bailey, Tamura, Hirst, Harrison and Bartholomew-Biggs2006; Wiktorowicz & Matthews Reference Wiktorowicz and Matthews2008). Lucas et al. (Reference Lucas, Hough, Bailey, Tamura, Hirst and Harrison2009) reported upper limits on the polarisation of τ Boo and 55 Cnc in a broad red band (590–920 nm) and set upper limits on the geometric albedo of τ Boo b and 55 Cnc e for Rayleigh scattering models.
Berdyugina et al. (Reference Berdyugina, Berdyugin, Fluri and Piirola2008) reported polarisation varying over the orbital cycle of HD 189733b with an amplitude of ~ 2 × 10⁻⁴ in the B band. Wiktorowicz (Reference Wiktorowicz2009), however, found no polarisation variation in this system with a 99% confidence upper limit of 7.9 × 10⁻⁵ in a 400–675 nm wavelength range. Berdyugina et al. (Reference Berdyugina, Berdyugin, Fluri and Piirola2011) then reported further observations that confirmed a polarisation variation, but with a reduced amplitude of 10−4 in the U and B bands and much lower amplitude in the V band. They claim the data is consistent with that of Wiktorowicz (Reference Wiktorowicz2009) when the different wavelengths are taken into account.
While HD 189733b is a system in which polarisation might be expected in view of the Rayleigh scattering haze seen in transmission spectroscopy (Pont et al. Reference Pont, Knutson, Gilliland, Moutou and Charbonneau2008, Reference Pont, Sing, Gibson, Aigrain, Henry and Husnoo2013), the reported polarisation amplitudes are too large to be easily explained. Berdyugina et al. (Reference Berdyugina, Berdyugin, Fluri and Piirola2011) report that the polarisation is consistent with a Rayleigh-Lambert model with a geometric albedo of ~ 0.6 and ‘scattered light maximally polarised’ (i.e. 100%). However, in Rayleigh scattering models a layer sufficiently optically thick to produce a high geometric albedo has a maximum polarisation of only about 30% (Buenzli & Schmid Reference Buenzli and Schmid2009) as a result of depolarisation due to multiple scattering. Lucas et al. (Reference Lucas, Hough, Bailey, Tamura, Hirst and Harrison2009) used Monte-Carlo scattering models to predict a maximum polarisation amplitude of 2.6 × 10⁻⁵ for HD 189733b.
3.4 Atmospheric structure
3.4.1 Inflated atmospheres
One result of transit observations is that many hot Jupiters are ‘inflated’, with radii significantly larger than predicted by models (Baraffe, Chabrier, & Barman Reference Baraffe, Chabrier and Barman2008, Reference Baraffe, Chabrier and Barman2010). This inflation is found to be correlated with the level of stellar irradiation, with inflation becoming apparent for planets receiving incident flux greater than 2 × 10⁸ erg s−1 cm−2 (Miller & Fortney Reference Miller and Fortney2011; Demory & Seager Reference Demory and Seager2011).
Weiss et al. (Reference Weiss2013) have used data on 138 exoplanets to derive empirical relations between radius, mass and incident flux as follows:
 \begin{equation}
R_P/R_{\hbox{$\oplus $}} = 1.78 (M_P/M_{\hbox{$\oplus $}})^{0.53} (F/\mbox{erg s$^{-1}$ cm$^{-2}$})^{-0.03}
\end{equation}
\begin{equation}
R_P/R_{\hbox{$\oplus $}} = 1.78 (M_P/M_{\hbox{$\oplus $}})^{0.53} (F/\mbox{erg s$^{-1}$ cm$^{-2}$})^{-0.03}
\end{equation}
for MP < 150M ⊕, and
 \begin{equation}
R_P/R_{\hbox{$\oplus $}} = 2.45 (M_P/M_{\hbox{$\oplus $}})^{-0.039} (F/\mbox{erg s$^{-1}$ cm$^{-2}$})^{0.094}
\end{equation}
\begin{equation}
R_P/R_{\hbox{$\oplus $}} = 2.45 (M_P/M_{\hbox{$\oplus $}})^{-0.039} (F/\mbox{erg s$^{-1}$ cm$^{-2}$})^{0.094}
\end{equation}
for MP > 150M ⊕.
The reason for this inflation is still debated. Guillot & Showman (Reference Guillot and Showman2002) showed that the inflated radii could be understood if ~ 1% of the stellar flux received by the planet was transferred into the deep atmosphere below the photosphere. The observed relationships between inflated radii and incident flux appear consistent with this idea. However, it is unclear what is the mechanism for transferring energy into the interior. Mechanisms for inflated radii include downward transport of mechanical energy by atmospheric circulation (Showman & Guillot Reference Showman and Guillot2002), enhanced opacities that help to trap heat in the interior (Burrows et al. Reference Burrows, Hubeny, Budaj and Hubbard2007a), dissipation of thermal tides (Arras & Socrates Reference Arras and Socrates2010), and tidal heating due to a non-zero eccentricity (Jackson et al. Reference Jackson, Greenberg and Barnes2008; Ibgui, Burrows, & Spiegel Reference Ibgui, Burrows and Spiegel2010). The Ohmic dissipation model (Batygin & Stevenson Reference Batygin and Stevenson2010; Perna, Menou, & Rauscher Reference Perna, Menou and Rauscher2010) uses the interaction of atmospheric winds and the planetary magnetic field to induce electric currents that heats the interior. Rauscher & Menou (Reference Rauscher and Menou2013) have modelled the process using a 3D model (see Section 4.1.3) and find that ohmic dissipation can explain the radius of HD 209458b for a planetary magnetic field of 3–10 G. However, Rogers & Showman (Reference Rogers and Showman2014) used 3D magnetohydrodynamic simulations of the atmosphere of HD 209458b and found Ohmic dissipation rates orders of magntiude too small to explain the inflated radius.
3.4.2 Temperature structure
The dayside spectra of hot Jupiters as defined by the Spitzer IRAC colours (Table 3 and Figure 13) have been used to derive information on the atmospheric temperature structure. If temperature decreases with height then the spectrum shows absorption features due to its atmospheric molecules, but a temperature inversion can cause the same features to appear in emission. A constant temperature (isothermal) atmosphere would shown no spectral features.
The presence of a temperature inversion was first suggested in the infrared spectrum of HD 209458b (Knutson et al. Reference Knutson, Charbonneau, Allen, Burrows and Megeath2008; Burrows et al. Reference Burrows, Hubeny, Budaj and Hubbard2007a) where a bump in the spectrum at 4.5 and 5.8 μm can be understood as water vapour in emission. A number of other cases have been suggested based on Spitzer photometry. It has been suggested that inversions result from absorption of starlight by an absorber high in the atmosphere. Suggestions for the absorber include TiO and VO (Hubeny et al. Reference Hubeny, Burrows and Sudarsky2003; Fortney et al. Reference Fortney, Lodders, Marley and Freedman2008) or photochemically produced sulfur compounds (Zahnle et al. Reference Zahnle, Marley, Freedman, Lodders and Fortney2009). However, observations have so far failed to detect the presence of TiO or VO in eclipse or transit spectroscopy in any of these systems.
Knutson, Howard, & Isaccson (Reference Knutson, Howard and Isaacson2010) argue that the presence of an inversion correlates with the activity of the host star, with the temperature inversions being found for planets orbiting inactive stars, whereas the non-inverted atmospheres occur in planets orbiting chromospherically active stars.
However, Madhusudhan & Seager (Reference Madhusudhan and Seager2010) have investigated the degeneracies between thermal inversions and molecular abudnances, and find it is often possible to fit both inversion and non-inversion models given the limited data points available from Spitzer photometry.
3.5 Composition
3.5.1 Water vapour, carbon monoxide and methane
Analogy with brown dwarfs of similar temperatures discussed in Section 2 suggests that the most important species in the near-IR spectra should be H2O, CO and CH4. From the discussion in Section 3.3 and Tables 2–6, it will be apparent that H2O and CO are indeed detected in quite a number of giant exoplanet systems by a variety of different methods. Evidence for these molecules is found in spectroscopy of direct imaged planets (Section 3.3.1), from high resolution cross correlation methods (Section 3.3.2 and Table 2) and from secondary eclipse (Section 3.3.3, Table 4) and transit (Section 3.3.4 and Table 6) spectroscopy.
The data on CH4 is less clear. Although it is reported, for example, in the NICMOS transmission spectrum of HD 189733b (Swain et al. Reference Swain, Vasisht and Tinetti2008), high resolution cross correlation studies at the same wavelength do not detect it (de Kok et al. Reference de Kok, Brogi, Snellen, Birkby, Albrecht and de Mooij2013), but do detect CO. This suggests a departure from equilibrium chemistry due to vertical mixing as also suggested by Knutson et al. (Reference Knutson2012) based on Spitzer phase curves.
The spectra of directly imaged planets shown in Figure 10 also show CO, but at best very weak evidence for CH4. These are all objects that are cool enough to be in the T dwarf range, but actually show spectra more like those of L dwarfs. The lack of CH4 once again indicates non-equilibrium chemistry (Barman et al. Reference Barman, Macintosh, Konopacky and Marois2011a, Reference Barman, Macintosh, Konopacky and Marois2011b; Skemer et al. Reference Skemer2014; Zahnle & Marley Reference Zahnle and Marley2014). Departures from equilibrium chemistry are discussed further in Section 4.2.2.
Recently, however, CH4 has been detected photometrically in the very cool ( ~ 600 K) planetary mass companion GJ 504b (Janson et al. Reference Janson2013) as described in Section 3.3.1
3.5.2 Carbon dioxide
Up to a few years ago CO2 was not considered to be an important species for exoplanet and brown dwarf atmospheres as its predicted equilibrium abundance is quite low. Then Swain et al. (Reference Swain, Vasischt, Tinetti, Bouwman, Chen, Yung, Deming and Deroo2009a) reported an absorption feature at 2.0 μm in the NICMOS dayside emission spectrum of HD189733b that they identified as CO2. This is a relatively weak CO2 band. It has never been seen in brown dwarfs, for example, whereas the much stronger CO2 band at 4.2 μm has been seen (Yamamura, Tsuji, & Tanabé Reference Yamamura, Tsuji and Tanabé2010; Sorahana & Yamamura Reference Sorahana and Yamamura2012).
Fitting the NICMOS feature at 2.0 μm in HD189733b as a CO2 band results in CO2 mole fractions ~ 10−3 (Madhusudhan & Seager Reference Madhusudhan and Seager2009; Lee, Fletcher, & Irwin Reference Lee, Fletcher and Irwin2012; Line et al. Reference Line, Zhang, Vasischt, Natraj, Chen and Yung2012). This is several thousand times higher than the expected chemical equilibrium abundance for solar composition (Moses et al. Reference Moses2011) or the observed CO2 abundances in brown dwarfs (Tsuji, Yamamura, & Sorahana Reference Tsuji, Yamamura and Sorahana2011). Inclusion of non-equilibrium processes such as photochemistry does not substantially increase CO2 abundances (Zahnle et al. Reference Zahnle, Marley, Freedman, Lodders and Fortney2009; Moses et al. Reference Moses2011). However, CO2 abundances are sensitive to elemental composition increasing quadratically with increasing metallicity (Lodders Reference Lodders2002; Zahnle et al. Reference Zahnle, Marley, Freedman, Lodders and Fortney2009).
The high CO2 abundance is not clearly seen in other observations of HD189733b. In particular the much stronger CO2 bands at 4.2 μm and 15 μm are not apparent in the Spitzer secondary eclipse data. Fitting separately to the NICMOS and Spitzer data, Madhusudhan & Seager (Reference Madhusudhan and Seager2009) found a much lower CO2 abundance from the Spitzer data consistent with equilibrium predictions. If a model is required to fit both the Spitzer and NICMOS data simultaneously, as in the retrieval analysis of Lee et al. (Reference Lee, Fletcher and Irwin2012) the result is a very high CO2 abundance to fit the NICMOS data, and then a tightly constrained isothermal temperature profile in the upper atmosphere, which hides the strong 4.2 μm and 15 μm CO2 bands that would otherwise be present.
An alternative interpreation is to disregard the NICMOS 2 μm feature, the only evidence pointing to a high CO2 abundance in HD 189733b. Gibson et al. (Reference Gibson, Pont and Aigrain2011) have argued that NICMOS observations are too sensitive to the method of removing systematics to reliably detect molecular species. In that case it is possible to fit the remaining data on the transmission and dayside emission spectra of HD 189733b very well using equilibrium abundances as shown by Dobbs-Dixon & Agol (Reference Dobbs-Dixon and Agol2013) who used the solar composition opacities from Sharp & Burrows (Reference Sharp and Burrows2007).
3.5.3 C/O ratios
A high C/O ratio was first suggested for the atmosphere of the highly irradiated hot Jupiter WASP-12b (Madhusudhan et al. Reference Madhusudhan2011) and Madhusudhan (Reference Madhusudhan2012) has suggested that C/O ratio may be an important parameter for classifying exoplanet atmospheres. If C/O is greater than 1.0 (the solar value is about 0.5) the chemistry changes substantially for temperatures above about 1 500 K, since almost all the oxygen combines with carbon to form CO, and the abundances of other oxygen bearing species, including H2O and TiO/VO are substantially reduced. The excess carbon also results in increased abundances of carbon species such as HCN and C2H2.
Reanalysis of the secondary eclipse data on WASP-12b by Crossfield et al. (Reference Crossfield, Barman, Hansen, Ichi and Kodama2012b), with corrections for the effects of a contaminating star, concluded that the spectrum was well-approximated by a blackbody and that no constraints on its atmospheric abundances could be set. Other recent studies of the emission and transmission spectra of WASP-12b (Sing et al. Reference Sing2013; Swain et al. Reference Swain2013; Mandell et al. Reference Mandell, Haynes, Sinukoff, Madhusudhan, Burrows and Deming2013) do not clearly detect any molecular species and do not significantly constrain the C/O ratio.
Line et al. (Reference Line2013b) have investigated the ability to determine C/O ratios using retrieval models (see Section 4.1.2) and find that with limited data this is very difficult and the retrieved values are biased towards the solar value or a value of one.
3.6 Clouds and hazes
The best evidence for cloud or hazeFootnote 3 in giant exoplanets comes from observations of the resolved planets (or planetary mass objects) HR 8799b, HR 8799c and 2M 1207b where photometry and spectroscopy point to cloudy atmospheres similar to those of L dwarfs as already discussed in Section 3.3.1. A recent analysis by Skemer et al. (Reference Skemer2014) including mid-infrared data concluded that patchy clouds as well as non-equilibrium chemistry (to explain the weakness of the 3.3 μm CH4 band) were needed to fit the data for the HR 8799 planets, whereas a thick cloud model fitted the 2M 1207b data.
HD 189733b has good evidence for a Rayleigh scattering haze that is visible in both the transmission spectrum observed during transit (Pont et al. Reference Pont, Sing, Gibson, Aigrain, Henry and Husnoo2013) and in the reflection spectrum from secondary eclipse (Evans et al. Reference Evans2013). Rayleigh scattering (seen as an increase in radius to the blue) is also seen in the transmission spectrum of WASP-12b (Sing et al. Reference Sing2013) and WASP-6b (Jordán et al. Reference Jordán2013).
Demory et al. (Reference Demory2013) use an analysis of the optical phase curve and secondary eclipse of Kepler-7b to conclude that clouds must be present and must have an inhomogenous distribution to explain the lack of symmetry in the phase curve.
The presence of clouds or hazes are suggested in some other systems by essentially featureless transmission spectra that lack features expected for a clear atmosphere such as Na or H2O absorption (e.g. Line et al. Reference Line, Knutson, Deming, Wilkins and Desert2013a; Gibson et al. Reference Gibson, Aigrain, Barstow, Evans, Fletcher and Irwin2013a).
4 ATMOSPHERIC MODELS
4.1 Types of models
Exoplanet and brown dwarf atmospheres occupy a temperature range extending from that of the Solar system planets to that of the coolest stars. Modelling techniques for these objects can thus adapt techniques both from traditional stellar atmosphere modelling (e.g. Gray Reference Gray2005) and those developed for modelling of the Earth and other Solar system planet atmospheres (e.g. Liou Reference Liou2002). These two fields have developed largely independently and have significant difference in approach that are now becoming apparent, as methods from both fields are applied to the modelling of exoplanet atmospheres.
Howvever, the essentials of atmospheric modelling are the same for all such objects. The VSTAR modeeling code (Bailey & Kedziora-Chudczer Reference Bailey and Kedziora-Chudczer2012), for example, has been used successfully for objects ranging from terrestrial (Bailey Reference Bailey2009; Cotton et al. Reference Cotton, Bailey, Crisp and Meadows2012) and giant planets (Kedziora-Chudczer & Bailey Reference Kedziora-Chudczer and Bailey2011) in the Solar system to exoplanets (Zhou et al. Reference Zhou, Kedziora-Chuczer, Bayliss and Bailey2013, Reference Zhou, Bayliss, Kedziora-Chudczer, Salter, Tinney and Bailey2014), brown dwarfs and cool stars (Bailey & Kedziora-Chudczer Reference Bailey and Kedziora-Chudczer2012).
4.1.1 Stellar atmosphere type models
The traditional approach to stellar atmosphere modelling is typified by the ATLAS series of modelling codes (Kurucz Reference Kurucz1970, Reference Kurucz1993; Castelli & Kurucz Reference Castelli and Kurucz2004), and the MARCS models (Gustaffson et al. Reference Gustaffson, Edvardsson, Eriksson, Jørgensen, Nordlund and Plez2008). Normally with such models the starting point is an adopted effective temperature T eff, surface gravity (usually specified as log g in cgs units), and metallicity [M/H]. Grids of models can then be calculated for different values of these parameters. The essential stages in such models are:
-
1. Start with an initial estimate for the pressure temperature structure of the atmosphere specified at a number ( ~ 40–80) of layers.
-
2. For each layer calculate the composition of the layer. For hotter stars this primarily involves determining the distribution of ionisation states for each element using Saha’s equation. For cooler stars some molecules become important and their concentrations are calculated assuming chemical equilibrium.
-
3. Calculate the opacity (extinction coefficient) of each layer at each required wavelength taking account of atomic absorption lines, molecular absorption lines and continuum opacity sources such as bound-free and free-free absorption, collision induced absorptions, Rayleigh and electron scattering. The wavelength range must cover all wavelengths at which significant energy transport occurs.
-
4. Solve the radiative transfer equation to determine the radiative energy flux through each layer.
-
5. Iteratively adjust the temperature structure of the model, repeating steps 2–4 as required until the model is in energy balance. The total flux through each layer, including convective energy flux which is normally determined using mixing length theory (Henyey, Vardya, & Bodenheimer Reference Henyey, Vardya and Bodenheimer1965) must equal σT 4 eff.
The spectrum of the star can then be obtained, either from the last iteration of the model if opacities and radiative transfer are calculated with sufficient resolution, or from a separate spectral synthesis model.
Models based on essentially this procedure have been developed for brown dwarf and exoplanet atmospheres (e.g. Tsuji et al. Reference Tsuji, Ohnaka, Aoki and Nakajima1996; Allard et al. Reference Allard, Hauschildt, Alexander, Tamanai and Schweitzer2001; Barman, Hauschildt, & Allard Reference Barman, Hauschildt and Allard2001; Marley et al. Reference Marley, Seager, Saumon, Lodders, Ackerman, Freedman and Fan2002; Burrows, Sudarsky, & Hubeny Reference Burrows, Sudarsky and Hubeny2003). In order to model the atmospheres of these cooler objects a number of additional complications have to be dealt with.
At lower temperatures the composition becomes dominated by molecules (as shown in Figure 3), and the calculation of composition (or equation of state) becomes primarily a chemical model. Large numbers of chemical compounds are potentially important and hence large chemical models handling hundreds or in some case thousands of species have been developed (e.g Lodders & Fegley Reference Lodders and Fegley2002). (see Section 4.2).
As well as gas phase species, at temperatures below about 2 000 K condensates start to form and both modify the gas phase chemistry, and can form clouds that contribute substantially to the opacity. As we have already seen clouds are important in understanding the behaviour of L dwarfs and the L/T transition, and are also probably important in giant exoplanets. (see Section 4.4).
Molecules and cloud particles contribute to scattering of light. Scattering is usually a relatively minor contribution to the opacity of stellar atmospheres and is usually treated using simplifying approximations such as that of isotropic scattering. In the cooler atmospheres of brown dwarfs and exoplanets scattering becomes more significant, and more rigorous treatments of scattering that accurately account for the non-isotropic phase functions may be needed (de Kok et al. Reference de Kok, Helling, Stam, Woitke and Witte2011; Bailey & Kedziora-Chudczer Reference Bailey and Kedziora-Chudczer2012). (see Section 4.5).
4.1.2 Retrieval models
A different approach to modelling exoplanet atmospheres is shown in a number of recent studies (Madhusudhan & Seager Reference Madhusudhan and Seager2009; Line et al. Reference Line, Zhang, Vasischt, Natraj, Chen and Yung2012; Lee et al. Reference Lee, Fletcher and Irwin2012; Benneke & Seager Reference Benneke and Seager2012; Line et al. Reference Line2013b; Benneke & Seager Reference Benneke and Seager2013) that adopt a retrieval approach. These approaches are similar to that used in remote sensing studies of the Earth atmosphere where temperature structure (e.g. Rozenkranz Reference Rosenkranz2001) trace gas content (e.g. Buchwitz et al. Reference Buchwitz2005), and cloud properties (e.g. Garnier et al. Reference Garnier, Pelon, Dubuisson, Chomette, Pascal and Kratz2012) are routinely retrieved from satellite observations, and similar techniques are used to study the atmospheres of other Solar system planets from orbiting spacecraft or Earth-based telescopes.
These models seek to retrieve the temperature structure and composition of the atmosphere directly from observations, rather than predict these using energy balance and chemical models as in the approach described above. Thus only steps 3 and 4 of the modelling procedure are needed in the forward model. A number of different approaches to the retrieval process have been used. Madhusudhan & Seager (Reference Madhusudhan and Seager2009) search in a large grid of models covering a wide parameter space. Lee et al. (Reference Lee, Fletcher and Irwin2012) use an iterative optimal estimation procedure. Line et al. (Reference Line2013b) investigate several different approaches to retrieval (Optimal Estimation, Bootstrap Monte Carlo, and Differential Evolution Markov Chain Monte Carlo).
Benneke & Seager (Reference Benneke and Seager2012, Reference Benneke and Seager2013) use a somewhat different approach where the temperature profile is not retrieved, but is determined by a self consistent model requiring radiative and hydrostatic equilibrium and allowing for convection. The model can therefore be described by a small number of parameters (planet-to-star radius ratio, cloud-top pressure and Bond albedo) as well as the mole fractions of molecular species. The models include cloud and haze layers and retrieval uses a Bayesian Nested Sampling Monte Carlo method.
4.1.3 3D models of hot Jupiters
All the models considered so far are 1D models that describe the structure of the atmosphere with a single one dimensional profile. Such models cannot represent dynamical effects and diurnal variations. For hot Jupiters which all receive strong irradiation from their star, the structure is expected to vary substantially around the planet and can be very different on the dayside and nightside.
A number of studies have looked at full 3D models of the atmospheric circulation (General Circulation Models or GCMs) for hot Jupiters. A GCM typically consists of a dynamical core (usually adpated from an Earth atmosphere model) that numerically solves the equations that govern atmospheric circulation over a three dimensional grid of points. These equations can either be the ‘primitive equations’ that include the approximations of vertical hydrostatic equilibrium and a shallow atmosphere as used by Showman et al. (Reference Showman, Fortney, Lian, Marley, Freedman, Knutson and Charbonneau2009) and Rauscher & Menou (Reference Rauscher and Menou2012) or the full equations that avoid these approximations as used by Dobbs-Dixon & Lin (Reference Dobbs-Dixon and Lin2008) and Mayne et al (Reference Mayne2014). Initially simplified schemes were used to represent the forcing from the illuminating star (e.g. Showman & Guillot Reference Showman and Guillot2002; Cooper & Showman Reference Cooper and Showman2005; Menou & Rauscher Reference Menou and Rauscher2009) but more recent models include a radiative transfer model and are therfore coupled radiative-dynamical models.
Because of the need to perform radiative transfer solutions for each grid point and time step, radiative transfer methods for GCMs generally need to be simplified compared with those used in the 1D models described earlier. Dobbs-Dixon & Lin (Reference Dobbs-Dixon and Lin2008) used a grey model described by a single mean opacity. Heng, Frierson, & Phillips (Reference Heng, Frierson and Phillips2011) and Rauscher & Menou (Reference Rauscher and Menou2012) use dual-band radiative transfer, dividing radiation into incoming shortwave radiation from the star, and outgoing longwave radiation from the planet. Showman et al. (Reference Showman, Fortney, Lian, Marley, Freedman, Knutson and Charbonneau2009) use the correlated-k method (see Section 4.3) with 30 wavelength bins. Dobbs-Dixon & Agol (Reference Dobbs-Dixon and Agol2013) use a similar set of 30 bins but use band-averaged opacities rather than the correlated-k method. The radiative transfer in all these cases uses a two-stream approximation. Amundsen et al. (Reference Amundsen, Baraffe, Tremblin, Manners, Hayek, Mayne and Acreman2014) has tested the accuracy of some of these approaches and find that correlated-k and two-stream methods give reasonable accuracy, but band-averaged opacities can lead to substantial errors.
A review of atmospheric circulation models for exoplanets is given by Showman, Cho, & Menou (Reference Showman, Cho, Menou and Seager2010). Features predicted by such models are the presence of a superrotating jet in the equatorial regions with wind velocities of 1–4 km/s. This can cause an eastward displacement of the hottest region from the substellar point which is consistent with observations of HD 189733b (Knutson et al. Reference Knutson2007a, Reference Knutson2009b).
Models that specifically aim to simulate the atmospheres of HD 189733b and HD 209458b have been given by Showman et al. (Reference Showman, Fortney, Lian, Marley, Freedman, Knutson and Charbonneau2009) and an example of the predicted temperature structure and winds is given in Figure 16 and show reasonable agreement with observed day-night phase variations in Spitzer photometry of HD 189733b (Knutson et al. Reference Knutson2007a, Reference Knutson2009b).
Temperature (colourscale in K) and winds (arrows) at the 30 mbar level for a 3D general circulation model simulation of the atmosphere of HD 189733b. (Figure 4, Showman, A.P. et al., Atmospheric Circulation of Hot Jupiters: Coupled Radiative-Dynamical General Circulation Model Simulations of HD 189733b and HD 209458b, The Astrophysical Journal, 699, 564. reproduced by permission of the AAS.)

Dobbs-Dixon & Agol (Reference Dobbs-Dixon and Agol2013) have used a 3D model of HD 189733b including wavelength dependent radiative transfer to make predictions of the transmission spectrum, dayside spectrum, and phase curves that are in good agreement with the observations.
4.1.4 3D models of brown dwarfs
Studies of atmospheric circulation in brown dwarfs have been made using 3D models and analytic theory (Showman & Kaspi Reference Showman and Kaspi2013) and shallow water models (Zhang & Showman Reference Zhang and Showman2014). These show atmospheric circulation with horizontal wind speeds up to 300 m s−1, and vertical mixing that could help to explain the disequilibrium chemistry and patchy clouds near the L/T transition (see Section 2.5).
4.2 Atmospheric chemistry
4.2.1 Equilibrim chemistry
Chemical models for brown dwarf and exoplanet atmospheres aim to predict the chemical composition in the atmosphere given the pressure, temperature and elemental abundances. Normally this is based on the assumption of chemical equilibrium. This can be achieved by solving a system of equations for the mass balance of each element and for the overall charge balance using the equilibrium constants of formation for each compound (e.g. Tsuji Reference Tsuji1973; Allard et al. Reference Allard, Hauschildt, Alexander, Tamanai and Schweitzer2001; Lodders & Fegley Reference Lodders and Fegley2002). An alternative, but equivalent, approach is that of minimisation of the total Gibbs free energy of the system (Sharp & Huebner Reference Sharp and Huebner1990; Sharp & Burrows Reference Sharp and Burrows2007).
In either case the required data is available in compilations such as the National Institute for Standards and Technology (NIST)-JANAF thermochemical Tables (Chase Reference Chase1998) and similar Tables such as Barin (Reference Barin1995) and Robie & Hemingway (Reference Robie and Hemingway1995). These tables list the equilibrium constants of formation Kf and Gibbs free energy of formation Δ f Go for a large number of compounds as a function of temperature. The two are related through
 \begin{equation}
\Delta _fG^o = -RT\ln {K_f}
\end{equation}
\begin{equation}
\Delta _fG^o = -RT\ln {K_f}
\end{equation}
Where R is the gas constant. The required thermochemical data for gas phase species can also be derived from spectroscopic constants.
Chemical models predict the abundances of gas phase species, ionised species and the formation of liquid and solid condensates. The thermochemical models can also predict quantities such as the mean molecular weight, the specific heat and the adiabatic gradient, the latter two quantities being needed for mixing length convection theory.
4.2.2 Departures from equilibrium
Departures from equlibrium chemistry can occur as a result of photochemistry or vertical mixing if these processes occur at a faster rate than the collisional processes that tend to restore equilibrium. A non-equilibrium correction to the equilibrium abundances of CH4/CO and NH3/N2 due to vertical mixing (Saumon et al. Reference Saumon, Marley, Lodders, Freedman and Martín2003) has been adopted to explain the observations of these species in brown dwarfs. A similar nonequilibrium treatement is used by Barman et al. (Reference Barman, Macintosh, Konopacky and Marois2011a) to model the exoplanet HR8799b. Cooper & Showman (Reference Cooper and Showman2006) have found that similar departures from CO/CH4 equilibrium occur in tidally-locked hot-Jupiters.
Zahnle & Marley (Reference Zahnle and Marley2014) have explored the disequilibrium abundances of CH4/CO and NH3/N2 in brown dwarfs and self-luminous giant planets using a chemical kinetic approach. They find that the low gravity of planets strongly discriminates against CH4, and that in Jupiter mass planets CH4 becomes more abundant than CO only for temperatures below about 400–600K depending on the effects of vertical mixing. Ammonia is also sensitive to gravity but insensitive to mixing making it a potetnial proxy for gravity.
Chemical models for hot Jupiter atmospheres using a chemical kinetic approach that can include the effects of photochemistry have been explored in a number of studies (e.g. Zahnle et al. Reference Zahnle, Marley, Freedman, Lodders and Fortney2009; Line, Liang, & Yung Reference Line, Liang and Yung2010; Line et al. Reference Line, Vasischt, Chen, Angerhausen and Yung2011; Moses et al. Reference Moses2011; Venot et al. Reference Venot, Hébrard, Agúndez, Dobrijevic, Selsis, Hersant, Iro and Bounaceur2012; Agúndez et al. Reference Agúndez, Parmentier, Venot, Hersant and Selsis2014) (see also review by Moses Reference Moses2014). There remain some differences between model predictions for species such as CH4 and NH3 due to uncertainties in reaction rates and transport parameters (see discussion in Moses Reference Moses2014 and Agúndez et al. Reference Agúndez, Parmentier, Venot, Hersant and Selsis2014), but generally these models show enhancements of a number of species in the upper atmosphere due to photochemical effects. Most of these models consider C, N and O containing species. The model by Zahnle et al. (Reference Zahnle, Marley, Freedman, Lodders and Fortney2009) includes sulfur species and explores the photochemical production of HS (mercapto) and S2 as possible absorbers that could contribute to stratospheric heating.
4.3 Spectral line absorption
Absorption lines due to rovibrational and electronic transitions of molecules are the most important features of the spectra of brown dwarfs and planets. Species that are important include H2O, CO, CH4, CO2 and NH3, metal oxides such as TiO and VO, metal hydrides including FeH, CrH, MgH, CaH and TiH, and carbon species such as CH, CN, C2, HCN and C2H2 (particularly in carbon rich atmospheres).
Large numbers of vibrational and rotational levels can be excited at the temperatures of a few thousand degrees encountered in ultracool dwarfs and hot Jupiters. This leads to a requirement for large line lists containing many millions of lines such as the BT2 (Barber et al. Reference Barber, Tennyson, Harriss and Tolchenov2006) computed line list for H2O.
The spectral line data are used in models to calculate the absorption in each atmospheric layer. This can be done using on-the-fly line-by-line calculations (Allard et al. Reference Allard, Hauschildt, Alexander, Tamanai and Schweitzer2001; Bailey & Kedziora-Chudczer Reference Bailey and Kedziora-Chudczer2012) which has the advantage of being the most accurate and flexible method and resulting in high-resolution model spectra. However it is also the most computationally intensive approach.
A faster approach is to precalcuate opacity tables (Sharp & Burrows Reference Sharp and Burrows2007; Freedman, Marley, & Lodders Reference Freedman, Marley and Lodders2008) that are then interpolated for the actual models. However, this can lead to inaccuracies if the wavelength bins are made too large. A widely used appoach in Earth atmosphere modelling is the correlated-k (or k-distribution) method (Goody et al. Reference Goody, West, Chen and Crisp1989), which allows the use of larger wavelength bins while retaining accuracy. Recently correlated-k techniques have been used in exoplanet retrieval models (Lee, Fletcher, & Irwin Reference Lee, Fletcher and Irwin2012) and in hot Jupiter GCMs (Showman et al. Reference Showman, Fortney, Lian, Marley, Freedman, Knutson and Charbonneau2009).
Sources of spectral line data for the important species have been discussed in detail in a number of recent papers (Sharp & Burrows Reference Sharp and Burrows2007; Freedman, Marley, & Lodders Reference Freedman, Marley and Lodders2008; Bailey & Kedziora-Chudczer Reference Bailey and Kedziora-Chudczer2012; Tennyson & Yurchenko Reference Tennyson and Yurchenko2012). These also discuss related continuum absorption processes and the handling of line shapes. The reader is referred to these papers for detailed information, and the discussion here relates only to recent developments.
4.3.1 Carbon dioxide (CO2)
The Carbon Dioxide Spectroscopic Databank (CDSD Tashkun et al. Reference Tashkun, Perevalov, Teffo, Bykov and Lavrentieva2003) previously available in 296 K and 1 000 K versions is now available in a 4 000 K versionFootnote 4 containing lines to an intensity of 10−27 cm molecule−1 at 4 000 K for four isotopologues over the range 226–8310 cm−1 (628 million lines).
New computed line lists for CO2 and its isotopologues at 296K and 1 000K (the Ames-296K and Ames-1000K lists) have been described by Huang et al. (Reference Huang, Gamache, Freedman, Schwenke and Lee2013, Reference Huang, Freedman, Tashkun, Schwenke and Lee2014).
4.3.2 Ammonia (NH3)
A computed line list for ammonia at temperatures up to 1 500 K and containing more than 1.1 billion lines for frequencies up to 12 000 cm−1 (the BYTe list) is described by Yurchenko, Barber, & Tennyson (Reference Yurchenko, Barber and Tennyson2012).
Hargreaves, Li, & Bernath (Reference Hargreaves, Li and Bernath2011, Reference Hargreaves, Li and Bernath2012a) have provided line lists based on laboratory measurements of NH3 lines at temperatures from 300 °C to 1 400 °C over the wavelength range from 740–4 000 cm−1.
4.3.3 Methane (CH4)
Methane has been the most problematic of the important species in exoplanet and brown dwarf atmospheres as far as line data is concerned. Significant recent progress has been made with modelling (e.g. Rey, Nikitin, & Tyuterev Reference Rey, Nikitin and Tyuterev2013; Nikitin, Rey, & Tyuterev Reference Nikitin, Rey and Tyuterev2013b; Yurchenko et al. Reference Yurchenko, Tennyson, Barber and Thiel2013) and a large computed line list for hot methane has very recently been developed (Yurchenko & Tennyson Reference Yurchenko and Tennyson2014)Footnote 5 . Yurchenko et al. (Reference Yurchenko, Bailey, Hollis and Tinnetti2014) have shown that using this line list it is possible to obtain good model fits to the methane bands in the near infrared spectra of brown dwarfs that could not be fitted with older line lists, such as those based on the Spherical Top Data System software (STDS Wenger & Champion Reference Wenger and Champion1998). Another computed line list for hot methane has been reported by Rey, Nikitin, & Tyuterev (Reference Rey, Nikitin and Tyuterev2014) but is limited to wavelengths longer than 2 μm.
Much improved line lists for the 1.26–1.71 μm region at temperatures from 80–300 K have been developed recently from extensive laboratory measurements at cryogenic and room temperature (Wang et al. Reference Wang, Mondelain, Kassi and Campargue2012; Campargue et al. Reference Campargue, Leshchishina, Wang, Mondelain, Kassi and Nikitin2012a, Reference Campargue, Leshchishina, Wang, Mondelain and Kassi2013). These lists, and earlier versions of them, have been used successfully for modelling the spectra of Titan (Bailey, Ahlsved, & Meadows Reference Bailey, Ahlsved and Meadows2011; de Bergh et al. Reference de Bergh2012; Campargue et al. Reference Campargue2012b) and Uranus (Irwin et al. Reference Irwin2012; Bott, Kedziora-Chudczer, & Bailey Reference Bott, Kedziora-Chudczer, Bailey, Short and Cairns2013). An improved low temperature line list has also been developed for the 2 μm region (Daumont et al. Reference Daumont2013). These lists have been incorporated into the new 2012 edition of the HITRAN databaseFootnote 6 recently released.
Empirical line lists for methane measured at temperatures from 300–1 400 °C over the wavelength range from 2.0–10.4 μm have been provided by Hargreaves et al. (Reference Hargreaves, Beale, Michaux, Irfan and Bernath2012b).
4.3.4 SiO and HCN/HNC
New line lists for SiO (Barton, Yurchenko, & Tennyson Reference Barton, Yurchenko and Tennyson2013) and HCN/HNC (Barber et al. Reference Barber, Strange, Hill, Polyansky, Mellau, Yurchenko and Tennyson2014) have recently been published by the ExoMol group.
4.3.5 Collision induced absorptions (CIA)
The collision induced absorption of H2 - H2 and H2 - He pairs are important contributors to the opacity of brown dwarfs and planets. Updated data on these absorptions have recently been provided by Abel et al. (Reference Abel, Frommhold, Li and Hunt2011, Reference Abel, Frommhold, Li and Hunt2012) as described in Saumon et al. (Reference Saumon, Marley, Abel, Frommhold and Freedman2012). This data as well as other CIA datasets have been recently made available in a new section of the HITRAN database (Richard et al. Reference Richard2012).
4.4 Condensates and clouds
Condensed phases (i.e. solids and liquids) begin to condense out of the gas when temperatures drop to around 2 000 K and lower. These condensates can form clouds that can significantly alter the opacity and hence the structure of the atmosphere. Chemical models (Section 4.2) can predict which species will condense (these include oxides, silicates and iron) and the amounts of condensed material produced. However, it is harder to predict what size particles will be produced and whether they will remain in place as clouds or fall under gravitation (precipitation, sedimentation or rain-out).
Lorenz-Mie scattering theory can be used to predict the optical properties of the cloud particles. In the general case these include the extinction coefficient, the single scattering albedo (the fraction of light that is scattered rather than absorbed) and the phase function that describes the angular distribution of scattered light. These are needed as inputs for solving the radiative transfer equation (Equations (4) and (5), Section 4.5).
4.4.1 Clouds in brown dwarfs
Two limiting cases were considered in the COND and DUSTY models of Allard et al. (Reference Allard, Hauschildt, Alexander, Tamanai and Schweitzer2001). The COND models include condensate formation, which alters the chemistry by depleting elements from the gas, but did not include any contribution of the condensates to the opacity. In the DUSTY models the condensed material is assumed to remain in place in equilibrium with the gas phase and form clouds of small dust grains. The DUSTY models were found to be a good representation of late-M and early-L dwarfs, but at cooler temperatures they produce weakening of spectral features and increasingly red colours in disagreement with the observations of L-T transition objects.
The cloud-free COND models were found to be a fairly good representation of mid to late T dwarfs, indicating that gravitational settling has largely removed dust from the atmospheres in these cases. However, neither of these two models could account for the late-L to early T dwarfs. A number of cloud models have now been developed that aim to reproduce the behaviour of clouds through the full brown dwarf spectral sequence.
In the Unified Cloudy Model (Tsuji Reference Tsuji2002, Reference Tsuji2005), clouds are assumed to be restricted to a small range of temperatures between the condensation temperature Tcond and a critical temperature Tcr . Below the critical temperature it is assumed that grains will grow to such a size that they will rapidly precipitate under gravity. A fixed particle size (r = 0.01 μm) is used in the clouds. The critical temperature Tcr is an adjustable parameter, with values in the range 1 700–1 900 K providing a reasonable match to the observations.
Burrows, Sudarsky, & Hubeny (Reference Burrows, Sudarsky and Hubeny2006) describe a cloud model that similarly restricts the cloud extent but includes an exponential decay in cloud particle density at the upper and lower edges of the cloud. They investigate the effects of various cloud parameters and conclude that cloud particle sizes of 50–100 μm fit the data best. This is much larger than the grain sizes used in most other models which are around 1 μm or smaller.
Ackerman & Marley (Reference Ackerman and Marley2001) describe a cloud model based on a balance between turbulent diffusion and sedimentation in horizontally uniform cloud decks. The model involves a scaling factor fsed that describes the efficiency of sedimentation and typically ranges from 1 to 5. Small fsed values produce thicker clouds and match observations of L dwarfs and higher values are found for later type T dwarfs (Stephens et al. Reference Stephens2009).
The BT-Settl models (Allard et al. Reference Allard, Allard, Homeier, Kielkopf, McCaughrean and Spiegelman2007, Reference Allard, Homeier, Freytag and Sharp2012) use a cloud treatment based on a model for cloud microphysics from analysis of solar system atmospheres (Rossow Reference Rossow1978) that predicts timescales for condensation, sedimentation and coagulation. These are compared with the turbulent mixing timescale to predict grain densities and sizes.
Woitke & Helling (Reference Woitke and Helling2003, Reference Woitke and Helling2004) and Helling & Woitke (Reference Helling and Woitke2006) have developed a kinetic (non-equilibrium) model for the nucleation, accretion, gravitational settling and evaporation of dust grains. A version of this cloud model has been integrated with the PHOENIX stellar atmosphere code (Hauschildt & Baron Reference Hauschildt and Baron1999) to provide the DRIFT-PHOENIX models for substellar atmospheres (Helling et al. Reference Helling, Dehn, Woitke and Hauschildt2008a).
A more detailed description of some of these different cloud models and a comparison of their predictions in test cases can be found in Helling et al. (Reference Helling2008b).
A specific aim of these models is to explain the changes that occur in brown dwarfs at the L/T transition as discussed in Section 2. Figure 17 shows that the BT-Settl model (and other cloud models make simiar predictions) can explain the general trend seen in the near-IR colour magnitude diagram of a swing from red to blue colours at the L/T transition. The models achieve this mostly because the cloud has a limited extent in temperature, and so for cooler models the clouds drop to layers below the photosphere where the effect on the spectra and colours become small.
Colour magintude diagram using the same data as Figure 5 compared with the predictions of model atmospheres using different cloud models. The BT-COND and BT-DUSTY models are updated version of the COND and DUSTY models of Allard et al. (Reference Allard, Hauschildt, Alexander, Tamanai and Schweitzer2001) with more modern opacities. The BT-SETTL model is described by Allard et al. (Reference Allard, Allard, Homeier, Kielkopf, McCaughrean and Spiegelman2007, Reference Allard, Homeier, Freytag and Sharp2012). The plotted lines are predicted synthetic magnitudes for the isochromes of Baraffe et al. (Reference Baraffe, Chabrier, Barman, Allard and Hauschildt2003) and Chabrier et al. (Reference Chabrier, Baraffe, Allard and Hauschildt2000a). For BT-SETTL 1, 3 and 5 Gyr isochrones are plotted as dotted, solid and dashed lines. For COND and DUSTY the 3 Gyr isochrone only is plotted.

However, all current models fail to match the details of the L/T transition. As can be seen in Figure 7 models fail to reproduce the sharpness of the transition as a function of effective temperature. Models also fail to reproduce the J-band brightening (see Section 2.3). The BT-Settl model also predicts J − K colours that continue to get bluer with lower effective temperatures, while observations show fairly constant J − K for mid to late T dwarfs (Figures 7 and 17).
Cloud species that condense at lower temperatures (including Cr, MnS, Na2S, ZnS and KCl) are considered by Morley et al. (Reference Morley, Fortney, Marley, Channon, Saumon and Leggett2012), and found to be helpful in explaining the colours and spectra of late-T and Y dwarfs (Leggett et al. Reference Leggett, Morley, Marley, Saumon, Fortney and Visscher2013).
4.5 Radiative transfer
Atmospheric models can differ significantly in their handling of radiative transfer, particularly in regards to the treatment of scattering. Radiative transfer involves the flow of radiation through an atmosphere as determined by the processes of absorption, emission and scattering. The radiative transfer equation can be written as (Bailey & Kedziora-Chudczer Reference Bailey and Kedziora-Chudczer2012):
 \begin{equation}
\mu \frac{dI_{\nu }(\tau ,\mu ,\phi )}{d \tau } = I_{\nu } (\tau , \mu , \phi ) - S_{\nu } (\tau , \mu , \phi )
\end{equation}
\begin{equation}
\mu \frac{dI_{\nu }(\tau ,\mu ,\phi )}{d \tau } = I_{\nu } (\tau , \mu , \phi ) - S_{\nu } (\tau , \mu , \phi )
\end{equation}
where I ν is the monochromatic radiance (sometimes referred to as intensity or specific intensity) at frequency ν, and is a function of optical depth τ, and direction μ, ϕ, where μ is the cosine of the zenith angle, and ϕ is the azimuthal angle. The source function S ν is given by:
 \begin{eqnarray}
S_{\nu } (\tau ,\mu ,\phi ) & = & \frac{\varpi (\tau )}{4 \pi } \! \! \int _0^{2 \pi } \! \! \! \! \int _{-1}^{1} \! \! \! \! P(\mu ,\phi ; \mu ^{\prime }, \phi ^{\prime }) I_{\nu } (\tau , \mu ^{\prime }, \phi ^{\prime }) d \mu ^{\prime } d \phi ^{\prime } \nonumber \\
&& \mbox{} + (1 - \varpi ) B_{\nu } (T) \nonumber \\
& & \mbox{} + \frac{\varpi F_{\nu }}{4 \pi } P(\mu ,\phi ; \mu _0, \phi _0) \exp\! {(-\tau / \mu _0)}
\end{eqnarray}
\begin{eqnarray}
S_{\nu } (\tau ,\mu ,\phi ) & = & \frac{\varpi (\tau )}{4 \pi } \! \! \int _0^{2 \pi } \! \! \! \! \int _{-1}^{1} \! \! \! \! P(\mu ,\phi ; \mu ^{\prime }, \phi ^{\prime }) I_{\nu } (\tau , \mu ^{\prime }, \phi ^{\prime }) d \mu ^{\prime } d \phi ^{\prime } \nonumber \\
&& \mbox{} + (1 - \varpi ) B_{\nu } (T) \nonumber \\
& & \mbox{} + \frac{\varpi F_{\nu }}{4 \pi } P(\mu ,\phi ; \mu _0, \phi _0) \exp\! {(-\tau / \mu _0)}
\end{eqnarray}
where the first term describes scattering of radiation into the beam from other directions according to single scattering albedo ϖ and phase function P(μ, ϕ; μ′, ϕ′), the second term is thermal emission, with B ν(T) being the Plank function and the third term is direct illumination of the atmosphere by an external source with flux μ0 F ν and direction μ0, ϕ0 (e.g. the Sun or host star).
It is the first term in Equation (5) involving the double integral that significantly complicates radiative transfer. This term has the consequence that the radiance in any one direction is dependent on the radiance in all other directions (since any of these can potentially scatter into the line of sight). In general it is then only possible to solve for the full angular dependence of the radiation field in all directions.
To avoid this complication the handling of scattering is often simplified, in some cases by ignoring it entirely, or by using a simplified form for the phase function P such as the assumption of isotropic scattering, and/or a simplified form for the angular depedence of I ν such as the two-stream approximation or the Eddington approximation. In stellar atmospheres approximate methods can be justified by the fact that scattering is generally of minor importance, and where it does become significant, in the form of Rayleigh scattering from molecules in cool stars, the phase functions are at least forward-backward symmetric.
Where clouds are present, however, the phase functions can be highly non-isotropic, and in the case of Solar system planet atmospheres, radiative transfer methods that more rigorously handle multiple scattering with non-isotropic phase functions are generally used. These include, in particular, versions of the discrete ordinate method originally due to Chandrasekhar (Reference Chandrasekhar1960) which has been developed into robust and general radiative transfer solving codes such as DISORT (Stamnes et al. Reference Stamnes, Tsay, Wiscombe and Jayaweera1988), SHDOM (Evans Reference Evans1998) and LIDORT (Spurr Reference Spurr2001). DISORT is used by Bailey & Kedziora-Chudczer (Reference Bailey and Kedziora-Chudczer2012) in the VSTAR code to model brown dwarf spectra. Another appropriate method is the adding-doubling method (de Kok et al. Reference de Kok, Helling, Stam, Woitke and Witte2011).
At present such methods are rarely used in exoplanet and brown dwarf atmospheric modelling, and this opens up the possibility of errors being introduced due to an oversimplified treatment of scattering. This was investgated by de Kok et al. (Reference de Kok, Helling, Stam, Woitke and Witte2011) for the thermal emission spectra of exoplanets who found that substantial errors can be introduced by neglecting scattering, or by using an isotropic scattering approximation where large particles are present.
4.6 Polarisation
Scattering processes polarise light, so a full treatment of radiative transfer should take account of polarisation. Light scattered from planetary atmospheres is expected to be polarised whereas the light of normal stars is mostly unpolarised (Bailey, Lucas, & Hough Reference Bailey, Lucas and Hough2010), and this polarisation can potentially be used as a means of differentially detecting planets in imaging observations (Schmid et al. Reference Schmid, Aime and Vakili2005; Keller Reference Keller, MClean and Iye2006), and as a means of characterising extrasolar planet atmospheres by observing the phase variation of polarisation (Seager, Whitney, & Sasselov Reference Seager, Whitney and Sasselov2000; Bailey Reference Bailey2007). Polarisation has also been measured in some brown dwarfs (Ménard, Delfosse, & Monin Reference Ménard, Delfosse and Monin2002; Zapatero Osorio, Caballero, & Béjar Reference Osorio, Caballero and Béjar2005; Tata et al. Reference Tata, Martín, Sengupta, Phan-Bao, Zapatero Osorio and Bouy2009) and is thought to result from scattering in the dust clouds combined with either rotational oblateness or a patchy cloud structure (Sengupta & Marley Reference Sengupta and Marley2010).
Polarisation is particularly useful for determining the nature and size of cloud particles. A classic application of polarisation was the analysis of the polarisation phase curve of Venus by Hansen & Hovenier (Reference Hansen and Hovenier1974) to determine that the clouds of Venus were composed of ~ 1 μm radius sulfuric acid droplets.
Polarisation should also, ideally, be included in all radiative transfer modelling involving scattering, because even if we are not interested in observing polarisation, neglecting polarisation can alter the resulting fluxes. Stam & Hovenier (Reference Stam and Hovenier2005) investigated this for reflected light from extrasolar giant planets and found that errors in geometric albedo of up to 9% could arise as a result of neglecting polarisation. In practice, however, polarisation is normally ignored in radiative transfer calculations, because including polarisation would substantially slow down the computations.
Polarisation in Earth-like planet atmospheres will be discussed later in Section 5.4.
5 THE SEARCH FOR HABITABLE PLANETS AND LIFE
The main focus of this review has been on the study of planetary atmospheres for which we have observations, and so far this has been almost entirely giant planets. The only exceptions to this are the super-Earths GJ 1214b and HD 97658b. Transit spectroscopy of GJ 1214b has been obtained (Bean et al. Reference Bean, Miller-Ricci Kempton and Homeier2010; Crossfield et al. Reference Crossfield, Barman and Hansen2011; Berta et al. Reference Berta2012; Kreidberg et al. Reference Kreidberg2014a) showing a featureless spectrum indicating an atmosphere either rich in water vapour, or with high altitude clouds. Transit spectroscopy of HD 97658b (Knutson et al. Reference Knutson2014b) also shows a featureless spectrum inconsistent with a cloud-free solar metallicity atmosphere.
In this section the potential for characterisation of Earth-like planets in the habitable zone of their stars is briefly reviewed.
5.1 The habitable zone
The habitable zone is defined as the range of distances from its star at which a planet has suitable conditions for liquid water to be able to exist at its surface. In the absence of an atmosphere the average surface temperature Teq of a planet is given by energy balance between radiation received from its star, and thermal radiation to space as:
 \begin{equation}
(1-a)S/4 = \sigma T_{eq}^4
\end{equation}
\begin{equation}
(1-a)S/4 = \sigma T_{eq}^4
\end{equation}
Where S is the total incident flux (W m−2) received from the star (in the case of the Earth this is the solar constant S 0 = 1 361 W m−2), a is the Bond albedo of the planet and σ is the Stefan-Boltzmann constant. The factor of 4 comes from the fact that radiation received over an area of πr 2 is redistributed over the entire surface of the planet with area 4πr 2. For Earth this calculation gives an equilibrium temperature of Teq ~ 255 K currently, and lower in the past as the solar luminosity increases with time and was about 30% less early in the Sun’s history (Bahcall, Pinsonnealt, & Basu Reference Bahcall, Pinsonneault and Basu2001).
The global average temperature of the Earth is, of course, higher than this at about T ~ 288 K, with the difference being due to the operation of the greenhouse effect that traps some of the outgoing radiation and causes the outgoing flux to be less than σT 4 eq . In general, from observations of the orbit of a planet we can determine S, but in most cases we won’t know the albedo a or the amount of the greenhouse effect, and so can’t directly determine the surface temperature of a planet from observations. According to Selsis et al. (Reference Selsis, Kasting, Levrard, Paillet, Ribas and Delfosse2007) Teq must be less than 270 K for a planet to be habitable.
Estimates of the locations of the edges of the habitable zone have been made based on the assumption of an Earth-like planet with a CO2/H2O/N2 atmosphere using cloud-free 1D radiative-convective models. Kasting, Whitmire, & Reynolds (Reference Kasting, Whitmire and Reynolds1993) gave the extent of the habitable zone from 0.95 AU to 1.37 AU for our Solar system, with the inner edge being set by the onset of the moist greenhouse process (Kasting Reference Kasting1988) causing loss of water to space, and the outer edge being set by cooling due to the formation of CO2 clouds. However Forget & Pierrehumbert (Reference Forget and Pierrehumber1997) showed that CO2 clouds actually cause warming and allow a more extended habitable zone. An upadated calculation is given by Kopparapu et al. (Reference Kopparapu2013) which sets the moist greenhouse inner edge at 0.99 AU, and the outer edge at 1.67 AU based on the maximum greenhouse criterion. On this basis the Earth is near the inner edge of the habitable zone.
These results can be scaled for other stars according to S/S 0, the flux received by the star as a fraction of the solar constant and the effective temperature of the star. A habitable zone calculator for this puropse based on the results of Kopparapu et al. (Reference Kopparapu2013) is availableFootnote 7 . The effects of different planet masses on the position of the habitable zone are considered by Kopparapu et al. (Reference Kopparapu, Ramirez, SchottelKotte, Kasting, Domagal-Goldman and Eymet2014) who find that the inner edge moves so as to give a wider zone for higher mass planets.
Recent studies using 3D climate models, however, have found the inner edge of the habitable zone at ~ 0.95 AU (Leconte et al. Reference Leconte, Forget, Charnay, Wordsworth and Pottier2013) or ~ 0.93 AU (Wold & Toon Reference Wolf and Toon2014), significantly smaller than the 1D models described above.
The results assume an Earth-like planet and could be different for other types of planets. Abe et al. (Reference Abe, Abe-Ouchi, Sleep and Zahnle2011) have shown that a more extended habitable zone is possible for a desert planet with limited surface water, and Zsom et al. (Reference Zsom, Seager, de Wit and Stamenković2013) find a miminum inner edge for the habitable zone of 0.38 AU for hot desert worlds. Pierrehumbert & Gaidos (Reference Pierrehumbert and Gaidos2011) have suggested that the greenhouse effect due to collision induced absorption in molecular hydrogen could allow habitable conditions to be maintained out to 10 AU from a G-type star.
5.2 Habitable zone planets
Table 9 lists planets that have been reported as being in or near the habitable zone with M sin i < 10M ⊕ or R < 2.5R ⊕. Note that the planet of τ Cet is only reported as a tentative detection (Tuomi et al. Reference Tuomi2012) and the reality of some of the planets of GJ 667C have been disputed (Gregory Reference Gregory2012; Feroz & Hobson Reference Feroz and Hobson2014). The reported habitable zone planets of GJ 581 (Mayor et al. Reference Mayor2009; Vogt et al. Reference Vogt, Butler, Rivera, Haghighipour, Henry and Williamson2010) have been excluded from the table based on the analysis of Robertson et al. (Reference Robertson, Mahadevan, Endl and Roy2014).
Low mass planets in or near the habitable zone.

Petigura, Howard, & Marcy (Reference Petigura, Howard and Marcy2013) have analysed Kepler data to find 10 planet candidates with radii of 1–2 R⊕ and within a habitable zone defined by 0.25 < S/S 0 < 4. Allowing for incompleteness they estimate that Earth-size planets in the habitable zone occur in 22 ± 8 % of stars. With the narrower definition of the habitable zone discussed above (0.99–1.67 AU, Kopparapu et al. Reference Kopparapu2013) this becomes 8.6%.
5.3 Detecting and characterising earth-like planets
The direct detection and characterisation of Earth-like planets is far more challenging than for the giant planets discussed in Section 3. The contrast ratio between an Earth-like planet and its star is ~ 10−10 at visible wavelengths and ~ 10−7 in the thermal IR ( ~ 10μm).
One concept is that of an infrared interferometer in space as first suggested by Bracewell (Reference Bracewell1978). This was developed into the Darwin (Cockell et al. Reference Cockell2009) and Terrestrial Planet Finder Interferometer (TPF-I, Beichman, Woolf, & Lindensmith Reference Beichmann, Woolf and Lindensmith1999) mission concepts. These involved several infrared telescopes flying in formation in space and combining their light to achieve nulling interferometry, so that the light of the star could be suppressed, and reveal the light of the planet. These missions would have aimed to both detect planets and obtain low resolution spectroscopy over the 6–20 μm range for atmospheric characterisation and biosignature detection.
An alternative concept was the Terrestrial Planet Finder Coronograph (TPF-C, Traub et al. Reference Traub, Monnier and Danchi2006). This was envisaged as a space telescope with an 8 by 3.5 m elliptical mirror, using advanced coronographic techniques to suppress starlight at the 10−10 level. It operated at visible wavelengths and would be able to detect planets and carry out spectroscopic characterisation.
Both Terrestrial Planet Finder missions (TPF-I and TPF-C) have now been cancelled by NASA, and the ESA Darwin mission study ended in 2007.
A further concept for starlight suppression involves the use of an occulter (or starshade) placed in front of the telescope. The occulter must use a petal shaped design to suppress diffraction and be placed about 40 000 km in front of the telescope (Cash Reference Cash2006). An occulter could be used in conjunction with the James Webb Space Telescope (Soummer Reference Soummer and Shaklan2009) and/or with a dedicated space telescope as in the New Worlds Observer (NWO, Turnbull et al. Reference Turnbull2012) mission concept. NWO would use a 4m telescope and enable detection and spectroscopic characterisation of exoplanets with R ~ 100 over 0.3–1.6 μm. The mission aims to achieve a 95% probability of detecting and characterising at least one habitable zone Earth-like planet. A more recent starshade mission concept is the Exo-S mission described in Section 6.
Extreme adaptive optics systems on giant ground-based telescopes are another potential approach to the detection and characterisation of Earth-like exoplanets. However, a number of studies have concluded that such systems on currently planned extremely large telescopes fall well short of the required sensitivity (Stapelfeldt et al. Reference Stapelfeldt, Whitelock, Dennefeld and Leibundgut2005; Mountain et al. Reference Mountain2009). However, (Angel Reference Angel, Fridlund and Henning2003) has suggested that detection with a 20-m ground-based telescope and spectroscopic characterisation with a 100-m telescope should be feasible taking advantage of an Antarctic site.
Kaltenegger & Traub (Reference Kaltenegger and Traub2009) considered the feasibility of characterising Earth-like planets using transit spectroscopy from a 6.5-m telescope in space (e.g. the JWST). They found that the signal-to-noise values for all important spectral features were of the order of unity or less per transit.
The situation for transit observations is much improved if the Earth-like planet is assumed to be in the habitable zone of an M-dwarf rather than a solar type star. This leads to both a larger transit signal, since the star is smaller, and more frequent transits. Pallé, Zapatero Osorio, & García Munöz (Reference Pallé, Osorio and Munöz2011) conclude that detection of atmospheric features in transiting Earth-like planets could be possible in planets orbiting very cool stars or brown dwarfs with the proposed 42-m European Extremely Large Telescope.
Snellen et al. (Reference Snellen, de Kok, Le Poole, Brogi and Birkby2013) have suggested the use of high resolution cross correlation techniques (see Section 3.3.2) to detect oxygen absorption during the transit of an Earth-like planet across a red dwarf star. They suggest this should be feasible with a ground-based telescope with an effective aperture of ~ 100 m and suggest this could be an array of low-cost ‘flux collectors’ which would not require high image quality.
5.4 Signatures of habitability
The presence of a planet within the habitable zone does not necessarily mean that it has habitable conditions on its surface. The best signature of habitability would be direct detection of the presence of liquid water. This is difficult to achieve using spectroscopy. While atmospheric water vapour can be detected through absorptions in the near-IR or thermal infrared, the presence of surface liquid water does not provide any clear spectroscopic signature.
A possible indicator of liquid water would be the presence of the ‘glint’ signal due to specular reflection from oceans. Williams & Gaidos (Reference Williams and Gaidos2008) modelled the light curves and polarisation phase depenence for Earth-like planets and showed that distinctive signals due to glint should be detectable for planets with surface oceans. Robinson, Meadows, & Crisp (Reference Robinson, Meadows and Crisp2010) used an Earth simulation to show that glint increases the brigthness of the Earth by as much as 100% at crescent phases. Zugger et al. (Reference Zugger, Kasting, Williams, Kane and Philbrick2010, Reference Zugger, Kasting, Williams, Kane and Philbrick2011) modelled glint effects including polarisation and found that the glint signal becomes diluted and more difficult to detect when clouds, aerosols and surface winds are included. Cowan, Abbott, & Voigt (Reference Cowan, Abbot and Voigt2012a) show, however, that latitude dependent albedo variations produce a signal in the phase curve very similar to that from glint, and therefore the glint signal may not be a reliable indicator of the presence of oceans.
Another potential way of detecting the presence of oceans is to use rotational changes in the brightness and colours (Ford, Seager, & Turner Reference Ford, Seager and Turner2001; Kawahara & Fujii Reference Kawahara and Fujii2010). Such observations can in principle determine the fraction of ocean and land coverage and even provide maps of the distribution. These ideas have been tested using observations of the integrated Earth from the EPOXI mission with the Deep Impact spacecraft (Cowan et al. Reference Cowan2009; Fujii et al. Reference Fujii, Kawahara, Yasushi, Fukuda, Nakajima, Livengood and Turner2011; Cowan & Strait Reference Cowan and Strait2013). Langford, Wyithe, & Turner (Reference Langford, Wyithe and Turner2009) used lunar Earthshine measurements to detect photometric changes associated with the passage of the specular reflection glint spot from land to ocean.
Liquid water clouds in a planet’s atmosphere could be detected through the presence of the primary rainbow which would appear as a peak in the phase curve at a phase angle of about 40 degrees. While the rainbow peak could be visible in the phase light curve, it is better defined, particularly for small cloud particles, in the polarisation phase curve (Bailey Reference Bailey2007; Karalidi et al. Reference Karalidi, Stam and Hovenier2012). The size of the disk integrated rainbow polarisation signal for the Earth has not been measured, but in principle could be obtained from lunar earthshine polarisation measurements. Current data however does not have sufficient phase coverage (Sterzik, Bagnulo, & Palle Reference Sterzik, Bagnulo and Palle2012; Takahashi et al. Reference Takahashi, Itoh, Akitaya, Okazaki, Kawabata, Oasa and Isogai2013; Bazzon, Schmidt, & Gisler Reference Bazzon, Schmid and Gisler2013).
5.5 Biosignatures
The ultimate aim of such studies is to make observations that would test for the presence of life on an exoplanet. A number of potential biosignatures have been suggested (e.g. Des Marais et al. Reference Marais2002) and tests have been made to determine whether these are actually visible in observations of the integrated Earth using spacecraft (Livengood et al. Reference Livengood2011) or lunar Earthshine measurements (Woolf et al. Reference Woolf, Smith, Traub and Jucks2002). Models of the integrated Earth spectrum have been presented by Tinetti et al. (Reference Tinetti, Meadows, Crisp, Fong, Fishbein, Turnbull and Bibring2006) and Robinson et al. (Reference Robinson2011).
The most important biosignature is generally considered to be atmospheric oxygen (O2) or ozone (O3). Oxygen is produced in the Earth atmosphere primarily by photosynthetic organisms. Possible abiotic sources of atmospheric oxygen that could lead to ‘false positivies’ have been discussed (Schindler & Kasting Reference Schindler and Kasting2000; Selsis, Despois, & Parisot Reference Selsis, Despois and Parisot2002; Segura et al. Reference Segura, Meadows, Kasting, Crisp and Cohen2007) but such cases appear to be unlikely, or can be excluded on the basis of other observations. Atmospheric O2 is detectable through a number of electronic absorption bands with the strongest being the A-band at around 760 nm. The longest wavelength O2 band with significant strength is the a-X band at 1.27 μm. The lack of O2 bands further into the infrared is a problem for life detection with instruments that work optimally at near-IR wavelengths (e.g. ground-based telescopes with extreme adaptive optics systems that work best at longer wavelenths). However, in the thermal infrared the band of ozone (O3) at 9.7 μm can be used. This is also considered to be a good biosignature since O3 is a photolytic by-product of O2.
Methane (CH4) is another potential biosignature. On Earth it originates largely from biological processes (methanogenic archaea), but there are also possible abiotic sources such as serpentenisation. The simultaneous presence of both oxygen and methane was suggested to be a good biosignature by Lovelock (Reference Lovelock1965) indicating chemical disequilibrium. Methane has strong absorption bands at 7 and 3.3 μm and a series of weaker bands through the near-IR. Segura et al. (Reference Segura2005) have suggested that CH4 and other reduced biogenic gases such as N2O and CH3Cl might be useful as biosignatures in planets around M dwarfs where these gases would have longer photochemical lifetimes than on Earth.
Another possible biosignature is the ‘red edge’, the sharp edge in the reflectance spectrum from vegetation at around 700-nm. This is a strong signal in light reflected directly from a vegetated area. However, in the integrated Earth, lunar Earthshine observations show a maximum effect of a few per cent (Hamdani et al. Reference Hamdani2006; Arnold Reference Arnold2008). Kiang et al. (Reference Kiang2007) suggested that spectral signatures could be different for photosynthetic pigments adapted for different stellar types, and Sanromá et al. (Reference Sanromá, Pallé, Parenteau, Kiang, Gutiérrez-Navarro, López and Montañés-Rodríguez2014) investigate the spectra of the Archaean Earth when purple bacteria were widespread giving rise to a slightly longer wavelength signal.
6 THE FUTURE
The characterisation of exoplanet atmospheres has made substantial progress over the last few years and some aspects of their composition and structure are beginning to be resolved. However, there are still many uncertainties and controversies that remain. The major limitation is in the observational data which are, in most cases, extremely limited in spectral resolution and wavelength coverage. Data from space instruments have proved most valuable for studying the transmission and dayside emission spectra of transiting planets, and so the next major advance is likely to be the James Webb Space Telescope due for launch in 2018. Its NIRSpec and MIRI instruments should make possible spectra of transiting planets across the near-IR and mid-IR spectral regions (Shabram et al. Reference Shabram, Fortney, Greene and Freedman2011; Belu et al. Reference Belu, Selsis, Morales, Ribas, Cossou and Rauer2011).
Another important mission is TESS (Ricker et al. Reference Ricker2014) that will carry out an all sky survey of bright stars for transiting planets. While it is not directly aimed at atmospheric characterisation, it may well find some of the best targets for more detailed studies. The ESA PLATO mission planned for 2024 launch (Rauer et al. Reference Rauer2013) is another mission that will search for planets transiting bright stars, and will target up to 1 000 000 stars. An exoplanet characterisation mission EChO (Tinetti et al. Reference Tinetti2012) was also proposed for the same launch opportunitiy but was not selected.
NASA is currently studying three missions with relevance to exoplanet characterisation. The Wide-Field Infrared Survey Telescope - Astrophysics Focused Telescope Assets (WFIRST-AFTA) concept (Spergel et al. Reference Spergel2013) is a 2.4-m wide field near infrared (0.6–2.0 μm) telescope. It is mainly aimed at wide field surveys, but the design includes a coronograph that enables it do characterisation observations of exoplanets by direct imaging. Exo-C (Stapelfeldt et al. Reference Stapelfeldt2014) is a 1.5-m unobscured Cassegrain telescope with a coronograph providing imaging of exoplanets over the wavelength range 450–1 000 nm. Exo-S (Seager et al. Reference Seager2014) is a 1.1-m telescope using the starshade concept (see Section 5.3) to provide imaging over the 400–1000 nm range. Exo-S should have the capability to detect Earth-size planets in the habitable zones of about 20 Sun-like stars.
New facilities on ground-based telescopes include improved instruments for direct imaging such as the Gemini Planet Imager (GPI Macintosh et al. Reference Macintosh, McLean, Ramsay and Takami2012) and SPHERE for the VLT (Bezuit et al. Reference Bezuit, Coudé, Gelino and Ribas2010). The new generation of extremely large telescopes now under development will open up new possibilities with planned instrument such as EPICS for the 42m E-ELT (Kasper et al. Reference Kasper, McLean, Ramsay and Takami2010) which will provide imaging, spectroscopy and polarimetry with a systematic contrast of 10−9 at 100 mas separation.
ACKNOWLEDGEMENTS
This research has benefitted from the M, L, T, and Y dwarf compendium housed at DwarfArchives.org. Use was also made of the L and T dwarf data archive of Sandy Leggett, the IRTF spectral library and the Database of Ultracool parallaxes maintained by Trent Dupuy. I thank Daniel Cotton and Brett Addison for valuable comments on the manuscript.
The work is supported by the Australian Research Council through Discovery grant DP110103167.


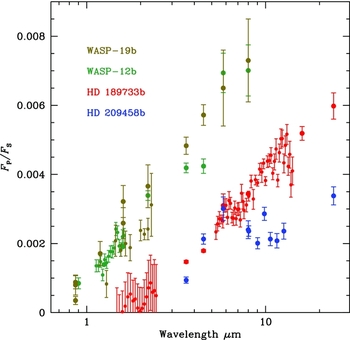


 Open access