


1. Introduction
Additive manufacturing (AM) is widely recognised for its ability to provide design freedom and enable the fabrication of complex geometries beyond what is possible with conventional subtractive or formative manufacturing methods. As a highly automated, tool-less process, AM is ideal for fabricating low-volume, individualised components. However, fully exploiting the design freedom offered by AM remains a challenge for designers. Here, tools such as topology optimisation enable the generation of lightweight, stiffness-optimised structures by iteratively redistributing material within a defined design space subject to loads and constraints (Reference Sigmund and MauteSigmund & Maute, 2013). More recently, Generative Design (GD) has emerged as a paradigm shift which completely changes the role of designers from defining, modelling and iterating geometries to defining constraints, loads, and objectives and iterating on the problem definition (Reference Saadi and YangSaadi & Yang, 2023). By fully automating the generation of multiple design iterations based on functional requirements and constraints, GD expands the solution space significantly (Reference Pilagatti, Vecchi, Atzeni, Iuliano and SalmiPilagatti et al., 2022) while often producing organic, non-intuitive forms that better exploit AM capabilities.
For designs requiring fit to complex and organic shapes, such as ergonomic devices fitted to the human body, defining the design boundary conditions is critical. Here, 3D scanning can serve as a bridge between the physical and digital domains. While industrial scanners are established and have been used for similar purposes (Reference Nesheim, Eikevåg, Steinert and ElverumNesheim et al., 2024), recent studies indicate that consumer-grade LiDAR technology such as that found in the iPad Pro, can achieve sub-1 mm accuracy in static conditions (Reference Teo and YangTeo & Yang, 2023), offering a viable low-cost alternative for capturing ergonomic surfaces. For instance, these accessible tools can enable agile companies to implement distributed manufacturing of components and products that require individualised interfaces.
An accessible and low-cost option for realisation of these designs is Material Extrusion (MEX), which is by far the most widespread AM technology (Reference Gibson, Rosen, Stucker and KhorasaniGibson et al., 2021), used by hobbyists as well as professionals. MEX offers a wide range of materials, including thermoplastics that have a proven track record in industrial use. A particularly interesting class of materials is high-temperature engineering polymers, materials that require processing temperatures higher than 250 °C (Reference Das, Chatham, Fallon, Zawaski, Gilmer, Williams and BortnerDas et al., 2020). Historically, processing of high-temperature engineering thermoplastics by MEX has been restricted to bulky and expensive industrial systems. However, following the 2021 expiration of the heated build chamber patent held by Stratasys (Reference Swanson, Turley, Leavitt, Karwoski, LaBossiere and SkubicSwanson et al., 2004), the market has seen an influx of desktop printers featuring actively heated chambers. Desktop printers such as the Bambu Lab H2D, can maintain chamber temperatures exceeding 60 °C and are advertised to support advanced engineering materials, including carbon fibre reinforced Polyamide 6 (PA6-CF).
Unlike commodity polymers such as polylactic acid (PLA), these engineering-grade composites can be used for end-use components operating in high-temperature environments, and for cyclic load-bearing applications (Reference Azizian-Farsani, Rouhi Moghanlou, Mahmoudi, Wilson and KhonsariAzizian-Farsani et al., 2025).
However, since MEX fundamentally is a layer-by-layer welding process, mechanical performance of parts is highly sensitive to thermal history. This is true for commodity polymers such as PLA (Reference Bauriedel, Albuquerque, Utz, Geis and RuckdäschelBauriedel et al., 2024), but far more critical for high-temperature, engineering-grade polymers (Reference Das, Chatham, Fallon, Zawaski, Gilmer, Williams and BortnerDas et al., 2020).
Taken together, we now have the key technologies in place that enable low-cost, rapid design and production of components with complex geometries. Yet there is great uncertainty regarding the mechanical performance that can be achieved at a component level with engineering-grade polymers on desktop printers. Furthermore, the suitability of using Generative Design tools which assume isotropic material behaviour for anisotropic MEX parts remains an open question. This study addresses these gaps by combining low-cost 3D scanning using an iPad Pro, Generative Design in Autodesk Fusion 360, and desktop MEX to fabricate and mechanically characterise a custom-fitted bicycle armrest in PA6-CF and PLA. The primary focus is on comparing the mechanical performance of the two materials at the component level, investigating the role of thermal processing conditions, and evaluating the limitations of current Generative Design tools for anisotropic materials.
2. Method
The overall method consisted of several steps. First, the individual’s forearm was scanned to create a digital representation, which was used for representing the surface interfacing with the human arm. Autodesk Fusion 360 Generative Design (Autodesk Inc., San Rafael, CA, USA) was then used to generate the structural, load-bearing geometry of the armrest which connects to the bike. The design was then fabricated by MEX, using two different materials: PA6-CF and PLA. The components were then mechanically tested until failure, using a universal testing machine with a custom-made test jig. Each step in the method is described in detail below.
2.1. 3D scanning and modelling
The forearm geometry was scanned with an Apple iPad Pro, using the LIDAR sensor. A custom PLA-printed arm fixture was used to stabilise the arm and provide an unobstructed view of the underside of the forearm that would be in contact with the armrest during use. The scanning process lasted approximately 2 minutes. An overview of the workflow from scanning to final geometry is shown in Figure 1 and comprised the following steps: (1-2) scanning the forearm; (3) generating a mesh from the scanned data; (4) isolating the relevant forearm segment; (5-7) constructing a cylindrical surface with vertices snapped to the mesh; (8) symmetrically thickening the surface by 3 mm; (9) converting the thickened surface to a mesh for Boolean subtraction of the forearm geometry, yielding an anatomical imprint; and (10-11) reconverting to a solid body followed by iterative refinement to the desired form.
Process flow from 3D scan setup to forearm rest geometry

Figure 1 Long description
Panel 1: A person's arm is being scanned using a 3D scanning device. Panel 2: A person's arm is raised, likely for further scanning or measurement. Panel 3: A 3D model of an arm is displayed, indicating the initial digital representation. Panel 4: A digital model of a forearm rest with material distribution is shown. Panel 5: A cylindrical mesh is displayed, likely representing a part of the design process. Panel 6: A detailed view of the forearm rest with a mesh overlay is shown. Panel 7: The forearm rest model is being refined with additional material and structural details. Panel 8: Further refinement of the forearm rest model with more detailed material distribution. Panel 9: The forearm rest model is shown with a smooth, finalized surface. Panel 10: The forearm rest model is displayed in a metallic finish, indicating a final product stage. Panel 11: The final forearm rest product is shown, ready for use.
2.2. Generative design
Fusion 360 Generative Design was used to generate the optimised geometries. The design criteria were Maximize Stiffness with Mass Target 60.0 g, Safety Factor 1.0 using Unrestricted Manufacturing. Figure 2 shows the GD design space and design conditions.
The Structural Load was adjusted in an iterative manner. Initially set to 400 N, based on an estimated realistic in-use load, about half the body weight of an 80 kg person. It was then incrementally reduced to ensure that the component would fail within the 5 kN capacity of the test machine. The final load used in the GD study was 150 N, and destructive testing of a test print verified failure within the machine limitations. The material properties in GD were defined based on the datasheet for Polymaker PA6-CF (dry condition) with the out-of-plane properties used for conservative values: Elastic modulus (Z) 4713 MPa and tensile strength (Z) 67.7 MPa. The same geometry was used for the PLA specimens to isolate the material as the only variable.
Design space and design conditions. A: obstacle geometry, B-E: applied loads with fixed constraint applied on the surface underneath the clamp

2.3. Fabrication
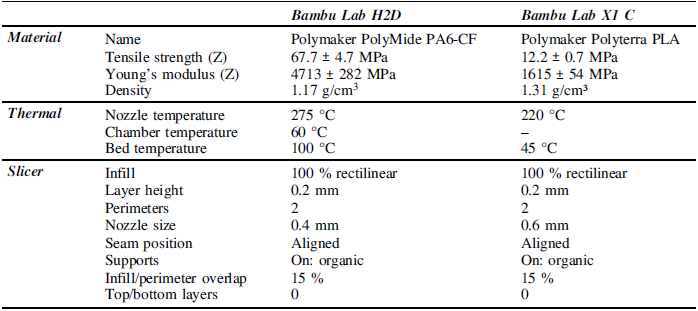
Bambu Studio was used to slice the components, the slicer and print parameters are given in Table 1. The PA6-CF components were printed on a Bambu Lab H2D printer, while the PLA components were printed on a Bambu Lab X1 Carbon. Prior to printing, the PA6-CF filament was dried at 85°C for 24 hours and maintained in this state during printing. The PLA was kept in a dry chamber with relative humidity (RH) below 2 % during printing. Three components of each material were manufactured and stored in the dry chamber until they were mechanically tested.
Materials, printer and slicer parameters for PA6-CF and PLA

2.3.1. Thermal monitoring
A thermal camera, Infiray P2 PRO, was used to capture thermal data during the printing process of the PA6-CF. The camera was mounted on a custom bracket inside the printer, angled at approximately 40° towards the build plate, enabling the chamber to remain closed throughout printing. The camera has a measuring range of −20 °C to 550 °C with a measuring accuracy of ±2 °C or ±2%, a framerate of 25 Hz and a resolution of 256x192 pixels. Rectangular measurement zones were defined in the camera software to acquire the minimum, maximum and average temperatures of the cross sections during printing. The smallest strut cross-sections occupied only a small number of pixels in the thermal image, meaning that the rectangular measurement zones do not conform precisely to strut boundaries. To mitigate this, the reported temperatures correspond to the maximum temperature within the measurement zone at the lowest point between deposition cycles.
2.4. Mechanical testing
The printed components were mounted to a rigid metal plate which was fixed to a universal testing machine, MTS Criterion Model 42, see Figure 3. To transfer the loads to the component, a model of the scanned forearm was printed in PLA with 100 % infill. The mechanical test setup parameters were: 0.1 mm/s displacement, maximum strain limit of 0.5 mm/mm (at which point the test was terminated) and 10 Hz sampling rate. Data post processing was performed using Python, and the absorbed energy was estimated by calculating the area under the load-displacement curve, using the composite trapezoidal rule implemented via the NumPy library (Reference Harris, Millman, van der Walt, Gommers, Virtanen, Cournapeau, Wieser, Taylor, Berg, Smith, Kern, Picus, Hoyer, van Kerkwijk, Brett, Haldane, del Río, Wiebe, Peterson and OliphantHarris et al., 2020).
3D-model of test setup (left), and fully assembled setup ready for mechanical testing (right). The Z-axis indicates the direction of the force

3. Results
3.1. Generative design
More than 30 GD runs were iteratively conducted before arriving at the final GD study design. The evolution of the selected design is shown in Figure 4. The GD results converged after 35 iterations and resulted in a component with the defined mass target of 0.06 kg, a minimum thickness of 4.25 mm and a maximum von Mises stress of 66.9 MPa.
Progress of GD iterations and the resulting design at different stages

3.2. Fabrication
An overview of the fabricated components is shown in Figure 5. The PA6-CF components had layer and surface defects in the smallest cross sections of the structure. Specimen 3 experienced severe layer shift problems and specimens 1 and 2 exhibited visible z-seams and oozing, resulting in a visible z-seam along the thinnest strut. The PLA components had fewer print defects overall, where minor stringing was the only issue. Despite the print defects, the mass of the specimens was very consistent. Given the difference in density between the two materials, the expected weight of the PLA specimens was 67.1 g. Table 2 shows an overview of the mass for each specimen.
Overview of the fabricated components

Measured mass difference from expected mass for PA6-CF and PLA components

3.2.1. Thermal measurements
Four different zones with a total of ten cross-sections were thermally captured and analysed. Figure 6 shows an overview of the measured sections, together with the average temperature of the measured sections and corresponding estimated layer times, according to Bambu Studio. The lowest cross section temperature was 87.4 °C.
Thermal measurements during printing (a). Estimated layer time from the slicer (b)

Figure 6 Long description
Panel A: A side view of a printed component mounted on a rigid metal plate. The component is labeled with various temperature measurements at different layers, ranging from 88.0 degrees Celsius to 136.3 degrees Celsius. The build plate is shown at the bottom. Panel B: A side view of the same printed component with a color gradient indicating estimated layer time. The color gradient ranges from green to purple, with corresponding times from 93.3 seconds to 6.2 seconds.
3.3. Mechanical testing
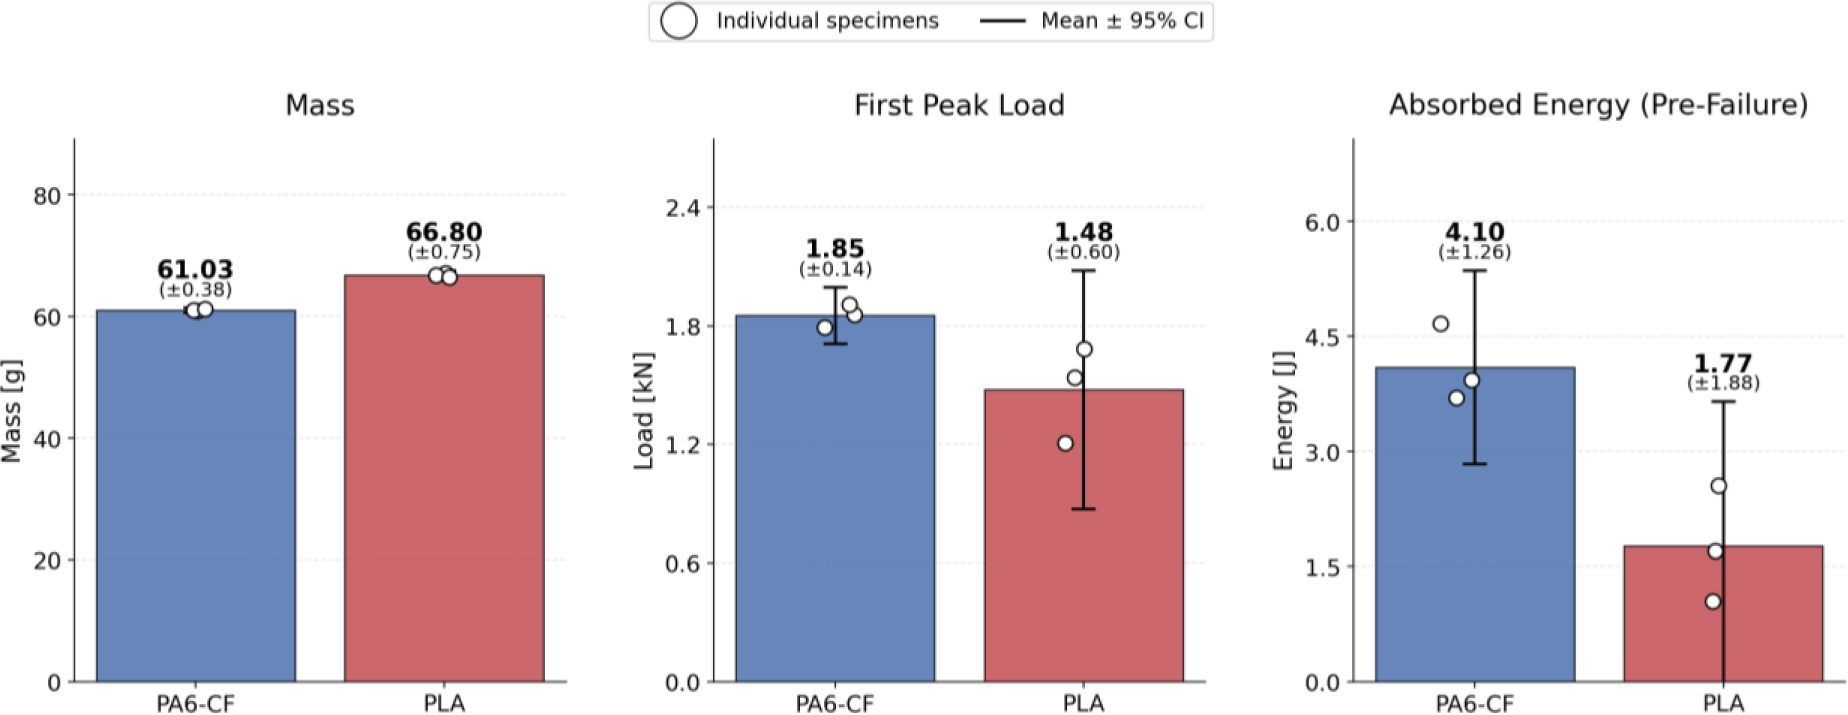
The load-displacement curves for all specimens are presented in Figure 7. The PA6-CF specimens exhibited multiple load-drops before abrupt failure. Audible cracking and slipping sounds during testing corresponded well with the load-displacement behaviour. The maximum recorded peak load was 1.9089 kN, and the highest energy absorption was 4.67 J. Two PLA specimens (specimens 1 and 3) continued to absorb energy after initial failure. The highest pre-failure load was 1.6825 kN, and the maximum absorbed energy before failure was 2.56 J. Figure 8 shows means of mass, first peak load, and absorbed energy, together with 95 % confidence interval. The PA6-CF specimens show less spread than the PLA specimens across all measured values (mass, first peak load and absorbed energy).
The specimens post failure are shown in Figure 8. For PA6-CF, specimen 1 experienced a single failure of the shortest strut in the GD structure, whereas specimen 2 exhibited multiple fractures at five locations within the GD structure and in the clamp geometry. Specimen 3 showed a similar failure pattern to specimen 2, but with failures located higher in the structure, closer to the scanned surface. For PLA, specimen 1 fractured at seven locations throughout the structure and continued to carry load after the initial failure. Specimens 2 and 3 both failed at the clamp, although specimen 3 continued to carry additional load after the initial failure.
Load-displacement curves for all specimens

Means and 95 % confidence intervals of specimen mass, first peak load, and absorbed energy (pre-failure)

Post failure, fractured specimens

3.3.1. Fracture surfaces
Example of fracture surfaces, PA6-CF (a), PLA (b)

Figure 10 shows examples of the fracture surfaces of the broken PA6-CF and PLA components. The two materials exhibit distinctly different failure mechanisms. The PA6-CF specimen showed brittle failure, characterised by a planar, relatively smooth fracture surface indicating predominantly interlayer separation. PLA, on the other hand, displayed an irregular and rough fracture surface, indicating a more complex failure spanning multiple layers.
4. Discussion
This study demonstrated how GD can be combined with 3D scanning and AM to produce a load-bearing structure with a custom-scanned interface, a geometry that would not be feasible to model with CAD tools alone. The resulting component weighed 60 grams and successfully supported loads well beyond what a human would exert, highlighting the potential for accessible, individualised production. However, the results also highlight a critical gap between the theoretical potential of GD and the physical realities of AM. As previous studies have highlighted, GD has a major effect on the design process; it fundamentally shifts the role of the designers from modelling the design to defining the problem, constraints, loads and objectives (Reference Saadi and YangSaadi & Yang, 2023).
GD generates optimised load-bearing structures; however, the quality of the outcome is entirely dependent on factors defined within the GD environment and the AM process itself. Over 30 GD iterations were performed to refine the study, with the applied load progressively adjusted from 400 N down to 150 N. These adjustments were guided primarily by intuition and prior experience, which underscores the criticality of using correct parameters, particularly representative material models. GD in Fusion is based on the von Mises yield criterion, which assumes isotropy and ductility. However, PA6-CF and PLA do not meet these assumptions as they are highly anisotropic and brittle. These findings align with other studies that have found unpredictability of GD structures made out of PLA (Reference Peckham, Elverum, Hicks, Goudswaard, Snider, Steinert and EikevågPeckham et al., 2024).
As this study has demonstrated, the material properties of components manufactured from engineering grade polymers are far from what is expected based on the datasheet of the material. Previous research has shown that PA6-CF is highly sensitive to thermal processing conditions, where mechanical performance is strongly influenced by layer temperature (Reference Bjørken, Andresen, Eikevåg, Steinert and ElverumBjørken et al., 2022). For the armrest, the highest recorded temperature was observed in the largest cross-sectional area of the struts, which is expected since it has the highest thermal mass. Increasing the thickness of the thinner struts would have enhanced the thermal retention, leading to an improvement in mechanical properties beyond the stress reduction from the increased cross section. This observation means that thermal mass is an important factor to consider when designing components for printing on desktop printers with inadequate chamber temperature. The fracture surfaces of the two materials show distinctly different failure mechanisms. PA6-CF shows an interlayer failure where the layers have cleanly separated, while the PLA exhibited a far more complex and irregular fracture surface across multiple layers. The post-failure load-bearing capacity exhibited by PLA specimens 1 and 3 is most likely caused by post-fracture interlocking, enabled by the irregular multi-layer fracture surface. Specimen 2, by contrast, lost load-carrying capacity immediately upon failure. This variability is not unexpected given the loading conditions where the component operates in compression with slender struts susceptible to buckling. Small differences in crack path can determine whether fractured surfaces re-engage or separate completely.
A recent study (Reference Ørnes, Elverum, Sasson and EikevågØrnes et al., in press) investigated the effect of layer temperature and covered the range observed during printing of the armrest (87-136 °C). The findings indicate that the interlayer UTS can be expected to fall within 15-40 % of the datasheet values. In the present mechanical tests, PA6-CF exhibited approximately 25 % higher pre-failure load capacity than PLA, whereas datasheet values suggest it should be about 450 % higher than PLA, if we consider interlayer strength to be the limiting factor. Energy absorbed pre-failure was substantially higher for PA6-CF specimens, averaging 4.10 J, compared to 1.77 J for PLA, an increase of 230 %, indicating a significantly tougher material. Collectively, these results underscore the importance of defining intent and requirements of prototypes when using printed components in iterative design processes. For example, if the prototype is to be used only for a single test without exposure to high temperatures or cyclic loading, commodity polymers such as PLA may be preferable. Conversely, PA6-CF can sustain high temperature environments and cyclic loading (Reference Azizian-Farsani, Rouhi Moghanlou, Mahmoudi, Wilson and KhonsariAzizian-Farsani et al., 2025), even though its performance remains far below datasheet specifications when printed on a desktop printer.
The study has several limitations that limit the generalisability of the findings. First, relying on prior experience and iteratively adjusting the load to compensate for discrepancies between the designed and actual load-bearing capacity is not a robust approach. This issue partly arises because the components were dimensioned solely based on interlayer strength, whereas a more realistic approach would use a combination of interlayer and intralayer strength. Second, to compare the performance of the two materials, the same GD geometry was used for both materials. Since the material properties define the GD geometry outcome, this could have put the PLA component at a disadvantage, and ideally the same nozzle sizes should have been used to print the specimens. Third, the PA6-CF specimens exhibited multiple print defects that could likely have been mitigated through optimised print settings and iterating on the design itself. Furthermore, several of the specimens failed in the clamping region; here, further iterations could have ensured failure in the GD load-bearing area. Fourth, mechanical testing was limited to quasi-static loading with a small sample size, excluding fatigue, impact and environmental testing such as humidity, which will have major effect on the highly hygroscopic PA6-CF (Reference Miri, Persyn, Lefebvre and SeguelaMiri et al., 2009). Fifth, because the component operated under compression and relied on thin struts, buckling represents a critical failure mode that was not addressed in the GD study. Additionally, the load case caused two of the PLA components to interlock after initial failure, which allowed them to continue carrying an increasing load, which was not intended or fully explored.
5. Conclusion
This study investigated the mechanical performance of a generatively designed, custom-fitted bicycle armrest fabricated using desktop MEX in PA6-CF and PLA. Consumer-grade 3D scanning with an iPad Pro and Generative Design in Autodesk Fusion 360 were used to define the component geometry. The resulting organic and ergonomic structure weighed only 60 g and withstood peak loads above 1.8 kN, far exceeding typical in-use demands.
Mechanical testing revealed that PA6-CF printed on a desktop 3D printer with a heated chamber outperformed PLA by 25 % in pre-failure peak load, despite material datasheet values suggesting a 450 % advantage in interlayer strength. Thermal measurements during printing revealed low layer temperatures (87–136 °C) in critical load-bearing sections, leading to poor interlayer bonding. This was supported by fracture surfaces indicating a clean interlayer failure.
These findings highlight two major current gaps: 1) Generative Design tools such as Generative Design in Fusion 360 rely on isotropic material models and the von Mises criterion, both unsuitable for anisotropic MEX parts. Designers must rely on prior experience, empirical data, and iterative adjustments to achieve the desired outcome. In this study, the applied load was reduced from a realistic 400 N to 150 N to achieve a viable design. 2) Although recent desktop printers are marketed for high-temperature engineering polymers, their limited chamber temperatures prevent materials like PA6-CF from approaching the mechanical properties in line with the listed material specifications.









 Open access

