


Introduction
Phyllotreta flea beetle species (Coleoptera: Chrysomelidae) are some of the most damaging and chronic pests in canola crops, Brassica napus (Linnaeus) (Brassicaceae), across North America (Lamb and Turnock Reference Lamb and Turnock1982; Lamb Reference Lamb1989). The most common Phyllotreta species in the Canadian prairies are the crucifer flea beetle, Phyllotreta cruciferae (Goeze), and the striped flea beetle, Phyllotreta striolata (Fabricius) (Soroka et al. Reference Soroka, Grenkow, Otani, Gavloski and Olfert2018). Flea beetles cause economic damage on canola seedlings before the four-leaf stage on the cotyledons, leaves, and stems of the plant (Lamb Reference Lamb1984; Brandt and Lamb Reference Brandt and Lamb1993; Ortega-Ramos et al. Reference Ortega-Ramos, Coston, Seimandi-Corda, Mauchline and Cook2021; Cornelsen et al. Reference Cornelsen, Ort, Gabert, Epp and Rempel2024; Mittapelly et al. Reference Mittapelly, Guelly, Hussain, Cárcamo, Soroka and Vankosky2024). Flea beetle damage on canola seedlings can occur on the stem and on both sides of cotyledons and leaves; however, due to scouting efficiency, damage is typically recorded only from the upper side, which forms the basis for the action threshold (Mittapelly et al. Reference Mittapelly, Guelly, Hussain, Cárcamo, Soroka and Vankosky2024). A previous study suggested that the upper sides of cotyledons and leaves are preferred by flea beetles and that stem feeding occurs evenly across the entire stem (Brandt and Lamb Reference Brandt and Lamb1993). Stem damage can significantly impact plant health because severe damage may break the stem or disrupt the root–shoot connection, thereby cutting off the flow of water and nutrients essential for growth (Brandt and Lamb Reference Brandt and Lamb1993). Brandt and Lamb (Reference Brandt and Lamb1993) reported that flea beetle damage to stems did not differ between Brassica species. However, factors regulating flea beetle-induced stem damage have not been studied, which leaves gaps in our understanding of how flea beetles feed on the entire canola seedling and a lack of insight into flea beetle monitoring.
The main chemical treatment for flea beetles that is currently used in Canada is coating seeds with systemic neonicotinoid insecticides. This treatment is used in more than 90% of canola fields (Soroka et al. Reference Soroka, Grenkow and Irvine2008; Sekulic and Rempel Reference Sekulic and Rempel2016; Cornelsen et al. Reference Cornelsen, Ort, Gabert, Epp and Rempel2024). Foliar insecticides are used to complement seed treatments when flea beetle damage exceeds 25% cotyledon and leaf damage per plant during the critical stage in canola growth, which is up to the four-leaf stage (Ekbom Reference Ekbom and Williams2010; Tangtrakulwanich et al. Reference Tangtrakulwanich, Reddy, Wu, Miller, Ophus and Prewett2014). To successfully integrate nonchemical control methods into current practices used by canola farmers, a better understanding is needed of what affects the interactions that flea beetles have with canola as their host plant. Numerous gaps in research exist regarding what factors affect flea beetle feeding behaviour on canola, such as the effects of temperature, plant density, and generalist predators.
Any fluctuations in temperature have the potential to change insect behaviours, including foraging, locomotion, reproduction, and microhabitat selection due to either physiology-based changes or adaptive behaviours to changing environments (Abram et al. Reference Abram, Boivin, Moiroux and Brodeur2017). Higher temperatures increase insects’ metabolic rate, which in turn leads to an increase in development, movement, and feeding rates (Ma et al. Reference Ma, Ma and Pincebourde2021; Ahmed et al. Reference Ahmed, Zahar, Gribkova, Nikolaeva, Dwijendra and Suksatan2022). It has been thought that the striped flea beetle has a more plastic response to temperatures than the crucifer flea beetle does, which results in a greater abundance of striped flea beetle in the spring when temperatures are cooler (Soroka et al. Reference Soroka, Grenkow, Otani, Gavloski and Olfert2018). To date, however, no studies demonstrate the direct effects of temperature on damage per plant, which is an important first step in understanding how to monitor canola seedlings more efficiently.
Dosdall et al. (Reference Dosdall, Dolinski, Cowle and Conway1999) and Dosdall and Stevenson (Reference Dosdall and Stevenson2005) investigated the impact of cultural control practices such as planting date, tillage regimes, row spacing, and plant density on flea beetle management. Lundin et al. (Reference Lundin, Myrbeck and Bommarco2018) showed that earlier planting dates decrease defoliation, most likely due to the plants avoiding peak flea beetle emergence times and to a lower likelihood of hot, dry weather, which favours higher damage by flea beetles. Reduced or no-till planting and increased row spacing were found to reduce defoliation by flea beetles, the latter possibly due to an increase in the time the beetles spend searching where wider rows provide greater visual contrast (Dosdall et al. Reference Dosdall, Dolinski, Cowle and Conway1999). Increasing plant density has been shown to decrease canola defoliation under field conditions (Dosdall et al. Reference Dosdall, Dolinski, Cowle and Conway1999; Dosdall and Stevenson Reference Dosdall and Stevenson2005; Lundin Reference Lundin2020; Woodland Reference Woodland2024). However, previous research has not monitored flea beetle abundance in response to plant density to determine what mechanisms explain the observed damage reductions. Previous studies were conducted under variable environmental conditions with naturally occurring flea beetle populations, and no studies have been done under controlled conditions. Finally, none of these cultural management strategies is widely used to manage flea beetle populations in canola, which still rely strongly on chemical management strategies (Mittapelly et al. Reference Mittapelly, Guelly, Hussain, Cárcamo, Soroka and Vankosky2024).
Generalist predators have been shown to be effective at reducing pest populations in integrated pest management (Symondson et al. Reference Symondson, Sunderland and Greenstone2002), but their role in reducing flea beetle populations in canola remains mostly unknown. A few predators have been observed feeding on adult flea beetles under field conditions; these include lacewing larva (Neuroptera: Chrysopidae) (Burgess Reference Burgess1980), one damsel bug (Hemiptera: Nabidae) (Burgess Reference Burgess1982), the spined soldier bug (Hemiptera: Pentatomidae) (Culliney Reference Culliney1986), and fall field crickets (Orthoptera: Gryllidae) (Burgess and Hinks Reference Burgess and Hinks1987). Ekbom et al. (Reference Ekbom, Kuusk, Malsher, Åström and Cassel-Lundhagen2014) reported flea beetle DNA in the gut contents of wolf spiders (Araneae: Lycosidae) collected in winter canola fields in Sweden. These studies indicate the potential of some predators to have direct, consumptive effects on flea beetles, but there may also be indirect, nonconsumptive negative effects of predators by altering prey behaviour (Schmitz et al. Reference Schmitz, Beckerman and O’Brien1997). For example, cucumber beetles (Coleoptera: Chrysomelidae) reduce their feeding and are more likely to emigrate when exposed to predator chemical cues (Snyder and Wise Reference Snyder and Wise2000; Kahl et al. Reference Kahl, Leslie and Hooks2020). Other beetles have shown to reduce activity, including mating and feeding, when exposed to nonlethal predators (Dupuy and Ramirez Reference Dupuy and Ramirez2019). Research is needed on predator species that are capable of consuming flea beetles, as well as on their potential nonconsumptive effects, to understand the importance of generalist predator conservation in canola agroecosystems.
Monitoring canola for flea beetle damage currently consists of visual assessments of percent defoliation ranging between 0% and 100% of cotyledons and true leaves (Palaniswamy et al. Reference Palaniswamy, Lamb and McVetty1992). Monitoring starts at canola emergence and continues until the four-leaf stage, which is the vulnerable period of canola growth (Sekulic and Rempel Reference Sekulic and Rempel2016). The components of the overall defoliation observed can be variable. For example, flea beetles may produce a high amount of damage on a low number of plants, which may show a similar average to a low amount of damage on many plants. Therefore, overall damage should be examined in two different ways to relate to flea beetle feeding behaviour: prevalence and intensity. Prevalence is the proportion of plants attacked, and intensity is the average amount of damage observed on only attacked plants (Lamb and MacKay Reference Lamb and MacKay2010). These variables are both components of the first variable, “overall damage”, whereby prevalence multiplied by intensity equals the overall damage (Lamb and MacKay Reference Lamb and MacKay2010). Separating canola damage prevalence and intensity is important because each of the two factors provides insights into different aspects of how canola can compensate for flea beetle damage (Gavloski and Lamb Reference Gavloski and Lamb2000a, Reference Gavloski and Lamb2000b). Measuring prevalence can provide insight into how many plants are damaged in one area (patch level), whereas measuring intensity can provide insight into how much damage each affected plant has (plant level). In addition, nonconsumptive predator effects may affect prevalence and intensity differently, which may explain whether flea beetles change the number of plants they visit and whether they decrease their feeding per visited plant in the presence of a predator.
The present study aims to fill several gaps in our knowledge of the interactions of flea beetles with canola and generalist predators and how temperature affects their feeding on canola. Specifically, we tested (1) how temperature affects flea beetle feeding on cotyledons and stems, (2) how plant density affects flea beetle damage, and (3) how generalist predators affect flea beetle survivorship and damage. We hypothesised that (1a) flea beetle damage would increase with temperature, (1b) striped flea beetles would cause more damage than crucifer flea beetles would at low temperatures; (2) increased plant density would reduce plant damage through a dilution effect; (3a) predators would reduce flea beetle survivorship; and predators would reduce canola damage (3b) directly by consumptive impacts on flea beetles and (3c) indirectly by nonconsumptive impacts on the beetles. In addition, (4) we predicted that stem damage can be accurately estimated and correlated to cotyledon damage.
Methods
Insect and plant material
The striped flea beetles and the crucifer flea beetles used in the experiments in the present study were collected from nearby canola fields around Winnipeg, Manitoba, Canada, via sweep-netting one to two weeks before each trial (June–September each year). Striped flea beetles were also collected from colony-reared cages maintained following the methods outlined in Nagalingam and Costamagna (Reference Nagalingam and Costamagna2019). Field-collected flea beetles were maintained in BugDorm cages (BugDorm-4E4545, MegaView Science Education Services Co., Ltd., Taichung, Taiwan) with canola at the cotyledon stage for food under the same conditions as the striped flea beetle colony was. All colony-reared striped flea beetles used in the experiments in the present study ranged in age from 4 to 9 days after adult emergence. Predators were collected using live pitfall traps set in canola fields near Winnipeg, Manitoba, from 7 July to 10 September 2020 (experiment 3) and from 18 June to 28 August 2021 (experiment 4). Pitfall traps consisted of a removable plastic container (7.5 cm height, 11.5 cm diameter) fitted inside a larger, stationary plastic container (14 cm height, 11.5 cm diameter) to easily remove the trapped predators. Each trap was covered with a wire mesh (2.5-cm2 mesh size) at ground level to prevent larger animals from falling in and with a plastic covering (16 cm2) held approximately 5 cm above ground level by four metal nails to prevent rain from flooding the container. The pitfall traps had approximately two centimetres of soil and leaf litter added for refuge and either a water- or beer-soaked sponge to provide moisture and to attract predators. Predators were brought back to the laboratory and stored in individual vials that contained moistened filter paper and freeze-dried crickets for food. All predators and flea beetles were starved for 24 hours before trials. Filter paper in predator vials was moistened and replaced as necessary, and damp sponges were added to the flea beetle cages to maintain humidity. Insect specimens were kept in 95% ethanol and identified to species or genus using taxonomic keys. The ground beetles were also compared to reference specimens of the J.B. Wallis/R.E. Roughley Museum of Entomology at the University of Manitoba (Winnipeg) that previously had been identified by specialists. Ground beetles were identified using Lindroth’s (Reference Lindroth1961, Reference Lindroth1963, Reference Lindroth1966, Reference Lindroth1968, Reference Lindroth1969a, Reference Lindroth1969b) and Bousquet’s (Reference Bousquet2010) keys. Spiders were identified using Dondale and Redner’s (Reference Dondale and Redner1990) key. Voucher specimens of the insect predators used have been deposited in the J.B. Wallis/R.E. Roughley Museum of Entomology.
Canola seeds were planted in mycorrhizae potting soil (PRO-MIX M; Premier Tech Horticulture, Rivière-du-Loup, Quebec, Canada) in a plastic tray and grown for five days until they reached the cotyledon stage at 22 ˚C, 16:8–hour light:dark photoperiod, and 70% relative humidity. Only canola seedlings that were 9–11 mm across at the widest point of the cotyledon (length) and approximately 5 ± 1 mm (4–6 mm range) across at the main vein (width) were used. These seedlings were then randomly transplanted into each “microcosm” (see the section, Microcosm setup) according to the appropriate plant density or cut at the base of the stem where it meets the soil in the case of the predation assays in Petri dishes. All experiments were conducted under controlled temperature and relative humidity conditions (specified per experiment below) using reach-in Percival growth chambers (1-35LVL; Percival Scientific, Perry, Iowa, United States of America). Temperature regimes among growth chambers were rotated among trials within and between experiments so that potential growth chamber effects were not confounded with temperature and relative humidity regimes.
Stem damage estimation
Feeding pits on all canola seedling stems were typically oval. To obtain an estimation of stem pit area, a new method to estimate stem damage was developed using a modified oval equation defined as
 $$est.damage \ per \ stem \ [mm^2]=\sum(n_{pits \ in \ size\ x})(\pi\ .\ 0.2mm \ . \ {x \ mm \over 2})$$
where there are three size categories (x) — 1 (< 1 mm), 2 (1–2 mm), or at least 3 mm — n is the count of pits in each size category (x), and the summation of all size categories estimates the area of all stem pits (mm2). For example, for a stem with three pits smaller than 1 mm (i.e., x = 1) and four pits at least 3 mm (i.e., x = 3), the total damage is estimated as [3 × (π × 0.2 mm × 1 mm /2)] + [4 × (π × 0.2 mm × 3 mm /2)] = 4.71 mm2.
A 40-mm × 65-mm transparent plastic rectangle marked with three lengths was used to classify the pit length into one of three predefined size categories (see Supplementary material, Fig. S1). An average width of 0.2 ± 0.05 mm was measured from a random subsample of 60 pits from stems in experiments 2 and 4 (see Method section for those experiments, below) and used as the standard width in the equation. The number of pits in each length size category was recorded per stem. The length of each pit was multiplied by the width and by the number of pits per size category to achieve an estimated area of damage per stem (mm2). On the same stems used above (n = 45), actual pit areas were measured from digital images using GIMP photo-editing software (GIMP Development Team 2019). A simple linear regression comparing the estimated damage (i.e., using equation (1), above) and the actual damage (i.e., measuring the digital pictures) showed high accuracy for the simplified method of estimating stem damage (F 1,45 = 424.7, P < 0.00001, R 2 = 0.90, n = 45; Y = 1.10X – 0.11; Supplementary material, Fig. S2). Therefore, equation (1) was used to estimate stem damage in experiments 2 and 4.
All data analyses for this experiment and for subsequent experiments were performed using R, version 4.2.1 (R Core Team 2023).
Cotyledon damage estimation
In experiment 1, cotyledon damage was quantified using digital methods to obtain an exact measure of surface area damaged. Photos were taken of both the top (adaxial) and the underside (abaxial) of the cotyledons against a 1-mm2-grid paper for a size reference with an iPhone XR (12-megapixel; resolution = 828 × 1792 pixels; Apple, Cupertino, California, United States of America). The photos were analysed using GIMP software to quantify degree of defoliation. The defoliation was manually coloured pink in the photo-editing software to make the damage contrast visually with the healthy tissue (Supplementary material, Fig. S3). The pixels were separated into different colour shades using R’s Colordistance package (Weller Reference Weller2021) to group the multiple shades of green into one category. The proportion of all the pink pixels (damaged) to the green pixels (healthy) was computed to obtain the exact proportion damaged. Each cotyledon was measured across the widest point (length) and across the main vein (width) to obtain an estimation of the area of the cotyledon without the need to obtain an exact area calculation for each cotyledon. Because of the differences in sizes due to different rates of growth among the temperature treatments, this measurement was taken to obtain an unbiased estimation of the absolute feeding damage among the various sizes of cotyledons. The proportion damaged per cotyledon was multiplied by the estimated area of each cotyledon to determine the area damaged in square millimetres (mm2). Defoliation was estimated separately for each of the upper and lower sides of the cotyledons. If damage extended through the leaves, it was recorded as separate damage on each side, rather than just as a shallow pit, to account for the extra damage created from the tunnel through the plant tissue.
Cotyledon percent area damaged was visually assessed for experiments 2, 3, and 4. The assessment ranged from 0% (no defoliation) to 100% (no living tissue), at 5% intervals, following Palaniswamy et al. (Reference Palaniswamy, Lamb and McVetty1992). This visual assessment was used for efficiency and to reflect typical field scouting practices.
Microcosm setup
Microcosms for experiments 1, 2, and 4 consisted of canola seedlings grown in circular plastic pots (950.5 cm3) and covered by a transparent 2-L plastic pop bottle (23 cm height × 11 cm diameter) with the bottom portion removed. Two squares (5 × 5 cm) were cut out of each bottle and covered with cheese cloth to promote air circulation and avoid condensation. A 2-cm-diameter circle was cut on the side of each bottle and covered with a rubber stopper to allow flea beetles to be removed with an aspirator after the experiments. A fine mesh was secured to the bottle top with a rubber band to promote airflow and reduce condensation (Supplementary material, Fig. S4). After each experiment was completed, the microcosms were removed from their temperature-controlled reach-in growth chambers for measurements to be taken. The number of flea beetles alive was recorded, and the canola plants were removed. Pots and cages were then inspected, and dead flea beetles or their remains were recorded.
Experiment 1: effect of temperature and flea beetle species on canola damage
Four constant temperatures (13 ˚C, 18 ˚C, 23 ˚C, and 28 ˚C), at 70 ± 5% relative humidity with a 16:8–hour light:dark cycle, were combined in a factorial design in microcosms with three flea beetle manipulation treatments (striped flea beetles, crucifer flea beetles, and a control with no flea beetles) to assess flea beetle damage to canola. These temperatures reflect field conditions above the flea beetle activity threshold of 10.2 ˚C (Kocourek et al. Reference Kocourek, Láska and Jarosik2002). Each microcosm contained two canola plants at the cotyledon stage and five flea beetles of the appropriate species. Four reach-in growth chambers were used to accommodate the four different temperatures, and each chamber received three replicates of each treatment. Four rounds of experiments took place weekly from 5 July to 26 July 2019, with each round lasting 48 hours. At the end of each round, the cotyledons were removed from the stem by cutting at the base of the cotyledon where it adjoins the petiole.
A split–split plot analysis of variance model was used to determine the effects of temperature (whole plot), flea beetle species (subplot), and the side of the cotyledon (sub-subplot) on the area damaged per cotyledon per average flea beetle alive (mm2), using date as a random factor. Average flea beetle alive was calculated using the number of beetles alive at the start of the experiment (five), and the number of beetles alive after 48 hours to correct for the slightly increased mortality in crucifer flea beetles at high temperatures compared to the mortality of striped flea beetles and the other temperature treatments (data not shown). Backwards elimination of terms was completed with the use of Akaike information criterion scores to determine the best model (Zuur et al. Reference Zuur, Ieno, Walker, Saveliev and Smith2009). The main effect, ‘flea beetle species’, was excluded from the model after no significant main or interacting effects were detected for this variable. Pairwise comparisons between temperature treatments were done using the emmeans package (Lenth Reference Lenth2023) in R, adjusted by Bonferroni’s method.
Experiment 2: effect of temperature and plant density on canola damage
Two constant temperatures (18 ˚C and 28 ˚C), both at 70 ± 5% relative humidity with a 16:8–hour light:dark cycle, were combined in a factorial design using two plant densities (5 or 10 canola plants per pot), resulting in four treatments. All four treatments received five colony-reared striped flea beetles (crucifer flea beetles were not available at the time of this experiment); controls with no flea beetles were also conducted. The temperatures 18 ˚C and 28 ˚C were chosen because they showed the most contrasting results while remaining within the range of normal temperatures in southern Manitoba for the month of June (peak flea beetle emergence; Government of Canada 2022) out of the four temperatures used in experiment 1. Five rounds of experiments were conducted between 10 February and 30 March 2021 to test the effects of temperature and plant density on the intensity, prevalence, and overall damage to canola. Two reach-in growth chambers were used to accommodate the two temperatures, where each chamber received two replicates of each treatment, for a total of 10 replicates per treatment combining all trials.
After the 24-hour period, the flea beetles were removed and counted to measure survivorship. The highest mortality observed was one flea beetle per microcosm, and overall mortality did not differ across treatments (mean ± standard error flea beetles alive): low plant density/18 ˚C = 4.8 ± 0.1, low plant density/28 ˚C = 4.7 ± 0.2, high plant density/18 ˚C = 4.9 ± 0.1, and high plant density/28 ˚C = 4.8 ± 0.1. Therefore, defoliation was not adjusted by the average number of flea beetles alive. Percent cotyledon damage was assessed visually as described in the section, Cotyledon damage estimation, above. Stem damage was assessed as described in the section, Stem damage estimation, above. To analyse overall cotyledon defoliation (%), cotyledon defoliation intensity (%), overall stem damage (mm2), and stem damage intensity (mm2), a two-factor analysis of variance model was used, with temperature and plant density serving as fixed main effects and their interaction. To test for the effects on prevalence for both cotyledon defoliation and stem damage, a type 3 Wald chi-square test was used with a binomial distribution (attacked versus nonattacked). In all analyses, trial was used as a random effect.
Experiment 3: predation assays in Petri dishes
To determine potential predators of flea beetles in canola, nine Petri dish trials took place from 7 July to 13 September 2020. Generalist predators were collected from nearby canola fields, as described in the section, Insect and plant material, including the carabids (Coleoptera: Carabidae) Agonum spp. (n = 3), Amara spp. (n = 3), Bembidion quadrimaculatum (n = 3), Calosoma spp. (n = 16), Harpalus amputatus (n = 13), and P. melanarius (n = 19), and the spiders (Araneae: Lycosidae) Alopecosa spp. (n = 3), Pardosa spp. (n = 6), and Pirata spp. (n = 7). One predator and three adults of each flea beetle species, striped flea beetle and crucifer flea beetle, were placed in plastic Petri dishes (14 cm diameter). Each dish served as one replicate. Replicate numbers varied by predator, based on the number of individuals available from the field. Each trial also contained predator-free control replicates (n = 22) to estimate defoliation levels in the absence of predation. Petri dishes were kept in a reach-in growth chamber at 23 ± 1 ˚C during the day and 19 ± 1 ˚C at night, at 80 ± 5% relative humidity, and under a 16:8–hour light:dark photoperiod. A lower temperature for the night period in experiments 3 and 4 was implemented to mimic more typical field conditions (Government of Canada 2022).
Each Petri dish contained two canola seedlings at the cotyledon stage that were cut from the soil so that no root material existed in the assays. Each cut end of the stem was wrapped in half of a moistened cotton ball to provide water for the plant. Both seedlings were laid horizontally in the dish. Each dish was sealed with one layer of parafilm after the plants and insects were placed in the dish. After 24 and 48 hours, the numbers of flea beetles alive were counted. Confirmation that flea beetles were consumed was obtained by checking for remaining pieces of the exoskeleton, such as elytra or legs. After 48 hours, the Petri dishes were put in the freezer for 5–10 minutes to chill the insects, allowing removal of the canola from the dishes without the risk of flea beetles escaping. Cotyledon defoliation was visually assessed as described in the section, Cotyledon damage estimation. Due to the limited capture rate of Pirata spp. during the following field season (2021), we chose to focus our efforts in the following microcosm experiment (experiment 4) on examining H. amputatus, P. melanarius, and Pardosa spp. as predators on flea beetles.
A one-way analysis of variance (type 3 partial sum of squares for unbalanced number of observations) model was used to determine the effect of the predator taxa (main fixed effect) on the dependent variables described above, using the combination of the trial number and growth chamber as a random factor. Pairwise comparisons were made using estimated marginal means to compare the treatments to the control, adjusted by Bonferroni’s method using the emmean package in R (Lenth Reference Lenth2023).
Experiment 4: effect of predation and plant density on canola damage
Twelve rounds of microcosm experiments took place from 23 June to 15 September 2021. Rounds 1–7 consisted of a single plant density (three plants per pot). Following the observations of effective predation in the first seven rounds, a higher plant density treatment (six plants per pot) was added to the experiment to examine its effects on flea beetle feeding for rounds 8–12. No significant difference was observed in defoliation (t = 1.08, df = 31, P = 0.30), stem damage (t = 0.62, df = 26, P = 0.55), or flea beetle abundance (t = –0.26, df = 31, P = 0.80) in the low plant density treatments between rounds 1–7 and 8–12. Therefore, to increase replication, all rounds (1–12) were used for the low plant density treatment when compared to the high plant density treatment (rounds 8–12).
Single predators were added to each microcosm, and the number of replicates for each species varied based on the number of predators collected each week. Each microcosm either contained three flea beetles of each species or (for the flea beetle–free controls) no flea beetles. The microcosms were divided equally between two reach-in growth chambers held at the same temperature regime. Daytime temperature was 22 ± 1 ˚C, and night-time temperature was 18 ± 1 ˚C, with 75% relative humidity and a 16:8–hour light:dark photoperiod. The temperatures were each about one degree lower than in experiment 3 due to minor growth chamber fluctuations. Each round lasted for 48 hours.
Stem damage and cotyledon damage were assessed as described in the sections, Stem damage estimation and Cotyledon damage estimation. Defoliation per average flea beetle alive was initially assessed in the same way as described in experiment 1 but showed no difference in treatment effects compared to assessing overall defoliation not adjusted by flea beetle alive (data not shown); because of this, overall defoliation (%) is presented in the results. Some stems were too withered to accurately measure the pit sizes. To avoid underestimating stem damage, we conducted an analysis using an estimated maximum area for stem damage (maximum stem damage = 6.27 mm2 at 100% cotyledon damage, obtained by a linear regression between stem damage and cotyledon defoliation) for these cases. Similar results were obtained between analyses including the estimated maximum damage and excluding those cases; we therefore present the final analysis with the withered plants excluded. For the rounds with a single plant density, a generalised linear mixed model was used, with predator species as a main fixed effect and date as a random effect. To test for differences in plant density in the later rounds, plant density was also added as a second main fixed effect, as was a predator × plant density interaction term. White’s (Reference White1980) method was used to correct for heteroscedasticity in the model residuals. The correction is applied to the coefficient of covariance matrix. To determine differences between the predator treatments and the predator-free control group, comparisons were made using the emmeans package in R (Lenth Reference Lenth2023) to compare only each treatment to the control, adjusted with Bonferonni’s method. Pardosa spp. was not included in the analyses that contained both plant densities due to the lack of individuals of these predators during rounds 8–12.
Results
Experiment 1: effect of temperature and flea beetle species on canola damage
Crucifer flea beetles and striped flea beetles similarly increased their damage in response to temperature increase (Fig. 1A and B). Higher temperatures significantly increased cotyledon defoliation (F 3,26.6 = 31.64, P < 0.0001), with the most defoliation observed at 28 ˚C, the least defoliation at 13 ˚C, and intermediate levels of defoliation occurring at 18 ˚C and 23 ˚C (Fig. 1C). More defoliation was observed on the abaxial side than on the adaxial side of the cotyledons (F 1,118.3 = 24.55, P < 0.0001; Fig. 1D). Temperature did not affect which cotyledon side was damaged more by flea beetles (temperature × side: F 3,116.2 = 1.07, P = 0.36). There was no significant difference in cotyledon defoliation between flea beetle species (F 1,26.6 = 0.38, P = 0.542; Fig. 1E) nor significant interaction with the other treatments (flea beetle species × temperature × side: F 3,112.2 = 0.16, P = 0.924; flea beetle species × temperature: F 3,23.7 = 0.52, P = 0.671; flea beetle species × side: F 1,115.2 = 0.30, P = 0.586): because of this, the flea beetle species treatment was removed from the final model.
Mean canola cotyledon defoliation adjusted per living flea beetle separated by species: A, CFB, crucifer flea beetle and B, SFB, striped flea beetle, and main effects of C, temperature, D, side of cotyledon (abaxial = under, adaxial = upper), and E, species. Microcosm study with five flea beetles and two canola plants in each. Measurements taken after 48 hours. Error bars ± standard error of the mean. Asterisks represent significant main effects. Different letters on bars indicate significant differences between temperatures assessed using estimated marginal means (EMM) adjusted by Bonferroni’s method; α = 0.05).

Experiment 2: effect of temperature and plant density on canola damage
Temperature and plant density had interactive effects on overall cotyledon defoliation (F 1,32 = 5.92, P = 0.02), with more defoliation found at a lower plant density at 28 ˚C but not at 18 ˚C (Fig. 2A). A higher prevalence of cotyledon damage occurred at high temperatures (Wald X 2 = 33.1, P < 0.0001), but no difference due to plant density (Wald X 2 = 2.86, P = 0.091) or plant density × temperature interaction (Wald X 2 = 1.52, P = 0.217; Fig. 2B) was observed. When examining cotyledon defoliation intensity, temperature and plant density (F 1,31 = 6.72, P = 0.014) interacted, leading to higher damage at a low plant density at 28 ˚C but not at 18 ˚C (Fig. 2C), which suggests that overall cotyledon damage (Fig. 2A) was driven by damage intensity.
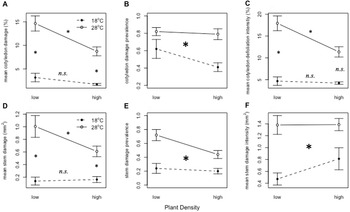
Mean cotyledon damage: A, overall, B, prevalence, and C, intensity of damage; and mean stem damage: D, overall, E, prevalence, and F, intensity, per canola seedling. Treatments consist of either high plant density (10 plants per pot) or low plant density (five plants per pot) at a temperature of either 18 ˚C or 28 ˚C. Trials took place over 24 hours with five striped flea beetles per pot. n = 10 per treatment combination. Error bars ± standard error of the mean. Small asterisks on or between the lines indicate significant pairwise comparisons (EMM; P < 0.05). Large asterisks indicate a significant main effect (between temperatures; α = 0.05), nonsignificant relationships between temperatures or plant densities are indicated by “n.s.”

The interaction between temperature and plant density also significantly affected overall stem damage, resulting in more stem damage at a low plant density at 28 ˚C but not at 18 ˚C (F 1,32 = 4.47, P = 0.042; Fig. 2D). Higher temperatures significantly increased both the prevalence (Wald X 2 = 13.9, P = 0.0002; Fig. 2E) and intensity (F 1,3 = 20.68, P = 0.020; Fig. 2F) of stem damage, resulting in more attacked plants and more damage per attacked plant at a higher temperature. Neither plant density (Wald X 2 = 1.27, P = 0.260) nor temperature × plant density (Wald X 2 = 3.05, P = 0.081) affected the prevalence of stem damage. Similarly, neither plant density (F 1,28 = 1.01, P = 0.323) nor temperature × plant density (F 1,28 = 1.17, P = 0.288) affected stem damage intensity. The overall trend of overall stem damage (Fig. 2D) appears to be more heavily influenced by the prevalence of stem damage (Fig. 2E).
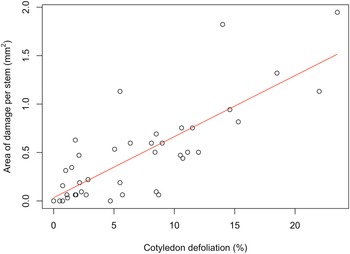
Cotyledon defoliation significantly predicted stem damage (P < 0.0001, I 2 = 0.64, n = 40; Y = 0.063X + 0.034; Fig. 3).
Regression of estimated pit size per plant (mm2) compared to the defoliation of the upper side of the cotyledons per plant (n = 40). Plants per pot were either five or 10 plants with five Phyllotreta striolata individuals for 24 hours.

Experiment 3: predation assays in Petri dishes
Ground predators reduced the abundance of flea beetles in the Petri dish trials (F 9,82.6 = 11.27, P < 0.00001), with four taxa differing from controls: H. amputatus., P. melanarius, Pardosa spp., and Pirata spp. (Fig. 4).
Mean number of flea beetles alive after 48 hours with a variety of predator genera from the families Carabidae and Lycosidae. Each replicate was one Petri dish (14 cm diameter) with three individuals of each flea beetle species (Phyllotreta cruciferae and P. striolata), two canola plants at the cotyledon stage, and one respective predator. Control = predator-free flea beetle treatment. Error bars ± standard error of the mean. Asterisks represent a significant difference in contrast to the control group (EMM; P < 0.05).

Experiment 4: effect of predation and plant density on flea beetles
As in experiment 3, P. melanarius and Pardosa spp. reduced flea beetle abundances in microcosms with low plant density (rounds 1–7) after 48 hours compared to the predator-free control group (F 3,106.6 = 15.10, P < 0.00001; Fig. 5). Pterostichus melanarius also reduced the mean number of flea beetles at both high and low plant densities (F 2,197.9 = 17.3, P < 0.0001; Fig. 6). By contrast, H. amputatus did not reduce flea beetle numbers in microcosms at low plant density (Fig. 5) or at both high and low plant densities (Fig. 6). No interaction was found between predator species and plant density (F 2,198.5 = 1.17, P = 0.31).
Mean number of flea beetles alive after 48-hour trials with a variety of predator species. Each microcosm contained three individuals of each flea beetle species (Phyllotreta cruciferae and P. striolata) and three canola plants at the cotyledon stage. Control = predator-free flea beetle treatment. Error bars ± standard error of the mean. Asterisks represent a significant difference in contrast to the control group (EMM; α = 0.05).

Mean number of flea beetles alive after 48-hour trial with different predator species based on plant density. Each microcosm contained three individuals of each flea beetle species (Phyllotreta cruciferae and P. striolata) and either six (high) or three (low) canola plants at the cotyledon stage. Control = predator-free flea beetle treatment. Error bars ± standard error of the mean. Asterisks in squares represent a significant difference between predator species main effect in comparison to the control group (EMM; α = 0.05).

When placed in microcosms at low plant densities with Pardosa spp. and P. melanarius, flea beetles caused less overall cotyledon defoliation (F 3,125.6 = 3.43, P = 0.019; Fig. 7A) and damage intensity (F 3,116.6 = 4.96, P = 0.003; Fig. 7C) when compared to the control group. Harpalus amputatus did not affect overall damage or damage intensity by flea beetles at low plant densities (Fig. 7A and C). No predators resulted in a decreased prevalence of cotyledon damage at a low density (Wald X 2 = 6.02, df = 3, P = 0.111; Fig. 7B). With P. melanarius, flea beetles produced less overall stem damage (F 3,91.2 = 5.97, P = 0.001; Fig. 7D) and stem damage intensity (F 3,116.0 = 4.47, P = 0.005; Fig. 7F) than in the controls, but other predators did not affect these variables. Pardosa spp. and P. melanarius resulted in lower prevalence of flea beetle damage on stems than in the controls, but no effects of H. amputatus were seen (Wald X 2 = 19.74, df = 3, P < 0.001; Fig. 7E).
Mean cotyledon damage based on predator treatments: A, overall and B, prevalence, and C, intensity of damage; and mean stem damage based on predator treatments: D, overall, E, prevalence, and F, intensity per canola seedling. Control = predator-free flea beetle treatment. Each microcosm contained three individuals of each flea beetle species (Phyllotreta cruciferae and P. striolata) and three canola plants at the cotyledon stage for 48 hours. Error bars ± standard error of the mean. Asterisks represent a significant difference between predators in comparison to the control (EMM; α = 0.05).

A higher plant density reduced the overall mean cotyledon defoliation (F 1,101.6 = 19.39, P < 0.001; Fig. 8A), prevalence (Wald X 2 = 5.34, df = 1, P = 0.021; Fig. 8B), and intensity of cotyledon defoliation (F 1,90.4 = 14.86, P ≤ 0.001; Fig. 8C) when compared to the lower plant density. The presence of P. melanarius reduced the overall mean cotyledon defoliation (F 2,171.6 = 2.99, P = 0.05), whereas H. amputatus did not (Fig. 8A). Predators did not reduce the prevalence (Wald X 2 = 0.49, df = 2, P = 0.781; Fig. 8B) or intensity of cotyledon defoliation (F 2,172.73 = 2.28, P = 0.106; Fig. 8C). No interaction between plant density and predator treatments was observed to affect overall mean cotyledon defoliation (F 2,170.8 = 1.81, P = 0.167), prevalence (Wald X 2 = 1.97, df = 2, P = 0.373), and intensity of defoliation (F 2,172.3 = 1.66, P = 0.193).
Mean cotyledon damage based on planting density and predator treatments: A, overall, B, prevalence, and C, intensity of damage; and mean stem damage based on planting density and predator treatments: D, overall, E, prevalence, and F, intensity per canola seedling. Control = predator-free flea beetle treatment. Each microcosm contained three individuals of each flea beetle species (Phyllotreta cruciferae and P. striolata) and either six (high) or three (low) canola plants at the cotyledon stage for 48 hours. Error bars ± standard error of the mean. Asterisks in squares represent a significant difference between predators in comparison to the control group (EMM; α = 0.05). Significant effect in plant density was found in A, B, C, D, and F but is not shown. Capital letters above the bars show significant differences within low plant density and lowercase letters show significant differences within high plant density (EMM slicing interaction analysis, P < 0.05).

A higher plant density also reduced overall mean stem damage (F 1,52.1 = 17.5, P = 0.0001; Fig. 8D) and intensity of stem damage (F 1,43.9 = 8.95, P = 0.005; Fig. 8F). The presence of P. melanarius predators reduced the overall stem damage (F 2,171.6 = 11.3, P < 0.0001; Fig. 8D), whereas H. amputatus did not. No interactions between plant density and predator treatments affected overall mean stem damage (F 2,163.0 = 2.98, P = 0.054) and intensity (F 2,162.9 = 0.25, P = 0.783). A significant interaction between plant density and predator was observed on stem damage prevalence (Wald X 2 = 9.96, P = 0.007; Fig. 8E), due to reduced prevalence of stem damage only in low plant density treatments when P. melanarius was present (Fig. 8E). Pterostichus melanarius and H. amputatus reduced stem damage intensity (F 2,161.6 = 6.04, P = 0.003; Fig. 8F).
Discussion
Our results demonstrate that both flea beetle species — striped flea beetle and crucifer flea beetle — produced similar levels of defoliation and increased feeding at higher temperatures. Efforts have been made to determine feeding differences between these two species because they are prominent pests in North America. Based on the presence of flea beetles on plants and their damage, Palaniswamy et al. (Reference Palaniswamy, Lamb and McVetty1992) suggested that crucifer flea beetles cause about twice as much damage as striped flea beetles do. In contrast, Gavloski and Lamb (Reference Gavloski and Lamb2000c) reported no differences between crucifer flea beetles and striped flea beetles feeding on canola seedlings under controlled conditions. Tansey et al. (Reference Tansey, Dosdall and Keddie2009) reported that striped flea beetles fed more than crucifer flea beetle did on canola seedlings grown from seeds treated with thiamethoxam and clothianidin but found no differences between untreated controls exposed to overwintered individuals of both beetle species. The present study found that both species show a similar feeding pattern on cotyledons, which was slightly higher (< 1%) on the abaxial surface than on the adaxial surface of cotyledons, suggesting that field estimates typically conducted on the adaxial cotyledon surface may be sufficiently accurate to estimate damage. Although a method exists for rearing crucifer flea beetle under laboratory conditions (Kinoshita et al. Reference Kinoshita, Svec, Harris and McEwen1979), we were unable to maintain a colony; because we also had insufficient field collections of striped flea beetle during the experiment period, we compared field-collected crucifer flea beetle with lab-reared striped flea beetles. Despite potential variability resulting from using field-collected crucifer flea beetle individuals, previous studies have also relied on them to compare species and quantify damage and reported feeding levels similar to ours (e.g., Lamb and Palaniswamy Reference Lamb and Palaniswamy1990; Gavloski and Lamb Reference Gavloski and Lamb2000c; Soroka et al. Reference Soroka, Holowachuk, Gruber and Grenkow2011). Until a viable rearing method for crucifer flea beetle is developed, future studies are needed to confirm our results using field-collected populations for both beetle species. Despite this potential limitation, our results suggest that both flea beetle species produce similar levels of defoliation on canola seedlings, supporting results found in other studies under different experimental conditions.
In the present study, temperature consistently increased damage by both flea beetle species, with feeding on cotyledons at 28 ˚C being more than four times higher than that at 13 ˚C. Our results show that feeding usually increased with temperature (except for cotyledon damage intensity at high plant density), which aligns with Toshova et al.’s (Reference Toshova, Csonka, Subchev and Tóth2009) results showing higher abundance and activity of flea beetles on canola at warmer temperatures and suggests that more feeding on cotyledons may take place. Because more plant volatiles are released at higher temperatures (Dai and Lim Reference Dai and Lim2014), increased flea beetle feeding may be also a response to volatile cues. Our findings show no difference in per capita feeding between the two beetle species regardless of temperature and that both species increased damage to canola at high temperatures. Future studies should focus on examining the effects of temperature on damage ratings of flea beetles under field conditions while considering the abundance of each species at variable temperatures.
Stem damage may be an important measure in canola plant health, and temperatures were shown in the present study to affect the extent of damage on seedling stems, with higher temperatures increasing the damage caused by striped flea beetle on canola seedling stems. The Canola Council of Canada (2023) suggests that stem damage is more likely under cooler and windy conditions, based on the premise that flea beetles will be less active to climb to the tops of plants to feed on cotyledons under those conditions. In contrast, we found that, under higher temperatures, flea beetles produce both a greater number of pits per stem and more overall damage on the stems. Because we did not investigate wind effects on stem damage nor temperature effects on stem feeding by crucifer flea beetle, these possible effects should be tested in future experiments.
The increased damage to cotyledons and stems at higher temperatures observed in the present study occurred because of different mechanisms. Stem damage followed the pattern of prevalence of attack, whereas cotyledon damage followed the pattern of the intensity of feeding per attacked plant. The difference may be due to short trichomes on the stem (Gulden et al. Reference Gulden, Warwick and Gordon Thomas2007), which are absent on cotyledons (Gruber et al. Reference Gruber, Wang, Ethier, Holowachuk, Bonham-Smith, Soroka and Lloyd2006). The differences in trichome abundance on different plant parts might affect the beetles’ feeding preferences when comparing stems and cotyledons. Soroka et al. (Reference Soroka, Holowachuk, Gruber and Grenkow2011) found decreased flea beetle feeding with increased trichome density, suggesting that flea beetles may feed briefly on stems but prefer feeding on cotyledons due to the absence of trichomes. In addition, Soroka et al. (Reference Soroka, Holowachuk, Gruber and Grenkow2011) found that striped flea beetle consumed an order of magnitude more cotyledon tissue than stem tissue, suggesting a preference for cotyledon tissue; this may result in longer periods of feeding on cotyledons than on stems and increased damage intensity rather than prevalence. The main driving factors of both stem and cotyledon damage in canola have implications for flea beetle monitoring practices. Because stem damage is driven by the attack prevalence, simply recording each canola stem as either damaged or not damaged may be sufficient for efficient and effective monitoring. Furthermore, we found a strong correlation between cotyledon defoliation and stem damage, suggesting that current monitoring strategies based on defoliation estimates will not miss high stem damage. Future research should investigate the relationship of stem damage prevalence with environmental conditions and flea beetle abundance under field conditions to use this information to guide flea beetle management decisions.
Predators can have direct, consumptive impacts on herbivore populations that, in turn, may release plants from herbivore pressure, which is the measure of successful biological control (Costamagna et al. Reference Costamagna, Landis and Difonzo2007). Potential predators of flea beetles, however, have seldom been studied, making the determination of different taxa that are capable of consuming flea beetles important groundwork in this field. Although flea beetles are extremely abundant, well protected by chemical defences, and seemingly difficult to capture (Li et al. Reference Li, Costamagna, Beran and You2024), Chiverton (Reference Chiverton1984) and Ekbom et al. (Reference Ekbom, Kuusk, Malsher, Åström and Cassel-Lundhagen2014) have documented their predation. We expand those earlier results by showing that Pardosa spp. and P. melanarius are able to significantly reduce flea beetle abundance in both Petri dish and microcosm laboratory experiments. Harpalus amputatus and Pirata spp. caused flea beetle mortality only in our Petri dish experiments. Pirata spp. was not tested in our microcosm experiments, leaving its potential role as a biological control to be explored in more realistic arenas. Our findings suggest that common generalist predators in canola fields can effectively prey on flea beetles, and we suggest here that additional species be tested. Future research should expand these results by testing the gut contents of field-collected predators for flea beetle DNA in canola fields in the Canadian prairies to confirm their contribution to pest control services.
In addition to consumptive effects, predators can have negative nonconsumptive impacts on herbivores by increasing their stress, by forcing them to consume less or poorer-quality food, and generally by decreasing their fitness, which could cascade down to reduce plant damage (Schmitz et al. Reference Schmitz, Krivan and Ovadia2004; Thaler and Griffin Reference Thaler and Griffin2008; Costamagna et al. Reference Costamagna, McCornack and Ragsdale2013; Gurr et al. Reference Gurr, Wratten, Landis and You2017). In our results, we observed a reduction of overall cotyledon damage by means of a reduction in the intensity of damage when flea beetles were placed in microcosms with P. melanarious and Pardosa spp. However, the prevalence of cotyledon damage was not affected by the presence of the same predators. This might be explained by increased activity by beetles (i.e., similar prevalence), combined with a reduction of feeding by beetles (i.e., lower intensity) due to predator-induced stress, which has been observed in other Chrysomelid species (Snyder and Wise Reference Snyder and Wise2000; Williams et al. Reference Williams, Snyder and Wise2001). Pterostichus melanarius reduced both the prevalence and intensity of stem damage, whereas Pardosa spp. reduced the prevalence of stem attacks but had no effect on the overall damage levels. This might be due to a difference in foraging behaviours in the predators. Throughout the predator assays, P. melanarius was observed to be more active than the spider predators were during daylight hours, which is also when the flea beetles were active. Pterostichus melanarius also displayed active patrolling around the bases of stems, plant-climbing attempts (Supplementary material, Fig. S5A), and vertical tunnelling in the soil at the base of a plant. When the plant was mechanically disturbed after the assays were completed, we observed quick and targeted emergence of P. melanarius towards the plant (Supplementary material, Fig. S5B), which suggests the movement caused by flea beetles landing on the seedlings may be enough to trigger predator emergence from these vertical tunnels. The differences in foraging behaviour between predator taxa may account for the differences in the beetles’ reduced damage patterns. When predators are active on and around plants, prey species tend to exhibit vertical plant migration to avoid predation (Magalhães et al. Reference Magalhães, Janssen, Hanna and Sabelis2002; Lee et al. Reference Lee, Nyrop and Sanderson2014), which would result in the beetles’ upwards movement onto the cotyledons rather than their remaining on the stems. Reduced flea beetle damage in the predator treatments was greater at increased plant densities, but whether this was due to the predators’ consumptive effects, nonconsumptive effects, or a combination of the two is unclear. Our study under controlled conditions allows us to reach conclusions using fixed flea beetle–plant ratios, which will vary under field conditions and in response to predators. Higher plant densities may attract more flea beetles, but Woodland’s (Reference Woodland2024) field studies indicate that this is compensated for by dilution effects. Follow-up studies that include a nonconsumptive predator treatment should be conducted to tease apart consumptive and nonconsumptive effects of predators on flea beetles and their damage to canola.
In summary, the present study shows that both striped flea beetle and crucifer flea beetle increase their feeding on canola at higher temperatures. The increase in stem feeding is driven mainly by the prevalence of attacks, whereas the increase in cotyledon feeding is driven by the intensity of damage. We found no differences in feeding preferences or area consumed between the two flea beetle species, suggesting that monitoring their overall abundance is sufficient for management purposes, but if insecticidal seed treatments are used, care must be taken to monitor striped flea beetle abundance when certain products are used (Tansey et al. Reference Tansey, Dosdall and Keddie2009). It is important to note that our results were found by using either lab-reared or field-collected flea beetles at various times in the season. Future studies should test if these results remain consistent when using flea beetles emerging from overwintering or late-season populations. The role of other factors potentially affecting flea beetle feeding, such as wind and rainfall, also warrants additional study. We found that generalist predators P. melanarius and Pardosa spp. can reduce the abundance of flea beetles and their damage to canola seedlings under controlled conditions, particularly under higher plant densities for P. melanarius. Damage reduction can be attributed mostly to direct consumption of flea beetles, but evidence also indicates nonconsumptive effects. The reduced prevalence of stem damage caused by flea beetles in response to P. melanarius and Pardosa spp. suggests that flea beetles may migrate up plants to avoid predation, which warrants further study. However, the ability of P. melanarius and Pardosa spp. to reduce flea beetle abundance and canola damage in laboratory conditions may not automatically translate to effective control of flea beetle populations in the field. Factors in the field that may affect these generalist predators’ ability to control flea beetles may include foraging behaviour, pest density, predator density, presence of other suitable prey populations, and activity levels (Barney and Pass Reference Barney and Pass1986; Clark et al. Reference Clark, Luna, Stone and Youngman1994). Field studies are needed to determine the potential of increasing generalist predator field populations through conservation biological control approaches, in combination with increasing seeding rates and other agronomic techniques, to reduce flea beetle damage to canola crops.
Supplementary material
The supplementary material for this article can be found at https://doi.org/10.4039/tce.2025.10023.
Acknowledgements
The authors thank Maxime Damien and Jordan Bannerman for assistance with data processing.
Funding statement
This work was supported by the Canola AgriScience Cluster Program (Project ASC-02). Author S.W. received research funding from the University of Manitoba Undergraduate Research Award, the James Gordon Fletcher Graduate Fellowship, and the University of Manitoba Graduate Completion Award. Author D.G. received funding from the Dr. J.A Garland Summer Research Award in Agricultural and Food Sciences.
Competing interests
The authors declare that they have no competing interests.


 Open access