

1. INTRODUCTION
Radiative forcing by dust deposition in the Colorado Rocky Mountains has been shown to advance melt by 1–2 months, shift timing and intensity of peak runoff, and reduce total water yield (Painter and others, Reference Painter2007a; Painter and others, Reference Painter2010; Skiles and others, Reference Skiles, Painter, Deems, Landry and Bryant2012; Deems and others, Reference Deems, Painter, Barsugli, Belnap and Udall2013). The powerful impact on snow albedo has been documented with field, in-situ and remote sensing measurements (Painter and others, Reference Painter, Bryant and Skiles2012a, Reference Painter, Skiles, Deems, Bryant and Landryb; Painter and others, Reference Painter, Seidel, Skiles, Bryant and Rittger2013), and ongoing research indicates that this may be a major factor contributing to operational river runoff forecast errors in the Colorado River Basin (CRB) (Bryant and others, Reference Bryant, Painter, Deems and Bender2013).
This suite of studies, focusing on understanding the impacts of dust on snow in the hydrologically sensitive CRB, have utilized a semi-empirical determination of dust radiative forcing based on changes in surface reflectance (Painter and others, Reference Painter2007a). Although useful to constrain the relationship between dust and albedo, and investigate its impact on runoff, it is of interest to represent these processes explicitly in physically-based radiative transfer and snowmelt models. This requires measurements that have been previously unavailable; an extended high-resolution dataset of snow physical and optical properties to force, validate and calibrate models.
Additionally, these studies have assumed that these light absorbing impurities (LAIs) are primarily mineral dust and have not considered the contribution of carbonaceous particles from industrial and urban sources. The fourth and fifth assessment reports of the IPCC have listed black carbon (BC) on snow and ice as a contributor to anthropogenic climate change through reduction of snow covered area (IPCC, 2013, 2007). Another recent study found BC (atmosphere and snow) processes to be second only to CO2 in climate forcing effectiveness (Bond and others, Reference Bond, Doherty, Fahey and Forster2013).
Although the presence of BC can be inferred from the preliminary analysis of chemical and optical data for snow samples from this region (Reynolds and others, Reference Reynolds2014), actual BC concentrations in snow and their contribution to radiative forcing in the CRB has been unknown. Therefore, the known large dust contribution and preliminary evidence of presence of BC motivates us to quantify the temporal variability in BC content, its coincident presence with dust and their relative and combined contributions to radiative forcing in snow at the point to basin scales.
In spring 2013, we collected the comprehensive data needed to assess dust and BC content and physically model radiative and hydrologic forcing by dust and BC. Here we present the measurement record; daily evolution in surface spectral and broadband albedo, dust and BC content in the top 30 cm of the snowpack and optical grain size, depth, density and temperature over the full profile. The March–April–May sampling window captured the transition from a relatively clean snowpack with non-zero cold content to a dust laden melting snowpack, and spanned peak snow water equivalent (SWE) to snow depletion. In related papers we use these measurements to develop a new method to assess the optical properties of deposited impurities (Skiles and others, Reference Skiles, Painter and Okin2016), and to force and validate a physically-based snow radiative transfer model for impurity in snow radiative forcing over the full time series (Skiles and Painter, in prep).
2. METHODS
2.1. Study site
Measurements were collected in the Senator Beck Basin Study Area (SBBSA) in the San Juan Mountains of southwestern Colorado, USA, the first major mountain range approached by dust aerosol plumes emitted from the southern Colorado Plateau. The SBBSA was established in 2003 to monitor the hydrologic impacts of dust in snow in the CRB (Painter and others, Reference Painter, Skiles, Deems, Bryant and Landry2012b; Landry and others, Reference Landry, Buck, Raleigh and Clark2014). Backtrajectory modeling for the site and an analysis of regional variability in dust-on-snow processes and impacts can be found in Skiles and others (Reference Skiles2015).
The SBBSA contains two energy-balance flux towers, one alpine and one subalpine, which have been collecting net solar radiation fluxes, net longwave radiation, snow depth, wind speed, wind direction, air temperature and relative humidity at two heights since 2005. Regular snow pit measurements, monthly in the winter and weekly in the spring, for dust stratigraphy/concentrations, snow temperature, grain type, density and SWE have been carried out over this same time period by the Center for Snow and Avalanche Studies in Silverton, CO.
The daily snow measurements presented here were collected at Swamp Angel Study Plot (SASP), the subalpine study plot of SBBSA (37.906914°N, −107.711322°W). This site is located in a clearing below tree line at 3368 m near the lower end of SBBSA (Fig. 1). It is a protected site with relatively low wind speeds and is easily accessed on skis, making it a useful location to monitor snow cover evolution. The snow profile plot is 30 m × 30 m and contains a stand-alone precipitation gauge and 6 m tower holding the instrumentation array (Fig. 2).
Regional and basin scale overview of Senator Beck Basin Study Area (SBBSA). Inset on left shows location relative to Colorado River Basin.

(Left) Photograph of Swamp Angel Study Plot with plot boundaries outlined. (Right) Snow sampling took place on the right hand side of the study plot, progressing from the front toward the back of the study plot with 1 m or more between each successive pit face.

2.2. Snow sampling
For this particular study, snow measurements began 11 March 2013 and continued until the depletion of snow cover on 18 May 2013. Snow pit excavation began ~10:00 am local each day, with measurements commencing ~11:00 am. Some gaps exist over the measurement period due to inclement weather and/or the limitations of having a single observer. Sampling days and measurements made on those days, are summarized in Table 1.
Summary of sampling dates and measurements collected over the WY13 measurement dataset. Sky conditions are noted, as recorded in the field notes, to indicate when albedo could be collected accurately
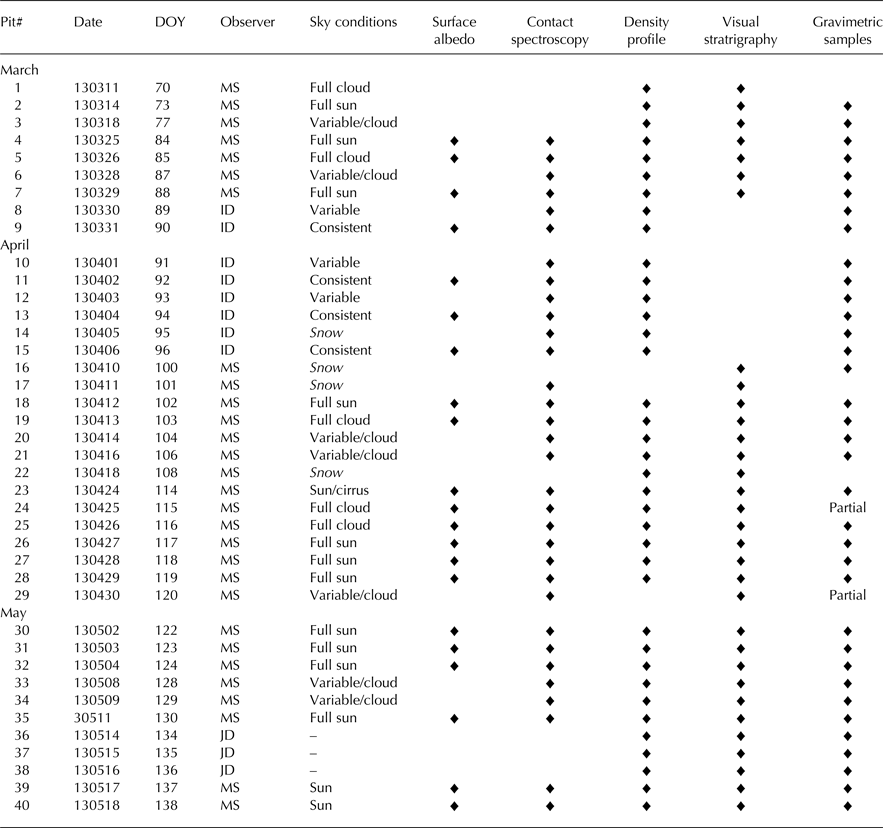
No measurements were made on days with heavy snowfall, due to road conditions. If heavy snowfall started after site access, no spectroscopy was attempted to protect electronics. Although author Skiles mainly carried out observations, a change in observer is noted and the additional observers are recognized in the acknowledgements.
Measurements were made in snow pits excavated on the north side of the SASP instrumentation tower within study plot boundaries (Fig. 2). The first snow pit was located at the front of the study plot with consecutive pits being excavated, at minimum, a meter behind the previous pit face. All pits were back filled when measurements were completed to reduce influence on grain growth from radiative and turbulent fluxes on the pit face. Examples of sampling methods are pictured in Figure 3. Sampling occurred in the following order: (1) collect spectral snow albedo over the pit site; (2) excavate pit, record snow depth and collect 2 cm vertical increment profile of snow optical grain radius (OGR); (3) collect 10 cm temperature profile along shaded pit wall, noting visual snow and dust stratigraphy; (4) measure snow density in 10 cm increments using a density cutter and field scale; and (5) gravimetric sampling for LAI stratigraphy in 3 cm increments in the top 30 cm of the snow column.
(Left) Picture demonstrating contact spectroscopy; typically the snow pit would be covered by a tarp to reduce outside illumination. (Right) Picture of snow pit showing density cuts and gravimetric sampling, the 3 cm cuts are made using a white powder coated saw (not pictured).

Accurate sample volumes were maintained by use of a gravimetrics board (Painter and others, Reference Painter, Skiles, Deems, Bryant and Landry2012b). To reduce scavenging of impurities by sample container, individually bagged snow samples were kept frozen after collection, packed in coolers with dry ice and shipped overnight to the Snow Optics Laboratory at NASA's Jet Propulsion Laboratory (SOL-JPL) to be stored at −20°C until time of analysis. Albedo and OGR were retrieved with an Analytical Spectral Devices field spectroradiometer (i.e. spectrometer; FieldSpec3). The spectrometer contiguously samples the spectral range 0.35–2.5 µm, with contiguous bands that are 0.003 µm (at 0.7 µm) to 0.01 µm (at 1.4 and 2.1 µm) at full width half maximum. The spectra are resampled and splined to 1 nm resolution and the wavelength reproducibility and accuracy is 0.1 and 0.5 nm, respectively. OGR is inferred from snow reflectance via contact spectroscopy, discussed in more detail below.
Retrieving an accurate surface albedo with a field spectrometer requires consistent sky conditions (fully clear or fully cloudy) during up-looking and down-looking acquisitions. This limitation resulted in a sparser surface spectral albedo record relative to the other measurements (Table 1). To fill the gap between these observations we also present the evolution in visible (0.285–0.695 µm), near infrared (0.695–2.800 µm) and broadband (0.285–2.800 µm) shortwave albedo measurements from the tower sensors at the 11:00 am local hour each day. This corresponds to the time frame over which snow pit measurements were typically collected. The tower albedos were corrected for slope and aspect following the method described in Painter and others (Reference Painter, Skiles, Deems, Bryant and Landry2012b).
2.3. Optical snow grain size
2.3.1. Field collection
The evolution in optical grain size was monitored using the field spectrometer with a coupled contact illumination probe, known as contact spectroscopy, the methodology of which is outlined in detail in Painter and others (Reference Painter, Molotch, Cassidy, Flanner and Steffen2007b). Briefly, this method measures snow reflectance along a vertical snow pit profile to retrieve optical grain radius, i.e. the radius of the sphere that returns the same hemispherical flux.
To begin the collection, the probe with spacer attached is placed onto a white standard Spectralon panel (http://www.labsphere.com), the instrument is optimized and 10 spectra are collected. The probe is then placed on the pit face and two collections are made along the profile every 2 cm vertically to collect OGR stratigraphy. The resolution is limited by the 2 cm field of view and thinner layers are averaged with the snow in the same field of view (Painter and others, Reference Painter, Molotch, Cassidy, Flanner and Steffen2007b). This method is useful for these measurements because it is quick, accurate, does not suffer from calibration and variable illumination issues, and can be carried out by a solo observer (Fig. 3). Additionally, utilizing grain size retrievals from contact spectroscopy, Painter and others (Reference Painter, Molotch, Cassidy, Flanner and Steffen2007b) found that it improved shortwave spectral albedo modeling by an order of magnitude relative to grain size retrievals from a hand lens.
2.3.2. Grain size retrieval
After averaging the two collections per depth spectra are output in ENVI [www.exelisvis.com] spectral library format and visually inspected. They are then inverted for OGR using the ice absorption feature centered at 1030 nm by best matching the integral across the continuum-normalized spectrum (950–1090 nm) to those for theoretical OGRs contained within a look up table (Nolin and Dozier, Reference Nolin and Dozier2000). The look up table is generated through repetitive runs of the Discrete Ordinates Radiative Transfer Program (DISORT) (Stamnes and others, Reference Stamnes, Tsay, Wiscombe and Jayaweera1988), which simulates the radiative transfer through a homogeneous snowpack comprised of spherical grains of pure ice of a given grain size and specified illumination and reflection geometry. For simplicity, hereafter we will refer to OGR simply as grain size. Uncertainty in the method is ±10–50 µm for grain sizes between 50 and 900 µm (Nolin and Dozier, Reference Nolin and Dozier2000). We also note that additional uncertainty can be introduced by high impurity loading (>1%), which dampens the absorption feature (Nolin and Dozier, Reference Nolin and Dozier2000), but that concentrations this high have never been sampled at SBBSA. Repeated field tests and comparison of duplicate spectra indicate that the sensitivity is ±20 µm when a trained observer is collecting measurements following established protocol.
2.4. Lab analysis for LAI concentrations
2.4.1. Dust
Melted samples were sonicated to agitate settled particles for 20 min in Whirlpak bags to ensure samples were well mixed. After sonication, sample mass was recorded and then a 50 mL subsample was drawn off into a polypropylene vial for BC analysis. The remaining sample was re-weighed and vacuum filtered through individual pre-weighed 0.5 µm pore diameter Nuclepore filters. Filters were fully dried and then reweighed to return impurity mass.
2.4.2. Black carbon
We used an intra-cavity laser-induced single particle incandescence soot photometer (SP2; Droplet Measurement Technology, Inc.) coupled to an ultrasonic nebulizer (A5000 T; Cetac) to determine BC concentration from 50 mL liquid subsamples. The SP2 is the only instrument that directly measures BC in individual aerosol particles. It was designed to sample atmospheric BC but was adapted to measure BC in liquid samples by coupling the instrument to a nebulizer, and has now been used in multiple studies to analyze for BC content in snow and ice samples (Bisiaux and others, Reference Bisiaux2011; Kaspari and others, Reference Kaspari2011; Bisiaux and others, Reference Bisiaux2012; Sterle and others, Reference Sterle, McConnell, Dozier, Edwards and Flanner2013).
Liquid samples were prepared following the suggestions in Wendl and others (Reference Wendl2014); 50 mL polypropylene vials (having already been sonicated) were placed in a glass beaker on a stirring plate to ensure the samples remained well mixed during analysis. The sample was fed into the nebulizer through 0.5 mm Teflon tubing at 0.5 mL min−1 using a peristaltic pump. An ultrasonic transducer aerosolizes the liquid allowing BC particles to become suspended. Ultra clean compressed air carries the aerosol stream through a heating and cooling element to dry the aerosol flow. This is fed through the SP2 at known rate, and as the aerosol stream crosses the laser path particles containing BC are heated to the point of incandescence. The emission is measured and correlated to the particles BC mass through comparison with BC standard; Aquadag® (Aqueous Deflocculated Acheson Graphite; Acheson Inc., USA) was used here. The mass of individual BC particles is then summed and divided by the volume of liquid analyzed, which is reconstructed from water and air flows.
Detailed discussions relating to the uncertainties of this method can be found in Schwarz and others (Reference Schwarz2012), Kaspari and others (Reference Kaspari, Painter, Gysel, Skiles and Schwikowski2014) and Wendl and others (Reference Wendl2014). It is recognized that due to nebulizer efficiency, the SP2 underestimates BC concentrations in liquid samples by not measuring the smallest and largest particles (Kaspari and others, Reference Kaspari, Painter, Gysel, Skiles and Schwikowski2014; Wendl and others, Reference Wendl2014). It is also possible that there may be some overestimation of BC content in samples that contain high-dust concentrations (Schwarz and others, Reference Schwarz2012). BC concentrations reported here were scaled to reflect ambient BC concentrations (Baumgardner and others, Reference Baumgardner2012), have background values removed, and have been corrected for losses using external calibration (Wendl and others, Reference Wendl2014). Background concentrations (mean value 0.030 µg L−1 ± 0.015 µg L−1 SD) were determined through analysis of ultrapure DI water and care was taken to minimize contamination from environmental and calibration samples. Aquadag standards in concentrations ranging from 0.5 to 100 µg L−1 were used for external calibration, as recommended by Wendl and others (Reference Wendl2014). These standards were freshly prepared each week, sonicated before use and stored in glass containers in a refrigerator. Based on replication analysis of five sample sets over a range of dust concentrations and 10 ‘dusty’ (visible dust content) environmental snow samples, the sensitivity of BC concentrations to dust content ranges from 2 to 7% for samples visually identified as clean and from 6 to 15% for those visually identified as dusty.
3. RESULTS AND DISCUSSION
3.1. Water year 2013
Water year 2013 (1 October–30 September; WY13) was a unique year that was both the dustiest and driest year over the SBBSA data record (2005–13). The record of dust events at SBBSA (as recorded by the Center for Snow and Avalanche Studies while snow cover is retained in SBBSA) and end of year dust concentrations are plotted in Figure 4. Although the total number of dust events and the timing of those events were not abnormal relative to other years, the amount of dust deposited in WY13 was more than 30 times the amount of dust deposited in the lowest dust year (2005) and 5–10% greater than the amount deposited in other high-dust years (2009, 2010). Dust deposition and loading at SBBSA does exhibit interannual variability, so a high-dust year like 2013 is not necessarily unprecedented (Painter and others, Reference Painter, Skiles, Deems, Bryant and Landry2012b; Skiles and Painter, Reference Skiles and Painter2016). Dust loading at SASP generally falls into two categories; extreme dust years, when end of year dust concentrations are >4.0 mg g−1 [2009, 2010, 2013], and lesser dust years, [2005–08, 2011/12] when dust concentrations are ~ or <1 mg g−1 (Skiles and others, Reference Skiles2015). Since ~98% of the total WY13 dust mass was deposited in April our measurements captured the transition from a relatively clean to dusty snowpack.
Dust deposition and loading record. (Above) Yearly distributions of observed dust events in SBBSA, where spring events are those observed after 1 March. (Middle) Average monthly and WY 2013 distribution of dust events, where the dotted line indicated average basin wide snow depletion date. (Below) End of year dust concentrations at SASP.

The SASP record mean and WY13 snowdepth and monthly precipitation are plotted in Figure 5. Over the full water year consistently lower rain/snowfall resulted in 300 mm less precipitation than the record mean (2013; 868 mm, 2005–12; 1174 mm) and almost 400 mm <2008 (1238 mm), the wettest year. Between November and May, the time over which precipitation typically falls as snow, there was 182 mm less precipitation than the record mean (2013; 601 mm, 2005–12; 783 mm). Less winter precipitation resulted in a low snow year; it had the lowest peak snow depth (2013 min; 1.78 m, 2008 max; 2.91 m, 2005–12; 2.43), and the average snow depth (2013; 1.19 m, 2008 max; 1.79 m, 2005–12; 1.41 m) was only slightly higher than the lowest snow year (2012 min; 1.08 m).
(Above) Daily snowdepth for 2013 relative to the record average. (Below) Monthly precipitation for 2013 relative to record average, with maximum and minimum precipitation values for each month indicated in gray.

In terms of meteorological and radiative fluxes, WY13 was an average year (Fig. 6). Relative to the site climatology WY13 had nearly the same mean wind speed (~1 m s−1), air temperature (~0.5 °C), relative humidity (59%), longwave irradiance (250 Wm−2) and global solar irradiance (200 Wm−2). These values are similar to those presented in Painter and others (Reference Painter, Skiles, Deems, Bryant and Landry2012b) and we refer the reader to that paper for a more detailed discussion of annual trends and variability. This indicates that at the beginning of our measurements period the snowpack was typical of mid-March snowpack, albeit with a slightly lower than average snow depth.
Meteorological and radiation measurements for WY13 (1 h, 24 h in blue) relative to the record climatology (24 h in black) from the SASP instrumentation tower. The highlighted area represents the measurement time period presented here.

During the measurement period, highlighted in gray in Figure 6, air temperatures (2013; −1.6°C, 2005–12; −1.2°C), wind speeds (2013; 1.4 m s−1, 2005–12; 1.2 m s−1), relative mean humidity (2013; 59%, 2005–12; 59%), longwave irradiance (2013; 240 Wm−2, 2005–12; 245 Wm−2), and solar irradiance (2013; 240 Wm−2, 2005–12; 250 Wm−2) were not notably variable from site climatology. There were notable colder than average temperatures associated with a snowfall event between 22 and 24 March when daily mean temperatures were 10°C cooler than normal (2013; −16°C, 2005–12; −7°C), with maximum daytime temperatures ~ −6°C and minimum nighttime temperatures ~ −20°C. Additional departures from the mean were associated with a winter storm between 14 and 18 April, during which there were peak wind speeds of up to 5 m s−1, drops in nighttime air temperature to nearly −20°C, and 50 mm of precipitation (22 cm of new snowfall). Notably warmer than average temperatures occurred between 28 and 30 April when temperatures were 5°C warmer than normal (2013; 5°C, 2005–12; −0.5°C), maximum daytime temperatures were ~10°C and nighttime temperatures barely reached the freezing point.
3.2. Snow observations and sampling
Daily measured values of snow depth and surface albedo, along with snow density, grain size and BC and dust concentration across the active layer (top 30 cm) are plotted in Figure 7. Although snow pit observations began before this time period (11 March), repairs to the field spectrometer delayed measurement of spectral albedo and grain size until 25 March (Table 1), at which point consistent observations of all parameters began. We include precipitation (from SASP collector) in these plots to show the influence of new snowfall on these values. We present results in the following order; (1) dust and BC concentrations, (2) snow profile observations and (3) snow albedo.
Evolution in snow depth, broadband albedo and active layer density, grain size and impurity concentrations at SASP between 25 March and 18 May 2013. Broadband albedo in the pit is integrated from daily spectral albedo measurements. Snow grain size has been resampled to correspond to gravimetric sample depth. Precipitation from the nearby collector, and snow depth and broadband albedo from the SASP instrumentation tower are also shown.

3.2.1. Dust concentrations
Ten episodic dust events were observed coincident with snow cover in WY13 (see Fig. 4), three of which occurred before measurements began (9 November, 8–9 February and 6–7 March), and one which occurred while snow cover was still present at higher elevations in SBBSA, but after snow all gone at SASP (23 May). In the first pit (P1; 11 March) we bagged all 1 L density cuts to capture concentrations across the full profile. This first profile was the cleanest sampled, with concentrations ranging from 0.0008 to 0.03 mg g−1 and an average concentration of 0.006 mg g−1. Of the first three dust events, all of which were minor, only dust event 2 (‘D2’) was visually identifiable in P1, 75 cm below the surface, and this layer coincided with the highest dust concentration. Concentrations suggest D1 was 150 cm below the surface just above the ground and D3 was 20 cm below the surface and both of these snow layers had concentrations of ~0.006 mg g−1. After P1, we limited analysis to the 10 gravimetric samples in the top 30 cm to focus on the optically relevant snow layers (Fig. 7).
Dust event 4 (‘D4’), the first dust event that was observed during our sampling period on 17 March, deposited 0.07 g m−2 of dust. The next event, D5 on 21 March, deposited 0.11 g m−2. Both D4 and D5 were minor events; on 25 March they were identified below new snow in the visual stratigraphy as ‘very faint’ and the corresponding snow samples had concentrations of 0.02 and 0.03 mg g−1, respectively. The next dust event, D6, occurred on 18 April and was the first significant deposition event of the season. There was 48 g m−2 of dust deposited over the duration of D6, which was 90% of the total dust mass deposited in 2013 and the most mass associated with any dust event, since measurements began in 2005. Visual stratigraphy on 10 April noted the ‘significant dust layer’ beneath 20 cm of new snow. The snow sample collected on 10 April that contained the D6 layer had a concentration of 8.6 mg g−1, the highest dust concentration ever recorded at SASP. As the snow around the D6 layer became denser over time the dust concentration of this layer decreased, but the dust mass remained relatively constant.
Two dust events were associated with the 14–18 April storm, D7 deposited 2.0 g m−2 on 14 April and D8 deposited 3.5 g m−2 between 15 and 17 April. In the next pit on 24 April D6–8 were still identifiable as individual dust layers below the surface, each with concentrations of ~0.2 mg g−1. On 30 April D7 and D8 merged at the surface and the final dust event of the season (D9) deposited an additional 1 g m−2 of dust (Fig. 8). D6 combined with D7–D9 at the surface on 2 May, increasing the surface concentration from 1.2 to 4.6 mg g−1. The combination of clear, sunny days and low albedo associated with emergence/convergence of dust layers from D4–9 over this time period initiated a rapid melt in the surface layers, leading to high-surface roughness and development of melt flow pathways. Despite the observed presence of liquid water, there was no scavenging of dust from the top 30 cm, the total amount of dust mass at the surface remained the same (~54 g m−2) (Fig. 8). We note here that the degree of decline in surface albedo was related to dust convergence and emergence at the snow surface (Fig. 8), discussed further in Section 3.2.4.
(Above) Dust concentrations in individual gravimetric cuts, plotted normal to the surface, showing the convergence/emergence of dust layers at the snow surface. (Below) Evolution in broadband snow albedo, timing of dust events (yellow bars) and timing and amount of precipitation (gray bars).

New snowfall from 5 to 10 May buried D4–9, raised albedo, and slowed melt temporarily. The merged dust layer surfaced again on 14 May. Snow depletion occurred shortly thereafter, 18 May was the last day on which there was enough snow to complete gravimetric sampling. Just prior to snow depletion there was minor scavenging of impurity mass from the surface, decreasing from 54 g m−2 (14 May) to 49 g m−2 on 18 May, a scavenging rate of 1.3 g m−2 or 2–3% d−1 (10% total mass loss). In this last pit dust concentrations ranged from 0.05 to 4.0 mg g−1 and were 0.5 mg g−1 on average, orders of magnitude higher than the first pit sampled. In fact, over the measurement period there was an increasing trend in dust content across all surface layers, including new snowfall (see Fig. 7). This is likely due to the increased atmospheric dust loading in this region, which peaks in April–May–June (Painter and others, Reference Painter, Skiles, Deems, Bryant and Landry2012b; Sorooshian and others, Reference Sorooshian2013), coinciding with peak dust emission in the Colorado Plateau source regions.
3.2.2. BC concentrations
Sampled BC concentrations ranged from 0.5 to 26 µg L−1 and exhibited strong association with dust concentrations (Fig. 9). As with dust, the lowest concentrations were sampled in the first pit on 11 March, which had an average BC concentration of 2.6 µg L−1 in the bulk snowpack. Dust and BC co-varied across the full measurement period, and to avoid being repetitive we quickly summarize; BC values were low in the first part of the measurements period, and rise with deposition of D6–9. Peak values are observed during periods of melt when D4–9 converged at the surface. In the final snowpit the average BC concentration was 6.8 µg L−1 and we did not observe a loss of BC concentrations to meltwater scavenging at the end of the season. The reader should note that we report BC concentrations in μg L−1 or parts per billion, whereas dust concentrations are in mg g−1 or parts per thousand (by weight). In Figure 9 dust and BC are plotted on the same scale to illustrate that the BC concentrations are 4–6 orders of magnitude lower than the dust concentrations over the measurement period.
Dust and black carbon concentrations with equivalent units.

BC is typically not present in high enough concentrations to be visually identifiable; therefore we have no record of stratigraphy or deposition events outside of what can be reconstructed from concentrations. The range in concentration values was not as great for BC, but the co-variation suggests deposition processes similar to those for dust. Except for a very few circumstances, dust and BC emission are not related processes; one is produced from arid and/or disturbed landscapes and the other is produced via the incomplete combustion of fossil and bio fuels. Potential processes are; (1) synoptic level events that deposit dust also bring BC from distal sources, or, (2) BC particles are associated with dust particles in arid source regions prior to emission.
Reynolds and others (Reference Reynolds2014) found conglomerations of carbonaceous particles with embedded mineral composition in dust from snow in the nearby Wasatch Mountain Range, UT. These could form prior to emission, during atmospheric transport, or after deposition into the snow cover. The relationship we found could also be an artifact of the way samples are prepared and analyzed. Additional measurements and further analysis are needed to better understand this relationship.
Measurements of BC at other mid-latitude mountain snow-cover sites are sparse, and this was the first year that BC was quantified at SBBSA, so there was limited data for comparison. Sterle and others (Reference Sterle, McConnell, Dozier, Edwards and Flanner2013), the only other study that we are aware of that has used an SP2 to quantify a time series of BC concentrations in snow in the Western US, sampled concentrations in melting snow in the Eastern Sierra Nevada, CA from 25 µg L−1 to 135 µg L−1. These concentrations are 5–12 times greater than what was found in Colorado under similar conditions. Sterle and others (Reference Sterle, McConnell, Dozier, Edwards and Flanner2013) also found that dust and BC concentrations co-varied, and that dust, even in much smaller quantities than occur at SASP, accounted for a greater portion of LAI radiative forcing. If the BC concentrations sampled in WY13 are representative, it is unlikely that BC is playing a significant role in radiative forcing in this region, especially in the presence of such consistent, extensive and heavy dust loading.
3.2.3. Snow observations
Four snow profiles that span the measurement period, showing grain size, density, temperatures and visual stratigraphy, are plotted in Figure 10. At the beginning of the measurement period the snowpack consisted of a meter deep slab of small rounded sintered grains above ~60 cm of faceted depth hoar. This stratigraphy is visualized in the P5 (26 March) profile; a relatively clean, consistent, cold snowpack with the exception of D4 and D5 at the near surface driving the formation of ice and melt-freeze layers. The P20 (14 April) profile was warmer and more variable with cold new snow at the surface above D6. A series of melt/freeze layers had formed below D6 indicating that it was absorbing solar radiation and influencing grain evolution below the surface. The P28 (29 April) profile was an isothermal snowpack with D6–8 in the surface layers. During this period the snowpack was complex, consisting of melt-freeze crusts and infiltrating liquid water to wetting fronts. The P35 (11 May) profile was a fully isothermal and melting snowpack, with the exception of the newer snow rapidly rounding/warming above D4–9.
Grain size, density and temperature profiles with visual stratigraphy identifying prominent features. Pits are labeled with corresponding pit number and date of collection. Pictures from these field days are shown below.

These profiles capture dust-influenced snow-cover evolution; melt freeze or ice layers are consistently observed beneath dust layers, even with minor events. In a cold temperature gradient snowpack these layers can influence vapor pressure gradients, leading to the formation of unique dust influenced stratigraphy. In the transition to a warmer snowpack, large melt-freeze agglomerations typically form around or below dust layers that are in the near surface. In an isothermal snowpack the rapid melting associated with surfaced dust layers and low albedo leads to the formation of flow pathways and wetting fronts, particularly above former ice layers. Below we discuss how the individual snow properties varied across the measurement period.
3.2.3.1. Temperature
Average snow temperature in P1 was −5°C, and the temperature profile was warmest near the ground, coldest in the mid-pack to in the near surface and warmer in the top 10 cm, typical of a wintertime mid-latitude snowpack. This was the coldest snowpack, from this point the bulk of the snowpack continued to warm, reaching 0°C on 12 April, marking a transition toward a melting snowpack. After this, temperatures in the active surface layers varied with surface temperature, but remained ~−0.5°C, dropping only during the mid-April storm to below −1.0°C. After this point, active layer temperature increased, corresponding to clearer skies and warmer temperatures that led to the convergence of D4–9 in the near surface. The first fully isothermal snowpack was measured on 24 April but had likely transitioned in the days prior to this. Our measurements indicate that the snowpack remained fully isothermal for the rest of measurements period, with the exception of new snow deposited between 6 and 8 May.
3.2.3.2. Snow depth
The deepest snow pit depth at the measurement site was recorded on 21 March at 1.77 cm and coincided with season peak accumulation at the SASP tower (1.78 cm). After this the overall trend in snowdepth was decreasing. Prior to D6, this average rate of decline was −2.8 cm d−1. Over the time period D6 was at or near the surface and D7–9 was deposited, this rate increased to −4.3 cm d−1. When D4–6 was combined with D7–9 at the surface on 2 May, this rate nearly doubled to −8.0 cm d−1 until melt out. The greatest daily change in snow depth occurred between 15 and 17 May, with −10 cm d−1. This rate of depth reduction is 40% greater relative to the last 2 weeks of snow cover in WY06 and 50% faster than WY12, both similarly low snow years but with lesser dust deposition.
3.2.3.3. Snow density
Snow density profiles were fairly typical of an intermountain west snowpack, usually less dense and more variable in the surface layers, more consistent and most dense in the mid pack, with decreasing density into the depth hoar above the ground. As would be expected due to metamorphism, mean snowpack density in all layers exhibited an increasing trend over the measurements period (Fig. 7), with steeper trends in the active surface layers.
Our measurements showed snow densification was not constant, plateauing as ablation progressed. Discounting decreases in surface density due to new snowfall the average rate of densification across the full profile was 6 kg m−3 d−1 over the first 3 weeks of measurements, 4 kg m−3 d−1 over the next 2.5 weeks when D6–9 was deposited and the snowpack transitioned to isothermal, and then 0.3 kg m−3 d−1 in the last 2 weeks, when the snowpack was melting and merged dust layers were at the surface. This slowing in densification rate was not unexpected; in the beginning of the measurement period a high temperature gradient was still present, which lessened as the snowpack transitioned to a melting snowpack during the middle of the measurement period, and slowed further as the control of snow metamorphism shifted toward the presence of liquid water in the absence of a temperature gradient in the last 2 weeks of snow cover.
Counterintuitive to the general understanding of snow densification over time between 27 April and 2 May and between 14 and 18 May surface density exhibited a decreasing trend in the absence of new snowfall. Painter and others (Reference Painter, Seidel, Skiles, Bryant and Rittger2013) suggested an unexpected trend such as this in the presence of the heavy dust loading near or at the surface could be due to dust accelerated melt. The rapid melting in the surface layers could remove mass from individual grains surrounding impurities preferentially. Without enough time for metamorphism to compensate this would result in the observed high-surface roughness and decreased density at the surface and increased density in the subsurface where the meltwater refreezes. Meinander and others (Reference Meinander2014) documented a similar reduction in snow-surface density after BC was manually deposited on natural snow in Finland, and suggested it was due to a reduction in surface water holding capacity due to the presence of impurities. Additional measurements during melt periods of heavy dust years will give us a better understanding of this process.
3.2.3.4. Grain size
As with density, grain sizes exhibited increasing trends over the season with steeper trends in the active surface layer (Fig. 7). Across the full profile, average snow growth was slowest (~1 µm d−1) over the first 2.5 weeks, when the snowpack retained cold content, Over the next 2.5 weeks, with dust deposition and the transition to an isothermal snowpack, it increased to ~10 µm d−1. In the last 2 weeks as the snowpack melts it lessened again to ~5 µm d−1.
Over the first 2 weeks the mean rate of grain growth in surface layers was 10 µm d−1 (19 µm d−1) for the top 10 cm (top 4 cm). These rates increased over the next 2.5 weeks to 17 µm d−1 (27 µm d−1) over the time period during which dust deposition occurred and the snowpack transitioned to isothermal. Over the last 2 weeks, the growth slowed to 1 µm d−1 (3 µm d−1). We suggest the enhanced rates of growth over the middle to end of April correspond with enhanced grain growth by dust deposition, whereas a slowing in the growth rates at the end of the season correspond to the shift in control of snow metamorphism to liquid water.
As with density, a decrease in surface grain size was observed in the absence of snowfall over the two time periods when D6-9 was at the surface. Between 3 and 5 May surface grain size decreased by ~100 µm. In the last week of snow cover surface grain size decreased by ~60 µm between 9 and 17 May. Again, we suggest that impurities/impurities clusters enhance the transition of phase rate from solid to liquid in the surrounding grains, as water infiltrates the snowpack both grain size and density in the surface layers is reduced. If the lower elevation snow cover receives heavier dust loading than alpine snow cover, which is suggested by the SBBSA dust record (Painter and others, Reference Painter, Skiles, Deems, Bryant and Landry2012b), this reduction in grain size at the end of the season could help explain the counter-intuitive elevational grain size trend detected in remote-sensing imagery in Painter and others (Reference Painter, Seidel, Skiles, Bryant and Rittger2013) and Seidel and others (Reference Seidel, Rittger, Skiles, Molotch and Painter2016).
We recognize that very high-dust concentrations, like those sampled here, could impact the grain size retrieval by dampening the absorption feature. Nolin and Dozier (Reference Nolin and Dozier2000) notes that the retrieval method works best for snow with dust concentrations of <1%. Our peak dust concentrations, ~0.85%, do approach 1%. If high-dust concentrations were significantly impacting the grain size retrieval, though, we would expect to see noticeably depressed grain sizes for layers with high-dust content, which was not the case. We observed decreased grain size when high-dust content was at the surface, but not when there was high-dust content in the subsurface. When high dust was present in the subsurface the grain sizes were similar to or larger than the cleaner snow grains in the bulk snowpack (see Fig. 10), and grain sizes in these layers had an increasing trend until the dust layer reached the surface and the decrease in grain size was observed.
Still, this introduces uncertainty, and it is worthwhile to assess the impact of high-impurity content on grain sizes retrievals. We initiated a sensitivity analysis effort by modeling snow reflectance for a range of dust concentrations and grain sizes with the Snow, Ice and Aerosol Radiation model (SNICAR) but quickly found that the model could not replicate observed albedo in either reflectance shape or magnitude due to the generic representation of dust optical properties in the model (see partner paper Skiles and others, Reference Skiles, Painter and Okin2016). Therefore we plan to investigate the sensitivity of the grain size retrieval further in future work using an updated version of SNICAR, which incorporates the regionally specific dust optical properties presented in Skiles and others (Reference Skiles, Painter and Okin2016).
3.2.4. Surface albedo
Spectral snow albedo exhibited high variability across the measurement period (Fig. 11), and as mentioned earlier, declines in snow albedo were closely related to dust content in the surface layers (Fig. 8). In the beginning of the measurement period albedo was high, but slowly decayed as D4 and D5 were in the surface/near surface layers. New snowfall on 8–9 April refreshed albedo, but it quickly declined with D6 in the near surface. Due to new snowfall relatively high albedo values were maintained through 23 April. After D6–8 converged/emerged at the surface, there was a quick decline in albedo to ~0.3 on 30 April and it remained this low until snowfall between 5 and 8 May. The new snow slowed the radiative impact from high-dust concentrations briefly, but as D6–9 resurfaced, albedo decay quickly resumed and albedo remained ~0.3 for 6 d, forcing the rapid melt and decrease of snow depth at the end of the season.
Temporal evolution in spectral snow albedo over the measurement period, showing the variation in dust-influenced albedo during melt, and the rapid reduction in albedo that can occur across just a few days.

The two time frames of extremely low albedo correspond to the counter-intuitive observations in surface density/grain size reduction. NIR albedo values were higher than VIS albedo values on 4 and 5 May, and again on 15 May supporting the hypothesis of grain-size reduction. The only other year that this low of an albedo was measured for this long was WY09, the next highest dust-loading year.
In the absence of impurities, broadband snow albedo would be dominated by ice absorption in the NIR wavelengths, but in the presence of dark impurities, the control of the signal shifts to the visible wavelengths due to absorption by LAIs. Our measurements reflect this understanding of snow albedo; broadband albedo is more strongly related to dust concentrations than grain size (Fig. 12). There is a strong negative log-linear relationship between surface dust concentrations and VIS albedo, indicating even minor additions of dust mass accelerate albedo reduction. The relationship is strongest with dust concentrations at the surface, but also exists for dust concentrations in the near surface layer (3–6 cm) (Fig. 13). Below 6 cm no significant relationship is exhibited between dust content and albedo.
The inverse relationships between surface grain size, dust concentration and VIS/NIR/BB albedo with lines of best fit, correlation coefficient, and R2 value. The strongest is the log-linear relationship between surface dust concentration and visible/broadband albedo.

The relationship between visible albedo and dust concentrations for individual layers across the top 30 cm. Although the strongest correlation exists between albedo and dust in the surface layer, as might be expected, albedo is also related to dust content between 3 and 6 cm below the surface.

4. CONCLUDING THOUGHTS
Here a dataset was presented that contains measured dust and BC concentrations, optical grain size, albedo and other full profile snow properties over a full ablation season. Over the course of measurements there were multiple episodic dust events, including the single largest dust event ever recorded. Scavenging of dust by meltwater was negligible, and as dust layers converged at the surface, there was enhanced grain growth, a decline in snow albedo and rapid reduction of snow depth. When surface dust concentrations peaked, there was a corresponding reduction in both density and grain size at the surface, which was unexpected. BC concentrations exhibited similar temporal patterns to dust concentrations, but were very low. Given that Sterle and others (Reference Sterle, McConnell, Dozier, Edwards and Flanner2013) found in the Sierra Nevada Mountains the dust dominated snow radiative forcing in the presence of lower dust and higher BC concentrations than presented here, the impact of BC on albedo decline and radiative forcing in the Rocky Mountains is likely negligible in the presence of such heavy dust loading. Broadband albedo exhibited a weak negative relationship with grain size and strong negative log-linear relationship with dust content in the top 3 cm. There was also a relationship between albedo and dust content between 3 and 6 cm below the surface, but none below 6 cm, indicating dust was most effective at forcing albedo decline once it was in the top 6 cm.
These measurements will allow us to model the optical properties of dust in snow, partition radiative forcing between dust and BC, develop algorithms to improve detection and modeling of LAI radiative forcing, assess how well models handle snow evolution in the presence of dust, and compare explicit representations of dust radiative forcing to semi-empirical methods. Previous studies have shown dust deposition on mountain snow cover can alter timing and amount of peak flow and reduce water availability in the western US (Painter and others, Reference Painter2010; Skiles and others, Reference Skiles, Painter, Deems, Landry and Bryant2012), and the data record indicates that extreme dust years like WY13 may become more frequent. Modeling efforts that will utilize the measurements presented here should contribute toward more accurate quantification of LAI in snow processes as well as improved modeling of energy and mass balance, not only in the western US but also in other regions that experience dust and BC deposition, such as the Himalaya, ranges of Central Asia and the Andes. As disturbance of arid lands increases and the amount of BC from incomplete combustion continue to rise, mountain snow cover is at increased risk for deposition of light absorbing impurities, making this effort not only important, but also urgent.
ACKNOWLEDGEMENTS
We acknowledge Chris Landry/The Center for Snow and Avalanche Studies for maintenance of Swamp Angel Study Plot and data availability from the energy balance tower. We thank Ian Delaney and Jeffrey Deems for their assistance with snow observations. We thank Shuka Schwarz and another anonymous reviewer for their comments and suggestions, which improved the paper. This work was funded by the NASA project NNX10AO97G. Part of this work was performed at the Jet Propulsion Laboratory, California Institute of Technology under a contract from NASA.


 Open access