

1. Introduction
Internal transcribed spacer (ITS; Fig. 1A) region of 18S–5·8S–26S nuclear rDNA (nrDNA) is an established region for molecular phylogenetic analysis at the genus or species level (Hemleben et al., Reference Hemleben, Ganal, Gerstner, Schiebel, Torres and Kahl1988; Baldwin et al., Reference Baldwin, Sanderson, Porter, Wojeiechowski, Campbell and Donoghue1995; Álvarez & Wendel, Reference Álvarez and Wendel2003). Although ribosomal RNA genes are present as tandem arrays at one or more loci in the genome, they are homogenized by molecular mechanisms that are collectively referred to as ‘molecular drive’ (Dover, Reference Dover1986) and, hence, a representative rDNA sequence, including ITS, can be used for inferring molecular phylogeny.
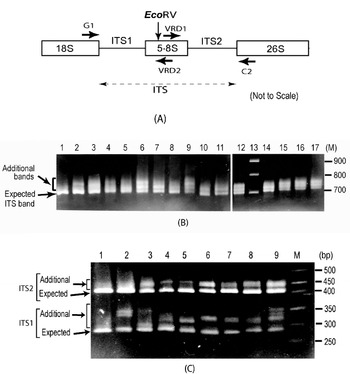
Fig. 1. (A) Schematic representation of ITS region of 18S–5·8S–26S rDNA repeat unit. Binding sites of primers used (G1, C2, VRD1 and VRD2) and the position of the EcoRV site are indicated. (B) ITS length variants among some V. radiata accessions as observed on a 2·0% high-resolution agarose gel. Lane 1, PUSA-93-72 (a single ITS band); lane 2, PUSA-90-31; lane 3, PUSA-96-22; lane 4, TARM-22; lane 5, TARM-18; lane 6, TARM-2; lane 7, PUSA-102; lane 8, PUSA-106; lane 9, TPM-1; lane 10, JL-781; lane 11, S-24-1; lane 12, TARM-21; lane 13, Marker (100 bp ladder); lane 14, PUSA-105; lane 15, PUSA-95-31; lane 16, PUSA-95-71; lane 17, PDM-1. Arrows indicate expected and additional ITS fragments. (C) EcoRV digestion of ITS (to see variations in ITS1 and ITS2 fragments) from some V. radiata accessions as observed on a 2·5% high resolution agarose gel: lane 1, PUSA-93-72 (single ITS1 and ITS2 fragments); lane 2, PUSA-90-31; lane 3, PUSA-96-22; lane 4, TARM-22; lane 5, TARM-18; lane 6, TARM-2; lane 7, PUSA-102; lane 8, PUSA-106; lane 9, TPM-1; lane M, marker (50 bp ladder). Arrows indicate expected and additional fragments harbouring ITS1 and ITS2.
However, several reports of intra-individual rDNA variation among different organisms, including plants, have appeared in the literature recently (Bailey et al., Reference Bailey, Timothy, Stephen and Colin2003; Razafimandimbison et al., Reference Razafimandimbison, Kellogg and Bremer2004). This intra-individual variation is found to be due to interplay of two factors, viz. accumulation (or addition) of new variants and the rate of homogenization (Schlötterer & Tautz, Reference Schlötterer and Tautz1994). In plants, examples of rDNA units not homogenized even after thousands of generations as well as rapid homogenization occurring in a few generations are reported in the literature (Álvarez & Wendel, Reference Álvarez and Wendel2003; Dadejová et al., Reference Dadejová, Lim, Soucková-Skalická, Matyášek, Grandbastien, Leitch and Kovařík2007). Recent studies indicate that homogenization of rDNA repeats is preceded by ‘rRNA gene silencing’ and decrease in copy number (Dadejová et al., Reference Dadejová, Lim, Soucková-Skalická, Matyášek, Grandbastien, Leitch and Kovařík2007).
With the transfer of subgenus Macrorynchus to genus Wajira (Thulin et al., Reference Thulin, Lavin, Pasquet and Delgado-Salinas2004), the number of subgenera in the genus Vigna decreased to six. Among them, Ceratotropis is a homogeneous group of species of Asian origin and includes several agriculturally important species: Vigna radiata (mungbean), Vigna mungo (urdbean), Vigna angularis (azuki bean), Vigna aconitifolia (mothbean), Vigna umbellata (ricebean), etc. (Baudoin & Maréchal, Reference Baudoin and Maréchal1988). The relationship and diversity among species from subgenus Ceratotropis have been studied by various methods, such as analysis of F1 hybrids (Egawa et al., Reference Egawa, Nakagahra and Fernandez1988), biochemical markers (Jaaska & Jaaska, Reference Jaaska and Jaaska1990) and DNA markers, viz. Restriction Fragment Length Polymorphism (RFLP) (Fatokun et al., Reference Fatokun, Danesh, Young and Stewert1993), Random Amplified Polymorphic DNA (RAPD) (Kaga et al., Reference Kaga, Tomooka, Egawa, Hosaka and Kamijima1996), Amplified Fragment Length Polymorphism (AFLP) (Yoon et al., Reference Yoon, Doi, Kaga, Tomooka and Vaughan2000), Inter-Simple Sequence Repeat (ISSR) (Ajibade et al., Reference Ajibade, Weeden and Chite2000) and ITS sequence analysis (Doi et al., Reference Doi, Kaga, Tomooka and Vaughan2002; Goel et al., Reference Goel, Raina and Ogihara2002).
The V. radiata genome has ~1500 copies of 18S–5·8S–26S rDNA repeats (Gerstner et al., Reference Gerstner, Schiebel, von Waldburg and Hemleben1988); however, the number of loci and their chromosomal locations is not known. The ITS of V. radiata was characterized by Schiebel & Hemleben (Reference Schiebel and Hemleben1989) and has been utilized for inferring the relationship of species within the Phaseolus–Vigna complex (Delgado-Salinas et al., Reference Delgado-Salinas, Turley, Richman and Lavin1999; Goel et al., Reference Goel, Raina and Ogihara2002) and subgenus Ceratotropis (Doi et al., Reference Doi, Kaga, Tomooka and Vaughan2002). Among the Vigna species, intra-individual rDNA variants (based on the analysis of intergenic spacer region) are reported only in V. radiata (Gerstner et al., Reference Gerstner, Schiebel, von Waldburg and Hemleben1988; Schiebel et al., Reference Schiebel, von Waldburg, Gerstner and Hemleben1989). Comparative analysis of Intergenic Spacer (IGS) was also carried out in V. radiata and V. angularis (Unfried et al., Reference Unfried, Schiebel and Hemleben1991). Recently, we have shown intra-individual variants in 18S–5·8S–26S rDNA of V. radiata due to partial methylation of a BamHI site in ITS (Saini et al., Reference Saini, Krishna, Reddy and Jawali2000a). Further, our study on ITS among five V. radiata accessions by PCR and restriction analysis has revealed the presence of multiple intra- and inter-individual ITS length variants (Saini et al., Reference Saini, Reddy and Jawali2000b).
The above-mentioned studies indicate a high intra-individual rDNA ITS heterogeneity among V. radiata. The objectives of this study were: (i) to analyse the extent of intra- and inter-individual ITS variability in several V. radiata accessions, (ii) to evaluate intra-individual ITS heterogeneity in wild and cultivated types of V. radiata, (iii) to analyse how widespread is the intra-individual heterogeneity among species from subgenus Ceratotropis and (iv) to analyse the transcriptional status of the intra-individual ITS variants in a few accessions of V. radiata.
2. Materials and methods
(i) Plant material
V. radiata accessions (a total of 56) from the different national agencies (IARI, New Delhi, India; IIPR, Kanpur, India; PAU, Ludhiana, India; BARC, Mumbai, India) analysed are given in Table 1. The accessions included released varieties as well as breeding lines. Twenty-five accessions of ten species belonging to subgenus Ceratotropis including wild and cultivated types of most of them were obtained from the National Botanic Garden (Meise), Belgium (numbers 1–25 in Table 2).
Table 1. List of V. radiata (mungbean) accessions used
BARC, Bhabha Atomic Research Centre; IARI, Indian Agricultural Research Institute; IIPR, Indian Institute of Pulses Research; PAU, Punjab Agriculture University.
Table 2. List of Vigna accessions belonging to the subgenus Ceratotropis analysed
Accessions 1–25 are from the National Botanic Garden, Belgium.
a These are accession numbers of the National Botanic Garden, Belgium.
b These are V. radiata accessions from our collection.
(ii) DNA extraction, PCR amplification and agarose-gel electrophoresis
Total DNA was isolated from young leaves of 15-day-old plant by the method of Krishna & Jawali (Reference Krishna and Jawali1997). The DNA was treated with RNAse, further purified and quantitated according to Prasad et al. (Reference Prasad, Reddy and Jawali1999).
ITS region was amplified by PCR using primers G1 (5′-GGAAGGAGAAGTCGTAACAAGG-3′) and C2 (5′-TCCTCCGCTTATTGATATGC-3′) (Saini et al., Reference Saini, Krishna, Reddy and Jawali2000a). PCR was performed in a 25 μl reaction buffer containing 0·2 μM of each primer, 0·2 mM of each dNTP, 25 ng of genomic DNA, 2·5 μl of 10× thermopol buffer (NEB, USA) and 1·0 unit of Vent DNA polymerase (NEB, USA). PCR was carried out in an Eppendorf Mastercycler gradient machine using the following cycling conditions: 94°C (5 min) for initial denaturation; 35 cycles of 94°C (1 min), 60°C (1 min) and 72°C (1 min), followed by a final extension at 72°C (10 min). Negative control (without genomic DNA) was included in each set of amplification.
Where mentioned, the ITS1 and ITS2 regions were separately PCR-amplified using the primer VRD2 (5′-CGGGATTCTGCAATTCACACCAAG-3′) in combination with G1 and VRD1 (5′-CGTGAACCATCGAGTCTTTGAACGC-3′) in combination with C2 (Fig. 1A). The PCR components and conditions were the same as above, except that the extension time was 45 s.
The PCR products were analysed by electrophoresis in 1× TBE on a 2% (or 2·5%) high-resolution agarose gel (Sigma–Aldrich, USA) at 8–10 V/cm. The DNA fragments were visualized by ethidium bromide staining and viewing under UV light. The images were grabbed by the Gel-documentation system from Syngene (Syngene, UK).
(iii) Restriction analysis by EcoRV
A conserved EcoRV site located in 5·8S gene (Fig. 1A) is present in all legume species and is useful for detecting variations in ITS1 and ITS2 (Saini et al., 2000 b). The ITS product (~500 ng) was digested with EcoRV (Bangalore Genei, India) overnight and subsequently analysed on a 2·5% high-resolution agarose gel.
(iv) Isolation of ITS variants
Where mentioned, the PCR products were separated on a 2% high-resolution agarose gel and the fragments with varying mobility were isolated by the band-stab PCR method (Bjourson & Cooper, Reference Bjourson and Cooper1992) and using primers G1 and C2 as described above. Thus obtained ITS products were digested with EcoRV and analysed on a 2·5% high-resolution agarose gel for ascertaining the purity of the isolated fragment.
(v) Cloning of ITS and colony PCR
The PCR product was ligated to the vector plasmid BlueScript at the EcoRV site using a Rapid DNA ligation kit (Roche Molecular Biochemicals, Germany). The ligation product was transformed into Escherichia coli (strain DH5α) and the recombinant clones were identified by the blue/white screening method as per Sambrook et al. (Reference Sambrook, Fritsch and Maniatis1989). The white colonies that carry recombinant plasmid were stabbed with a fine sterile needle tip and immersed briefly into a PCR tube containing 25 μl PCR reaction mixture. The insert was PCR-amplified using primers G1 and C2 as described above.
(vi) DNA sequencing
The PCR products of ITS were sequenced from both the ends using primers G1 and C2 and ~30 ng template on an ABI 377 Automated DNA sequencer (Applied Biosystems, USA). The accession numbers of the sequences submitted to GenBank database are listed in Table 2.
(vii) Heteroduplex analysis
Equal amount of ITS product from two (or more) clones were mixed in a known volume, incubated at 94°C. After 5 min, the tubes were shifted to room temperature and allowed to cool slowly to room temperature. The following controls were included in the analysis: (i) single ITS product (denatured and reannealed) and (ii) a mixture of ITS products (without denaturation and reannealing). The mixed ITS products were digested with EcoRV enzyme and analysed on a 2·5% high-resolution agarose gel to view ITS1 and ITS2 fragments.
(viii) Mixed-template PCR
Two or more ITS variants were mixed in different combinations and used as templates in PCR. This was carried out to find out if some new or additional (other than the expected) ITS fragments were generated during the PCR amplification. The components and conditions used for PCR were the same as mentioned earlier for ITS amplification. The amplified ITS products were digested with EcoRV and analysed on a 2·5% high-resolution agarose gel to view ITS1 and ITS2 fragments.
(ix) Sequence analysis
The ITS product sequences include ITS1, 5·8S, ITS2 and parts of the 18S and 26S rRNA genes. The different regions (ITS1, ITS2 and 5·8S) of the sequences were identified by comparing with the published ITS sequences (Schiebel & Hemleben, Reference Schiebel and Hemleben1989; Goel et al., Reference Goel, Raina and Ogihara2002), and used for analysis. The sequences generated in this study (Table 2) and those reported by others (X14337, Schiebel & Hemleben, Reference Schiebel and Hemleben1989 and Doi et al., Reference Doi, Kaga, Tomooka and Vaughan2002, Goel et al., Reference Goel, Raina and Ogihara2002 in Supplementary Table S1) were used in the analysis. Combined spacer (ITS1+ITS2) sequences were aligned by ClustalX (version 1.8) software (Thompson et al., Reference Thompson, Gibson, Plewniak, Jeanmougin and Higgins1997) using default parameters, visually assessed, edited using GeneDoc software (Nicholas et al., Reference Nicholas, Nicholas and Deerfield1997) and used for phylogenetic analysis.
(x) Phylogenetic analysis
Phylogenetic reconstruction was done by Neighbour-Joining (NJ) (Saitou & Nei, Reference Saitou and Nei1987) and Maximum-Parsimony (MP) (Fitch, Reference Fitch1971) methods using MEGA (version 2.1) software (Kumar et al., Reference Kumar, Tamura, Jakobsen and Nei2001). The ITS of Vigna unguiculata (subgenus Vigna) was used as an outgroup. The Kimura two-parameter model (Kimura, Reference Kimura1980) was used for generating an NJ dendrogram and an MP dendrogram was generated using the Close-Neighbour-Interchange (CNI) method with search level ‘3’ (Nei & Kumar, Reference Nei and Kumar2000). Statistical analysis was carried out by the bootstrap method (Felsenstein, Reference Felsenstein1985) for both the NJ-Tree (1000 replicates) and MP-Tree (500 replicates).
(xi) Secondary-structure analysis
Minimum-energy secondary structures of ITS1 and ITS2 were estimated for all the intra-individual ITS variants from V. radiata using MFold (version 3.1) program (Mathews et al., Reference Mathews, Sabina, Zuker and Turner1999; Zuker, Reference Zuker2003) (available at the website http://www.bioinfo.rpi.edu/~Zuker/rna).
(xii) Reverse transcriptase-PCR (RT-PCR)
Total RNA was isolated from leaves of 15-day-old seedlings using TRI-Reagent (MRC, USA). RNA was treated with RNAse-free DNAse and subsequently the DNAse was inactivated. Approximately 100 ng of total RNA was reverse-transcribed using a First-Strand cDNA Synthesis kit (Roche Diagnostics, Germany) in a 50 μl reaction mix containing 25 pmol of primer C2 by following the protocol provided by the manufacturer. First-strand cDNA product (1 μl) was used for PCR amplification of complete ITS as well as ITS1 and ITS2 separately. Blank (no template), positive (with genomic DNA) and negative (−RT) controls were also included for each set of reactions. The ITS products were cloned and sequenced as mentioned above to identify the variants.
3. Results
(i) Intra- and inter-individual ITS variants in V. radiata
Analysis of the PCR-amplified ITS products showed one to four intra-individual ITS bands among V. radiata accessions. Of the 56 accessions analysed, 54 yielded two or more fragments ranging from ~700 to ~770 bp (Fig. 1B). Two accessions, PUSA-93-72 (lane 1, Fig. 1B) and ML-127, showed a single ITS fragment of the expected size (~700 bp), while TPM-1 (lane 9, Fig. 1B), PUSA-117, PUSA-94-72, PUSA-96-32 and PDM-1 showed four variants.
Analysis of ITS products using enzyme EcoRV revealed variation to be present in both ITS1 and ITS2 fragments (Fig. 1C). ITS1 showed higher length variation (~285 to ~365 bp) than ITS2 (~415 to ~465 bp). Among all the V. radiata accessions that showed multiple ITS, the smallest ITS1 and ITS2 fragments were of the expected size (Supplementary Fig. S1). PUSA-93-72 (lane 1, Fig. 1C) and ML-127 that yielded single ITS showed single ITS1 and ITS2 fragments of the expected size.
(ii) Characterization of intra-individual ITS variants
V. radiata accessions that yielded one (PUSA-93-72 and ML-127), two (JL-781 and PUSA-90-31) and three (TARM-2) ITS bands were further analysed. Individual ITS variants could not be isolated by the band-stab PCR method as the analysis of re-amplified products by EcoRV revealed presence of multiple products. Hence the ITS products were cloned and screened for variation in length by colony PCR. As the quantities of ITS variants in the PCR product were nearly equal (judged from the relative band intensities, Fig. 1B), analysis of a small number of clones should detect all ITS variants. On the contrary, even on screening a large number of clones (80–100) belonging to an individual accession, ITS length variants (difference in the range of 20–70 bp, Fig. 1B) were not detected.
It was also observed that the individual ITS clones did not yield multiple ITS variants upon PCR amplification (Fig. 2A). The presence of ITS sequence variants in the V. radiata genome could result in the formation of heteroduplex ITS molecules during the PCR process per se. Due to their reduced mobility compared with homoduplex, the heteroduplex molecules may appear as length variants (Wallace, Reference Wallace and Taylor2001). This possibility was assessed in TARM-2 and JL-781 by heteroduplex analysis of ITS clones coupled with EcoRV digestion, as described in the Materials and methods section. Analysis of ITS clones of TARM-2 revealed that additional ITS1 and/or ITS2 fragments were generated with certain combinations of clones (Fig. 2C). However, no additional ITS1 and/or ITS2 fragments were observed when clones were individually analysed (lanes 1–4, Fig. 2B), or when two (or more) ITS variants were mixed but not denatured and reannealed (lane 5, Fig. 2B). Based on the combination of mobility difference of heteroduplex ITS1 and ITS2 fragments, the ITS clones of TARM-2 were grouped into four types (A, B, C and D).
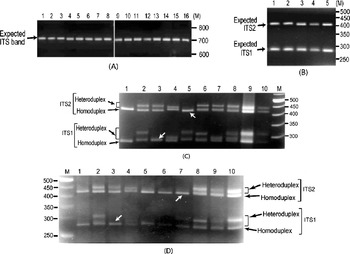
Fig. 2. (A) ITS region PCR-amplified from individual clones (lanes 1–16) of TARM-2. No ITS length variants are observed. The expected-size ITS band is indicated by arrow. (B) EcoRV digestion of individual ITS variants, A (lane 1), B (lane 2), C (lane 3) and D (lane 4), of TARM-2 after denaturing and reannealing and a mixture of ITS variants (lane 5) without denaturing and reannealing. Arrow indicates expected ITS1 and ITS2 fragments, however, no additional fragments are observed. (C) ‘EcoRV analysis’ of the heteroduplexes obtained by mixing ITS variants (A, B, C and D) of TARM-2 in different combinations. Lane 1, D; lane 2, A+B; lane 3, A+C; lane 4, A+D; lane 5, B+C; lane 6, B+D; lane 7, C+D; lane 8, A+B+C+D; lanes 9 and 10, EcoRV-digested ITS product amplified from genomic DNA (different amounts loaded). ‘M’ is the 50 bp DNA ladder used as a marker. Homo- and hetero-duplex fragments are indicated. Arrows indicate absence of heteroduplex ITS1 in the combination A+C and ITS2 in the combination B+C. (D) Mixed-template PCR analysis of different combinations of ‘ITS variants’ (A, B, C and D) from TARM-2 followed by ‘EcoRV analysis’. Lane 1, A type; lane 2, A+B; lane 3, A+C; lane 4, A+D; lane 5, B; lane 6, B+B; lane 7, B+C; lane 8, B+D; lane 9, A+B+C+D; lane 10, TARM-2 ITS products from genomic DNA. ‘M’ is the 50 bp DNA ladder used as a marker. Homo- and hetero-duplex fragments are indicated. Arrows indicate the absence of heteroduplex ITS1 in the combination A+C and ITS2 in the combination B+C. Note: No new/additional (other than expected) ITS fragments were observed.
Heteroduplex ITS1 and ITS2 fragments were observed with all combinations of ITS variants (lanes 2–8, Fig. 2C) except the combination A+C (lane 3, Fig. 2C) that yielded single ITS1 and the combination B+C (lane 5, Fig. 2C) that yielded a single ITS2 fragment. These results indicate that ITS2 from B and C and ITS1 from A and C are either same or similar. The EcoRV profile of the four TARM-2 ITS variants (A+B+C+D) taken together (lane 8, Fig. 2C) matched that of total ITS product from the genomic DNA (lanes 9 and 10, Fig. 2C), suggesting that the ITS types identified probably represent the major ITS variants present in the TARM-2 genome. The analysis mentioned above identified two ITS variants (A and E) in JL-781 and a single ITS sequence (A type) each in PUSA-93-72 and ML-127. These results clearly demonstrate that the ITS variants observed among V. radiata accessions are heteroduplex molecules.
Mixed-template PCR analysis of the ITS variants (A, B, C and D types) of TARM-2 followed by EcoRV digestion showed only expected ITS1 and ITS2 fragments. No new/additional ITS fragments were observed in any combination of ITS variants as evident from the ITS1 and ITS2 fragment profiles (Fig. 2D). Although the results of the heteroduplex analysis matched the mixed-template PCR analysis in the case of ITS variants from TARM-2 (compare Fig. 2C and Fig. 2D), the possibility of some recombinant (or chimaeric) ITS molecules being generated during PCR cannot be completely ruled out.
The sequence of ITS from clones belonging to a particular group (A/B/C/D) were found to be identical and, hence, a representative sequence was used for subsequent analysis. A total of four indel regions, two in ITS1 (2–4 bp) and two in ITS2 (3 bp each) were identified among different ITS variants (Table 3) that resulted in a length variation of 2–6 bp. The presence/absence of these indels correlated well with the mobility difference observed between the homo- and hetero-duplex ITS1 and ITS2 fragments (Table 3 and Fig. 2C).
Table 3. Correlation between the presence of indel regions in ITS1 and ITS2 and heteroduplex ITS1 and ITS2 fragments observed, in ITS variants from TARM-2 and JL-781
a ‘ITS variants’ used in heteroduplex analysis followed by EcoRV analysis.
b ‘+’ and ‘−’ indicate the presence and absence of low mobility (heteroduplex) ITS1 or ITS2 fragments.
c ‘−’ and ‘+’ show the presence and absence of indel regions among ITS variants used for heteroduplex analysis.
(iii) Intra-individual ITS variants in wild and cultivated accessions of V. radiata
The status of ITS variants among three wild and two cultivated V. radiata types, originating from different eco-geographic locations (Table 2), was studied. Analysis of PCR products by EcoRV digestion revealed intra-individual ITS variants in two cultivated (NI 1012 and NI 127) and one wild (NI 634) type and not in other two wild type accessions (NI 1607 and NI 1135, Fig. 3). Cloning, heteroduplex analysis and sequencing of about 40 clones from each accession detected six intra-individual ITS variants in NI 1012 and five each in NI 127 and NI 634.
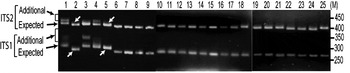
Fig. 3. ‘EcoRV profiles’ of ITS products of 25 Vigna accessions as observed on a 2·5% high resolution agarose gel. Arrows indicate expected and additional ITS1 and ITS2 fragments. Lane numbers (1–25) indicate the accessions listed in Table 2. Arrows indicate V. radiata accessions that showed single ITS1 and ITS2 fragments. ‘M’ indicates the 50 bp DNA ladder.
Multiple sequence alignment and analysis of a total of 30 V. radiata ITS1+ITS2 sequences, including sequences from the present study and from earlier publications (Supplementary Table S1), identified eight indels and 43 substitutions (23 substitution after excluding var. setulosa). The indels ranged from 2 to 8 bp in length (#1 to #8, Table 4 and Supplementary Fig. S2). Five of these indels (#1 to #5) were localized in ITS1 and three (#6 to #8) in ITS2. The substitutions among the intra-individual ITS variants ranged from 1–4 in NI 127, 2–5 in NI 1012, 1–6 in TARM-2, 3–7 in NI 634 and 9 in JL-781. In general, variation (in both length and sequence) was found to occur more frequently in ITS1 than ITS2. Some indels were specific to either wild or cultivated V. radiata. For example, the 8 bp deletions at #3 and #5 and a 5 bp deletion at #8 were found only in var. setulosa. Similarly, the 4 bp deletion at #2 was found only among var. sublobata and a 3 bp insertion at #7 was detected mostly among var. sublobata. The 5 bp sequence motif at indel #4 showed sequence variation specific to different V. radiata types (Supplementary Fig. S2).
Table 4. Indel variation among the ITS variants identified in wild and cultivated type V. radiata accessions
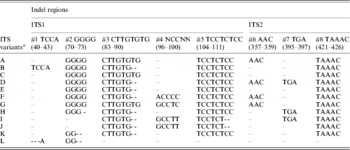
a ITS variants identified in V. radiata accessions in the present study. ‘ITS variant A and I’ were also present as a single ‘ITS sequence’ in var. radiata and var. sublobata accessions. The ITS sequence of var. setulosa was referred to as ‘ITS variant L’. Numbers in parentheses indicate the corresponding positions in Supplementary Fig. S2.
Based on the indels, 12 ITS variants (ITS variant A–L) were identified (Table 4). Of them, A–D were found among the cultivated V. radiata, I and J among the wild types, whereas C and E were found in both. ITS variant A was present among all the cultivated V. radiata, whereas ITS variant I was found among the wild V. radiata. The ITS variant L was specific to V. radiata var. setulosa.
(iv) Secondary-structure analysis of ITS variants
Secondary-structure analysis of ITS1 and ITS2 of V. radiata ITS variants (A–K) by MFold program revealed the presence of four domains (I–IV) in ITS1 (Supplementary Fig. S3A), and three (I–III) in ITS2 (Supplementary Fig. S3B). Most of the domains in ITS1 were conserved among the ITS variants despite indels among them, except in the ITS variant K. The ITS2 also showed conserved secondary-structure domains except in variants H and I, where domain III was split into two sub-domains (IIIA and IIIB). The minimum free energy values did not show a large variation and all the variants showed stable secondary structures of ITS1 (−68·07 to −89·94 kcal/mol) and ITS2 (−78·00 to −84·60 kcal/mol). The minimum free energy values of the transcriptionally active ITS variants (see below) were also found to be in the same range, indicating that the variants do not belong to pseudogene rDNA repeat units.
(v) Expression analysis of intra-individual ITS variants
Transcriptional status of the intra-individual ITS variants among V. radiata genotypes was analysed by RT-PCR. The profiles of the ITS1 products obtained from genomic DNA and cDNA were compared and the results were confirmed by cloning and sequencing of RT-PCR products. The profile from both the templates (genomic DNA and cDNA) indicated that the single ITS (I type) from NI 1607 (var. sublobata) was transcriptionally active (compare lanes 2 and 4, Fig. 4). In NI 127, the analysis indicated that all the five intra-individual ITS variants (A, C, G, Rec-C11 and Rec-C14; Rec designates recombinant ITS) are transcriptionally active (compare lanes 8 and 10, Fig. 4) and this was confirmed by cloning and sequencing. In NI 1012, the profiles obtained with genomic and cDNA templates were different (compare lanes 5 and 7, Fig. 4). Out of the six ITS variants in this accession, some were transcriptionally silent as indicated by the absence of certain heteroduplex ITS1 fragments in RT-PCR analysis (lane 7, Fig. 4). Further analysis by cloning, heteroduplex analysis and sequencing identified that ITS variants A, C, F and Rec-C13 were transcriptionally active, while the remaining two variants (E and Rec-C21; Rec designate recombinant ITS) were rendered transcriptionally silent. No variation was observed in the three accessions when the ITS2 products obtained from genomic DNA and cDNA were compared (Supplementary Fig. S4).
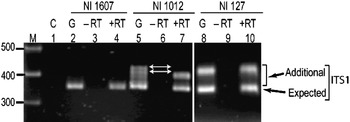
Fig. 4. ITS1 region amplified by RT-PCR among the V. radiata accessions NI 1607 (lanes 2–4), NI 1012 (lanes 5–7) and NI 127 (lanes 8–10). C (control), G (genomic DNA), −RT (DNAse-treated total RNA with no reverse transcriptase in RT-PCR) and +RT (DNAse-treated total RNA with reverse transcriptase in RT-PCR). The arrows indicate the heteroduplex fragments indicative of variants present in the genome but transcriptionally silent.
(vi) ITS polymorphism in other Vigna species
Furthermore, it was investigated whether the intra-individual ITS polymorphism also exists among species closely related to V. radiata. The study included accessions of nine species belonging to three sections (Ceratotropis, Angulares and Aconitifoliae) of the subgenus Ceratotropis (Table 2). Results of EcoRV analysis revealed the absence of intra-individual ITS heterogeneity in these nine species (Fig. 3). To confirm, the ITS products from 16 randomly taken accessions that showed single ITS on EcoRV analysis were also cloned and six ITS clones from each accession were sequenced (Table 5). No sequence variation was detected among the six clones derived from the PCR product of each of these 16 Vigna accessions. These results demonstrate the absence of intra-individual ITS variants among these accessions.
Table 5. Variation in length and percentage G+C content in ITS, ITS1 and ITS2 of the Vigna accessions
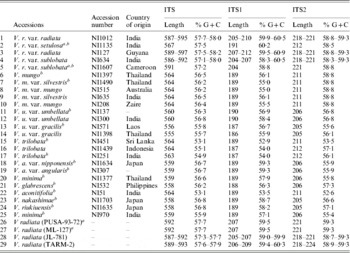
a These are the V. radiata accessions that showed a single ITS sequence.
b These are the 16 Vigna accessions where the PCR-ITS product was also cloned and six clones sequenced.
The intra-individual variants were not found even in three species, Vigna trilobata, V. umbellata and Vigna minima, that exhibited a high intra-species ITS sequence divergence. The intra-species sequence divergence within these three species (V. trilobata, V. umbellata and V. minima) was even higher than between certain species (Supplementary Table S2). V. trilobata from Sri Lanka (NI 451 and JP 107887) were divergent (0·150–0·157) from those originating from in Indonesia (NI 1439) and India (NI 251), whereas the pairs NI 451 and JP 107887 and NI 1439 and NI 251 were close and showed low divergence (0·008–0·014). High divergence was also observed between cultivated and wild V. umbellata types. The cultivated types (var. umbellata, NI 137, NI 204, JP 99485 and NI 300) showed low divergence (0·003–0·006) compared with the wild types (NI 571 and NI 1398, 0·037), whereas high divergence (0·080–0·083) was observed between the groups. Similarly, among V. minima, the accessions from Thailand (NI 1377 and NI 1376) showed no divergence (0·000), but both showed high divergence to JP 107869 and NI 970 (0·074 and 0·035–0·080).
(vii) Phylogenetic analysis
Phylogenetic analysis by NJ (Fig. 5A) and MP methods (Fig. 6) placed all the Vigna species analysed into three major groups representing three sections Ceratotropis (mungbean group), Angulares (azukibean group) and Aconitifoliae. The overall topology of the dendrograms was in agreement with earlier studies (Doi et al., Reference Doi, Kaga, Tomooka and Vaughan2002; Tomooka et al., Reference Tomooka, Maxted, Thavarasook and Jayasurya2002). However, it was evident from both NJ and MP-Tree that certain accessions of V. umbellata, V. trilobata and V. minima clustered with different species. Wild V. umbellata accessions clustered with Vigna nakashimae, Vigna riukiuensis and V. minima (JP 107869), while the cultivated types (NI 137 and NI 300) were close to Vigna hirtella and Vigna exilis. Among V. minima, NI 970 clustered with the V. angularis–Vigna nepalensis complex, NI 1377 and NI 1376 were close to V. hirtella and Vigna glabrescens and JP 107869 clustered with wild V. umbellata, V. nakashimae and V. riukiuensis. Among the four V. trilobata, NI 1439 and NI 251 were close to Vigna stipulacea. The intra-individual ITS variants of V. radiata clustered together and did not affect the relationship at the species level; however, it affected the relationships below the species level (Fig. 5B).
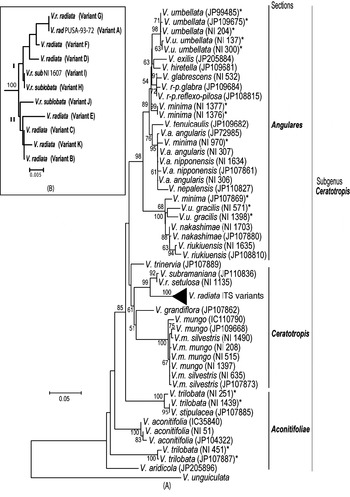
Fig. 5. Rooted NJ tree based on ITS1+ITS2 sequence data of Vigna species using MEGA software (version 2.1). V. unguiculata was used as the outgroup. The numbers near the nodes indicate bootstrap values (in percentage) for a 1000-replicate analysis. The ‘*’ indicate accessions of Vigna species showing high intra-species heterogeneity. (A) NJ tree of all Vigna accessions along with the intra-genomic ITS variants from V. radiata accessions (compressed as a sub-tree). (B) Expanded sub-tree of the V. radiata ITS variants (A–K type).

Fig. 6. Consensus MP-Tree (CI: 0·746; RI: 0·883; RCI: 0·659) generated using CNI option of MEGA software (version 2.1). The numbers near the nodes indicate bootstrap values (in percentage) for a 500-replicate analysis. The ‘*’ indicate accessions of Vigna species showing high intra-species heterogeneity.
4. Discussion
The present study addressed the existence of intra- and inter-individual heterogeneity in rDNA ITS region of V. radiata, the origin and maintenance of ITS variants, their transcriptional status, and the prevalence of this phenomenon among species from subgenus Ceratotropis. The evidence presented in this study show that the intra-individual ITS variation seems to be a general feature in V. radiata and that not all the variants belong to transcriptionally active rDNA units.
The initial evidence of intra- and inter-individual heterogeneity in the rDNA region was presence of a diverse array of ITS variants among V. radiata accessions. These intra-individual ITS variants were detected as length variants due to the formation of heteroduplexes during PCR. The variations (sequence and indels) between the two strands of a heteroduplex molecule result in the formation of loops and bulges, which affect their mobility in a gel matrix relative to homoduplex molecules. The mobility of heteroduplex ITS was affected by the number, length and relative position of the indels. This property of the heteroduplexes also proved to be useful in screening of ‘ITS variant clones’ prior to sequencing. The observation that V. radiata has a high level of intra-specific genetic variation matched well with the results obtained by previous workers based on morphology (Miyazaki, Reference Miyazaki1982), RFLP (Fatokun et al., Reference Fatokun, Danesh, Young and Stewert1993) and RAPD (Kaga et al., Reference Kaga, Tomooka, Egawa, Hosaka and Kamijima1996) studies.
Although Gerstner et al. (Reference Gerstner, Schiebel, von Waldburg and Hemleben1988) reported the presence of three length variants of the 18S–5·8S–26S rRNA repeat units in V. radiata, they did not analyse the ITS region among these rRNA gene variants. In addition, none of the previous studies by others on the ITS of Vigna species (Schiebel & Hemleben, Reference Schiebel and Hemleben1989; Doi et al., Reference Doi, Kaga, Tomooka and Vaughan2002; Goel et al., Reference Goel, Raina and Ogihara2002) reported intra-individual ITS heterogeneity, which seems to be highly widespread among V. radiata as revealed in the present study. This could be due to either use of accessions that might be harbouring single ITS sequences (like PUSA-93-72 and ML-127) or screening of a small number of clones. Our analysis detected 12 different ITS variants (A–L) from nine V. radiata accessions. Sequence analysis revealed the V. radiata ITS sequence reported by Schiebel & Hemleben (Reference Schiebel and Hemleben1989) is of ‘A’ type, those reported by Goel et al. (Reference Goel, Raina and Ogihara2002) are of ‘E and K’ type, while the ITS sequence reported by Doi et al. (Reference Doi, Kaga, Tomooka and Vaughan2002) are of ‘G and I’ type. The ITS variants reported in this study represent the minimum number of variants in V. radiata, as some low copy ITS variants in these taxa may have escaped detection.
(i) ITS polymorphism in other Ceratotropis species
Intra-individual ITS heterogeneity was not detected in the nine Vigna species including a tetraploid (2n=44) species, V. glabrescens, though high ploidy is one of the factors responsible for intra-individual ITS heterogeneity among plants (Suh et al., Reference Suh, Thien, Reeve and Zimmer1993; Álvarez & Wendel, Reference Álvarez and Wendel2003). However, homogeneous rDNA repeat classes in polyploids could be also due to autopolyploidization. The absence of this phenomenon in V. glabrescens indicates either complete homogenization of rDNA repeats or loss of one of the parental rDNA loci in this species subsequent to polyploidization. Operation of both these mechanisms is well documented in plants (Wendel, Reference Wendel2000).
High intra-species ITS divergence was observed in three species, V. trilobata, V. umbellata and V. minima. Based on AFLP analysis, high intra-species diversity in the V. minima complex has been reported, compared with other species (Yoon et al., Reference Yoon, Doi, Kaga, Tomooka and Vaughan2000). The present analysis of multiple V. minima accessions from diverse locations has revealed the diverse nature of this species; however, a careful assessment is needed since the presence of accessions in different clusters could also be due to wrong identification (Egawa et al., Reference Egawa, Chotechuen, Tomooka, Ngampongsai and Kitbamroong1996; Doi et al., Reference Doi, Kaga, Tomooka and Vaughan2002). Some of the V. minima accessions have been recently renamed (Tomooka et al., Reference Tomooka, Vaughan, Moss and Maxted2003), viz. NI 970 as V. nepalensis and NI 1377 as V. hirtella. In the present study, clustering of NI 970 with V. nepalensis (Figs 5A and 6) supports the conclusion of Tomooka et al. (Reference Tomooka, Vaughan, Moss and Maxted2003) ; however, the present results do not support the new taxonomic designation of NI 1376 and NI 1377 as V. hirtella. These accessions need to be analysed morphologically in more detail to clarify the taxonomic status of these species, as the use of few parameters could lead to confusions. For example, Vigna grandiflora was earlier mistaken for V. radiata var. sublobata (Tateishi & Maxted, Reference Tateishi and Maxted2002) or V. radiata var. grandiflora (Niyodham, Reference Niyodham1992), while Vigna trinervia was considered as V. radiata var. sublobata (Tateishi & Maxted, Reference Tateishi and Maxted2002).
In most of the species analysed, the cultivated and wild types clustered together except in V. umbellata, where they were placed in different subclusters, in the section Angulares (Figs 5A and 6). Two wild V. umbellata accessions (NI 571 and NI 1398) clustered with V. nakashimae and V. riukiuensis, while the wild type JP 109675 clustered with the cultivated V. umbellata. These observations suggest the need for careful analysis of wild and cultivated V. umbellata. It is important to find out whether such a high heterogeneity actually exists among the wild and cultivated V. umbellata or it is just another case of wrong identification. The second possibility cannot be completely ruled out since many species belonging to section Angulares are known to grow sympatrically and this has resulted in confusions during identification of species (Vaughan et al., Reference Vaughan, Tomooka, Kaga, Doi and Yoon2000).
Certain V. trilobata accessions have been renamed as V. stipulacea (Tomooka et al., Reference Tomooka, Vaughan, Moss and Maxted2003) including NI 251 (also used by Goel et al., Reference Goel, Raina and Ogihara2002). The present study supports this taxonomic treatment and it also indicates that NI 1439 from Japan is likely to be V. stipulacea. Considerable intra-species heterogeneity can exist in a species that could be due to existence of several eco-geographic types. Phylogenetic analysis using a single representative accession of a species may lead to wrong inferences and analysis of more number of accessions could help to overcome this.
Among the other diploid species, in V. angularis, the cultivated and wild types are genetically less diverse (Yasuda & Yamaguchi, Reference Yasuda and Yamaguchi1996) though they are morphologically and ecologically distinct (Yamaguchi, Reference Yamaguchi1992). The absence of intra-individual and low intra-species rDNA heterogeneity among the species analysed, with the exception of V. radiata, could be due to one or more combinations of the following factors: (i) rapid rate of homogenization, (ii) presence of less number of NORs (nucleolar organizing regions), (iii) a small sample size and (iv) low divergence among accessions. Analysis of ITS region from 18 V. mungo accessions including wild and cultivated types and one accession each of V. trilobata and V. glabrescens by PCR–RFLP did not reveal intra-individual ITS heterogeneity in these species (Souframanien et al., Reference Souframanien, Joshi and Gopalakrishna2003). V. mungo is closely related to V. radiata and the results from both this study and the previous report (Souframanien et al., Reference Souframanien, Joshi and Gopalakrishna2003) suggest the absence of ITS heterogeneity in V. mungo. In the present study, although a small number of accessions was analysed, high intra-species heterogeneity was detected in V. trilobata, V. umbellata and V. minima.
(ii) Intra-individual rDNA ITS heterogeneity in V. radiata
Intra-individual ITS heterogeneity is not very common in plants (Baldwin et al., Reference Baldwin, Sanderson, Porter, Wojeiechowski, Campbell and Donoghue1995). The heterogeneity is likely to go undetected if a single or small number of clones are characterized (Álvarez & Wendel, Reference Álvarez and Wendel2003). Cases of intra-individual rDNA variation have been often observed as a consequence of diverse different biological phenomena such as high ploidy in Winteraceae (Suh et al., Reference Suh, Thien, Reeve and Zimmer1993), allopolyploid in conifers (Karvonen & Savolainen, Reference Karvonen and Savolainen1993), long generation time in peonies (Sang et al., Reference Sang, Crawford and Stuessy1995), agamospermy in Amelanchier (Campbell et al., Reference Campbell, Wojciechowski, Baldwin, Alice and Donoghue1997) and high frequency of domestication in Cucurbita (Jobst et al., Reference Jobst, King and Hemleben1998). Comparison of ITS variants of V. radiata along with other species from subgenus Ceratotropis ruled out inter-species hybridization as the cause of observed intra-individual rDNA ITS variation in V. radiata. Detection of different ITS variants among cultivated (variant A), wild (variant I) and diverse eco-geographic V. radiata types suggests differential evolution of ITS sequences among these accessions. Earlier studies had suggested that wild forms of V. radiata have differentiated widely (Miyazaki, Reference Miyazaki1982, Fujii & Miyazaki, Reference Fujii and Miyazaki1987). Geographic isolation among diverse eco-geographic types can result in maintenance of divergent rDNA sequences in the absence of recombination (Wei et al., Reference Wei, Wang and Hong2003). Subsequently, the ITS variants probably have come together by intra-specific hybridization, which is known to occur naturally among the wild types of V. radiata (Chandel, Reference Chandel1981; Chandel et al., Reference Chandel, Lester and Starling1984) or during the process of domestication. The presence of ITS variant ‘A’ (specific to cultivated type) and variant ‘I’ (specific to the wild type) in accession NI 634 (var. sublobata) substantiates this argument. None of the ITS variants clustered with V. radiata var. setulosa (wild type) ruling out its involvement in the intra-species hybridization.
(iii) Incomplete homogenization of nrDNA in V. radiata
Co-existence of multiple ITS variants in V. radiata indicate incomplete homogenization of rDNA repeat units. Subsequent to hybridization (or crossing), different outcomes for the rDNA repeats have been reported in plants, such as (1) retention of both the parental type sequences, (2) homogenization of repeat units to one parental type and (3) presence of recombinant ITS sequences (Wendel, Reference Wendel2000). Presence of wild and cultivated type specific ITS variants along with the recombinant sequence (designated as Rec) in NI 634 (Supplementary Fig. S5C) indicates the prevalence of phenomena (1 and 3) mentioned above, in V. radiata. In addition, presence of transcriptionally active recombinant ITS variants in NI 127 and NI 1012 substantiates the fact that the recombinant ITS sequences are present in the genome and have not been completely homogenized. However, the possibility that some recombinant ITS sequences are generated as a consequence of PCR cannot be completely ruled out.
Among the ITS variants, duplication (or deletion) of the simple sequence motifs has resulted in the variation at indels such as #1 (TCCA/TCCATCCA), #2 (TGTG/TGTGTG), #4 (ACCCC/ACCCCACCCC in NI1012) and #6 (AAC/AACAAC). Some indels seem to have accumulated variations subsequent to duplication such as #4 (ACCCC/ACCCCGCCCTC in NI127 or ACCCCGCCTT in NI634 and NI1607) and #7 (TCGA/TCGATGA). Variations due to repetition of simple repeat motifs are indicative of mechanisms (unequal crossing over and biased gene conversion) involved in the concerted evolution process (Elder & Turner, Reference Elder and Turner1995; Graf von der Schulenburg et al., Reference Graf von der Schulenburg, Hancock, Pagnamenta, Sloggett, Majerus and Hurst2001). However, several other regions in the ITS variants were observed where the repeat motifs were highly conserved. The pattern of sequence variation (substitutions and indels) also identified a few recombinant ITS sequences among the cultivated and wild V. radiata (Supplementary Fig. S5). Recombinant ITS, generated as a result of crossover (single/multiple) between different ITS variants, harbour variations specific to the parental types and are important evidence of concerted evolution taking place. The phenomenon of concerted evolution occurs more quickly within a locus than between loci (Ohta & Dover, Reference Ohta and Dover1983) and, hence, the increase of the number of rDNA loci in a genome may slow down the ‘molecular drive’. However, no information is currently available on number of 18S–5·8S–26S rDNA loci in V. radiata, but a related species, V. unguiculata (genus Vigna), is reported to have five loci (Galasso et al., Reference Galasso, Schmidt, Oignone and Heslop-Harrison1995). Further information on the number of rDNA loci among Vigna species particularly in V. radiata would be very useful to provide some more insights into this phenomenon.
(iv) ITS variants in V. radiata are not pseudogenes
High intra-individual rDNA paralogy has been shown to be due to the presence of non-functional (pseudogene) sequences (Hartmann et al., Reference Hartmann, Nason and Bhattacharya2001; Bailey et al., Reference Bailey, Timothy, Stephen and Colin2003; Razafimandimbison et al., Reference Razafimandimbison, Kellogg and Bremer2004). Putative non-functional sequences can be identified by approaches such as sequence divergence, indel events, sequence free energy, secondary structure and degree of methylation (Bailey et al., Reference Bailey, Timothy, Stephen and Colin2003; Razafimandimbison et al., Reference Razafimandimbison, Kellogg and Bremer2004). Unlike functional sequences, the pseudogenes generally have equal sequence divergence in coding and spacer regions (Bailey et al., Reference Bailey, Timothy, Stephen and Colin2003).
The evidence presented in this study show that the V. radiata intra-individual ITS variants are not pseudogenes, as they show high sequence similarity in coding (5·8S) region and conserved secondary structures of ITS1 and ITS2. The length (164 bp) and sequence of the 5·8S gene were found to be highly conserved among the V. radiata ITS variants, and similar to functional 5·8S gene among most angiosperms (Baldwin et al., Reference Baldwin, Sanderson, Porter, Wojeiechowski, Campbell and Donoghue1995). In a recent study in Naucleeae, a minimum of two mutations in 5·8S gene and very low secondary-structure stability was used as the criteria to identify pseudogenes (Razafimandimbison et al., Reference Razafimandimbison, Kellogg and Bremer2004). In the present study, a single variable site was found in 5·8S gene, and this only in three of the 30 V. radiata ITS sequences analysed.
The length of ITS variants was within the range known for functional ITS sequences among plants (Baldwin et al., Reference Baldwin, Sanderson, Porter, Wojeiechowski, Campbell and Donoghue1995). The indels were localized in the specific regions of ITS1 and ITS2 that were completely absent in the remaining Vigna species (Fig. 7 and Supplementary Fig. S6), indicating that these regions may be non-essential regions of the ITS. A majority of the ITS variants showed conserved secondary-structure domains and high secondary-structure stability, similar to the ITS sequences belonging to transcriptionally active rDNA units.
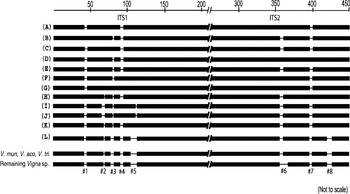
Fig. 7. Schematic representation of alignment of ITS1+ITS2 sequences of Vigna species from subgenus Ceratotropis. Eight major indels (#1 to #8) that were found to be variable among V. radiata ITS variants are indicated. These regions were absent in the remaining Vigna species as evident from the profile representing three Vigna species (V. mungo, V. aconitifolia and V. trilobata) and the profile representing the rest of the Vigna species analysed. The numbers on the top indicate approximate position in the ITS1+ITS2 sequence alignment file (Supplementary Fig. S6).
The ribosomal RNA genes can either undergo complete/partial homogenization at the DNA level or some repeat units can be transcriptionally rendered silent, which is controlled by epigenetic mechanisms such as DNA methylation and histone acetylation, etc. (Volkov et al., Reference Volkov, Komarova, Zentgraf, Hemleben, Esser, Lüttge, Beyschlag and Hellig2006; Dadejová et al., Reference Dadejová, Lim, Soucková-Skalická, Matyášek, Grandbastien, Leitch and Kovařík2007). The results obtained in this study show that the rDNA units of V. radiata are not completely homogenized, as multiple variants co-exist in the genome and are also transcriptionally active. However, evidence of silencing of some variants (ITS variants E and Rec21 in NI1012) indicates that epigenetic mechanisms of gene silencing are operating in V. radiata.
Care was taken to rule out introduction of variations during the PCR process per se by use of DNA polymerase with proofreading activity. Use of non-proofreading DNA polymerase in the amplification of repetitive sequences or multi-gene families is known to introduce variation during PCR (Fuertes et al., Reference Fuertes, Roselló and Nieto1999). Vent DNA polymerase with proofreading activity (exo+) was used for PCR amplifications and multiple clones were analysed from each variant group. As multiple ITS variants are shown to be present in V. radiata, interactions among them during the PCR process may lead to generation of chimaeric ITS fragments, which in turn can give an overestimation of the number of actual ITS sequence variants present in the genome. However, the results of mixed-template PCR analysis of TARM-2 ITS variants indicate that the probability of formation of recombinant (chimaeric) ITS during PCR per se is likely to be low and, hence, not detected under the conditions used in the present study; however, it cannot be completely ruled out. Besides, the presence of transcriptionally active recombinant ITS sequences in NI 127 and NI 1012 clearly demonstrate that these cannot be assumed to be generated during PCR, but belong to functional rRNA genes in the V. radiata genome.
The results presented in this paper show an intriguing phenomenon of high intra-individual ITS polymorphism specifically in V. radiata among the species belonging to subgenus Ceratotropis (genus Vigna). The ITS sequences were found to be evolving differentially in diverse eco-geographic V. radiata types. Interplay of two factors, intra-species hybridization and incomplete homogenization, was found to be the most probable reasons for the observed phenomenon. Although the study shows an incomplete homogenization of rDNA repeat units at the genomic level, evidence of transcriptional gene silencing of some intra-individual variants repeat units was also observed. In view of the reports that in the species with high intra-individual heterogeneity in rDNA repeat units, transcriptional gene silencing may be one of the initial steps of the complex array of genomic mechanisms to achieve homogeneity (Dadejová et al., Reference Dadejová, Lim, Soucková-Skalická, Matyášek, Grandbastien, Leitch and Kovařík2007). Similar mechanisms may be operating in V. radiata that exhibits high intra-individual rDNA heterogeneity.
We thank Dr Thiery Vanderborght (Head Seed Bank Manager, National Botanic Garden, Belgium) for providing the seed material used in this study.


