

Introduction
Organisations collaborate in the policy process in an effort to translate their goals into policy. Network analysis has become a popular methodological tool in political science for mapping and explaining the nature of organisational collaboration (for an overview of the literature, see McClurg & Young Reference McClurg and Young2011). From this perspective, networks are commonly viewed as a conduit for the targeted exchange of information, such as legal, technical or political knowledge. By exchanging information, organisations are able to inform others about policy preferences, access their skills and expertise, and build alliances with supporters (Knoke et al. Reference Knoke1996). Yet the benefits of collaboration must be weighed against the anticipated costs of establishing organisational connections. Building relationships with others can be costly in terms of the investment of time required or the potential loss of autonomy. As resources are finite, organisations must therefore prioritise their efforts and make strategic decisions about whom to work with. Studying the formation of policy networks therefore provides valuable insights into how organisations’ use their relational environment to influence the policy‐making process.
Research suggests that organisations collaborate with those that are perceived to be influential in order to access scarce political resources (Stokman & Zeggelink Reference Stokman and Zeggelink1996; Stokman & Berveling Reference Stokman and Berveling1998; Leifeld & Schneider Reference Leifeld and Schneider2012). Other studies show that organisations prefer to interact with those that share core policy beliefs on the basis of trust (Sabatier & Jenkins‐Smith Reference Sabatier and Jenkins‐Smith1993; Weible & Sabatier Reference Weible and Sabatier2005; Henry et al. Reference Henry, Lubell and McCoy2011; Calanni et al. Reference Calanni2014). Recent studies have integrated these competing theoretical approaches, allowing for the possibility that resource dependency and preference similarity may provide complementary, rather than contradictory, motives (e.g., see Henry Reference Henry2011; Leifeld & Schneider Reference Leifeld and Schneider2012; Fischer & Sciarini Reference Fischer and Sciarini2016; Ingold & Leifeld Reference Ingold and Leifeld2016).
We seek to add value to this literature through theoretical and methodological refinement. This article develops two new analytical tools for testing hypotheses on resource dependency and preference similarity. First, we design a new measure for organisational leadership, as a sub‐component of reputational influence, and test whether this attribute increases the likelihood of an organisation being the target or instigator of collaboration. Second, by recording organisational preferences on a single policy issue, we analyse how the degree of preference similarity between two organisations affects patterns of collaboration. In line with the results of recent studies, our findings suggest that motives for collaboration are mixed: reputational leadership and preference similarity exert a strong, positive and complementary effect on network formation. To be specific, perceived leadership significantly increases the likelihood of an organisation being the target of collaboration by others, whether leadership is measured as an organisational attribute or as an individually held perception. In addition, the likelihood of collaboration between organisations is significantly increased by the similarity of their policy preferences. We also find evidence of closed or clique‐like network structures, and heterophily effects based on organisational type. These results contribute further to our understanding of organisational motives for collaborating in the policy process.
We adopt a mixed‐methods approach, combining quantitative network analysis with qualitative interviews to analyse and explain organisational collaboration around banking reform in the United Kingdom between 2010 and 2011. This expands the application of network analysis in important ways. While existing studies have analysed sectors as diverse as health policy, climate policy, regional planning and chemicals regulation (e.g., see Weible & Sabatier Reference Weible and Sabatier2005; Henry Reference Henry2011; Heaney Reference Heaney2014; Leifeld & Schneider Reference Leifeld and Schneider2012), to our knowledge theories of network formation have not been applied to the banking sector. Moreover, although financial regulation has become the focus for renewed research on lobbying since the crisis, there has been little attempt to systematically map and explain organisational collaboration between banks using formal network analysis (for an exception, see Christopoulos & Quaglia Reference Christopoulos and Quaglia2009). The case of British banking has two critical features which provide an empirical basis for predicting the dynamics of collaboration. First, the banking sector in the United Kingdom is highly concentrated and competitive, dominated by a handful of large global banks. On this basis, we would expect collaboration to be relatively low, as financial firms are well‐resourced, but also highly instrumental, driven principally by perceptions of power and influence. Second, the nature of the policy issue – bank structural reform – impacts differentially on bank business models: for some it is very costly to implement, but for others it potentially provides a competitive advantage (James Reference James2017). With these conflicts of interest, we expect limited scope for collaboration based on shared beliefs and preferences. The study therefore provides a most‐difficult case for testing the robustness of theories of network formation in different policy subsystems.
The article begins by reviewing competing explanations of network formation, and then outlines the research design and methods of data collection. In the analysis that follows, we model how well different hypothesised covariates (the independent variables) explain the structure of the network (the dependent variable). The article concludes by reflecting on our theoretical and methodological contribution to understanding organisational collaboration.
Theories of network formation
Policy networks refer to the relationships or ‘ties’ that form among individual or organisational agents who attempt to influence policy outcomes. In recent years attention has increasingly focused on explaining how and why network ties are formed and change over time (Stokman & Zeggelink Reference Stokman and Zeggelink1996; Hojnacki Reference Hojnacki1997; Henry Reference Henry2011; Henry et al. Reference Henry, Lubell and McCoy2011; Leifeld & Schneider Reference Leifeld and Schneider2012; Fischer & Sciarini Reference Fischer and Sciarini2016; Ingold & Leifeld Reference Ingold and Leifeld2016). These approaches place agency centre stage by viewing networks as the outcome of intentional choices by strategic agents to collaborate. Network ties form when actors decide to exchange information with others in an effort to bolster their influence in the policy process (Berardo & Scholz Reference Berardo and Scholz2010). Here network formation is explained as the result of particular attributes of the organisations concerned, which make them more or less likely to establish ties with one another. The aim is to explain network formation by measuring how well different hypothesised dynamics explain the structural characteristics of a given network (Henry Reference Henry2011: 364). To this end, dynamic network models apply theoretically significant meanings about patterns of ties and then test these using a parametric statistical approach (Wasserman & Faust Reference Wasserman and Faust1994). We draw upon the two most commonly applied theoretical perspectives on network formation: resource dependency and preference similarity. We briefly review each below.
Resource dependency theory (RDT) assumes that actors are instrumentally rational and power‐driven. In a policy context, organisations aim to control scarce resources, such as information, technology, personnel or political clout, through which to shape policy outcomes (Hojnacki Reference Hojnacki1997). To maximise their access to these valuable resources, organisations look to form ties with powerful others. To minimise the search and transaction costs of finding useful collaborators, organisations seek out partners who are perceived to be influential as this is a signal that they are able to affect others’ behaviour through the effective control of valuable political resources (Pfeffer & Salancik Reference Pfeffer and Salancik1978). The theory therefore assumes that the most important predictor of tie formation is reputational influence. Evidence for these claims comes from studies which show that, once other factors are held constant, influence attribution has a significant effect on patterns of alliance building (Hojnacki Reference Hojnacki1997: 61), policy coordination and advice seeking (Weible & Sabatier Reference Weible and Sabatier2005: 471).
Reputational influence is a multidimensional concept which incorporates agenda‐setting power, decision‐making power and problem‐solving power (Fischer & Sciarini Reference Fischer and Sciarini2015). We seek to contribute to greater theoretical specificity by focusing on a particular sub‐component of reputational influence: reputational leadership. The concepts of ‘leadership’ and ‘entrepreneurship’ are well established in policy studies (see Mintrom & Norman Reference Mintrom and Norman2009). Policy leaders and entrepreneurs refer to exceptional agents that perform a particular role or set of activities in the policy process (Arce Reference Arce2001: 114; Ahlquist & Levi Reference Ahlquist and Levi2011). They are viewed as possessing unique political skills and valuable resources, and demonstrate a willingness to invest their time and energy in shaping the policy agenda in the pursuit of particular policy goals (Christopoulos & Ingold Reference Christopoulos and Ingold2015). To date, the application of the concept of ‘leadership’ to the policy network literature has been surprisingly limited (Huxham & Vangen Reference Huxham and Vangen2000: 1160). Existing research tends to conceptualise leadership as an individual trait, and network analysis is used to explain the role or qualities of leaders in public administration and local government (Wallis & Dollery Reference Wallis and Dollery1997). For example, Berger (Reference Berger1997) and Galaskiewicz and Shatin (Reference Galaskiewicz and Shatin1981) have assessed how those in political or public executive positions form cooperative relationships with others. Other studies have explored the relationship with collaboration – for example, leader‐member exchange theory suggests that leaders develop different types of dyadic relationships with different ‘members’ (Wayne et al. Reference Wayne, Shore and Liden1997). Typically, however, leadership is treated as a dependent rather than independent variable. We are also unaware of any attempt to systematically measure the concept of ‘organisational leadership’.
In this article, we assume that an organisation's capacity for leadership exists ex ante to the network ties that form spontaneously around specific policy issues. In other words, organisations possess intrinsic qualities (such as valuable knowledge, technical expertise or political skills) that shape their relational topology. In a context of imperfect knowledge where organisations look to bolster their influence in the policy process by leveraging their resources through others, reputational leadership serves as an important search heuristic. Organisations will look to collaborate with those that they estimate have the greatest capacity to take the initiative and shape the agenda. On this basis, we predict that organisations perceived as leaders are more likely to be the target of collaboration because other organisations will seek to access their scarce political resources. Conversely, we would expect organisations with high reputational leadership to be less likely to instigate collaboration. This is because their abundance of political resources means that they have less need to seek to engage with other organisations. We test both of these hypotheses:
H1a: The higher the reputational leadership of an organisation, the more likely it is to be the target of collaboration.
H1b: The higher the reputational leadership of an organisation, the less likely it is to instigate collaboration.
Theories of preference similarity differ fundamentally from power‐driven explanations because they assume that organisations form ties with one another when they share core policy beliefs (Stokman & Zeggelink Reference Stokman and Zeggelink1996; Stokman & Berveling Reference Stokman and Berveling1998). In policy studies, this approach is most closely associated with the Advocacy Coalition Framework (ACF) (Sabatier & Jenkins‐Smith Reference Sabatier and Jenkins‐Smith1993; Weible & Sabatier Reference Weible and Sabatier2005). It assumes that organisations prefer to work with those that have the same policy preferences because this provides an important signal that they can be trusted (Lubell Reference Lubell2007). Hence organisations in a policy subsystem tend to group together into distinct coalitions based on their policy preferences and engage in non‐trivial coordination to influence government policy. These approaches predict that the primary determinant of network structure is therefore preference similarity (Weible & Sabatier Reference Weible and Sabatier2005: 461; Henry Reference Henry2011). The following hypothesis tests for belief‐based effects:
H2: The closer the policy preferences between two organisations, the more likely they are to share a tie.
To test these two theoretical perspectives, we refine existing analytical tools by designing new variables of reputational influence and preference similarity. These are used to explain patterns of organisational collaboration during the banking reform process in the United Kingdom between 2010 and 2011. The next section provides a brief overview of our case study.
The case: United Kingdom banking reform
Since the financial crisis, the United Kingdom has pursued an ambitious agenda on banking reform. Following the May 2010 election, the new coalition government established an Independent Commission on Banking (ICB) to make recommendations that would promote both stability and competition in banking. In response, the Commission engaged actively with a wide range of representatives from industry trade associations, UK‐based banks, the business community and consumer groups. The issue which came to dominate the banking reform process was ‘structural’ reform: the extent to which banks’ retail activities should be structurally separated from its investment activities to prevent deposits from being used for high‐risk trading. Stakeholder engagement on the issue revealed highly divergent views: some organisations lobbied aggressively for the preservation of the universal banking model, while others called for a full split between retail and investment banking. The ICB's final report, which recommended that retail banks in the United Kingdom be placed in a legally separate and operationally separable ‘ringfenced’ subsidiary, therefore represented a compromise between these polarised positions (ICB 2011).
We use network analysis to map patterns of organisational collaboration around the banking reform process by focusing specifically on the structural reform issue. Using bank structural reform as a case study is valuable in several respects. Theoretically, the British financial sector provides a particularly good example of an industry characterised by durable and densely interconnected networks which are periodically activated around regulatory issues. Methodologically, network analysis is highly resource‐intensive as it requires the surveying of a whole pre‐defined network population (Wasserman & Faust Reference Wasserman and Faust1994). This explains why its use in capturing informal organisational ties in policy networks remains comparatively rare. However, bank structural reform offers a sufficiently small network of a few big players which can be measured using survey questionnaires. Social Network Analysis (SNA) also tends to yield the best results when applied to detailed single case studies because it affords greater analytical and contextual detail (Heaney Reference Heaney2014). Finally, the study promises to yield new empirical insights on the hidden political ties that exist across the City of London. These ties are commonly assumed to exist, but they have yet to be mapped systematically.
Data and methods
Our research design employs a mixed‐methods approach which triangulates data from four sources: data on network relationships; attribute data collected via a survey questionnaire; a survey of independent experts in the policy field; and in‐depth interviews with key organisational informants. This has a number of advantages. The collection of statistical data on organisational ties and attributes enables us to model the policy network, test different theories of network formation and make generalisable claims about why some organisations are better connected than others. Qualitative interviews provide supportive evidence for the causal claims underpinning our quantitative analysis.
Network data
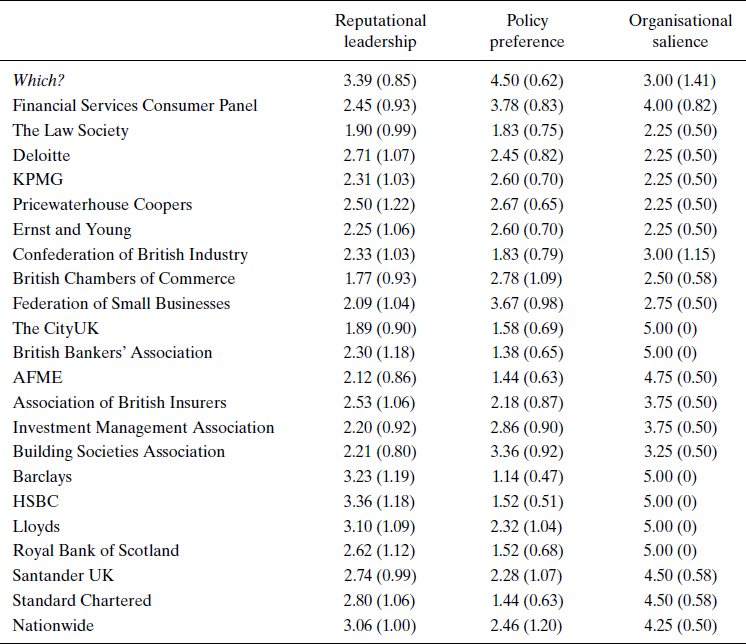
Data on the network population was generated using decisional, positional and reputational approaches. Beginning with the decisional approach, we compiled a list of all 150 actors that responded to the ICB's call for evidence in 2011. Given that most of these were from individual respondents, the list was subsequently narrowed down to the 30 most important organisations (the positional approach). Following Knoke et al. (Reference Knoke1996), the list was then circulated to a cross‐section of experts from the financial industry, regulatory authorities and other stakeholders to validate its reliability (the reputational approach). This produced a final list of 23 organisations (see Table 1). Since the network being modelled is directed and our unit of analysis are the ties that form between actors, this gives us potentially n2 – n = 506 observations.
Attribute data

Notes: The scores for reputational leadership and policy preference are the mean of the scores assigned to each organisation by all the organisational informants. Organisational salience is the mean of the scores assigned to each organisation by the five independent coders. Values in parenthesis are standard deviations.
Key organisational informants were identified using public records, ICB submission contact details and email enquiries. In the trade associations, we identified the key individuals involved in the process, and in the large banks we contacted the designated ‘lead’ for banking reform in the regulation team. All these individuals were contacted and invited to participate in an interview survey: in total, we interviewed 34 individuals from 22 of the 23 organisations on the list, giving a response rate of 96 per cent.
To elicit data on our dependent variable – network ties – participants were advised that we were interested in identifying all those organisations that they collaborated with on the issue of bank structural reform during the ICB process. We informed all interviewees that in the survey we defined ‘information exchange’ specifically in terms of who they ‘sought to engage with for the purpose of collaboration’. From the list of 23 organisations, participants were then asked to ‘indicate all those organisations with who you exchanged information about the banking reform process’. The data yielded is therefore directional in that it measures both incoming collaborative ties to, and outgoing collaborative ties from, each organisation. This directional data allows us to test whether organisations with particular attributes are more likely to be the target of collaboration (as measured by the number of incoming ties) or are more likely to instigate collaboration (as measured by the number of outgoing ties).
Attribute data
To gather data on organisational leadership, we look to refine existing reputational measures of influence. In policy studies, the reputational measure is an important and widely used method for assessing the power of political actors (e.g., Kilduff & Krackhardt Reference Kilduff and Krackhardt1994; Knoke et al. Reference Knoke1996; Henry Reference Henry2011; Matti & Sandström Reference Matti and Sandström2011; Ingold & Leifeld Reference Ingold and Leifeld2016). Reputational data is typically generated by asking actors to name those that are influential with respect to a specific policy issue; each attribution is then aggregated to provide an average power score for each actor (Fischer & Sciarini Reference Fischer and Sciarini2015: 61). An important strength of the measure is that it is peer‐based, relying on those with an intimate knowledge of the policy process and the other actors involved. However, the limitations of reputational influence are also well documented. Attributions are inherently subjective because power is multidimensional and it is difficult to control the criteria on which actors base their evaluation. Reputational measures may also be biased as a result of deliberate self‐promotion or genuine misperception (Heaney Reference Heaney2014). Put differently, there is a risk that reputational measures mis‐specify the direction of causality: an actor may attribute power to those to whom they are connected because they have more information about them and/or to exaggerate their own reputation (Leifeld & Schneider Reference Leifeld and Schneider2012: 734).
To address these methodological challenges, we operationally defined ‘reputational leadership’ as an organisation's capacity to set the agenda by taking the initiative and persuading others to endorse their position. This definition improves on existing reputational measures because it is significantly narrower and arguably less normatively loaded than conventional measures of reputational influence. It should therefore be less prone to problems of bias arising from subjectivity. In the survey, participants were asked to indicate the strength of this attribute for each organisation on a scale of 1 to 5 (1 = weak attribute; 5 = strong attribute). Our approach improves on existing reputational variables by using an ordinal scale, rather than relying on binary data based on simple influence attributions, as it encourages respondents to think carefully about the relative power of other organisations. To improve the reliability of the data with respect to causation, we also used a temporal specification method designed to capture participants’ perception of an organisation's reputation for leadership at the start of the banking reform process (Matti & Sandström Reference Matti and Sandström2011).
Reputational leadership is used in its aggregated form; a score is calculated for each organisation based on the mean of the scores assigned to it by all the other organisations (see Table 1). This data produced a node covariate (i.e., an attribute of an organisation) for use in our statistical model. In theoretical terms, leadership as an attribute is a property of an organisation based on the shared perception of everyone in the network. The model therefore tests the effect of leadership on the probability of an organisation being the instigator or target of collaboration (as measured by the number of incoming and outgoing network ties). As an additional test of the importance of reputational leadership, we also measured leadership as a dyadic covariate which captures how the leadership of an organisation is perceived by another organisation. This was calculated by using the leadership score as assigned by organisation A (ego) to organisation B (alter) for each pair of organisations, producing a directed leadership matrix. We then tested whether this individually held perception of leadership makes organisation A more likely to seek to collaborate with organisation B (as measured by a directed tie from A to B).
Tests for preference similarity commonly rely on binary measures that simply record whether an organisation is in agreement or disagreement with the policy preferences of others in the network. But this distillation of beliefs into dichotomous pro/anti sentiments risks over‐simplifying complex issues characterised by important nuances (Mattli & Sandstrom Reference Matti and Sandström2011: 389). To capture the degree of preference similarity between organisations, we draw on recent studies which develop ordinal scales for measuring policy preferences (e.g., see Henry Reference Henry2011; Leifeld & Schneider Reference Leifeld and Schneider2012; Ingold & Fischer Reference Ingold and Fischer2014). We are able to do this for two reasons. First, the specific policy issue with which we are concerned (bank ‘structural’ reform) is unidimensional – that is, organisational preferences can be represented as points on a one‐dimensional continuum. Second, organisations have single‐peaked preference functions – namely, each organisation has a single ideal position and that positions away from this are preferred less. By using a more fine‐grained measure of preferences, the method provides for a more rigorous test of preference similarity.
To generate data on organisational preferences, informants were given the following instructionFootnote 1: ‘Please indicate the position of each organisation on structural reform at the start of the banking reform process on a scale of 1 (supports the status quo) to 5 (supports a full split between retail and investment banking).’ We measure preference similarity by calculating the difference in preference scores between each pair of organisations in the network. The resulting variables produce a matrix of preference similarities. This can be interpreted as an undirected network and used as a dyadic covariate in the model.
It is important to acknowledge that hypotheses on network formation potentially suffer from reverse causality (Leifeld & Schneider Reference Leifeld and Schneider2012: 740). To be precise, maintaining ties with others may breed trust and lead actors to perceive one another as influential; it may also foster a shared understanding of policy problems. Thus, it is possible that network formation may cause reputational leadership and preference similarity. We draw upon qualitative interviews with organisational informants to provide supportive evidence for the direction of causality suggested in our theoretical model.
We also control for other important variables which may impact on network formation. The first concerns homophily effects based on organisational type. It is assumed that certain organisations are more likely to collaborate with one another because they share key attributes, such as the nature of their role or institutional form (see Lee et al. Reference Lee, Lee and Feiock2012; Gerber et al. Reference Gerber, Henry and Lubell2013; Heaney Reference Heaney2014). For example, we might expect trade associations to be highly interconnected within policy networks because their role is to heighten awareness of policy issues by communicating and alliance building with others (Leifeld & Schneider Reference Leifeld and Schneider2012: 734). Similarly, banks may have a tendency to exchange political information as a consequence of their shared experiences in the policy process. To control for these potential homophily effects, a dummy variable was added to the model for banks (1), trade associations (2) and other organisations (3).
We also control for the salience of the policy issue for each organisation, recognising that issue context can be as important as organisational‐level characteristics (Binderkrantz et al. Reference Binderkrantz, Christiansen and Pedersen2014: 888). Organisational salience relates to the motivation that an organisation has to engage around a specific policy issue (see Klüver Reference Klüver2013; Binderkrantz et al. Reference Binderkrantz, Christiansen and Pedersen2014). The material impact of a policy issue varies widely between organisations, so they face different incentives to try to influence policy makers. Those for whom a policy issue imposes high potential costs/benefits have a greater incentive to engage in lobbying, whereas those facing minimal costs/benefits have a low incentive (Knoke et al. Reference Knoke1996; Yackee & Yackee Reference Yackee and Yackee2006). This is distinct from reputational leadership which concerns a particular role or set of activities that an organisation performs in the policy process, such as agenda‐setting and persuading others (Arce Reference Arce2001: 114; Ahlquist & Levi Reference Ahlquist and Levi2011). Rather than being policy‐specific, leadership relies on a set of intrinsic qualities, such as technical expertise or political skills, a reputation for which is accumulated over time (Christopoulos & Ingold Reference Christopoulos and Ingold2015). These concepts need not overlap: an issue can be highly salient to an organisation, but it may lack the qualities necessary to exert leadership in the process; conversely, an issue may have little material impact on an organisation, but it may choose to perform a leadership role as a matter of principle.
Adapting the definition used by Knoke et al. (Reference Knoke1996), we define ‘salience’ as ‘the importance of banking reform to each organisation’. Including salience as a control variable helps to improve the robustness of our results in two ways. First, salience potentially provides an alternative explanation for organisational collaboration. In the absence of knowledge about the reputational leadership of organisations around an issue, lobbyists may use perceptions of salience as a heuristic short‐cut to find prospective organisational collaborators. Second, informants may have a tendency to over‐estimate the importance of other organisations for whom an issue is highly salient and/or exaggerate their connections with them. It is therefore important to control for bias arising from potential misperception or deliberate self‐promotion (see Johnson & Orbach Reference Johnson and Orbach2002). Following Yackee and Yackee (Reference Yackee and Yackee2006: 132), five independent experts were asked to code each organisation for salience on a five‐point scale (1 = weak attribute, 5 = strong attribute), with the mean score used in the model.Footnote 2
Exponential random graph models (ERGM)
Data on collaborative ties between organisations allow us to describe a policy network using graphical tools. To explain its structure, we need to test whether the observed pattern of organisational ties is purely random, or whether it exhibits regularities associated with the effect of different hypothesised covariates. Because observations cannot be assumed to be independent, standard statistical methods are inappropriate. Instead, we can use ERGMs to specify complex interdependencies in a statistical model using both endogenous and exogenous parameters (see Cranmer et al. Reference Cranmer2016). These calculate the probability of an observed network, given a set of statistics on the network, compared to all networks that could have been observed (Lusher et al. Reference Lusher, Koskinen and Robins2013; see also Wasserman & Robins Reference Wasserman, Robins, Carrington, Scott and Wasserman2005). ERGMs are capable of modelling three types of network properties: node covariates (organisational attributes, such as reputational leadership), dyadic covariates (attributes of ties, such as preference similarity) and endogenous network structures (reciprocity, transitivity). Models are estimated using Markov Chain Monte Carlo simulation methods which generate a sample from the space of all possible networks to estimate the parameters that maximise model likelihood. The dependent variable is the log odds of establishing a network tie. The estimated coefficients are therefore interpreted as log‐odds ratios, conditional on the rest of the network. In other words, when a parameter estimate is positive, the probability of a tie between two actors is larger than the probability that they are not tied, conditional on all other parameters in the model.Footnote 3
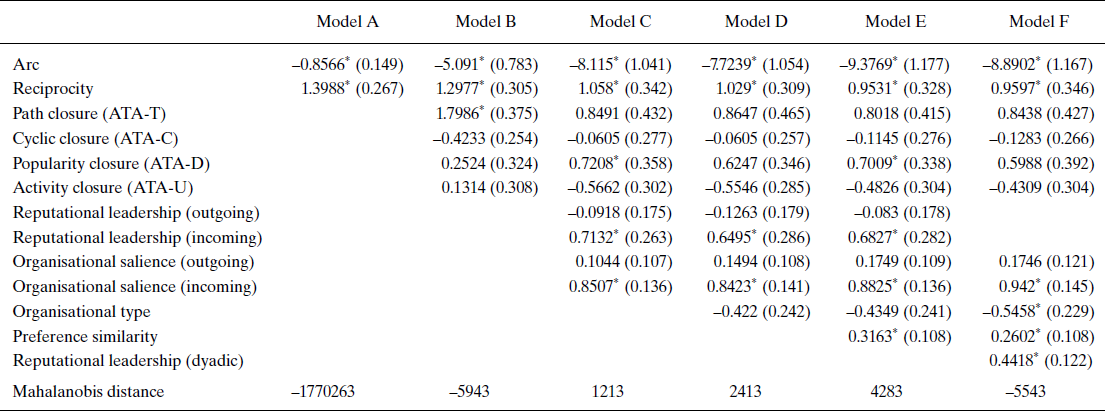
ERGMs proceed in steps to model the network. They begin by calculating parameter estimates for basic structural effects (models A and B). These capture important forms of interaction which rely on the accumulation of trust, such as the tendency of organisations to return ties in kind (reciprocity) and the existence of closed or clique‐like structures which rely on third party brokerage to facilitate ties (transitivity) (Wasserman & Faust Reference Wasserman and Faust1994: 507). Next, we calculate parameter estimates for each covariate by adding them in steps: reputational leadership, organisational salience, organisational type and preference similarity (models C–E). Model F includes our alternative measure of leadership as a dyadic covariate. The ERGM statistically tests the relationship between each covariate and network structure, while holding all the other parameters constant. As the network data is directional, the model tests the effect of each attribute for both incoming and outgoing organisational ties. Table 2 presents a summary of the results (see Online Appendix 1 for the full estimation results and goodness of fit (GOF) statistics).
Estimation results for the ERGM

Notes: Parameters with standard errors in parentheses. *Statistically significant at the 0.05 level. Reciprocity refers to the tendency to return cooperative behaviour in kind when forming ties (i.e., actor A will form a tie to B if a tie already exists from B to A). The four measures of transitivity examine whether network ties are partly closed and clique‐like in structure (see Online Appendix 5 for a description of these terms).
ERGMs are interpreted using GOF statistics which compare the simulated graph of the estimated model against the network that has been modelled. The GOF heuristics (reported values for Mahalanobis distance in Table 2) indicate that all the models have converged (models A–F), and are significantly improved by the addition of our fitted parameters. To visualise the GOF, we use boxplot diagrams to plot four network statistics from the original network (the thick black line) and 100 simulated networks (the box plots) for minimum geodesic distance, in degree, out degree and edge‐wise shared partners (see Online Appendix 3) (Hunter et al. Reference Hunter, Goodreau and Handcock2008a). Although the fit is moderate for the out degree distribution, the model performs well at reproducing the distribution for the other three statistics. This gives us confidence that our hypothesised covariates are relevant in the explanation of tie formation in the observed network.
Results and analysis
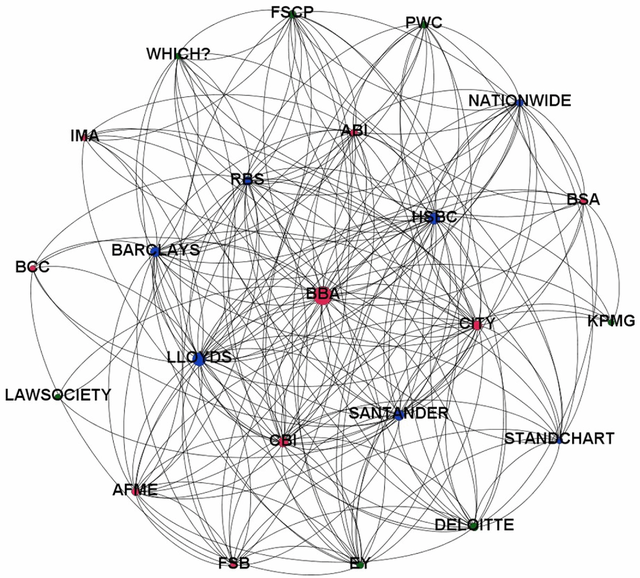
The policy network around British banking reform is presented in Figure 1. The data reveals a densely connected pattern of organisational ties, characterised by a strong core‐periphery structure. The core of the network is composed of eight highly connected large banks and financial trade associations, while other stakeholders (non‐bank trade associations, other banks, consumer groups and professional services firms) are less well connected. Closer analysis reveals that there are significant differences in the relational profiles of the banks: some stand out as highly central (HSBC, Lloyds, Barclays, Royal Bank of Scotland [RBS] and Santander), while others have very few connections (Standard Chartered and Nationwide). Notably, the main champions of consumer interests (Which? and the FSCP) are among the most peripheral organisations in the network.
The policy network on United Kingdom banking reform. Notes: Network produced using Gephi visualisation software, with the Fruchterman Reingold layout algorithm. Nodes coloured by organisational type and weighted by betweenness centrality (rescaled 6–18 points). [Color figure can be viewed at wileyonlinelibrary.com]

The attribute data also highlight important patterns of divergence within the banking reform network. Tellingly, the preference scores show that the main banks did not present a unified bloc of interests (see Table 1). While the majority were broadly hostile to the reforms, three important institutions (Lloyds, Santander and Nationwide) supported the government because they had little to lose from the changes.Footnote 4 The banks also played distinct leadership roles: while some were widely perceived to be key agenda‐setters (HSBC and Barclays), others were far less prominent in the process (RBS and Santander). Surprisingly, we also find that while the main financial and business associations are hyper‐connected within the network, they scored modestly for reputational leadership. To explain this pattern of ties, we test our theoretical hypotheses on network formation.
ERGM results
The estimated parameters reported in Table 2 provide information about the likelihood of structural effects being observed in a given set of network data. Large parameter values indicate that more configurations of that type are observed in the network than expected randomly. Parameter estimates greater than twice the size of the estimated standard errors are considered statistically significant.
The first results we report are the basic structural parameters in the network. The models indicate reciprocity to be positive and significant – a result that remains robust with the addition of the hypothesised covariates. The tendency for organisations to return cooperation in kind indicates a high degree of institutionalisation and mutual trust. The results for transitivity were mixed. Path closure (ATA‐T), which captures the extent to which organisations can facilitate collaboration and trust between two others, was significant in model B; while popularity closure (ATA‐D), which captures the extent to which two organisations are likely to be connected if they have incoming ties from the same others, was significant in models C and E. The results provide some evidence of closed or clique‐like interaction, although this is highly dependent on model specification.
With respect to our first control variable – organisational type homophily – we find that the parameter is negative. The result is borderline significant in models D and E, and significant in model F. This is evidence of a heterophily effect – namely, banks and trade associations are less likely to form ties with other banks and trade associations. This result is surprising because it contradicts previous research which finds evidence of actor type homophily in collaboration networks (e.g., Lee et al Reference Lee, Lee and Feiock2012; Leifeld & Schneider Reference Leifeld and Schneider2012; Gerber et al. Reference Gerber, Henry and Lubell2013; Heaney Reference Heaney2014; Fischer & Sciarini Reference Fischer and Sciarini2016; Ingold & Leifeld Reference Ingold and Leifeld2016). We offer two possible explanations. First, heterophily could result from the fact that certain types of organisation may provide resources that are duplicative and therefore redundant. Consequently, they are less likely to form collaborative ties with one another. Second, our interviews suggest that other factors may also limit tie formation between these particular organisations. For example, banks may be reluctant or unable to collaborate with other banks on grounds of commercial sensitivity or due to legal restrictions (i.e., competition rules). In addition, financial trade associations may have little incentive to work together as many are effectively in competition with one another for members. Further research is needed to investigate the potential that heterophily effects exist in certain policy sectors or for particular types of organisation.
Our second control variable – organisational salience – was found to be positively associated with network tie formation. However, salience was only statistically significant for incoming ties; in other words, the higher the salience of banking reform to an organisation, the more likely they are to be the target of collaboration. Exponentiating the coefficients in Table 2 provide an indication as to the size of the effect of each parameter, based on the odds of a tie on the original network (Hunter et al. Reference Hunter, Goodreau and Handcock2008a). Controlling for all other factors, the effect of salience increases the odds of an incoming tie to an organisation by 142 per cent%.Footnote 5 This confirms that tie formation is closely related to the perceived importance of banking reform to each organisation. For the purposes of this study, including organisational salience as a control variable allows for the more robust testing of our main hypotheses.
Turning to RDT, the model shows that reputational leadership is positively associated with the probability of an organisation attracting an incoming tie, and is statistically significant when all other covariates are held constant. Interpreting the coefficient as a conditional log‐odds ratio, the effect of leadership increases the odds of an incoming tie to an organisation by 98 per cent.Footnote 6 The results therefore confirm H1a: the higher the reputational leadership of an organisation, the more likely it is to be the target of collaboration. Further corroboration comes from testing the importance of leadership as a dyadic covariate (i.e., organisation B's leadership as perceived by organisation A), rather than as an attribute (the shared perception of organisation B's leadership). The estimation results, as reported in model F, confirm that individually held perceptions of leadership also have a statistically significant positive effect on tie formation. The finding is intriguing as it suggests that collectively held and individually held perceptions of leadership exert a similar causal effect on tie formation. Although further analysis of leadership as a dyadic covariate is needed, these results provide further support for resource‐driven explanations which assume that organisations collaborate in order to access the scarce political resources held by others.Footnote 7
The result for the relationship between reputational leadership and the outgoing ties of an organisation is not statistically significant. H1b is therefore not confirmed. How can we explain this? One possibility is that the effect of reputational leadership on tie formation works in opposite directions. For example, as we hypothesised, organisational leaders may have less incentive to instigate collaboration with others for the purpose of accessing their resources. Equally, however, the act of exercising leadership in the policy process may necessitate the instigation of collaborative ties in order to mobilise other organisations and steer political action. If both dynamics are at work simultaneously then they will cancel each other out, which may explain the insignificant result.Footnote 8
The interviews support our theoretical assumptions about the direction of causality specified in the model. In particular, they corroborate our claim that the desire to access the resources of others provides a powerful driver for collaboration. As a bank lobbyist explained, when a policy issue arises banks instinctively want to ‘represent themselves’ and ‘lead individually’.Footnote 9 But if they lack political resources, they will look to collaborate with others: ‘We go through a triage process and if we have limited resources and it's material to us … then we engage bilaterally.’Footnote 10 When deciding whom to approach, organisations assess the usefulness of others ‘on the basis of their potential to help set the agenda. … We would then have initiated contact with them to have further discussions.’Footnote 11 Another senior bank official explained their motivation for collaboration:
We contacted Standard Chartered because they had some strong views and were influential in terms of thought leadership. … We were thrilled that they pitched in because we weren't in a position to make strong arguments. Similarly for HSBC. There were points that [they] could make that would have been unseemly if made by us.Footnote 12
Some banks stood out as leaders in the process and so were a popular target for attempted collaboration. For instance, Barclays and HSBC were widely held to be ‘leading the charge’ in threatening to leave the United Kingdom, ‘so they're taken seriously and listened to’.Footnote 13 The reputation of both banks rested on their capacity to provide valuable political resources. While Barclays’ leadership was symbolised by the high‐profile and vocal role of its CEO Bob Diamond, HSBC's reputation rested on its perceived potential to wield influence. One bank lobbyist explained that they deliberately sought to reach out to HSBC because they were ‘the most coherent at thinking about strategy. They have some quite smart, thoughtful people in their global regulatory team and they engage around the world with senior international regulators much more than we do.’Footnote 14 Some banks also took the initiative on specific issues, necessitating collaboration with others. Barclays, for example, ‘attempted to corral the other major banks to head off ringfencing by producing a credible alternative’.Footnote 15 Similarly, Lloyds took the lead in developing detailed proposals to enhance competition in the sector ‘which meant galvanising the rest of industry … and exchanging information’.Footnote 16
By contrast, other banks were viewed as having less leadership potential. RBS, for example, was the ‘public face of the crisis’ and the government bail‐out had severely ‘clipped its wings’, leaving them more reliant on the trade associations to make their case.Footnote 17 Santander was also slow to engage with the process and consequently fewer organisations attempted to form ties with them, as a lobbyist explained: ‘The main reason was that they were still relatively new to the market. … I don't think it had a very proactive government relations team. Its general attitude was just to keep your head below the parapet.’Footnote 18 These examples illustrate the importance of resource dependency as a driver of tie formation in the financial industry.
Turning to belief‐based explanations, the ERGM also provides important support for the claim that network structure is positively associated with preference similarity and is statistically significant (H2). In other words, the closer the policy preferences of two organisations, the more likely they are to work together to influence policy makers; conversely, the further apart the preferences of two organisations, the less likely they are to be connected. The magnitude of the effect of preference similarity is more modest, however: it increases the odds of two organisations sharing a tie by 37 per cent.Footnote 19
The interviews provide several examples of the importance of non‐instrumental drivers of collaboration. For example, one bank deliberately shunned the opportunity to collaborate with others because of their divergence of views: ‘We definitely did not discuss the detail of our positioning and how we were approaching it with anybody. The reason was because there were very different views between us and our main competitors.’Footnote 20 Similarly, few stakeholders reached out to the largest building society, Nationwide, despite it being viewed as having an influential voice within government. This was because its support for ringfencing meant that ‘it simply had a very different perspective’ on the banking reform agenda.Footnote 21
Policy disagreements also hindered contacts between the financial industry and groups representing small businesses and consumers. The small and medium enterprise (SME) sector (represented by the British Chambers of Commerce and the Federation of Small Businesses), as well as insurers and investors (the Association of British Insurers and the Investment Management Association), were more distrustful of the banks and attached a higher priority to maintaining economic stability at home.Footnote 22 Consequently, the banks saw little value in trying to build alliances with them, preferring instead to collaborate with like‐minded sections of the business community. The consumer group Which? also had a strong reputation for agenda‐setting given its high‐profile role in convening its own commission on banking regulation prior to the ICB process.Footnote 23 Nonetheless, it was deliberately marginalised because the banks perceived it as a cheerleader for breaking them up. As an industry lobbyist commented: ‘I didn't talk to them at the time because we just knew we wouldn't agree.’Footnote 24 This was corroborated by the group itself which reported that its engagement with industry was ‘deliberately targeted’ at those with ‘similar views’ about the urgency of reform.Footnote 25
Finally, the finding that the traditional financial associations were hyper‐connected, despite scoring modestly for leadership, helps to disprove the possibility of reverse causality. If being highly central led to attributions of leadership, we would expect that the associations to score very highly for leadership on account of their longstanding collaborative ties across the sector. On the contrary, the banks concluded early on that the main association, the British Bankers’ Association (BBA), was ‘unhelpful’ and ‘ineffective’ because it was ‘not in possession of the sort of data and analysis which was needed’.Footnote 26 In addition, the association had ‘zero credibility’ following a series of scandals, such as that involving the manipulation of the London Interbank Offered Rate (Libor), with the result that ‘even if they'd wanted to take a lead role, I think [the banks] would have pushed them aside’.Footnote 27 Instead, the interviews suggest that the main associations were nonetheless highly connected because of preference similarity. The BBA, for instance, adopted an uncompromising stance in defence of universal banking and deliberately chose to represent the interests of the largest banks by ‘extracting from them two, three, four key messages which we delivered’.Footnote 28 Similarly, the main business association, the Confederation of British Industry, became a popular target for tie formation because it firmly allied itself with the large banks in criticising the detrimental impact of ringfencing on the real economy.Footnote 29 For example, one bank decided to work closely with business groups because ‘we felt they'd be a more powerful force’ due to their ability to ‘represent what is in the best interests of British industry as a whole, not just a few banks’.Footnote 30
The qualitative data provides strong support for our claim that reputational leadership and preference similarity exert a consistently positive and significant effect on tie formation. Furthermore, it points to the complementary and mutually reinforcing nature of these two distinct drivers of organisational collaboration. The evidence we present suggests that financial organisations were motivated to work with others because they provided access to scarce political resources and as a result of sharing basic policy beliefs.
Conclusion
We conclude by reflecting on how to interpret the results presented in this article and how these contribute to existing research. First, we find that the reputational leadership of an organisation is consistently and strongly predictive of tie formation, when controlling for preference similarity, organisational type and salience. Our use of directional data and an ordinal scale to capture leadership as an attribute permits greater theoretical precision. The model tells us that leadership is only positive and significant for incoming ties, not outgoing ties: in substantive terms, this means that organisations with a reputation for leadership are more likely to be the target of collaboration (H1a). This is significant because it suggests that organisations seek to leverage their influence by seeking to forge relationships with those perceived to have an abundance of scarce political resources. Furthermore, the same results appear to hold when leadership is used as a dyadic covariate – that is, organisation A's individually held perception of organisation B's leadership. This provides powerful support for the claim that resource dependency is a powerful motor of collaboration: organisations seek to work with those most likely to provide the best access to scarce political resources (Hojnacki Reference Hojnacki1997; Leifeld & Schneider Reference Leifeld and Schneider2012).
Second, we find that when controlling for all organisational attributes, preference similarity is also an important determinant of tie formation (H2). This offers important confirmation that organisations are more likely to collaborate if they share basic policy beliefs (Calanni et al. Reference Calanni2014; Henry et al. Reference Henry, Lubell and McCoy2011; Sabatier & Jenkins‐Smith Reference Sabatier and Jenkins‐Smith1993). The estimation results shed light on possible interaction effects between the covariates. Crucially, the addition of preference similarity does not level out the effect of leadership or salience; in fact, the coefficient for leadership actually increases slightly (model E). This tells us that preference similarity complements the effect of reputational leadership in driving tie formation, rather than competing with it, and therefore adds to our explanation of organisational collaboration. Finally, we also find some evidence of transitivity effects (path closure and popularity closure; models B, C and E), and – surprisingly – heterophily effects based on organisational type (specifically, for banks and trade associations). Although beyond the scope of this article, future research could systematically test for the various interaction effects between these covariates – particularly, between leadership and salience, leadership and preference similarity, and preference similarity and reciprocity/transitivity.
Our results make an important contribution to ongoing research about whether power or preferences drive network tie formation. In accordance with recent studies, we find that reputational measures (in our case: leadership) and preference similarity both exert a strong and robust influence on collaborative tie formation (Henry Reference Henry2011; Leifeld & Schneider Reference Leifeld and Schneider2012; Ingold & Leifeld Reference Ingold and Leifeld2016; Fischer & Sciarini Reference Fischer and Sciarini2016). In particular, our evidence supports the conclusion of Fischer and Sciarini (Reference Fischer and Sciarini2016) that they are distinct and complementary drivers of tie formation. This finding differs to some extent from Leifeld and Schneider (Reference Leifeld and Schneider2012), who find that while reputational influence and preference similarity are significant, the latter tends to be absorbed by the effect of common committee membership, reciprocity and transitivity. Hence, they conclude that actors use institutional, social and relational opportunity structures to establish contacts, rather than looking for those with similar beliefs (Leifeld & Schneider Reference Leifeld and Schneider2012: 739; see also Lubell et al. Reference Lubell2002). We agree that relational opportunity structures constitute an important driver of collaboration as ties tend to be reciprocated, and find some evidence of closed or clique‐like network structures. Importantly, however, preference similarity appears to play a much greater role in driving tie formation in our model because it remains significant when controlling for all other parameters.
Finally, this article makes a significant empirical contribution. To our knowledge, theories of resource dependency and preference similarity have not been applied to banking regulation before. Evidence that both theories hold explanatory value here suggests that they are robust across highly diverse policy subsystems. The finding that preference similarity serves as a significant driver of tie formation, even in the financial sector, was surprising. Given that banks operate in a highly competitive environment, we anticipated that collaboration would be largely strategic in nature. In addition, because we were concerned with mapping policy networks, composed of ephemeral patterns of collaboration around an atypical policy issue with characteristics of a one‐shot game, we did not expect belief‐based motives to play such a central part in the story. Further research would do well to compare the importance of reputational leadership and preference similarity across ‘most different’ policy sectors (for a recent example, see Ingold & Leifeld Reference Ingold and Leifeld2016). For example, it would be interesting to test the extent to which differences in policy polarisation, policy issue salience or political contestation serve as background conditions for organisational collaboration. It is conceivable that variance in these factors may produce different results in the relative importance of leadership and preferences.
Acknowledgements
We are grateful to the 34 participants who agreed to be interviewed for this research between 2012 and 2014. We also wish to thank the two anonymous reviewers for their helpful and constructive comments on earlier versions of this article. The research for this study was conducted as part of a two‐year project on ‘Policy Networks and Regulatory Reform in the City of London’, supported by the Economic and Social Research Council (grant ref. ES/K001019/1), for which Scott James was the Principal Investigator.
Supporting Information
Additional Supporting Information may be found in the online version of this article at the publisher’s web-site:
Appendix 1. Full Estimation Results and Goodness of Fit statistics (using PNET)
Appendix 2. Summary of estimation results in R using ergm
Appendix 3. Figures S3–S7
Appendix 4. Summary of Estimation Results and Goodness of Fit statistics for Leadership Standard Deviation and Interaction Effect (using PNET)
Appendix 5. Summary of transitivity measures


 Open access