

Mental disorders are a leading contributor to the burden of disease worldwide (Whiteford et al., Reference Whiteford, Degenhardt, Rehm, Baxter, Ferrari, Erskine and Vos2013). Reducing this burden requires improving access to quality treatment as well as better understanding and addressing the risk factors for mental disorders.
Several epidemiological studies have shown that low socioeconomic status (SES) is linked to an increased risk of mental disorders (Lorant et al., Reference Lorant, Deliege, Eaton, Robert, Philippot and Ansseau2003; Marmot et al., Reference Marmot, Stansfeld, Patel, North, Head, White and Smith1991; World Health Organization, 2014). These include studies that have defined SES as income, occupational class (where occupations are categorized by hierarchy) or as an index based on a combination of SES indicators. Lower income, occupational class and SES indices have all been associated with higher risks of having mental health problems in large national studies (Fryers et al., Reference Fryers, Melzer and Jenkins2003; Lorant et al., Reference Lorant, Deliege, Eaton, Robert, Philippot and Ansseau2003).
Controlling for Familial Confounding
Analysis of the relationship between SES and mental health problems can be influenced by familial confounders (i.e., genetic and environmental factors shared by family members) in studies of unrelated individuals when using simple regression models. For example, genes and the early family environment have been shown to influence choice of residence by postcode (Whitfield et al., Reference Whitfield, Zhu, Heath and Martin2005). Failing to account for these influences can bias the association between SES and mental health problems. Using data from twins allows us to control for confounders because identical twin-pairs share approximately 100% of their genes, nonidentical twins share approximately 50% of their genes, and the early environment (in utero and family upbringing) is assumed to be shared to the same extent by both identical and nonidentical twin-pairs. While twin data help control for genetic and early environmental confounders shared by twin-pairs, the study results have potential to benefit the whole population.
Within-Pair Twin Studies
Two previous twin studies have examined the association between SES and mental health by studying differences in exposures and outcomes within twin-pairs. Within-pair estimates of the association between exposure and outcome account for genetic and environmental traits that twins share.
Cohen-Cline et al.’s (Reference Cohen-Cline, Beresford, Barrington, Matsueda, Wakefield and Duncan2018) study of cross-sectional data from 3738 same-sex twin-pairs investigated whether higher SES was associated with fewer depressive symptoms (Cohen-Cline et al., Reference Cohen-Cline, Beresford, Barrington, Matsueda, Wakefield and Duncan2018). When examining the association in twin-pairs, a difference of 10 units in neighborhood socioeconomic deprivation within pairs was associated with 6% greater severity in depressive symptoms (95% CI [1.01, 1.11]) after adjusting for the mean deprivation score within a pair.
Osler et al.’s (Reference Osler, McGue and Christensen2007) cross-sectional study of 1266 same-sex Danish twin-pairs investigated whether differences in SES within twin-pairs were associated with symptoms of depression in middle age (Osler et al., Reference Osler, McGue and Christensen2007). In contrast to most other health outcomes, there were no significant results for depression.
While accounting for genetic and environmental factors, these two twin studies provide mixed evidence for the association between SES and mental health problems. Cohen-Cline et al.’s (Reference Cohen-Cline, Beresford, Barrington, Matsueda, Wakefield and Duncan2018) study provides support for the association between lower SES and poorer mental health problems, while Osler et al.’s (Reference Osler, McGue and Christensen2007) study did not find evidence for an association. These studies may have reached different conclusions due to methodological differences. Both studies restricted the definition of mental health problems to depression, and Cohen-Cline et al.’s measure of depression only contained two items. Osler et al.’s study focused on adults in middle age, but mental health varies over the life course, with higher prevalence of common mental disorders seen in young adults (Slade et al., Reference Slade, Johnston, Oakley Browne, Andrews and Whiteford2009).
We contributed to the existing work on SES and mental health by analyzing data from a major Australian twin dataset, using three SES indicators (including two validated measures) and a sensitive measure of psychological distress. We chose to examine the impact of SES on psychological distress, rather than the reverse, given that SES is a well-established social determinant of mental health (World Health Organization, 2014).
Aims and Objectives
Our study employed a twin design (Hopper & Seeman, Reference Hopper and Seeman1994; Sun et al., Reference Sun, Ponsonby, Wong, Brown, Kearns, Cochrane and Mackey2009) to control for unmeasured genetic and environmental confounders when analyzing differences (within-pair effects) and between-pair effects in SES and psychological distress between twins. Using data from Twins Research Australia’s (TRA) Health and Lifestyle Questionnaire (HLQ; TRA, 2018), we investigated whether there is an association between SES and psychological distress.
Methods
Subjects
The data for this study were collected by TRA from 2014 to 2017 using an online questionnaire (TRA, 2018). Participants were recruited through TRA’s website, newsletters and social media channels. The adult version of the questionnaire collects information on demographic background, and health and lifestyle data, including the Kessler 6 Psychological Distress Scale (K6) score, income, employment, occupation, postcode and zygosity. For this study, both twins in a pair had to have completed the HLQ and be aged 18 years or older.
TRA extracted data on K6 scores, occupation (to derive Australian Socioeconomic Index 2006 [AUSEI06] scores, described later), income, postcodes (to derive the Index of Relative Socio-economic Disadvantage [IRSD] deciles), age at questionnaire completion, sex, zygosity, marital status, general health, education and alcohol consumption. There were 1831 twin-pairs in the data file for this study.
Exposures: Derived SES Indicators
Occupational class: AUSEI06 score
We classified occupation using the AUSEI06, which is based on the Australian and New Zealand Standard Classification of Occupations (ANZSCO) coding (McMillan, Beavis et al., Reference McMillan, Beavis and Jones2009; McMillan, Jones et al., Reference McMillan, Jones and Beavis2009). ANZSCO classifies occupations for statistical analysis (Australian Bureau of Statistics, 2006b), and the validated AUSEI06 enables researchers to convert ANZSCO codes into occupational status scores. AUSEI06 scores occupations from 0 to 100 (with lower scores indicating less education, less skill required, lower income, and so forth).
As recommended by McMillan, Jones et al. (Reference McMillan, Jones and Beavis2009), occupations were coded to the four-digit unit group level of ANZSCO for compatibility with AUSEI06 scoring. The ANZSCO codes were then converted to AUSEI06 scores in line with McMillan et al. (McMillan, Beavis et al., Reference McMillan, Beavis and Jones2009) (see Table 1).
AUSEI06 scoring for ANZSCO groups
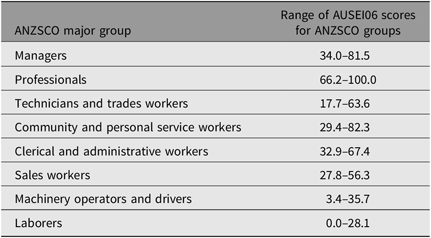
Note: Data sourced from McMillan, Jones et al. (Reference McMillan, Jones and Beavis2009).
Area-level SES: IRSD decile
We also used the ABS’s validated IRSD to measure SES, following recent studies’ use of this indicator (Scurrah et al., Reference Scurrah, Kavanagh, Bentley, Thornton and Harrap2016; Sugiyama et al., Reference Sugiyama, Villanueva, Knuiman, Francis, Foster, Wood and Giles-Corti2016). As the IRSD is commonly used and appropriate for this research question, it was preferred over the Index of Relative Socio-Economic Advantage and Disadvantage, which ranks areas by socioeconomic advantage and disadvantage. The IRSD is based on indicators of disadvantage from the Census of Population and Housing information (Pink, Reference Pink2013), including low income, unemployment, educational attainment, one-parent families with dependent children and long-term health conditions or disability. As per the Australian Bureau of Statistics (ABS)’ recommendations, we used IRSD deciles in the analysis for ease of interpretation (Pink, Reference Pink2013).
Income
For income, the original HLQ categories were used (see Table 2). The categories ranged from $0 to $126,000 and over per annum.
Distribution of categorical variables for extracted data of 3636 twin individuals, excluding pilot data

Outcome: The Kessler Psychological Distress Scale
The HLQ used the K6 to measure mental health. The K6 is a commonly used six-item measure of mental wellbeing and is a truncated version of the K10, which contains 10 questions. The survey asks: ‘During the last 30 days, about how often did you feel the following?’ ‘Nervous’, ‘Hopeless’, ‘Restless or fidgety’, ‘So depressed nothing could cheer you up’, ‘That everything was an effort’, ‘Worthless’. The scores of the six items are totalled to produce an overall score. Both versions were designed as part of the United States National Health Survey to screen for community cases of psychological distress, based on severity, rather than diagnosing specific disorders (Kessler et al., Reference Kessler, Andrews, Colpe, Hiripi, Mroczek, Normand and Zaslavsky2002). The K6 has been found to discriminate between Diagnostic and Statistical Manual of Mental Disorders (DSM-IV) cases and noncases (American Psychiatric Association, 2000) and is sensitive in the 90th–99th percentile range of the population distribution (Kessler et al., Reference Kessler, Andrews, Colpe, Hiripi, Mroczek, Normand and Zaslavsky2002). The final phase of the scale’s development included cross-validation with the Australian National Mental Health Survey (Andrews & Slade, Reference Andrews and Slade2001). We used Australian K6 scoring for this study; the possible overall scores range from 6 to 30, with lower total scores (6–18) indicating no probable serious mental illness and higher total scores (19–30) indicating probable serious mental illness (Australian Bureau of Statistics, 2006a).
Data Analysis
Regression models
We used three regression-based methods to explore the association between SES and psychological distress. The first approach used mixed effects models to take into account the correlation between twins in a pair, including SES measures and potential confounders as fixed covariates, and were fitted using maximum likelihood estimation. The estimates from this model represent weighted averages of the subsequent within-pair and between-pair estimates.
To analyze the association between the differences in the outcome and the differences in the exposure variables, we used within-pair regression of the difference in the outcome and the differences in the exposures for twins in each pair (Carlin et al., Reference Carlin, Gurrin, Sterne, Morley and Dwyer2005). Given that the distances between category midpoints were approximately the same for all noncontinuous exposures, these were treated as pseudo-continuous variables.
We also fitted within–between regression models, again using mixed effects models. These models included derived covariates representing the pair mean and the differences between each twin’s value and the pair mean for the exposure variables (Carlin et al., Reference Carlin, Gurrin, Sterne, Morley and Dwyer2005) and model parameters were estimated using maximum likelihood.
In these analyses, we did not allow different covariances for monozygotic (MZ) and dizygotic (DZ) twins in the models because the focus was on measured covariates and there was little power to detect differences in covariances given the different numbers of MZ and DZ twin-pairs.
Measured confounders
We adjusted for age, sex, general health and marital status in our analyses of the association between IRSD decile and K6 score and in our analyses of the association between the AUSEI06 and K6 scores. For the association between income category and K6 score, we also adjusted for the AUSEI06 score as occupation level is likely to influence income earned as well as psychological distress.
Maximizing sample power
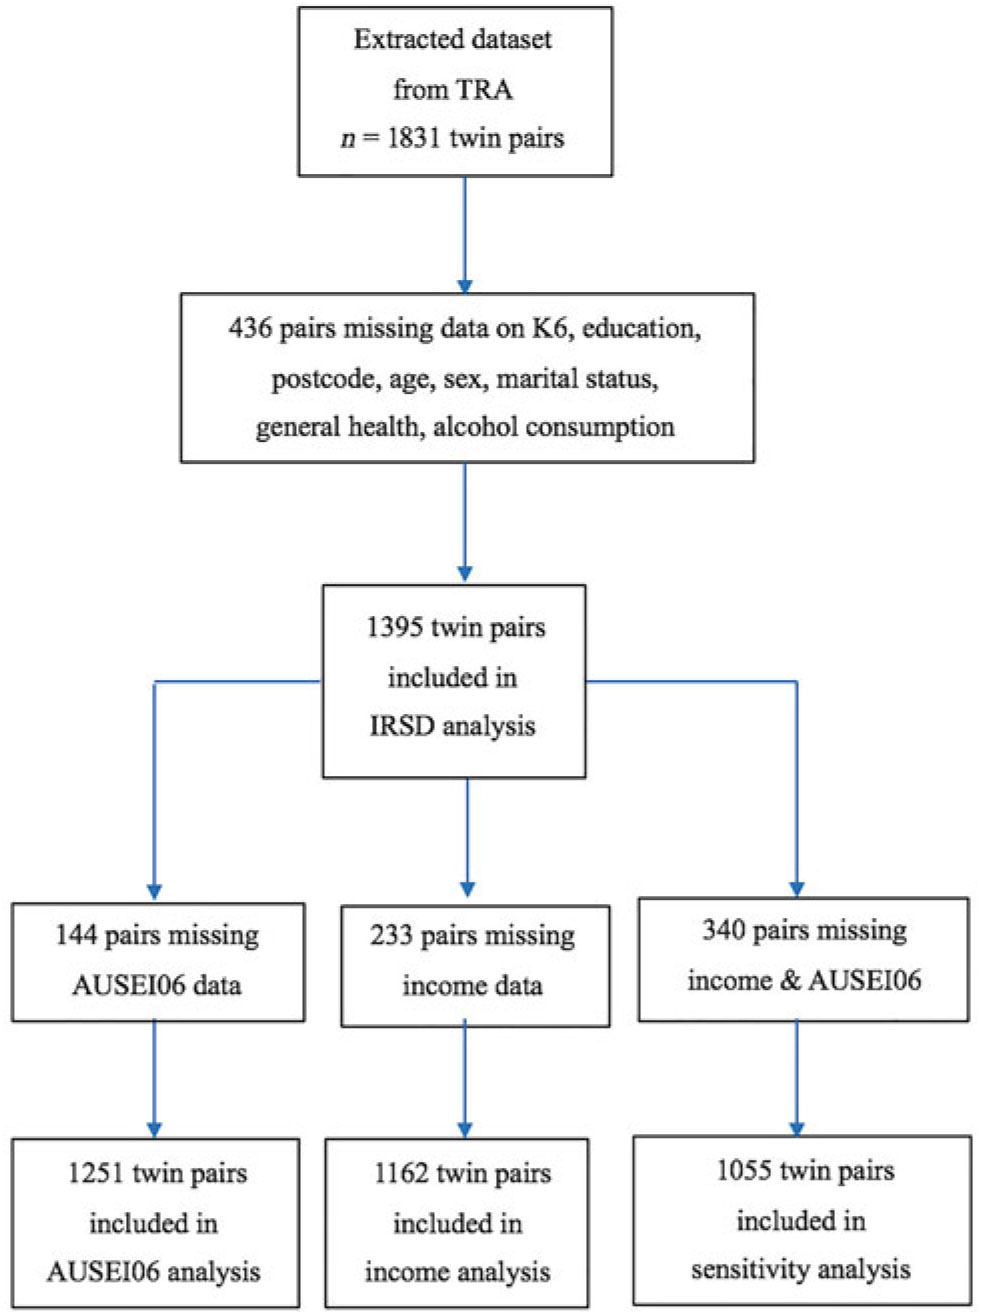
To maximize the study’s power, we used the greatest number of pairs possible in analyses between the K6 and each of the three socioeconomic indicators (see Figure 1). To analyze the association between the K6 and the IRSD, we used 1395 pairs. Both twins in each pair had complete data on the K6, education, postcode, age, sex, marital status, general health and alcohol consumption. Answers of ‘Don’t know / Prefer not to answer’ were coded as missing values. Due to missing data for occupation and income, we analyzed the associations of occupation and income with the K6 separately in two different subsets. There were 1251 pairs who had complete data for occupation (AUSEI06 scores) and 1162 pairs who had complete data for income.
Sample sizes used to analyze the associations between the K6 and IRSD.
Ethical Standards
This study received formal approval from TRA and ethics approval from The University of Melbourne’s Melbourne School of Population and Global Health’s Human Ethics Advisory Group (Ethics ID: 1851183.1).
Results
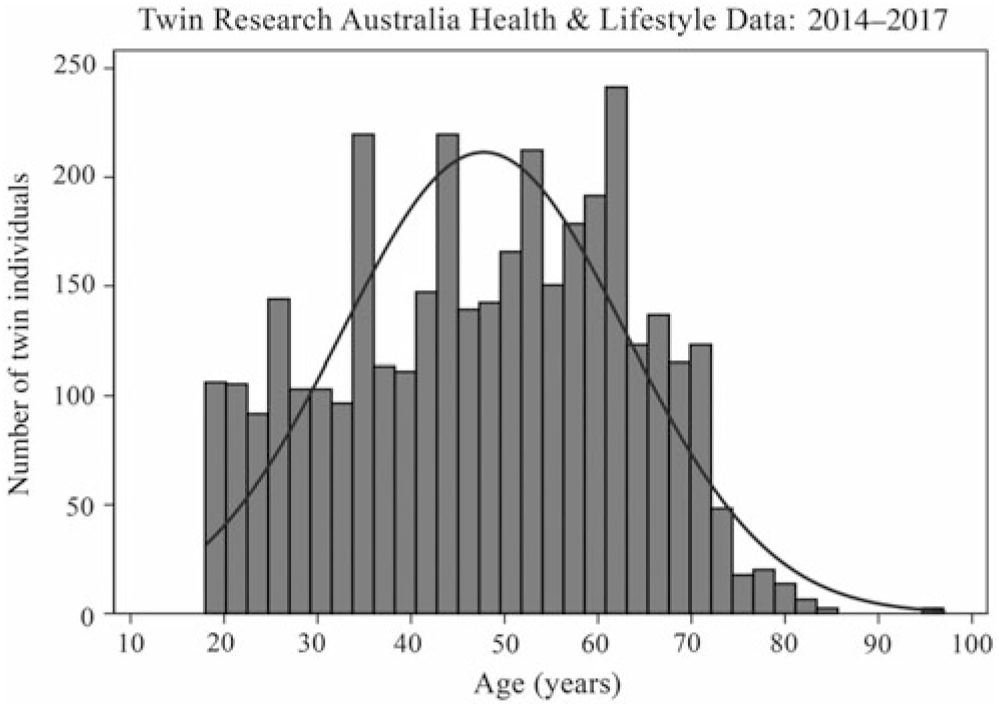
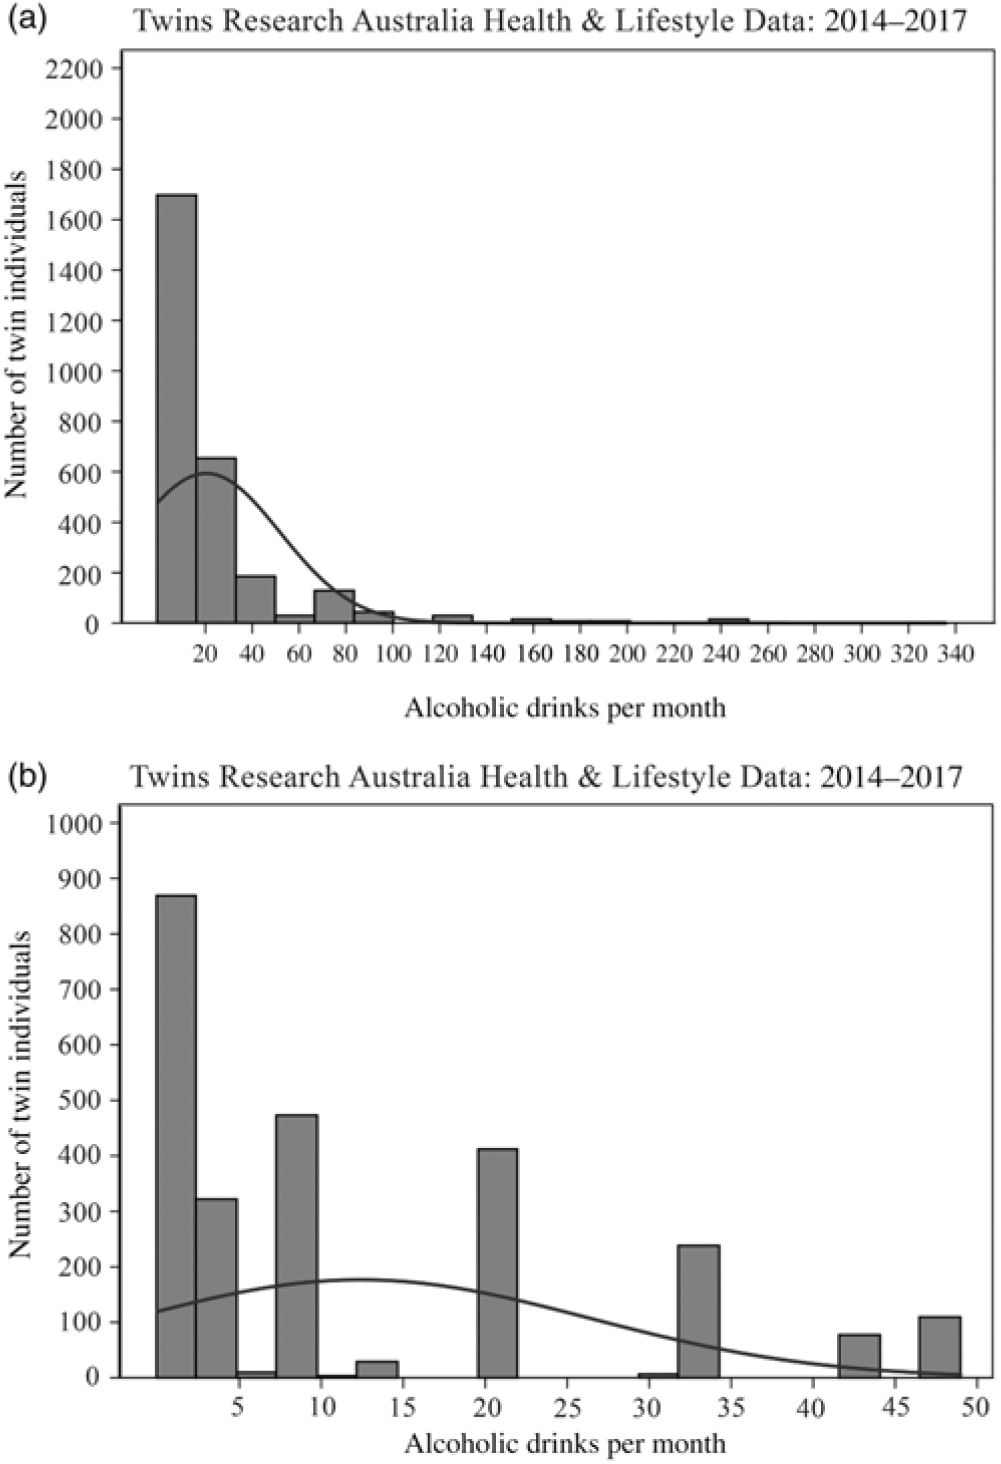
Table 2 and Figures 2–5 describe the characteristics of the 3636 twins included in this study’s sample. The majority were female (77.26%) and MZ twins (74.64%). Almost half the sample was 49 years or older (49.18%). Just under half earned $52,001 or more (46.65%); however, the median AUSEI06 score was 67 and the median IRSD decile was 7. The median K6 score was 8, indicating no probable serious mental illness. Despite a lack of normality in the distribution of most variables among single twins, the differences in variables between twins within each pair were normally distributed.
Age distribution among the sample.
Sample distribution of Kessler Psychological Distress Scores.

Sample distribution of AUSEI06 scores.

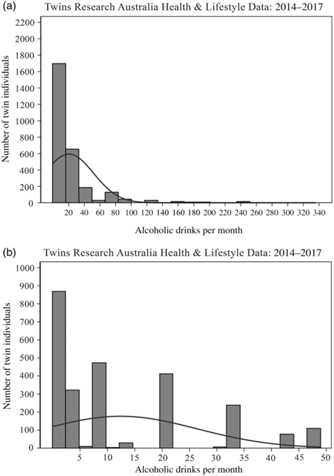
Sample distribution of derived alcohol measure used in models (number of alcoholic drinks consumed per month). (a) All data and (b) Excluding outliers.
Standard Multiple Regression
Standard multiple regression that accounted for correlations in twin-pairs showed the IRSD was not associated with the K6 (p = .1), but the AUSEI06 score (p < .001) and income (p < .001) were strongly negatively associated with the K6 score (see Table 3).
Generalized least squares estimates obtained from a maximum likelihood model (GLS ML) random effects, within-pair and within–between pair analyses

Notes: βC is the average change in K6 score for a 1-unit increase in SES indicator.
βW (within-pair model) is the expected change in the difference in K6 score between twin one and twin two, for a one unit change in the difference in SES indicator between twin one and twin two.
βW (within–between model) is the expected change in K6 score for a 1-unit change in the difference between an individual’s SES indicator and the twin-pair average for the SES indicator.
βB (within–between model) is the expected change in K6 score for a 1-unit change in the twin-pair average for the SES indicator.
* IRSD, n = 1395 pairs. Models adjusted for age, sex, general health, marital status and alcohol.
** AUSEI06, n = 1251 pairs. Models adjusted for age, sex, general health, marital status and alcohol.
*** Income, n = 1162 pairs. Models adjusted for age, sex, general health, marital status, AUSEI06 score and alcohol. Within-pair differences model does not adjust for age or zygosity.
Within-Pair Differen ces Analyses
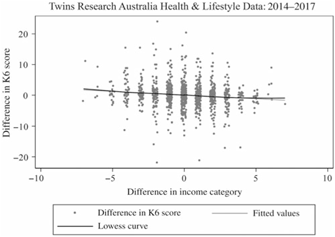
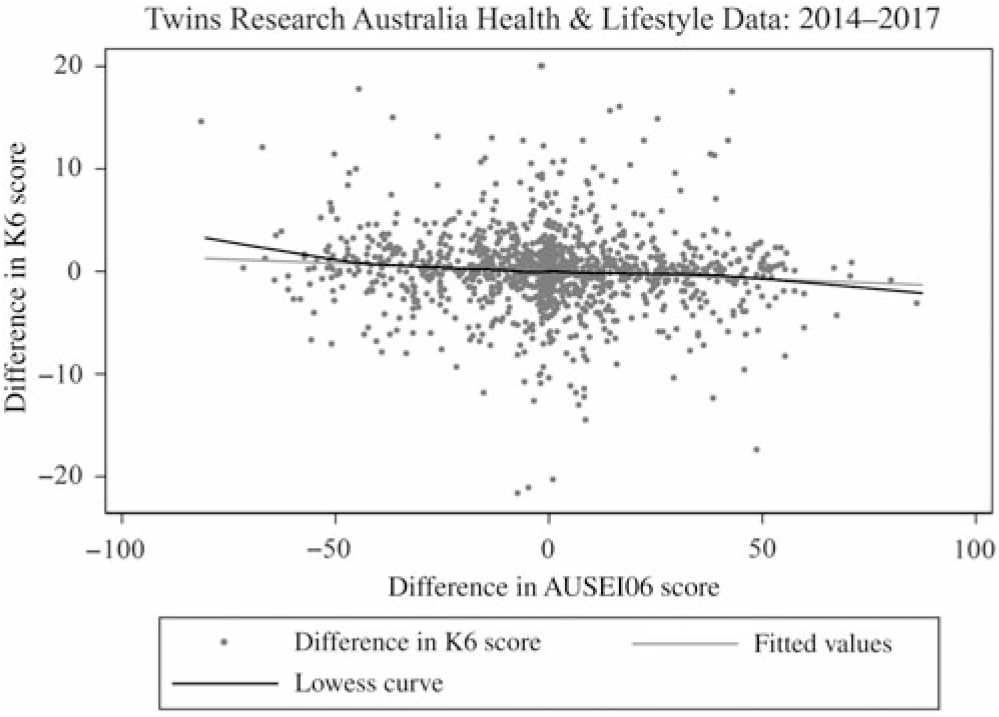
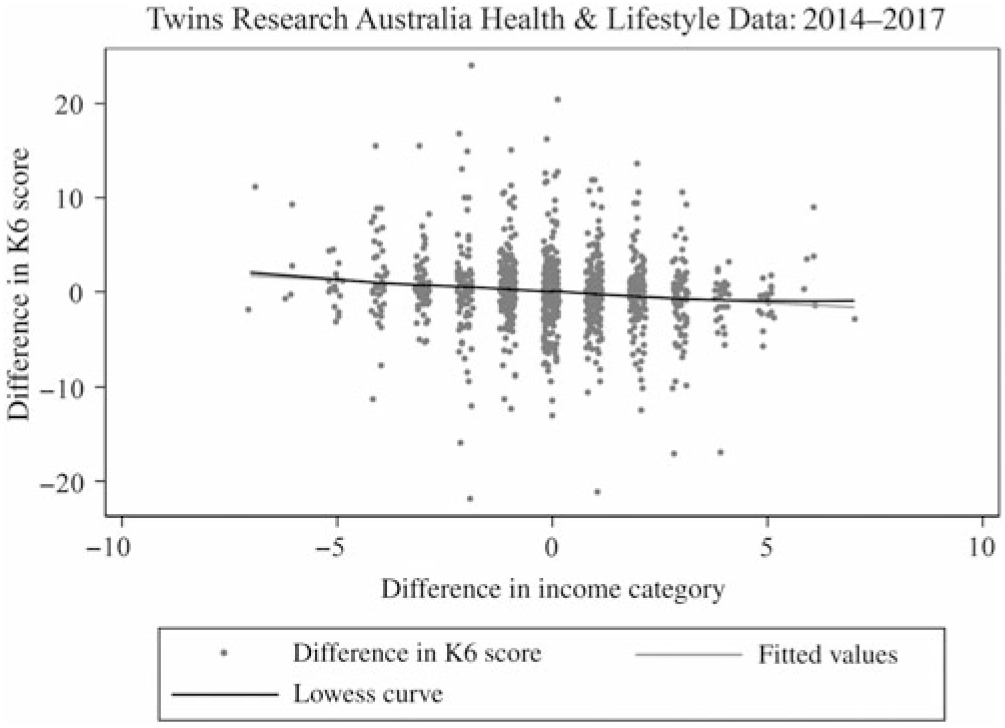
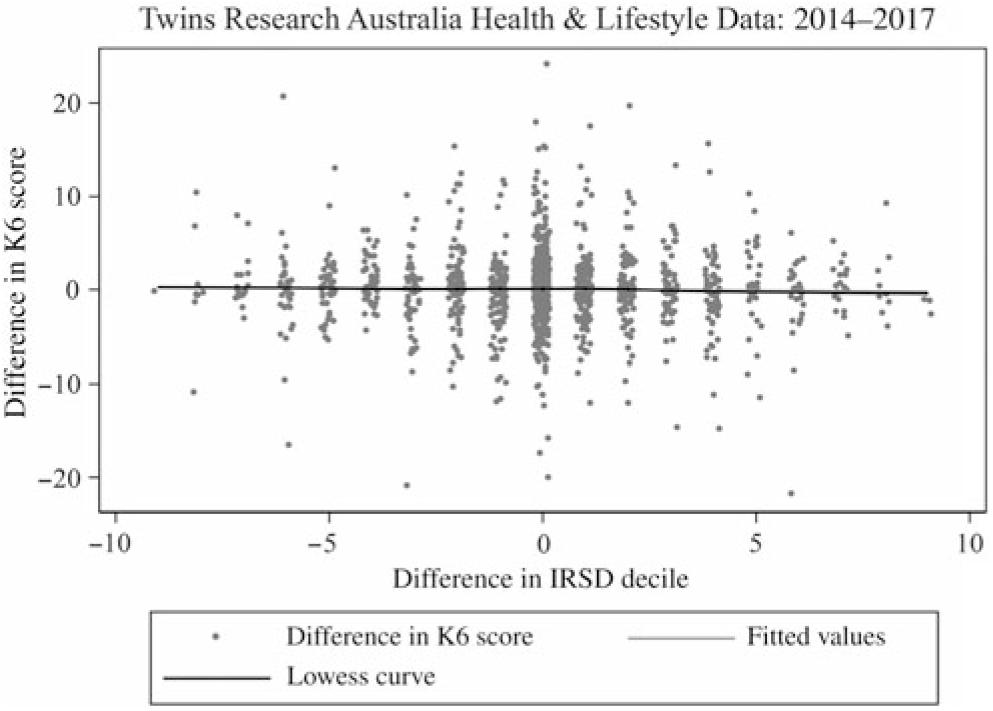
Within-pair analyses showed strong evidence for the association between a higher AUSEI06 score and lower K6 score as well as higher income category and lower K6 score, after controlling for genes and environment (see Figures 6 and 7). There was no evidence of an association between IRSD decile and K6 score differences within twin-pairs (p = .6) (see Table 3 and Figure 8).
Scatter plot with Lowess curve of the K6 score and AUSEI06 differences within pairs.
Scatter plot with Lowess curve of the K6 score and income category differences within pairs.
Scatter plot with Lowess curve of the K6 score and IRSD decile differences within pairs.
AUSEI06 Score
For every unit increase in the difference in the AUSEI06 score (between twin 1 [first-born twin in a pair] and twin 2 [second-born twin in a pair]), the expected difference in the K6 score (between twin 1 and twin 2) decreases by 0.015 units (95% CI [−0.024, −0.006], p = .001) (see Table 3). For a 10-unit increase in the difference in the AUSEI06 score (between twin 1 and twin 2), the expected difference in the K6 score (between twin 1 and twin 2) decreases by 0.15 units (95% CI [−0.24, −0.06], p = .001). This meant that a twin who has a higher AUSEI06 score than their co-twin tended to have a lower K6 score than their co-twin.
Income Category
For every unit increase (approximately $20,000) in the difference in income category (between twin 1 and twin 2), the expected difference in the K6 score (between twin 1 and twin 2) decreases by 0.170 units (95% CI [−0.283, −0.056], p = .004) (see Table 3). For a 5-unit increase (approximately $100,000) in the difference in income category (between twin 1 and twin 2), the expected difference in the K6 score (between twin 1 and twin 2) decreases by 0.85 units (95% CI [−1.415, −.168], p = .004). This meant that the individual twin within a pair who has a higher income category than their co-twin would have a lower K6 score on average than their co-twin.
Within- and Between-Pair Multivariable Analyses
IRSD decile
There was no evidence of an association between IRSD decile and K6 score when using differences between twin 1 and twin 2’s IRSD deciles (βW [within-pair regression coefficient], p = .6) and the between-pair average for IRSD decile (βB [between-pair regression coefficient], p = .2) in analysis (see Table 3). As per the ABS’s recommendations, we used IRSD deciles in the analysis for ease of interpretation (Pink, Reference Pink2013).
AUSEI06
The between-pair estimate (−0.018 K6 score units) was similar to the within-pair estimate (−0.012 K6 score units) for the association between the AUSEI06 and K6 scores. This meant that the observed association between the AUSEI06 and K6 scores was unlikely to be due to confounding and consistent with causation. The between-pair CI (95% CI [−0.025, −0.010]) and within-pair CI (95% CI [−0.021, −0.004]) overlapped, indicating a true difference between these estimates was unlikely to exist. A likelihood ratio test confirmed this observation, providing no evidence against the null hypothesis that the estimates were different (p = .4) (see Table 3). The true association was the within-pair estimate (βW = −0.012 units), that is, the estimate representing the association, free from confounding by shared genetic and environmental factors.
Income
Again, the similar estimates (BB = −0.215 units, 95% CI [−0.327, −0.104] and βW = −0.182 units, 95% CI [−0.295, −0.069]) meant that the observed association between income category and the K6 score was consistent with causation. A likelihood ratio test confirmed this observation (p = .7) (see Table 3). The true association was the within-pair estimate (βW = −0.182 units).
Sensitivity Analysis and Robustness Checks
Sensitivity analysis
We performed a sensitivity analysis for each socioeconomic indicator using the subset in which all twin-pairs had complete data for income and AUSEI06 scores. Similar results were found, indicating that the subset of twins with missing data was not different to the larger group (data not shown).
Robustness checks
We performed robustness checks by obtaining the residuals from the maximum likelihood random effects models for the AUSEI06 score and income category (which were approximately normally distributed), removing the 2.5% most extreme values and then refitting the models. None of the models provided substantially different results, showing the associations found in the main analysis were not driven by extreme values in the data. For example, the within-pair coefficient for the association between the AUSEI06 and the K6 changed from −0.015 to −0.013 after excluding extreme values (full data not shown).
Discussion
These results provide further support for the association between lower SES (defined as AUSEI06 score or income category) and higher psychological distress, after controlling for familial confounding. However, there was no significant association between IRSD decile and psychological distress.
The within–between model revealed that the relationships between the AUSEI06 score, income category and psychological distress were consistent with causation (βW = βB; Carlin et al., Reference Carlin, Gurrin, Sterne, Morley and Dwyer2005). If the relationships between any of the SES indicators and psychological distress were partially due to confounding, the between-pair estimates would be expected to be larger than the within-pair estimates (βB > βW). The within-pair estimate describes the association after controlling for confounding, while the between-pair association does not. If the within-pair association was larger than the between-pair association (βW > βB), this too would be consistent with causation (Carlin et al., Reference Carlin, Gurrin, Sterne, Morley and Dwyer2005).
Our findings contrast with those of Osler et al. (Reference Osler, McGue and Christensen2007), whose analysis of cross-sectional twin data found no evidence for an association between higher occupational class and better mental health. This may be explained by differing definitions of occupational class and mental health. Osler et al. used a combination of occupational variables to create an occupational class index, while we used occupation alone. In addition, Osler et al. used a specific depression score to measure mental health, while we used the K6, a general measure of psychological distress. The difference in findings may also be explained by variance in inequality between Danish and Australian cultures. In addition, Osler et al. used a middle-aged sample, while our study sample ranged from 18 to 97 years in age. The prevalence of common mental disorders tends to decline with age (Kessler et al., Reference Kessler, Birnbaum, Bromet, Hwang, Sampson and Shahly2010); therefore, an association between occupational class and depression may be less observable in a middle-aged sample.
The results of our analyses of the association between IRSD and psychological distress are more similar to those of Cohen-Cline et al. (Reference Cohen-Cline, Beresford, Barrington, Matsueda, Wakefield and Duncan2018), who also used a geographical census-based index (which measures the SES of an area in which an individual lives). While Cohen-Cline et al. found a significant within-pair association between neighborhood socioeconomic deprivation and depression, our study was unable to support an association in either direction. We initially attributed this difference in results to the IRSD index being based on postcodes, which encompass large geographical areas. Therefore, twins within a pair may have been more likely to reside within the same geographical area and fall into the same IRSD deciles, resulting in a large number of twin-pairs with no difference in IRSD decile. Upon review, we found no difference in IRSD decile for 35% of twin-pairs in our sample; conversely, 65% of twin-pairs did differ in IRSD decile (and of this 65%, 20% differed by 1 IRSD decile). Therefore, 55% of twin-pairs in our sample with little or no difference in IRSD decile may have contributed to a null result. (The same sample was used for all models in the analysis of the association between the IRSD decile and K6 score and no differences in results were found, see Table 3). Furthermore, we used psychological distress to define mental health, while Cohen-Cline used a specific diagnosis of depression, which may further explain the difference in results between the two studies.
Our findings provide further support for the links between low SES and poor mental health and point to the need to address the social determinants of poor mental health (e.g., affordable housing; Bentley et al., Reference Bentley, Pevalin, Baker, Mason, Reeves and Beer2016) and improved working conditions (LaMontagne et al., Reference LaMontagne, Martin, Page, Reavley, Noblet, Milner and Smith2014) rather than focusing on interventions targeted to individuals alone (e.g., counseling, psychology or psychotherapy), which have not appeared to have an impact on the population prevalence of mental health disorders (Jorm et al., Reference Jorm, Patten, Brugha and Mojtabai2017). A more effective strategy may be to focus on social determinants of health, in addition to targeted interventions for individuals.
Strengths and Limitations
Strengths
The key strength of this study was the use of a substantial twin sample to examine the association between SES and psychological distress while controlling for shared genetic and environmental traits. Standard analyses with mixed regression models can overestimate the association (even though these account for clustering in twin-pairs). The estimates from these standard analyses are weighted averages of the true within- and between-pair estimates. Using twin data and more sophisticated modeling techniques allowed us to establish the associations after controlling for unmeasured genetic and environmental confounders.
Limitations
The limitations of twin studies have been addressed in two ways. First, the distribution of total mental health screening scores among our twin dataset (Twins Research Australia, 2018) follows a ‘J’-shaped exponential curve (aside from the lower scores) similar to the distributions of mental health scores in general adult population datasets (Melzer et al., Reference Melzer, Tom, Brugha, Fryers and Meltzer2002; Tomitaka et al., Reference Tomitaka, Kawasaki, Ide, Akutagawa, Ono and Furukawa2018). In addition, the distribution of total K6 scores in our twin dataset follows the distribution of the expanded version of the K6 (K10) in a nationally representative mental health survey of the Australian adult population (Slade et al., Reference Slade, Grove and Burgess2011; the majority of scores indicating low levels of psychological distress, while the minority of scores indicate high levels of psychological distress).
In addition, the data are cross sectional, and therefore we cannot infer direction of causation, that is, whether lower SES results in higher K6 score (probable serious mental illness) or vice versa. In addition, occupational ANZSCO coding does not account for job stability (casual or permanent roles), which may also contribute to psychological distress. Also, ANZSCO coding does not recognize voluntary or unpaid work (Australian Bureau of Statistics, 2006b). Therefore, participants such as volunteers or stay-at-home parents would have been excluded from the AUSEI06 and K6 score analyses. Including data from these participants based on their previous occupations would have increased the sample size and refined our results even further.
Although this study used economic indicators of SES, it could be argued that SES also includes political, social and cultural resources (Galobardes et al., Reference Galobardes, Lynch and Smith2007). Including these indicators in analyses might provide more comprehensive insight into the association between SES and psychological distress.
Finally, given access to the appropriate variables, it would have been useful to control for several other confounders. Women are vulnerable to depression following the birth of a child and experience depression more often at 4 years after birth than in the first 12 months following birth (Woolhouse et al., Reference Woolhouse, Gartland, Mensah and Brown2015). Therefore, adjusting for children (and children’s age) might have accounted for more variation in the results. This is one example of many potential factors that could be controlled for. In addition, the association may vary among different disease conditions, given those with highly disabling physical diseases also experience mental health problems (Cancer Australia, 2018; Stroke Foundation, 2018; Woodruffe et al., Reference Woodruffe, Neubeck, Clark, Gray, Ferry, Finan and Briffa2015).
Conclusion
This study provided further support for the association between poor mental health and lower occupational class and earning a lower income, after accounting for unmeasured genetic and environmental confounders.
Acknowledgments
This research was facilitated through access to Twins Research Australia, a national resource supported by a Centre of Research Excellence Grant (ID: 1079102), from the National Health and Medical Research Council. We greatly appreciate Dr Humaira Maheen’s invaluable guidance in using the Australian Socioeconomic Index 2006.
Conflict of interest
None.