


INTRODUCTION
Budapest (capital of Hungary) is famous for its thermal springs discharging along the river Danube. The springs have been utilized for balneological purposes from the time of the Romans through Medieval ages up to the present day. They are manifestations of a large regional groundwater flow system, where the water is heated at depth and returns to the surface as thermal water, after a long “itinerary”, generally along fault zones (e.g. Kovács and Müller Reference Kovács and Müller1980; Mádl-Szőnyi and Tóth Reference Mádl-Szőnyi and Tóth2015).
Built by the Turks in the 16th century, Rudas is one of the historic spas fed by these thermal waters and has been in use from medieval times up to today. Archive documents show that in 1883 a stone-carved water-inlet was installed to the central Turkish pool of the present spa. Since then a voluminous flowstone-like travertine buildup has precipitated and covered the stand of the stone channel. Since precipitation is an ongoing process even today, the Rudas travertine was selected for detailed study with the aim of exploring the structure, texture, mineralogy and geochemistry of the material. This should contribute to our knowledge of the precipitaton rate and its controlling factors in this antropogenically influenced environment.
To attain reliable results regarding precipitation rate, in addition to the fixed date of the beginning and the end of the precipitation (see details below), it was necessary to establish at least one more precise datum preferably somewhere inbetween the two extremes. The possible incorporation of the well-known atmospheric-bomb radiocarbon (14C) peak of the 1960s in the interior of the travertine seemed to offer such an opportunity. It was supposed that though the thermal water was very old (11–12 kyr according to Deák Reference Deák1978) and arrived to the spring along an underground pathway, it also might have been contaminated with atmospheric 14C during discharge thus contaminating the precipitate.
GEOLOGY AND HYDROGEOLOGY
The Rudas Spa was established at the foothills of Gellért Hill, a near-vertical rocky cliff, directly on the west side of the river Danube. The hill is built up mainly by Triassic dolomites that are deeply eroded. This karstified surface is unconformably overlain by a partly eroded late Middle Eocene transgression sequence represented by breccias, limestones, marls and clays. In Mid Pleistocene times (ca. 250 kyr to 180 kyr), travertines were precipitated due to intensely discharging thermal springs. Based on these age data, the uplift rate of Gellért Hill was calculated to be ca. 0.47 to 0.52 mm/yr (Kele et al. Reference Kele, Scheuer, Demény, Shen and Chiang2009). Recently, carbonate precipitation still occurs in active thermal springs and spas of the Gellért Hill area (cf. Virág et al. Reference Virág, Mindszenty, Bendő and Mindszenty2013a, Reference Virág, Mindszenty, Weidinger, Molnár, Bendő Zs, Mádl-Szőnyi and Mindszenty2013b; Kovács-Bodor et al. Reference Kovács-Bodor, Anda, Jurecska, Óvári, Horváth, Makk, Post, Müller and Mádl-Szőnyi2018, Reference Kovács-Bodor, Csondor, Erőss, Szieberth, Freiler-Nagy, Horváth, Bihari and Mádl-Szőnyi2019).
In the vicinity of the Spa, there are several thermal springs discharging from the karstic reservoir which are crosscut by faults and fissures. The springwater is not of local infiltration origin but it is the result of distant regional recharge as shown by detailed hydrogeological analysis of the wider surroundings by Erőss et al. (Reference Erőss, Mádl-Szőnyi, Surbeck, Horváth, Goldscheider and Csoma2012), Mádl-Szőnyi and Tóth (Reference Mádl-Szőnyi and Tóth2015), and others. Their findings are reinforced by J. Deákʼs 14C-based age data according to which the age of deep groundwaters of the Buda Thermal Karst is 11,000–12,000 yr (Deák Reference Deák1978), i.e. they are, indeed, representatives of discharge at the end of a regional flow-path.
The average yield of the springs is relatively constant (totalling to about 3200 m3/day) while both water temperature and total dissolved solids content (TDS) vary (also seasonally) from 35 to 47°C, and from 1450 to 1700 mg/L, respectively. Seasonal changes are apparently related to flooding events of the nearby river Danube, even though no advective communication between river water and groundwater has ever been detected (Schafarzik Reference Schafarzik1920; Kunszt Reference Kunszt1947; Kessler Reference Kessler1965; Páll-Somogyi Reference Páll-Somogyi2010; Mádl-Szőnyi et al. Reference Mádl-Szőnyi, Páll-Somogyi, Erőss and Mindszenty2013).
Currently, in order to provide for a steady water supply to the Spa, instead of using the natural springs to fill the pools water is collected from deep wells and water shafts directly tapping the karstwater reservoir (see below). The water thus collected is transported by a closed pipeline under pressure first into an indoor tank and from there, through a covered channel system and according to the required amount and temperature it arrives to the pools of the Spa. Temperature is currently controlled by a thermostat system, installed in 2004.
THE HISTORY OF RUDAS SPA AND ITS WATER SUPPLY
Rudas Spa is one of the historic old Turkish baths of Budapest. Written records, summarized e.g. by Kunszt (Reference Kunszt1947) and Beck (Reference Beck1987), show that the therapeutic use of thermal springs discharging at the foothills of Gellért Hill dates back to the 13th century. Construction of the octagonal pool, the core of the present building, began only in the 16th century at the time of the Turkish occupation of Buda. Between 1880 and 1883, a major reconstruction took place with the aim of converting the traditional Turkish bath into a modern steam bath. Throughout the 120-yr-long history of this Spa, the water-supply system has been subject to several changes (see Table 1). First, it was fed by a mixture of water from five natural springs (Árpád I., Mátyás, Kinizsi, Török and Udvari Springs) with an average temperature of 42°C.
Water-management history of Rudas Spa.
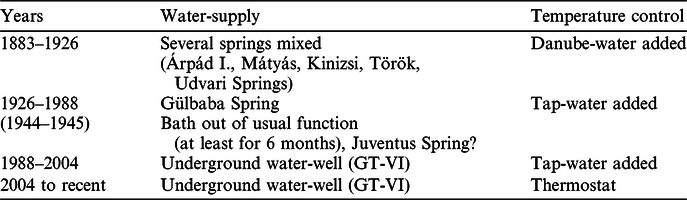
In 1926 a new spring (Gülbaba, with water temperature of 42–43°C) was discovered and soon it was piped directly to the stone-carved water-inlet of the octagonal pool (Kunszt Reference Kunszt1947). From 1926 to 1944, this served as the exclusive water-resource of Rudas. During WorldWar II, part of the Spa was seriously damaged, but fortunately the octagonal pool survived. To optimize the utilization of thermal waters of the Gellért Hill area, a 1100-m-long water-collecting adit was driven into the dolomite in the 1970s. Thermal water has been withdrawn from the reservoir ever since then by drilled wells and shafts. Water-shaft GT-VI (water temperature between 42 and 43°C) was selected to provide the water supply to Rudas since 1988. Thermal water is pumped out of the shaft and transported by the closed pipeline under pressure first to the storage tank and from there into the pools.
As to the water management of the Spa, at the very beginning, the optimum water temperature was attained by mixing the thermal water first with riverwater, and later (up to the 2004 reconstruction) with drinking water from the rural pipelines (see Table 1). Since then, the water-management of the pools has been subject to other changes several times. Towards the very end of World War II, when the building was partially destroyed, the Spa was not used for about two years. The partly open brick-arched channel of the water-collection system for the springs collapsed and, although the ruins were cleaned up in 1945, the roof of the channel was restored only in 1947. Large-scale cleaning operations and renovations were undertaken in 1952/53, 1966/67, 1971, 1981 and 1986 (with unspecified lengths of temporary halts). During these episodes, the pool was always drained and water supply temporarily suspended. The last major alteration took place in 2004. Currently, according to the daily routine of the Spa, taps are closed for the night and the pool is drained and cleaned. The water supply is started again the next morning. The pool is filled from below, and the thermal water flowing through the stone-carved water-inlet (from which the travertine is precipitating) is maintained only for aesthetical purposes.
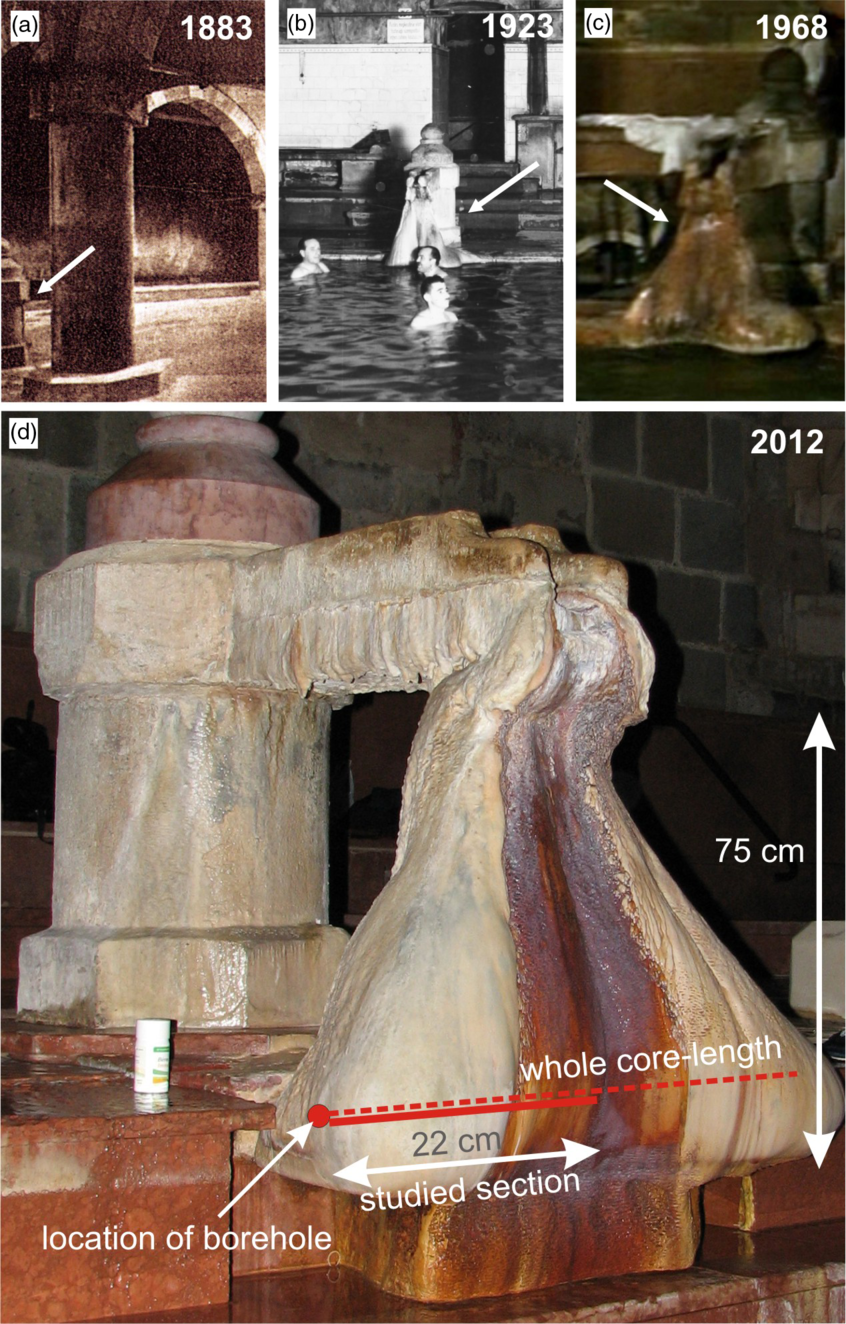
From archive photographs in 1883, the stone-carved water-inlet standing on the margin of the pool, did not yet have any visible encrustation on its surface (Figure 1a). In this work it was assumed that from 1883 on, the precipitation of carbonate has been quasi-continuous. Two other photographs, documenting that travertine precipitation had already occurred on the inlet-stand, originate from 1923 (Figure 1b) and from 1934. In 1968, in a photograph (made at the occasion of a movie production in the old Turkish bath of Rudas) the already fully-grown travertine buildup is clearly visible, though its color is not white but rather brownish and the size is somewhat smaller than that of today (Figure 1c).
Growth history of the Rudas travertine shown by archive photographs. (a) 1883: the bare water-inlet stand with no precipitate (Photo Gy. Klötz). (b) 1923: incipient precipitate right below the inlet-channel (Photo Gy. Czvek). (c) 1968: the travertine buildup is almost totally covered by red and gray-colored Fe-Mn oxide precipitate. (d) 2012: fully developed precipitate covering the whole stand of the water-inlet. Note the red coloration (iron-oxide) along the central grove and the pure white color (CaCO3) of the lateral lobes. Location of the drill-core (whole core-length) is indicated by the dashed red line. However, the 22-cm-long half-part studied section of drill-core is indicated by the continuous red line. (Please see electronic version for color figures.)
METHODS
Our work began by systematic historical data collection. In order to find eventual anthropogenic controls of travertine precipitation in the Spa available historical descriptions, reports (e.g. Molnár Reference Molnár1869), and the above-cited papers (Kunszt Reference Kunszt1947 and Beck Reference Beck1987) were studied, archive photographs were collected and also the management of the Spa was interviewed for information regarding daily/monthly technicalities.
In 2004, the Spa was subject to large-scale reconstruction so that in the framework of an MSc-thesis research (Veres Reference Veres2007), access to the travertine body became possible. Sampling was undertaken by diamond-coring in 2004 (Bosch GDB 16000 WE portable diamond coring equipment, 2000 rev/min, water-cooled) across the widest part of the flowstone-like travertine. The 160 cm wide buildup was cored in the 235°–55° direction, at about of 5.5 cm above the pool-margin. Core recovery was 99%. To observe the internal structure, the 76.5-cm-long, 25-mm-diameter core was cut in half along its long axis (Veres Reference Veres2007). Of the two roughly symmetrical, sideward-prograding, obliquely laminated parts, the more complete core slice was selected for our detailed study. The cut surface was polished, photo-documented and digitalized.
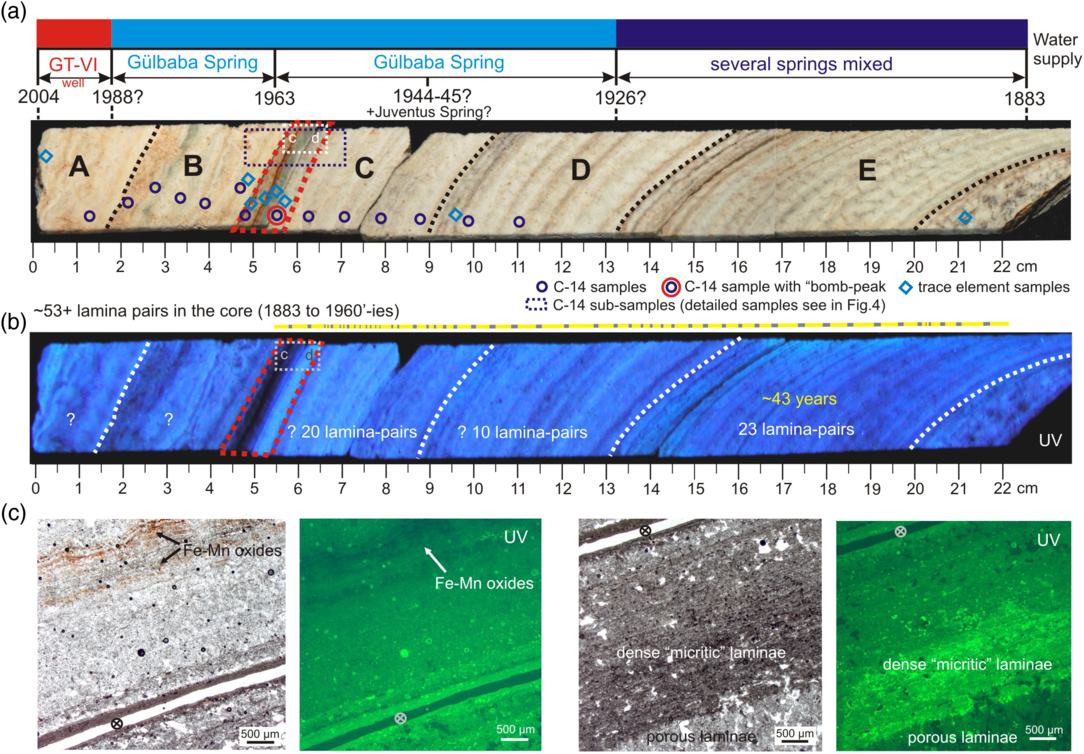
Laminae were distinguished on the basis of their color and fabric, using scanned images. Lamina counting was undertaken by starting from the initial, quasi-regular older bands of E, D and C sections ending at the anomalous section. From here on, the younger laminae (A, B) are wavy and irregular, therefore they are not appropriate for counting (Figure 2a,b). UV-fluorescence was preliminarily checked on the hand specimen (commercial UV-light source, with no filter).
Textural features of the Rudas travertine (the cm-scale starts with zero at the “recent” end of the core (2004). (a) Macropetrography of the core across the left lobe of the buildup (probably due to changes of the source of water-supply indicated on the colored bar on top). Black dashed lines = boundaries between the texturally different sections (A, B, C etc.) of the core. Red dashed line = section supposedly corresponding to the 1960s with the “bomb” peak (sampling points for 14C are indicated by dark blue dots; subsamples for trace element analyses are shown by blue squares; 14C subsamples are indicated by dark blue dashed line, for the detailed subsamples see in Figure 4). A white dashed box shows the position of thin-sectioned subsamples (c) and (d). (b) Macropetrography of part of the core in UV-light. Gray dashed box shows the position of thin-sectioned subsamples in UV-light (c) and (d). (c, d) Thin section microphotographs of part of the core in normal and UV light. Note the very weak fluorescence of the Fe-Mn-oxide rich laminae, (c) and the strongly fluorescent thick brownish-colored compact laminae (d).
Large (5 × 10 cm) thin sections (30-μm thickness) were prepared in a way to cover essentially the whole length of the half-core. They were studied by petrographic microscope (Olympus BH2) to see the fabric of the individual laminae. UV-fluorescence microscope analysis was undertaken at the Laboratories of the Geological, Geophysical and Space Science Research Group of the Hungarian Academy of Sciences with a Zeiss optical microscope equipped with a high-voltage mercury blue light-source (excitation wavelengths between 450 and 490 nm; BP) with the following filters (beam splitter: FT 510 nm and emission wavelengths from 515 nm; LP).
For X-ray powder diffraction (XRD) analyses to identify the mineralogy of the precipitate, small (ca. 5 mm) slabs were cut with a micro-saw from the core and from the most recent precipitate on the surface of the travertine buildup (the latter was taken from the pool-spar of the microterraces of the actual surface of the travertine body). The samples were ground, homogenized and analyzed with a Siemens D 5000 type diffractometer, equipped with scintillation detector. Identification of the minerals was undertaken by using the EVA software in the X-ray Laboratories of the Department of Mineralogy of Eötvös L. University, Budapest.
Trace element analyses were undertaken at the Isotope Climatology and Environmental Research Centre (ICER), Institute for Nuclear Research (Atomki), Hungarian Academy of Sciences, Debrecen, with microwave-plasma atomic-emission spectrometry, using an Agilent 4100 MP-AES instrument.
The acid-insoluble residue (recovered by (5%) acetic acid treatment of (3.5–7.8 g or ~2.5 × 1.4 to 2.4 × 0.9 cm blocks of the core) was analyzed with SEM-EDAX using the Amray 1830i scanning electron microscope of the Department of Petrology and Geochemistry of Eötvös L. University, Budapest.
14C analyses were done at HEKAL AMS Laboratory (Atomki) on 31 samples taken from the central part of the core. A 10-cm-long piece of the core sample (backward from the clearly visible layer of 1988, where the water feeding system was changed) was gradually sampled for 14C analyses with a step rate of about 0.5–1.0 cm/sample. The carbonate-powder samples were taken from the laminated travertine-core with a micro-drill. Sample preparation for accelerator mass spectrometry (AMS) analyses were conducted following standard procedures (Molnár et al. Reference Molnár, Janovics, Major, Orsovszki, Gönczi, Veres, Leonard, Castle, Lange and Wacker2013a). About 10–20 mg of carbonate sample was evacuated in a two-finger reaction ampoule while there was 2 mL of 85% H3PO4 solution in the neighboring finger. The acid was then subsequently combined with the sample to generate CO2. Dissolved inorganic carbon (DIC) of water samples (see Table 3) were prepared in a similar way in a septa-sealed simple reaction vessel. At first 10–20 mL of water sample was injected through a 0.45-μm pore size filter into the evacuated reaction vessel, and the 2 mL of 85% H3PO4 acid was injected afterwards. Acid reaction was conducted in a vacuum tight reaction vessel for at least 4 hr at 75°C temperature and the produced CO2 gas was cleaned and separated along an on-line gas handling system of HEKAL. Finally, the clean CO2 was graphitized by the sealed tube Zn-based graphitization method (Rinyu et al. Reference Rinyu, Molnár, Major, Nagy, Veres, Kimák, Wacker and Synal2013). The 14C/12C and 13C/12C ratios were measured by the EnvironMICADAS 14C AMS facility (Molnár et al. Reference Molnár, Rinyu, Veres, Seiler, Wacker and Synal2013b). Overall measurement uncertainty for a modern sample is <3‰, including normalization, background subtraction, and counting statistics. Radiocarbon results are expressed in absolute pMC units (percent Modern Carbon) (Molnár et al. Reference Molnár, Rinyu, Veres, Seiler, Wacker and Synal2013b).
RESULTS AND DISCUSSION
Morphology and Texture of the Rudas Flowstone-Like Travertine Buildup
The geometry of the flowstone-like travertine buildup partly follows the geometry of the underlying carved stone support, however, with remarkable anomalies. Interestingly, precipitation seems to be much less efficient in the central part where the downward flow of springwater is turbulent and is more voluminous on the flanks where flow is laminar or where springwater arrives only in the from of spray. On the actual surface of the buildup, rim-and-pool microstructures are abundant both on the near-horizontal part of the flanks and also on the quasi vertical, slightly concave central face. The concave central face is peculiar because of its deep red color implying Fe-oxide precipitation and concomitant development of acidity (~ferrolysis sensu Brinkman Reference Brinkman1970 or Van Breemen Reference Breemen, Stucki, Goodman and Schwertmann1988 and Loeppert Reference Loeppert, Stucki, Goodman and Schwertmann1988). This acidity also explains the suppression of carbonate precipitation in this zone and the resulted concave morphology of the central part of the build-up. The flowstone-like travertine has two large more-or-less symmetrical lobes (Figure 1d).
Diamond coring revealed that the interior of the flowstone is built up by alternating light-colored porous macrocrystalline and dark-colored, grayish dense “micritic” laminae, the frequency, thickness and regularity of which show substantial changes along the total 76.5-cm-long core. Since the two sides, representing the two lobes of the build-up, are quasi symmetrical, in the followings description, only of the left-side lobe will be given in detail. The more complete half-part section studied represents 22 cm of the whole core-length (Figure 1d). Closer scrutiny of the sections crosscutting the flanks (or side-lobes) showed that further subdivision of the lamination was possible (Figure 2a): (E) regular, fine prograding lamination with gradually increasing dip (from 30–70° away from the center), (C and D) wider and less sharply developed, more porous laminae, (A and B) varicolored, irregular to wavy laminae with a predominance of porous crystalline material. In each section, occasional subtle disconformities or “growth bands” could be detected. The boundary between section (B) and (C) is marked by an about 2-cm-thick dark-colored, strongly UV-fluorescent intercalation, different from both the underlying and the overlying laminae (Figure 2b). Based on results of lamina counting, 23 regular lamina-pairs were detected in the Section E (13–20 cm in the core.) Then 10 lamina-pairs were counted in Section D (8.7–13 cm) and 20 lamina-pairs were seen in Section C (5.5–8.7 cm), however, these latter are less sharply developed. Because of the wavy (rim-and-pool structured) laminae are not properly visible in Sections A and B, they were not counted (see Figure 2a,b).
Evaluation of the observed textural features (Figure 2a)—also considering the major technical changes documented during the history of the spa—suggested that the first, regularly prograding Section (E) should be the product of the first historical period of the spa when only natural spring water (Árpád I., Mátyás, Kinizsi, Török and Udvari Springs) entered the pool thorough the inlet (1883–1926). The (C and D) Sections characterized by thicker, more porous laminae would then be representative of a longer period, when only one particular spring (Gülbaba Spring) was used as a feeder to the pool (1926–1988). At the boundary of Sections (C) and (D), probably in the middle of the 1940s, for some period, the water of another spring (probably that of the higher temperature Juventus) was also utilized to feed the octagonal pool.
An additional change occurred between Sections (B) and (C), namely a ca. 1-cm-thick, darker colored layer. 14C-analyses of samples of the core including this particular group of layers clearly showed that the 14C-maximum (bomb-peak, see below) corresponded exactly with this dark-colored zone between Sections (C) and (B). With the position of the mid-1960s thus fixed, it was already possible to assign the textural changes of Sections (C) and (D) to those changes of the water-management which were recorded in the archives, as already discussed. Also, it became clear why the succeeding wavy lamination and the predominance of porous macrocrystals of calcite are so characteristic of the the last Sections (A and B). These probably reflect the beginnings of the formation of the actual rim-and-pool microstructures clearly seen on the surface of the buildup. It appears that the boundary between Sections (A) and (B) also reflects the change in the water-management of the Spa, where from 1988 onwards, thermal water is supplied exclusively from water-shaft GT-VI) (Figure 2a).
The regular, high-frequency “background” lamination on to which all antropogenically controlled lower-frequency variations are superimposed, are apparently of natural hydrological origin (Virág et al. Reference Virág, Mindszenty, Weidinger, Molnár, Bendő Zs, Mádl-Szőnyi and Mindszenty2013b) and will be addressed in details in another paper.
Mineralogy, Micro-Structure, Micro-Texture and Geochemistry
X-ray powder diffractograms showed that the bulk of the Rudas travertine is made up of low-Mg calcite (MgCO3 mol% 2–4). Only the most recent precipitate on its surface (the coarse-grained pool-spar of the microterraces) is high-Mg calcite with 8 mol % MgCO3. No aragonite was detected. Preliminary study of the acid-insoluble residue by SEM-EDAX showed the presence of clay (e.g. smectite, kaolinite) and fine silt-size detrital minerals (quartz, rutile) some U- and Th-bearing grains, barite, Fe-oxides with or without Ti, and few Cu, Zn-rich grains. The presence of S and Cl was also detected.
Micropetrographic studies revealed the internal structure and texture of the layers of the travertine core. The dense laminae consist of thin dark-brown colored “micritic”/microsparry material, while the porous laminae consist of coarse dendritic calcite crystals (similarly to the fabric described by Jones Reference Jones2005, Jones and Renaut Reference Jones, Renaut, Alonso-Zarza and Tanner2010 from hot-spring travertines).
UV fluorescence of the hand-specimens is correlated with the laminated structure of the travertine. As a rule, dense compact laminae proved to be more fluorescent than their porous counterparts. Red-colored, Fe-oxide-stained bands are generally dark or only very weakly fluorescent while the fluorescence of the 0.5-cm-thick brownish-colored “anomalous” couplet at the boundary of Sections B and C (at 5–5.5 cm) is very strong (Figure 2a,b).
Between 4.5 to 5.5 cm, the relatively compact dark brown-colored laminae showed the most intense fluorescence at 5–5.5 cm whereas the successive compact laminae (mostly the gray and red-colored ones) showed no fluorescence at all (Figure 2c,d).
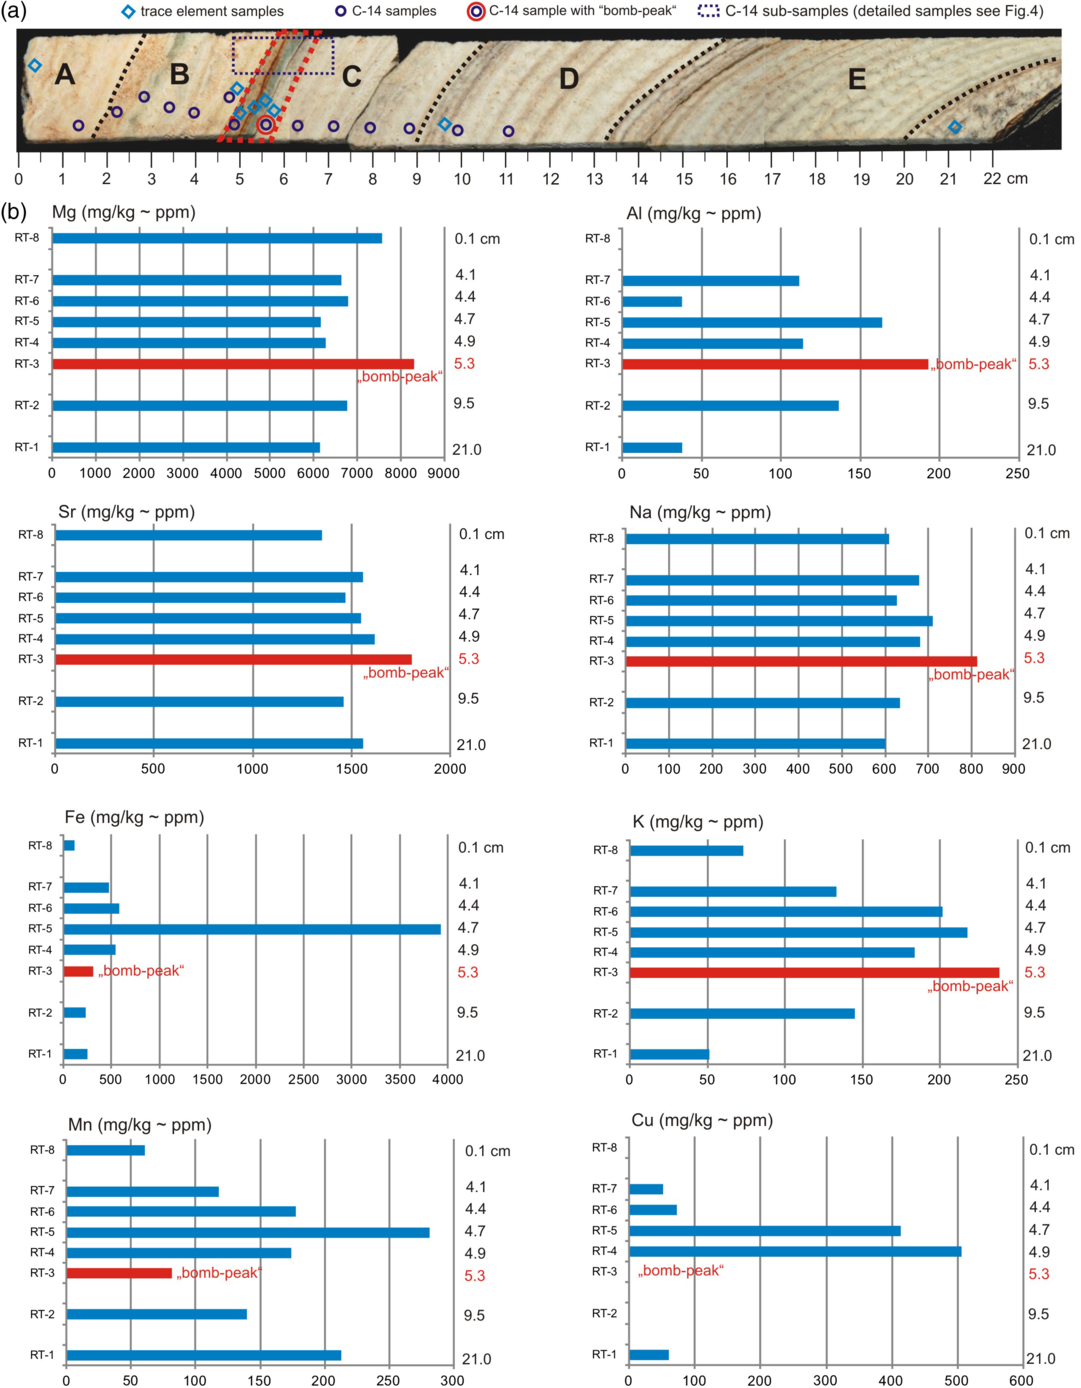
The concentration of trace elements is likewise anomalous in this particular section of the core. In the case of the sample at 5.3 cm there, is a significant enrichment in Mg, Sr, Al, Na and K. On the other hand, at 4.9 cm, 4.7 cm and 4.4 cm there is a depletion in Mg, Sr and Na, however, this is accompanied here by an enrichment in Fe and Mn (at 4.7 cm), Cu (at 4.9 cm and at 4.7 cm). At 4.7 cm, there is a slight enrichment in Al and Na when compared to sample at 4.9 cm and a very little enrichment in K when compared to that at 4.4 cm (Figure 3, Table 2). The concentration of Ba at 21.0 cm reaches 50 mg/kg (RT-1), however, in the other samples the Ba content is negligible.
Distribution of trace element concentrations along the studied half-section of the travertine-core (see also Table 2). (a) Macropetrography of the core across the left lobe of the buildup (sampling points for 14C are indicated by dark blue dots; subsamples for trace element analyses are shown by blue squares; 14C subsamples are indicated by dark blue dashed line). For the details of the subsamples, see Figure 4). (b) Mg, Sr, Fe, Mn, Al, Na, K and Cu trace elements (mg/kg or ppm) are shown by blue bars while those occurring in the “bomb-peak” section (at 5.3 cm) are marked by red bars (samples are displayed in the order of their cm distance from the “recent” end of the core, yr 2004).
Trace element contents of the Rudas travertine (samples are displayed in the order of their cm distance from the “recent” end of the core, yr 2004). Italics indicate sampling points measured also for 14C (see Table 3).
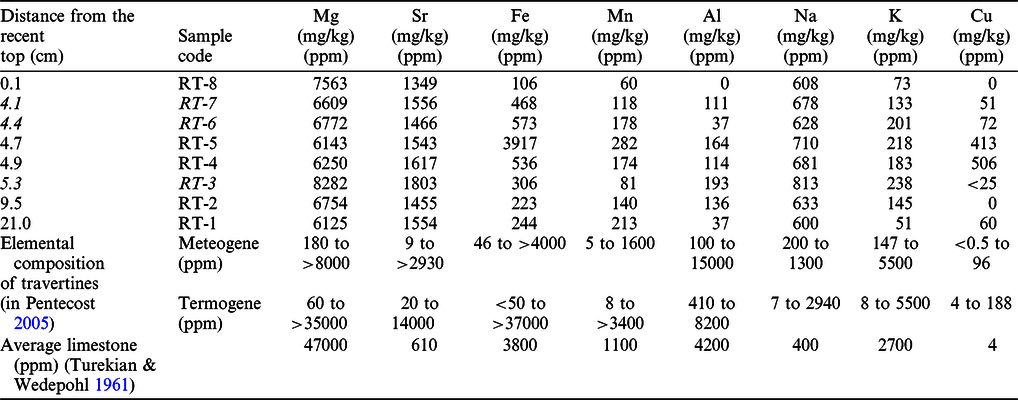
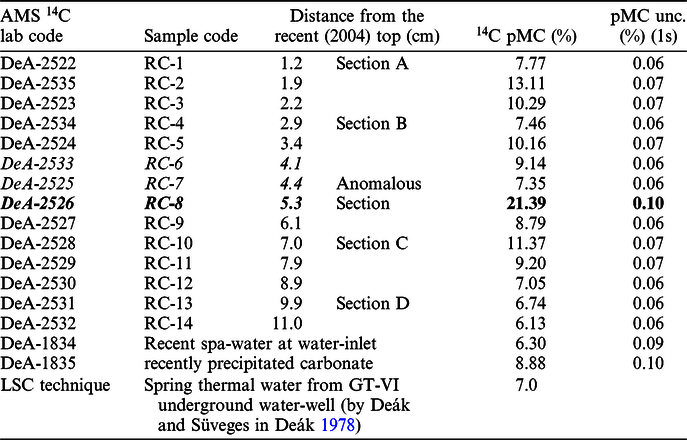
14C pMC results of the analysed samples of the Rudas drill-core, the recent thermal spring and spa-water and its recently precipitated carbonate. Italics indicate sampling points also measured for trace element analyses (see Table 2). The increased 14C values and related samples are highlighted by bold numbers.
Discussion of the Observed Mineralogical, Geochemical and Textural Features
The presence of Al, K and Fe can be related probably to the non-carbonate fraction mentioned above. Based on her studies of a large Pleistocene travertine complex at Süttő (NW of Budapest) Török (Reference Török2018) and Török et al. (Reference Török, Claes, Brogi, Liotta, Tóth, Mindszenty, Kudó, Kele, Shen and Huntington2019) suggested that the majority of such trace elements were of detrital origin and they accumulated on the travertine surface as dust at times of temporary subaerial exposure. Temporary halts of the water-supply might have also resulted in dust (aerosol)-deposition on the surface of the Rudas travertine buildup, thus enhancing the non-carbonatic contamination of the subsequently precipitating travertine layer. However, Ca, Mg, Na, Ba, S and Sr are apparently related to the carbonate fraction (cf. Pentecost Reference Pentecost2005). Likewise, Mg, Sr and Ba can be incorporated in the calcite crystal lattice for substitution of Ca (Fairchild and Treble Reference Fairchild and Treble2009), Na is known to preferentially enter the interstitial space of the crystal lattice. The relatively high concentrations of Mn and Fe probably originate from co-precipitated Mn- and Fe-oxides or hydroxides.
Similar results were pubished by Kovács-Pálffy and Földvári (Reference Kovács-Pálffy and Földvári2004) and Korpás et al. (Reference Korpás, Kovács-Pálffy, Lantos, Földvári, Kordos, Krolopp, Stüben and Berner2004) on Pleistocene travertines from the NE Transdanubian Range, among those from the Buda Castle Hill (about 600 meters from the Rudas Spa). In the insoluble residue of the travertines of the Castle Hill illite/montmorillonite (or smectite), illite, kaolinite, barite, hematite, and also some, quartz, feldspar, muscovite, and chlorite were detected.
Fluorescence of carbonates may result (or be quenched) by various trace metals substituting in the crystal lattice of carbonate minerals (e.g. McGarry and Baker Reference McGarry and Baker2000, White and Brennan Reference White and Brennan1989), or alternatively by residual organic matter preserved as inclusions in the carbonate phase (Dravis and Yurewicz Reference Dravis and Yurewicz1985, Fairchild and Baker Reference Fairchild and Baker2012). The presence of metallic ions, Fe, Mn and Pb, quenches fluorescence, but Al may either quench or increase intensity. Increased copper concentrations also decrease fluorescence. These trace element concentrations within the analyzed samples may—at least partially—explain the strong fluorescence at 5–5.5 cm followed by very weakly fluorescent gray- and red-colored, Mn, Fe and Cu enriched layers at 4.5–5 cm in the travertine-core.
However, the reason for the intensely fluorescent dark-brown micritic zone between 5.0 and 5.5 cm may rather be the presence of incorporated organic matter in the carbonate phase. In travertine-like precipitates, copious organic activity is the norm rather than the exception and its effect may be to increase fluorescence, as suggested by Arp et al. (Reference Arp, Bissett, Brinkmann, Cousin, de Beer, Friedl, Mohr, Neu, Reimer, Shiraishi, Pedley and Rogerson2010).
As already mentioned, the peculiar red color and the concave (dissolutional) morphology of the central part of the buildup are expected to have been the results of ferrolysis promoted by oxygenation and hydrolysis of dissolved Fe2+ species in the water. In this central part of the travertine buildup, not only turbulence, CO2-degassing, but also aeration/oxygenation and ferrolysis are apparently intense, the latter promoting dissolution. On-site observations suggested that microbial activity may also be involved in these processes. At times of large scale cleaning and renovation works in the Spa (as in 1966–1967), the pool was always drained and water supply temporarily suspended. After these works, the newly precipitating travertine turned generally red- and/or gray-colored (as illustrated on the 1968 photograph). These colors appear to be preserved as episodic, darker-colored laminae in the interior of the travertine buildup. A colored band is particularly apparent in the core at ~5 cm. Comparing to the other sections, this band is relatively rich in Fe3+ (3917 mg/kg) and Mn2+ (3917 mg/kg) at 4.7 cm, as well as in Cu (506 mg/kg and 413 mg/kg at 4.9 cm and 4.7 cm, respectively) (Table 2, Figure 2a, Figure 3).
Since microbiological analyses of other springs of the Gellért Hill by Borsodi et al. (Reference Borsodi, Knáb, Krett, Makk, Márialigeti, Erőss and Mádl-Szőnyi2012, Reference Borsodi, Anda, Makk, Krett, Dobosy, Büki, Erőss and Mádl-Szőnyi2018), Anda et al. (Reference Anda, Büki, Krett, Makk, Márialigeti, Erőss, Mádl-Szőnyi and Borsodi2014), Makk et al. (Reference Makk, Tóth, Anda, Pál, Schumann, Kovács, Mádl-Szőnyi, Márialigeti and Borsodi2016) and Enyedi et al. (Reference Enyedi, Anda, Borsodi, Szabó, Pál, Óvári, Márialigeti, Kovács-Bodor, Mádl-Szőnyi and Makk2019) proved the presence of various bacterial communities, the role of preserved microbial biofilms in concentrating a range of trace elements in the Rudas travertine should also be taken into consideration. The elevated natural radioactivity also is apparently connected to biofilms, since biogeochemical precipitates readily adsorb 226Ra and produce 222Rn, which although short lived might be a problem when air quality is considered (Erőss et al. Reference Erőss, Mádl-Szőnyi, Surbeck, Horváth, Goldscheider and Csoma2012; Kovács-Bodor et al. Reference Kovács-Bodor, Csondor, Erőss, Szieberth, Freiler-Nagy, Horváth, Bihari and Mádl-Szőnyi2019).
Radiocarbon Results of the Rudas Travertine
The atmospheric bomb-14C peak gave a unique possibility to identify the years of 1960s within the studied travertine core. If we can detect the incorporation of 14C in the 1960s travertine-layers that would also be an indication of the possible admixture of atmospheric/freshwater carbon to the discharging thermal water modifying the C-isotope signal of the precipitated carbonate phase.
There are several possibilities how atmospheric carbon might contaminate the carbon pool of the thermal water that arrived gravitationally from the springs to the spa via a relatively long (~400 m) and partly open brick-arched channel system up till 1988. As mentioned above, since 1988, thermal water is pumped out of the GT-VI shaft and transported by a closed pipeline under pressure first to a storage tank and from there into the pool. Up to 2004, the temperature of the spring-water was adjusted in the spa by adding colder fresh water directly from the river and later tap-water from rural pipelines that also originated from river Danube (see Table 1). Since these are both mainly of rainwater origin, it is to be expected that they would be contaminated by the bomb-peak 14C in the 1960s. Although the dominant DIC fraction in the spa water arrives directly from the thermal-water reservoir, during precipitation on the stone-carved water-inlet, there could easily be partial exchange with atmospheric CO2, especially due to the turbulent water-flow. This atmospheric contamination process could also contribute to the atmospheric 14C bomb-peak presence in the precipitated carbonate layers (cf. travertines). An atmospheric contribution was clearly detected when we measured and compared the 14C signal of recent incoming water DIC and freshly precipitated carbonate layers. The difference was about +2.6 pMC (from water DIC to the freshly precipitated carbonate), which indicates a significant atmospheric C contribution during the precipitation process.
The DIC content of the original thermal spring water, sampled directly at the source well was analysed for 14C by LSC techniques (by Deák and Süveges, in Deák Reference Deák1978). The results are also given in Table 3.
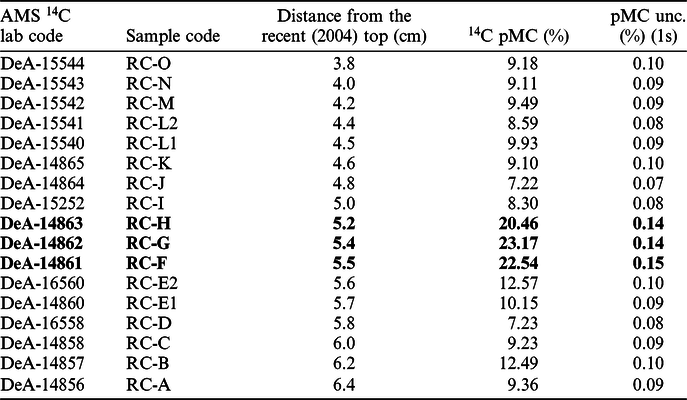
In Table 4, the average mean of the 14C activity of the investigated Rudas travertine samples was 8.8 ± 2.0 pMC (n=13). However, in the middle of the 10-cm-long analyzed core (Figure 2a,b, Figure 4) we identified a 14C increase (21.39 ± 0.10 pMC) at 5 cm which could be the signal of the atmospheric 14C bomb-peak (around AD 1963) (Figure 4, Tables 3 and 4). To get better resolved analyses around the observed 14C increase, we have resampled this location in 0.1–0.2-mm steps from 3.8 cm to 6.4 cm of the core (Table 4). The majority of the samples (n=11) shows again the average 8.9 pMC mean value, but we can still observe a peak over 20 pMC.
Higher resolution 14C analyses in the core. The increased 14C values and related samples highlighted by bold numbers.
Distribution of 14C pMC (%) along the 12-cm-long section of travertine-core (the cm-scale starts with zero at the “recent” end of the core (2004); see also Tables 3 and 4). (a) Macropetrography of the core across the 12-cm-long section from the left lobe of the buildup (sampling points for 14C are indicated by dark blue dots; 14C subsamples are indicated by red rectangles; 14C (sub-)samples taken from the zone of the “bomb-peak” are highlighted with bold. (b) Distribution of 14C pMC (%) along the full 12-cm-long studied section of travertine-core. Red dashed lines indicate the position of the detected 14C anomaly. The anomaly coincides with the marker horizon at 5.3 cm (see also Table 3). Blue dashed lines indicate the section studied in detail (RC-A to RC-O samples) from 3.8 cm to 6.4 cm of travertine-core (c). Location of the peak is highlighted by red columns and red dashed lines from 5.2 cm to 5.5 cm (see also Table 4).
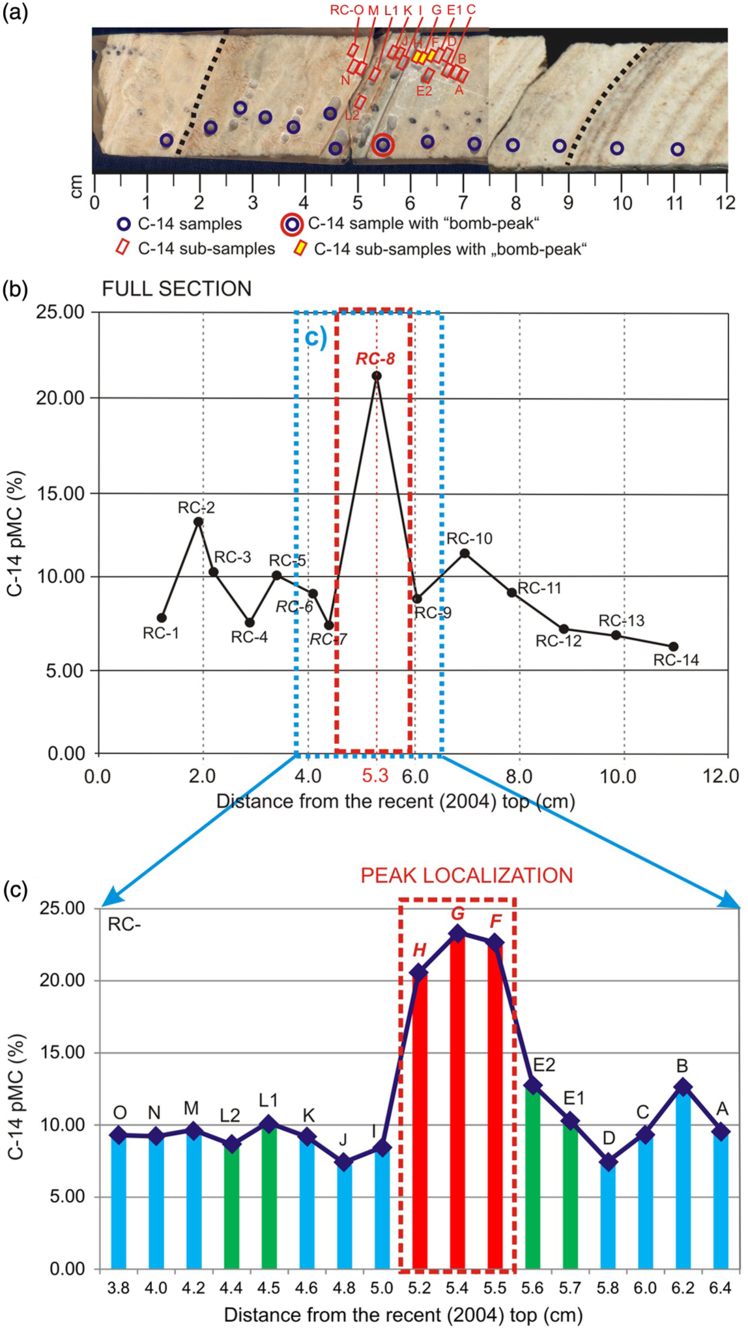
As the amplitude of this 14C peak (about 21–23 pMC) in the travertine is close to double the level of 14C in the other layers, it can be correlated with the doubling of the atmospheric 14C level during the bomb-peak (about 200 pMC in the year of 1963) (Hua and Barbetti Reference Hua and Barbetti2004; Hua et al. Reference Hua, Barbetti and Rakowski2013).
CONCLUSIONS
A flowstone-like travertine buildup precipitated on the surface of the stone-carved water-inlet of the central Turkish pool of the Rudas Spa recorded the past ca. 120 years history of natural and antropogenic processes affecting the Spa. In order to understand the details of these processes (and their imprints on the trvertine), sampling was undertaken by diamond-coring and the core was cut into half along its long axis. and analysed by the above-described petrographical and geochemical methods. Despite the fact that the Spa is fed by old (Pleistocene) thermal-waters arriving from a deep-seated reservoir, radiocarbon analyses proved to be useful in improving the dating of the core. A 14C peak (23.17 ± 0.14 pMC), which we identify as related to the radiocarbon bomb-peak, resulted from the atmospheric nuclear tests of the early 1960s was successfully identified in the travertine. This exact datum at about the middle of the core made possible to correlate observed textural changes of the travertine with archive documents of the decadal modifications in the water-management of the Spa.
ACKNOWLEDGMENTS
The research was supported by the European Union and the State of Hungary, co-financed by the European Regional Development Found in the project of GINOP-2.3.2-15-2016-00009 ‘ICER’. This study also supported by the ÚNKP-17-3 New National Excellence Program of the Ministry of Human Capacities and the OTKA 72590K to A. Mindszenty. Thanks are due to Assoc. Prof. Sz. Leél-Őssy and G. Surányi for the core-sampling, to the Budapest Thermal Waters and Spas Ltd. particularly to J. Jánosházi and A. Várallyai for the permission of sampling, and to G. Szalontai for discussions on the history of the technical management of the Spa. The authors are grateful to Assoc. Prof. J. Mádl-Szőnyi for thought-provoking discussions on the hydrogeology of the Buda Thermal Karst. Reviewers Dr. A.J. Timothy Jull’s and Irka Hajdas’s efforts to improve the manuscript are also greatly appreciated.


 Open access