

In recent decades, the Tunisian construction sector has expanded rapidly, often without sufficient consideration for energy efficiency or environmental impacts. This growth has increased significantly energy consumption and greenhouse gas emissions. Consequently, there is an urgent need for research on cost-effective, alternative materials with lower environmental impacts.
Tunisia possesses significant clay potential, such as the deposits found in the Zemlet El Beidha region in the south-west. Although it is possible to obtain binders from alkali-activated clays, known as ‘geopolymers’ (Davidovits, Reference Davidovits1991; Ounissi et al., Reference Ounissi, Mahmoudi, Valentini, Bennour, Garbin, Artioli and Montacer2020), most existing studies have focused on high-purity precursors such as metakaolin (Davidovits, Reference Davidovits2008; Autef et al., Reference Autef, Joussein, Gasgnier, Pronier, Sobrados, Sanz and Rossignol2013). However, there is a clear research gap regarding the valorization of complex, heterogeneous natural clays from specific Tunisian deposits. Although earlier research has extensively dealt with pure kaolinitic systems, this study examines the complex synergy between illite and the high concentrations of iron and calcium oxides specific to these raw Tunisian materials. This work aims to assess the feasibility of synthesizing geopolymers from two distinct illitic-kaolinitic clays: one hematite-rich (BHG2) and one calcite-rich (BHG5).
By contrasting these local resources with standard benchmarks, this research clarifies how their specific mineralogical composition and thermal activation (550°C, 750°C and 950°C) influence the formation of a consolidated binder. These eco-materials are refractory, inorganic polymers formed from both aluminium and silicon sources containing AlO45– and SiO44– tetrahedral units under highly alkaline conditions (NaOH, KOH, CsOH) at ambient temperature to obtain an amorphous three-dimensional network (Davidovits, Reference Davidovits2002, Reference Davidovits2008). The final product is directly dependent on two main factors: the source of the aluminosilicate and the nature of the activator.
The synthesis of geopolymeric materials relies on various aluminosilicate sources. Although pure metakaolin is widely used (Davidovits, Reference Davidovits2008; Autef et al., Reference Autef, Joussein, Gasgnier, Pronier, Sobrados, Sanz and Rossignol2013), other more abundant materials, such as natural clays (Barone et al., Reference Barone, Caggiani, Coccato, Finocchiaro, Fugazzotto and Lanzafame2020; Vasic et al., Reference Vasic, Terzic, Radovanovic, Radojevic and Warr2022; Zibret et al., Reference Zibret, Wisniewski, Horvat, Bozic, Gregorc and Ducman2023) and certain industrial wastes, are also viable options. Furthermore, several studies have focused on the thermal activation of illitic-kaolinitic clays at temperatures ranging from 550°C to 950°C to produce geopolymers (Essaidi et al., Reference Essaidi, Samet, Baklouti and Rossignol2014a; Louati et al., Reference Louati, Baklouti and Samet2016; Ben Messaoud et al., Reference Ben Messaoud, Hamdi and Srasra2018a, Reference Ben Messaoud, Hamdi and Srasra2018b; Hamdi et al., Reference Hamdi, Ben Messaoud and Srasra2019; Ounissi et al., Reference Ounissi, Mahmoudi, Valentini, Bennour, Garbin, Artioli and Montacer2020; Derouiche et al., Reference Derouiche, Zribi and Baklouti2023; Luzu et al., Reference Luzu, Duc, Djerbi and Gautron2024; Zerzouri et al., Reference Zerzouri, Hamzaoui, Ziyani, Yahia and Alehyen2025). However, these aluminosilicate sources often contain associated minerals such as quartz, hematite, calcite and dolomite. If these impurities are reactive in alkaline media, they can induce side reactions concurrent with the geopolymerization process (Autef et al., Reference Autef, Joussein, Gasgnier, Pronier, Sobrados, Sanz and Rossignol2013), forming multiple networks. Conversely, if the impurities are inert within the alkaline medium, they act as mineral reinforcements in the geopolymer matrix (Essaidi et al., Reference Essaidi, Samet, Baklouti and Rossignol2014b; Ben Messaoud et al., Reference Ben Messaoud, Hamdi and Srasra2018b). Such contaminants are Ca-bearing compounds, frequently occurring as calcite (CaCO3) or dolomite (CaMg(CO3)2). Depending on its crystalline form, calcium may either react in alkaline media, as with CaO and Ca(OH)2, or remain inert, as in the case of CaCO3. Thermal activation of carbonate clays may result in the decomposition of these minerals, yielding reactive calcium (Gharzouni et al., Reference Gharzouni, Dupuy, Sobrados, Joussein, Texier-Mandoki, Bourbon and Rossignol2017; Karunadasa et al., Reference Karunadasa, Manoratne, Pitawala and Rajapakse2019; Yamchelou et al., Reference Yamchelou, Law, Patnaikuni and Li2020).
The alkaline activator is a critical component in the geopolymerization process; depending on its quantity and concentration, it promotes the initial reaction stage and determines the final structure of the cured material (Duxson et al., Reference Duxson, Mallicoat, Lukey, Kriven and van Deventer2007). The most commonly used activators are hydroxides or alkaline salts, specifically sodium hydroxide (NaOH) and potassium hydroxide (KOH). Theoretically, a KOH solution would provide greater dissolution due to its higher alkalinity (Duxson et al., Reference Duxson, Provis, Lukey, Mallicoat, Kriven and Van Deventer2005). However, in practice, NaOH exhibits a greater capacity to release silicate and aluminate monomers (Sumajouw & Rangan, Reference Sumajouw and Rangan2006). The quantity of dissolved units depends on the type and concentration of alkali-activating solution, the temperature and the amorphous nature of the aluminosilicate source (Van Riessen & Chen-Tan, Reference Van Riessen and Chen-Tan2013). The clays used in this study originate from the Lower Cretaceous or Bouhedma Formation of the Zemlet El Beidha region (Gabes Governorate, Tunisia). This formation consists of alternating red and green clays, which are slightly gypsiferous in the upper part of the deposit (Boussen et al., Reference Boussen, Sghaier, Chaabani, Jamoussi and Bennour2016). In particular, illitic-kaolinitic clays have shown promising properties for building ceramics (Escalera et al., Reference Escalera, Tegman, Antti and Odén2014; Mahmoudi et al., Reference Mahmoudi, Bennour, Meguebli, Srasra and Zargouni2016). Therefore, this type of clay warrants investigation as an aluminosilicate source for the synthesis of consolidated materials at low temperatures.
With a view towards sustainable regional development, this study aims to identify clays that night potentially be used to synthesize a geopolymeric binder. The synthesized solid products were characterized by X-ray diffraction (XRD), Fourier-transform infrared (FTIR) spectroscopy and scanning electron microscopy (SEM), as well as with compressive strength tests.
Materials and methods
Raw materials
Six Tunisian clay samples were collected from the Zemlet El Beidha site in the Gabes region to be used as aluminosilicate sources for the synthesis of alkali-activated materials. These samples, labelled BHG1 to BHG6, were extracted sequentially from the base to the top of the Bouhedma Formation. This formation, which constitutes the core of the Zemlet El Beidha anticline, consists of alternating red and green clay layers that become slightly gypsiferous towards the top. Specifically, samples BHG1 through BHG3 correspond to the red clays, while samples BHG4 through BHG6 correspond to the green clays. The clay samples were dried at 80°C until a constant weight was achieved, then they were crushed and sieved to a particle size of <200 µm. Representative samples BHG2 and BHG5 were selected for calcination at three different temperatures (550°C, 750°C and 950°C) for 4 h. These temperatures were selected based on prior thermogravimetric analysis (TGA)/differential thermal analysis (DTA) of the raw clay. Following thermal treatment, the calcined powders were sieved to a particle size of <200 µm to eliminate any agglomerates and to ensure particle fineness. Hereafter, the untreated clays are labelled BHG125, BHG225, BHG325, BHG425, BHG525 and BHG625, whereas the thermally treated samples are designated BHG2θ and BHG5θ, where θ represents the specific calcination temperature (e.g. BHG2550 denotes the BHG2 clay calcined at 550°C).
The alkali-activated clays yielded consolidated materials designated as NaOHGBHG2θ and NaOHGBHG5θ, where G refers to the geopolymeric state, BHG2 and BHG5 correspond to the source clays and θ denotes the calcination temperature. The superscript prefix NaOH represents the molar concentration of the sodium hydroxide solution (10, 12 or 14 M). For instance, the sample labelled 10GBHG2750 identifies a geopolymer synthesized from red clay BHG2 calcined at 750°C using a 10 M NaOH activator solution. This solution was prepared 24 h prior to use by dissolving NaOH pellets (96% purity) in distilled water to achieve the required molarity.
Sample preparation
Sample synthesis was carried out in two stages. In the first stage, alkaline-activating solutions with molarities of 10, 12 and 14 M were prepared by dissolving NaOH pellets in distilled water. The solutions were allowed to cool to ambient temperature prior to use. In the second stage, the aluminosilicate precursor (either raw or calcined clay) was gradually incorporated into the alkaline activator. A liquid-to-solid (L/S) mass ratio of 0.7 was maintained to ensure adequate workability of the resulting paste. The mixture was manually homogenized for 3–5 min until a uniform paste was obtained. The fresh paste was immediately cast into closed polystyrene moulds and manually vibrated to minimize entrapped air voids. The specimens were cured at 60°C for 24 h, following the synthesis parameters adapted from Autef et al. (Reference Autef, Joussein, Gasgnier, Pronier, Sobrados, Sanz and Rossignol2013). After curing, the samples remained in their moulds at room temperature for an additional 48 h before demoulding. Finally, the specimens were stored under laboratory conditions for 28 days prior to characterization and compressive strength testing, in accordance with the protocols described by Hamdi et al. (Reference Hamdi, Ben Messaoud and Srasra2019).
Characterization techniques
The chemical composition of the raw clays was determined by X-ray fluorescence (XRF) using an X-MET 5100 (Oxford Instruments) spectrometer. The samples were prepared as pressed pellets and measured with a fixed runtime of 180 s. The results were validated by comparison with certified standards. The loss on ignition (LOI) was determined from the weight difference between samples heated at 100°C and 1000°C for 2 h.
The particle-size distributions of untreated and calcined clays were determined by laser diffraction using a Malvern Mastersizer 3000 equipped with a Hydro S wet dispersion unit. Samples were dispersed in water containing sodium hexametaphosphate as a deflocculant. Measurements were performed within a range of 0.05–880 µm, maintaining an obscuration of 5–10% to prevent particle agglomeration. The specific surface area (SSA) was determined using two complementary methods to account for both textural porosity and clay swelling. External SSA and porosity were measured by N2 adsorption at 77.3 K (Brunauer–Emmett–Teller (BET) method) using a Micromeritics Gemini 2380 instrument, following degassing at 110°C. Total SSA (internal and external) was evaluated via the methylene blue (MB) adsorption method (NF P 94-068, 1998). A 10 g 100 mL–1 clay-to-water suspension was titrated with a 10 g L–1 MB solution, using the spot test on filter paper method to determine the adsorption capacity.
Elemental composition was determined using a Thermo Scientific FlashSmart analyser via high-temperature combustion (950–1800°C) in an oxygen-rich environment. Ground samples (1–2 mg) were placed in tin capsules with vanadium pentoxide (V2O5) as a combustion catalyst. The resulting gases were separated by gas chromatography and quantified using a thermal conductivity detector. System calibration was validated using certified methionine and cystine standards.
The mineralogical composition of the samples was identified by XRD with a Brucker AXS D8 Advance Diffractometer using a Cu-Kα radiation source (λ = 0.154186 Å). The patterns were recorded over a 5–60°2θ range with a step size of 0.02° and a scan speed of 2° min–1.
To monitor the structural changes during geopolymerization, FTIR spectra were recorded between 500 and 4000 cm–1 with a resolution of 4 cm–1. Two different sampling techniques were employed: attenuated total reflectance (ATR) mode for the raw clays and the KBr pellet method for the geopolymer samples after 28 days of curing. Measurements were conducted using a Frontier Nicolet 380 spectrometer. All resulting spectra were baseline-corrected and normalized using the OMNIC software package.
The cation-exchange capacity (CEC) was determined using the copper-ethylenediamine (Cu- EDA) method. Briefly, 1 g of clay was dispersed in 8 mL of 0.05 M Cu-EDA and diluted to 20 mL. After 1 h of agitation and centrifugation, 15 mL of the supernatant was treated with 5 mL of 0.5 M HCl and 2 g of KI. The liberated iodine (I2) was titrated against 0.05 M Na2S2O3 until decolourization. The results are expressed in meq 100 g–1. The plastic behaviour of the clay samples was characterized by determining the Atterberg limits using the Casagrande method (LCPC, 1987; Nagendra et al., Reference Nagendra, Ganesh, Hema, Samarth Urs, Prakash Narasimha and Suresh Kumar2022). These tests were performed on the <400 µm fraction. The liquid limit (LL) and plastic limit (PL) were determined according to NF P 94-052-1 and NF P94-051 standards, respectively (AFNOR, 1995).
Simultaneous TGA/DTA was performed using a Netzsch STA 429 analyser (Selb, Germany). Samples were heated in a platinum (Pt) crucible from ambient temperature to 1400°C at a constant rate of 10°C min–1 under a continuous flow of dry air. Compressive strength was determined using a Lloyd Instruments EZ20 tester at a crosshead speed of 0.1 mm min–1 on cylindrical geopolymer specimens (26 mm in diameter and 40 mm in height). Before testing, specimens were dry-polished to ensure they had flat and parallel surfaces.
Microstructural and compositional characterization of the geopolymer matrices was conducted using environmental SEM (Quanta 200, FEI Company) operating under high vacuum, coupled with an energy-dispersive x-ray spectroscopy (EDS) system.
Results and discussion
Physicochemical and structural characterization of the raw clays
Six clay samples, designated as BHG1 through BHG6, were characterized to evaluate their suitability as aluminosilicate precursors for geopolymerization.
The particle-size distribution (Table 1) showed three distinct size fractions: clay (<2 µm, 14–46%), silt (2–20 µm, 52–80%) and coarser particles (>20 µm, 0.6–12%). Although all raw materials were ground to under 200 µm, the fraction exceeding 20 µm corresponding to fine silt or very fine sand remained well below the maximum grinding limit. Among the investigated samples, BHG2 exhibited the highest silt content (80%). This specific granulometry is known to promote denser particle packing and to increase reactivity during the geopolymerization process, which is consistent with previous observations in kaolinitic-illitic systems (Allahverdi & Kani, Reference Allahverdi and Kani2009; Cong et al., Reference Cong, Bing and Longzhu2016; Merabtene et al., Reference Merabtene, Kacimi and Clastres2019).
Physical and geotechnical properties of the raw clay samples.

Table 1 Long description
The table presents the granulometry, physical tests, and plasticity of various raw clay samples. Sample BHG6 exhibits the highest plasticity index at 36, indicating significant plasticity compared to others. Granulometry varies, with BHG4 and BHG5 having the highest proportion of particles smaller than 2 micrometers. pH levels range from 6.6 to 8.8, with BHG4 showing the highest pH. Specific surface area and BET specific surface area also vary, with BHG4 having the highest BET specific surface area. These variations suggest differences in clay composition and potential applications. The data should be interpreted considering the measurement uncertainties indicated for granulometry and plasticity.
PI = plasticity index; SBET = BET specific surface area.
The SSA, determined by MB adsorption and BET methods (Mahmoudi et al., Reference Mahmoudi, Bennour, Meguebli, Srasra and Zargouni2016; Michot, 2018), ranged from 146 m2 g–1 (BHG5) to 199 m2 g–1 (BHG2; Table 1). Illite was the predominant mineral phase across all samples. The observed variations in SSA for sample BHG2 are consistent with values reported in the literature for illite-rich (Cong et al., Reference Cong, Bing and Longzhu2016; Rahier et al., 2018) and non-expansive clays. This property is controlled by a finer particle-size distribution and a higher proportion of silt-sized particles (2–20 µm), which contribute to an increased external surface area.
Furthermore, the BET surface area varied between 28.7 m2 g–1 (BHG1) and 74 m2 g–1 (BHG6). The higher BET values observed for the green clays (BHG4–BHG6) are probably associated with the synergistic effects of their textural properties and carbonate contents rather than mineralogy alone. The CEC values ranged from 22 to 29 meq 100 g–1 (Table 1), which is in good agreement with the established literature for illite-dominated clays (typically 20–35 meq 100 g–1; Allahverdi & Kani, Reference Allahverdi and Kani2009; Merabtene et al., Reference Merabtene, Kacimi and Clastres2019; Lahoti et al., 2020). The relatively narrow range of CEC values across all samples reflects the mineralogical predominance of illite. However, the slightly higher CEC observed in samples with a more significant <2 µm fraction (BHG4–BHG6) is attributed to their higher SSA rather than a shift in mineralogical species. Regarding the chemical environment, the green clays (BHG4–BHG6) exhibited alkaline pH values ranging from 8.5 to 8.8, attributed to the abundance of calcite. In contrast, the red clays (BHG1–BHG3) showed near-neutral pH values between 6.6 and 7.8.
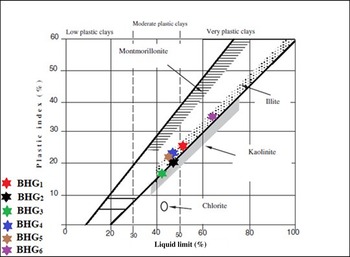
Plasticity index (PI) values range from 17% to 36%, and LL values range from 42% to 64% (Table 1), indicating moderate plasticity. These samples fall within the illitic domain, as illustrated in the Holtz & Kovacs (Reference Holtz and Kovacs1981) diagram (Fig. 1). Sample BHG6 displayed the highest PI (36%), which correlates with its greater clay fraction (46%). The plasticity of these deposits is closely governed by their mineralogical composition, where an increase in illite content leads to higher plasticity (Fig. 1), which is in good agreement with Ben M’barek-Jemaï et al. (Reference Ben M’barek-Jemaï, Sdiri, Ben Saad, Boughalmi, Ouerghi, Themri and Chalouati2025). Furthermore, this classification confirms the absence of highly expansive smectitic clays, thereby supporting the suitability of these materials for geopolymer synthesis.
Projection of the studied clay samples on the Holtz and Kovacs diagram (adapted from Holtz & Kovacs, Reference Holtz and Kovacs1981).

Figure 1 Long description
The graph shows the plasticity index on the y-axis, labeled as percentage and the liquid limit on the x-axis, also labeled as percentage. It plots six clay samples, labeled BHG1 to BHG6, each marked with a distinct symbol and color. The samples are positioned within different regions indicating clay types: low plastic clays, moderate plastic clays and very plastic clays. The graph includes labeled zones for montmorillonite, illite, kaolinite and chlorite, showing the classification of the samples based on their plasticity and liquid limit values.
The chemical composition (Table 2) shows significant SiO2 concentrations (36–57 wt.%), primarily attributed to free quartz and, to a lesser extent, 2:1 clay minerals (Coulibaly et al., Reference Coulibaly, Guillaume Pohan, Kambiré, Kouakou, Goure-Doubi, Diabaté and Ouattara2020). The Al2O3 contents vary between 14 and 17 wt.%, resulting in SiO2/Al2O3 ratios exceeding 2. This high ratio stems from the abundance of free SiO2, which is characteristic of the detrital input in this depositional environment (Ben M’barek-Jemaï et al., Reference Ben M’barek-Jemaï, Sdiri, Ben Saad, Boughalmi, Ouerghi, Themri and Chalouati2025). Furthermore, red clays are characterized by elevated Fe2O3 levels (7.03–12.33 wt.%) due to hematite, whereas green clays exhibit high CaO contents (10.42–23.35 wt.%) associated with calcite. The LOI at 1000°C (11.96–15.55 wt.%) reflects the combined effects of clay mineral dehydroxylation, carbonate decomposition and organic matter combustion (El Boukili et al., Reference El Boukili, Lechheb, Ouakarrouch, Dekayir, Kifani-Sahban and Khaldoun2021), as supported by the exothermic signals in the differential scanning calorimetry (DSC) curves. Total carbon analysis reveals that samples BHG425, BHG525 and BHG625 have the highest carbon contents, with BHG525 exhibiting the maximum value. These results correlate with XRF data (Table 2), confirming a high carbonate abundance, which accounts for the elevated pH values observed (8.5–8.8; Table 1).
Chemical composition of the raw clays obtained by XRF (±0.01 wt.%).
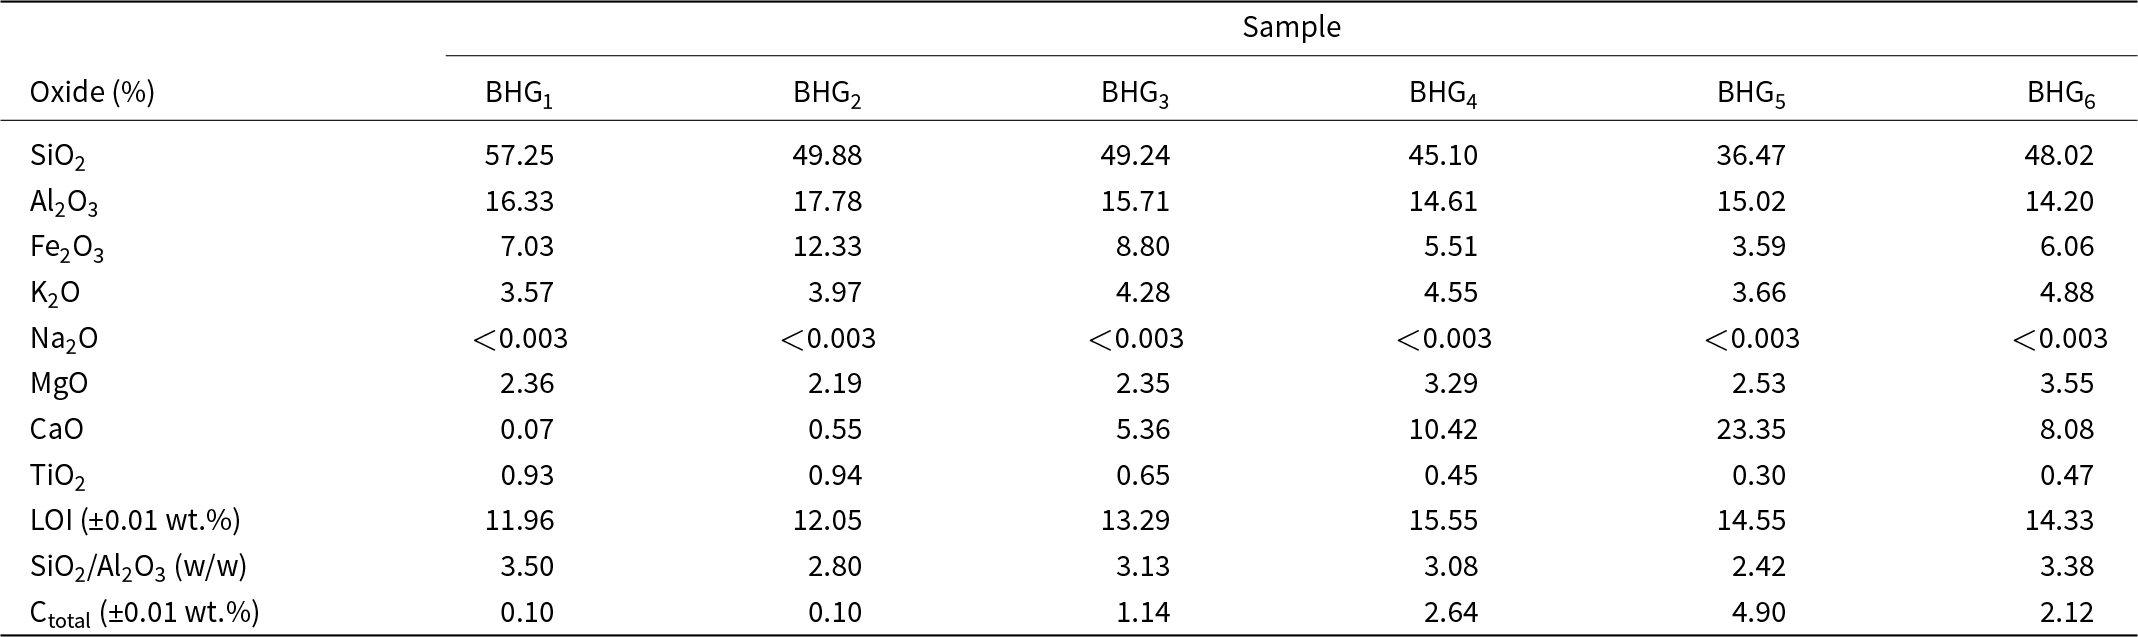
Table 2 Long description
The table presents the chemical composition of six raw clay samples, focusing on oxide percentages and other key metrics. BHG5 stands out with the highest calcium oxide content at 23.35%, while sodium oxide is consistently below 0.003% in all samples, suggesting negligible presence. Silicon dioxide and aluminum oxide are major components, with BHG1 having the highest silicon dioxide at 57.25%. Loss on ignition varies, with BHG4 showing the highest at 15.55%. The ratio of silicon dioxide to aluminum oxide is highest in BHG1 and lowest in BHG5, indicating differences in mineral structure. Carbon content is notably higher in BHG3, BHG4, and BHG5, which may affect the clay's properties. These variations highlight the diverse chemical profiles of the clay samples.
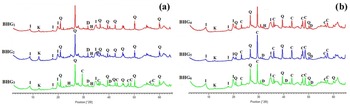
The XRD traces (Fig. 2) and FTIR spectra (Fig. 3) identified illite (International Centre for Diffraction Data (ICDD) reference trace: 00-002-0462) as the dominant phase, ranging from 61 to 96 wt.%. Kaolinite (04-013-2830) was a secondary component (4–39 wt.%; Table 3). Additionally, minor phases of quartz (04-012-0490), hematite (04-008-8479), calcite (01-089-5862) and dolomite (01-075-1766) were detected. Kaolinite was identified by its diagnostic FTIR bands, including the Al–OH bending doublets at 909 and 911 cm–1, the Al–OH stretching vibration at 3698 cm–1 and Si–O vibrations near 798 cm–1, in agreement with previously published data (Zhang et al., Reference Zhang, Wang and Provis2012; Dehmani et al., Reference Dehmani, Bentahar, Lgaz, El-Kordy, Aldalbahi and Alrashdi2026). Illite was identified by the band at 3620 cm–1 (Hajjaji, Reference Hajjaji2014; D’Elia et al., Reference D’Elia, Pinto, Eramo, Giannossa, Ventruti and Laviano2018; Luzu et al., Reference Luzu, Duc, Djerbi and Gautron2024). Additionally, all samples exhibited a broad absorption band between 975 and 997 cm–1, attributed to Si–O stretching vibrations in the silicates. Other detected features included the quartz doublet (Mezni et al., Reference Mezni, Hamzaoui, Hamdi and Srasra2011) at 797–800 cm–1 and a band at 1620 cm–1 corresponding to the H–O–H scissor bending vibrations of adsorbed water (Dehmani et al., Reference Dehmani, Bentahar, Lgaz, El-Kordy, Aldalbahi and Alrashdi2026).
XRD traces of (a) red and (b) green clay samples. C = calcite; D = dolomite; H = hematite; I = illite; K = kaolinite; Q = quartz.

Figure 2 Long description
The image shows XRD traces of clay samples labeled as BHG1, BHG2, BHG3 and BHG4. In section (a), the traces are in red, blue and green, while in section (b), they are in red and green. The x-axis is labeled 'Position (2θ)' and the y-axis is not labeled. Peaks are marked with letters indicating mineral phases: C for calcite, D for dolomite, H for hematite, I for illite, K for kaolinite and Q for quartz. Each sample shows different peak patterns, indicating the presence of these minerals in varying amounts across the samples.
Mineralogical composition (±3 wt.%) of the raw clay samples.

Table 3 Long description
The table measures the mineralogical composition of raw clay samples, focusing on phyllosilicate, quartz, calcite, dolomite, hematite, and particle size fractions. Sample BHG6 has the highest phyllosilicate content at 74%, while BHG5 has the highest calcite content at 55%. Quartz content is highest in BHG2 at 43%. Dolomite is present in BHG2 and BHG5, with BHG5 having a slightly higher percentage. Hematite is found in BHG1, BHG2, and BHG3, with a maximum of 3% in BHG2. The fraction of particles smaller than 2 micrometers is highest in BHG6 at 96%. The data shows significant variation in mineral composition across samples, indicating diverse geological characteristics.
ATR-FTIR spectra of (a) red and (b) green raw clay samples.

Figure 3 Long description
The image shows two ATR-FTIR spectra of raw clay samples. In the first spectrum (a), the wavenumber peaks for samples BHG1, BHG2 and BHG3 are displayed. Notable peaks include 3695, 3620, 1445, 911 and 798 per centimeter. The second spectrum (b) shows samples BHG4, BHG5 and BHG6 with peaks at 3698, 3629, 1635, 911 and 798 per centimeter. Each spectrum highlights specific absorption bands corresponding to different clay components.
For the carbonate-rich samples (BHG425, BHG525 and BHG625), the spectra retained the signatures of kaolinite and quartz but exhibited additional bands at 1798, 1432 and 730 cm–1, indicative of dolomite (Ji et al., Reference Ji, Ge, Balsam, Damuth and Chen2009; Ionescu et al., Reference Ionescu, Simon, Hoeck and Gál2025). Furthermore, bands at 873 and 711 cm–1 confirmed the presence of calcite (Reig et al., Reference Reig, Adelantado and Moreno2002; Ionescu et al., Reference Ionescu, Simon, Hoeck and Gál2025). Notably, the higher intensity of the 1432 cm–1 carbonate band in sample BHG525 reflects a greater calcium content relative to BHG425 and BHG625, which is in excellent agreement with the XRF results (Table 2).
Thermal analysis of raw clays: (a) BHG125, (b) BHG225, (c) BHG325, (d) BHG425, (e) BHG525 and (f) BHG625. The horizental green lines denote the baselines used to determine the mass loss steps for each thermal event. TG = thermogravimetry.

Figure 4 Long description
The image contains six graphs labeled (a) to (f), each showing thermal analysis data for raw clays. Each graph displays two curves: thermogravimetry (TG) on the left y-axis in percentage and differential scanning calorimetry (DSC) on the right y-axis in watts per gram. The x-axis represents temperature in degrees Celsius, ranging from 0 to 1400. Graph (a) shows a TG curve with a mass loss of 5.6 percent and a DSC peak. Graph (b) indicates a mass loss of 6 percent with a DSC peak. Graph (c) shows a mass loss of 7.4 percent with a DSC peak. Graph (d) displays a mass loss of 4.1 percent with a DSC peak. Graph (e) shows a mass loss of 6.5 percent with a DSC peak. Graph (f) indicates a mass loss of 12.9 percent with a DSC peak. Each graph includes horizontal lines denoting baselines for mass loss steps. The graphs illustrate the thermal behavior of different clay samples under increasing temperatures.
The thermal behaviour of the raw clays was investigated using simultaneous TGA/DTA analysis up to 1400°C (Fig. 4). All samples exhibited a first common endothermic peak at 90–115°C (e.g. 115°C in BHG125; Fig. 4a), corresponding to the release of physically adsorbed water and weakly bound interparticle/interlayer water associated with clay mineral surfaces (D’Elia et al., Reference D’Elia, Pinto, Eramo, Giannossa, Ventruti and Laviano2018). A second major endothermic effect occurred between 450°C and 600°C (e.g. 548°C in BHG225; Fig. 4b). This thermal event is mainly related to the dehydroxylation of illite, which occurs over a broad temperature range. A minor contribution from kaolinite dehydroxylation (Ilić et al., Reference Ilić, Mitrović and Miličić2010; Elimbi et al., Reference Elimbi, Tchakoute and Njopwouo2011; Polcowñuk Iriarte et al., Reference Polcowñuk Iriarte, Mocciaro, Rendtorff and Richard2025), typically observed between 450°C and 550°C, cannot be excluded where kaolinite is present as a secondary phase. This interpretation is consistent with the predominance of illite identified by XRD and with recent thermal studies of clay minerals (Do Nascimento & Schaefer, 2021). Distinct thermal behaviours were observed among the samples. Sample BHG225 (Fig. 4b) showed an additional endothermic peak at 300°C, assigned to goethite dehydroxylation (FeOOH → Fe2O3 + H2O) (Foldvari, Reference Foldvari2011), consistent with its elevated Fe2O3 content (12.33 wt.%; Table 2). In contrast, BHG425, BHG525 and BHG625 (Fig. 4d–f) displayed pronounced endothermic effects at ∼750°C, confirming calcite decomposition (Sdiri et al., Reference Sdiri, Higashi, Hatta, Jamoussi and Tase2010; Pulidori et al., Reference Pulidori, Lluveras-Tenorio, Carosi, Bernazzani, Duce and Pagnotta2022; Rat et al., Reference Rat, Martínez-Martínez, Sánchez-Garrido, Pérez-Villarejo, Garzón and Sánchez-Soto2022), in agreement with their high CaO contents (10.42–23.35 wt.%; Table 2) and proportions of calcite (17–55 wt.%; Table 3). A minor endothermic peak at 573°C without associated mass loss corresponds to the α- to β-quartz transition (El Boukili et al., Reference El Boukili, Lechheb, Ouakarrouch, Dekayir, Kifani-Sahban and Khaldoun2021), reflecting the ubiquitous presence of quartz in all samples. Interestingly, the characteristic exothermic peak near 950°C related to the metakaolinite-to-mullite transformation was conspicuously absent from BHG625. This is probably due to its low kaolinite content (4 wt.%; Table 3) and the inhibitory effects of impurities such as iron oxides (Fe2O3: 6.06 wt.%; Table 2) and calcium carbonate (Chalouati el al., 2021; Derouiche et al., Reference Derouiche, Zribi and Baklouti2023).
Above 1000°C, the DTA curves showed an endothermic trend peaking at ∼1200°C. Although the formation of primary mullite occurs at lower temperatures (∼ 980°C), this high-temperature endothermic event is probably associated with the formation of a liquid phase (eutectic melting) and the potential growth of secondary mullite within the melt. In sample BHG5, the presence of CaO (from calcite decarbonation) acted as an effective flux, lowering the melting point of the Si–Al system and promoting the development of a vitreous phase. This interpretation is consistent with recent studies on the firing behaviour of calcareous illitic clays (Chalouati et al., 2021; Martínez-Martínez et al., Reference Martínez-Martínez, Pérez-Villarejo, Garzón and Sánchez-Soto2023; Ionescu et al., Reference Ionescu, Simon, Hoeck and Gál2025), where the interaction between CaO and the aluminosilicate matrix induces partial melting in the 1150–1250°C range. These thermal results corroborated the mineralogical interpretations obtained from XRD and XRF analyses and guided the selection of calcination temperatures of 550°C, 750°C and 950°C.
Based on their kaolinite content (BHG225: 39%; BHG525: 21%) and thermal reactivity, samples BHG225 (hematite-rich) and BHG525 (calcite-rich) were selected for calcination. The selected temperatures corresponded to specific thermal events: kaolinite dehydroxylation at 550°C (Zhang et al., Reference Zhang, Wang, Wang, Li, Wang and Li2022), carbonate decomposition at 750°C (D’Elia et al., Reference D’Elia, Pinto, Eramo, Giannossa, Ventruti and Laviano2018; Rat et al., Reference Rat, Martínez-Martínez, Sánchez-Garrido, Pérez-Villarejo, Garzón and Sánchez-Soto2022) and illite dehydroxylation at 950°C (Csáki et al., Reference Csáki, Sunitrová, Lukáč, Łagód and Trník2022).
Effects of thermal treatment on the selected clays
The calcination process induced progressive particle agglomeration, with significant coarsening observed above 550°C (Chandrasekhar & Ramaswamy, Reference Chandrasekhar and Ramaswamy2002; Konan et al., Reference Konan, Sei, Soro, Oyetola, Gaillard, Bonnet and Kra2006; Hedfi et al., Reference Hedfi, Hamdi, Srasra and Rodríguez2014). This effect was particularly pronounced in BHG5, which showed a nearly complete disappearance of its fine fraction (<2 µm) at 950°C (see Table 4), as sintering processes became dominant (Derouiche et al., Reference Derouiche, Zribi and Baklouti2023). Thermal treatment caused a marked reduction in SSA with increasing temperature, demonstrated by the decrease from 199 to 5 m2 g–1 for BHG2 and from 146 to 6 m2 g–1 for BHG5. These changes reflect a denser particle packing and microstructural consolidation through sintering (Hollanders et al., Reference Hollanders, Adriaens, Skibsted, Cizer and Elsen2016).
Particle-size distributions (±1 wt.%), MB SSA and BET specific surface area (SBET) of BHG225 and BHG525 at various calcination temperatures.

Table 4 Long description
The table compares particle-size distributions and specific surface areas of BHG225 and BHG525 at different calcination temperatures. As temperature increases from 25°C to 950°C, both materials show a decrease in particles smaller than 2 micrometers and specific surface areas. BHG225 starts with 14% of particles under 2 micrometers at 25°C, dropping to 0.4% at 950°C, while BHG525 starts with 44% at 25°C, dropping to 0% at 950°C. The specific surface area of BHG225 decreases from 199 to 5 square meters per gram, and BHG525 decreases from 146 to 6 square meters per gram. Larger particles, over 20 micrometers, increase with temperature, indicating particle growth. BHG525 generally has higher initial values for smaller particles and surface area compared to BHG225.
XRD traces (Fig. 5a,b) confirmed kaolinite dehydroxylation at 550°C via the collapse of the 7.15 Å peak, resulting in the formation of poorly crystalline metakaolin (Fabbri et al., Reference Fabbri, Gualtieri and Leonardi2013). Simultaneously, dolomite decomposition released reactive CaO/MgO (Cheng & Specht, 2006). Although illite reflections persist at this temperature, the mineral undergoes dehydroxylation to form meta-illite, a process typically initiating at ∼500°C. By 750°C, the complete decarbonation of calcite in BHG5 significantly enhanced the amorphous halo (15–40°2θ; D’Elia et al., Reference D’Elia, Pinto, Eramo, Giannossa, Ventruti and Laviano2018; Rat et al., Reference Rat, Martínez-Martínez, Sánchez-Garrido, Pérez-Villarejo, Garzón and Sánchez-Soto2022), indicating a state of maximum structural disorder. At this stage, the high reactivity of the newly formed CaO, combined with the disordered silica from the clay precursors, favoured the early crystallization of various calcium-bearing minerals such as wollastonite (CaSiO3; Dathe et al., Reference Dathe, Strelnikova, Werling, Emmerich and Dehn2021). Finally, at 950°C, illite decomposition promoted the crystallization of mullite, plagioclase and diopside in BHG5 through solid-state reactions (Csáki et al., Reference Csáki, Sunitrová, Lukáč, Łagód and Trník2022), whereas in BHG2 illite was no longer detected (Escalera et al., Reference Escalera, Tegman, Antti and Odén2014).
XRD traces of the selected clay samples before and after calcination: (a) BHG2 and (b) BHG5. C = calcite; Cr = cristobalite; D = dolomite; Di = diopside; H = hematite; I = illite; K = kaolinite; Mu = mullite; Plg = plagioclase; Q = quartz; Sp = spinel; Wo = wollastonite.

Figure 5 Long description
The image shows two graphs labeled as (a) and (b), depicting X-ray diffraction (XRD) traces of clay samples at different temperatures. In graph (a), four traces are shown at 950 degrees Celsius, 750 degrees Celsius, 550 degrees Celsius and 25 degrees Celsius. Peaks are labeled with minerals such as quartz (Q), illite (I), hematite (H), mullite (Mu), plagioclase (Plg) and spinel (Sp). In graph (b), four traces are also shown at the same temperatures. Peaks are labeled with minerals including quartz (Q), calcite (C), dolomite (D), diopside (Di), wollastonite (Wo) and mullite (Mu). The x-axis is labeled as Position in degrees two theta and the y-axis is not labeled. Each trace shows the presence of different minerals at varying intensities, indicating changes in mineral composition with temperature.
FTIR spectroscopy corroborated these mineralogical changes (Fig. S1). The disappearance of kaolinite’s Al–OH bands (3695, 3620 and 913 cm–1) at 550°C confirmed dehydroxylation. Simultaneously, the broadening and shifting of the main Si–O–Si stretching band (initially at 1031 cm–1) indicated the collapse of the long-range crystalline order and the formation of a highly disordered metakaolin structure (Prud’homme et al., Reference Prud’homme, Autef, Essaidi, Michaud, Samet, Joussein and Rossignol2013). For BHG5, the calcite bands (1432 and 873 cm–1) vanished at 750°C, confirming decarbonation (D’Elia et al., Reference D’Elia, Pinto, Eramo, Giannossa, Ventruti and Laviano2018), whereas the quartz signatures (797–779 cm–1) remained unaltered (Hajjaji et al., Reference Hajjaji, Moussi, Hachani, Medhioub, Lopez-Galindo and Rocha2010; Souri et al., Reference Souri, Kazemi-Kamyab, Snellings, Naghizadeh, Golestani-Fard and Scrivener2015). These transformations establish a reactivity hierarchy: 750°C maximized the structural amorphization by balancing metakaolin formation with carbonate decomposition. Conversely, firing at 950°C promoted the initial nucleation of primary mullite, leading to a partial reorganization on the network and a reduction in soluble phases (Zhang et al., Reference Zhang, Wang, Wang, Li, Wang and Li2022). This explains the optimal geopolymer performance of BHG5 calcined at 750°C (see the ‘Compressive strength’ section below), underscoring the critical link between thermal history, structural disorder and alkali activation potential.
Comparative phase evolution in BHG5 and BHG2 geopolymer systems under variable alkaline activation
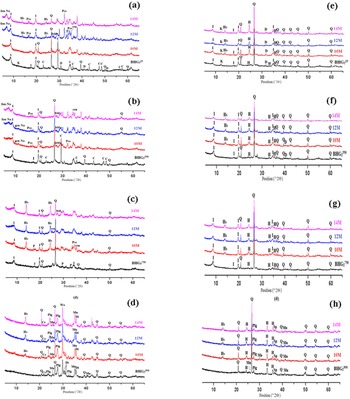
XRD analyses were conducted on consolidated geopolymer specimens after 28 days of curing (Fig. S2) to assess the influence of raw material composition, calcination temperature and NaOH concentration on mineralogical development. Figure 6 illustrates the evolution of crystallinity and amorphization in systems derived from BHG5 and BHG2 clays.
XRD traces of 28 day NaOH-activated pastes (10, 12 and 14 M) prepared from the bulk clays (a) BHG525, (b) BHG5550, (c) BHG5750, (d) BHG5950, (e) BHG225, (f) BHG2550, (g) BHG2750 and (h) BHG2950. C = calcite; Cr = cristobalite; crn = corundum; D = dolomite; Di = diopside; fau-Na = Na-faujasite; feld = feldspars; grn-Na = garronite; H = hematite; Hs = hydrosodalite; I = illite; K = Kaolinite; Mu = mullite; P = portlandite; Plg = plagioclase; Pss = pirssonite; Q = quartz; Sp = spinel; Wo = wollastonite.

Figure 6 Long description
The image contains eight XRD graphs labeled (a) to (h), each showing mineral phases in NaOH-activated pastes from BHG clays at different molarities (10, 12 and 14 M). Each graph displays peaks corresponding to various minerals, including calcite, cristobalite, corundum, dolomite, diopside, Na-faujasite, feldspars, garronite, hematite, hydrosodalite, illite, kaolinite, mullite, portlandite, plagioclase, pirssonite, quartz, spinel and wollastonite. The x-axis is labeled 'Position (2 theta)' and the y-axis is labeled 'Intensity (a.u.)'. Graph (a) shows traces for BHG subscript 5, graph (b) for BHG subscript 6, graph (c) for BHG subscript 7, graph (d) for BHG subscript 8, graph (e) for BHG subscript 9, graph (f) for BHG subscript 10, graph (g) for BHG subscript 11 and graph (h) for BHG subscript 12. Each graph illustrates the evolution of crystallinity and amorphization in the systems derived from the clays.
For geopolymers based on BHG5 clay, substantial structural transformations were observed. In the uncalcined sample GBHG525, the intensity of the illite peak decreased as the activator concentration increased, indicating partial dissolution during alkaline activation (Fig. 6a). The disappearance of calcite peaks confirmed its degradation, whereas the emergence of zeolitic phases such as Na-faujasite ((Na2,Ca,Mg)3.5(Al7Si17O48)·32H2O) and hydroxysodalite (Na6+x(AlSiO4)6(OH)x·nH2O) was identified at 12 and 14 M NaOH concentrations. These findings confirmed the crystallization of secondary phases favoured by calcium-rich precursors (Zibouche et al., Reference Zibouche, Kerdjoudj, DeLacaillerie and Van Damme2009; Vaičiukynienė et al., Reference Vaičiukynienė, Vaitkevičius, Rudžionis, Vaičiukynas, Navickas and Nizevičienė2016). Pirssonite (Na2Ca(CO3)2·2H2O) formed in the 12GBHG525 and 14GBHG525 specimens, as the interaction between calcite and sodium ions promoted the synthesis of hydrated double carbonates (Abdel-Gawwad & Abo-El-Enein, Reference Abdel-Gawwad and Abo-El-Enein2016). Finally, quartz remained unaltered, consistent with its inert nature (Lecomte et al., Reference Lecomte, Liégeois, Rulmont, Cloots and Maseri2003; Zibouche et al., Reference Zibouche, Kerdjoudj, DeLacaillerie and Van Damme2009). Calcination of BHG5 at 550°C (Fig. 6b) led to kaolinite dehydroxylation and its transformation into metakaolin, as evidenced by the disappearance of its characteristic 7.15 Å reflection (Zhang et al., Reference Zhang, Wang, Wang, Li, Wang and Li2022). The concurrent reduction in dolomite and calcite peak intensities suggested the generation of reactive CaO and MgO. At 12 M NaOH, the formation of garronite (Na6(Al6Si10O32)·8.5H2O) and Na-faujasite indicated enhanced dissolution and the precipitation of zeolitic phases characteristic of calcium-rich systems (Stroscio et al., Reference Stroscio, Barone, Fernandez-Jimenez, Lancellotti, Leonelli and Mazzoleni2024). The most pronounced structural reorganization occurred in BHG5 specimens calcined at 750°C (Fig. 6c), which exhibited broad humps between 22°2θ and 43°2θ, attributed to amorphous material, and dominant hydrosodalite peaks. Increasing the NaOH molarity increased the crystal order, suggesting the progressive consumption of illite. Weak diffraction signals at 29.7°2θ and 34.5°2θ may correspond to portlandite (Mintsaev et al., Reference Mintsaev, Murtazaev, Salamanova, Bataev, Saidumov, Murtazaev and Fediuk2022; Stroscio et al., Reference Stroscio, Barone, Fernandez-Jimenez, Lancellotti, Leonelli and Mazzoleni2024), although partial masking by amorphous phases prevents unambiguous identification. In contrast, calcination at 950°C yielded GBHG5950 specimens (Fig. 6d) rich in high-temperature phases, such as diopside, mullite and plagioclase (Mahmoudi et al., Reference Mahmoudi, Srasra and Zargouni2010; Azzouz et al., Reference Azzouz, Alouani and Tlig2011), exhibiting negligible amorphous character and reduced reactivity. Compared to BHG5-based systems, geopolymers derived from BHG2 clay exhibited markedly lower crystal order and limited phase evolution. In uncalcined BHG225 specimens (Fig. 6e), kaolinite and illite peaks persisted regardless of the NaOH concentration, indicating incomplete dissolution. Activation with 12 M NaOH led to only a slight attenuation of clay peaks, while the amorphous hump between 20°2θ and 30°2θ remained faint, reflecting poor gel formation. BHG2 calcined at 550°C and 750°C (Fig. 6f, g) displayed illite peaks as a result of its high thermal stability below 950°C (Ferone et al., Reference Ferone, Liguori and Capasso2015).
Despite alkali activation, no significant transformation into amorphous or zeolitic phases occurred, denoting limited reactivity. Geopolymers from BHG2 calcined at 950°C (Fig. 6h) revealed a crystalline matrix composed of quartz, plagioclase, hematite, spinel and mullite. The persistence of the quartz peaks confirmed its inert role, which explains the limited reactivity of BHG2 regardless of the activation conditions (Escalera et al., Reference Escalera, Tegman, Antti and Odén2014). The increase in hematite intensity might have been related to an increase in its relative content following silicate decomposition rather than secondary iron oxide formation (Baccour et al., Reference Baccour, Medhioub, Jamoussi, Mhiri and Daoud2008). Hydrosodalite was identified in trace amounts, consistent with minimal phase nucleation.
This mineralogical composition contrasts with BHG5-based materials, where the abundance of calcite and reactive CaO promoted greater amorphization and zeolite formation. Overall, the XRD traces indicate that BHG5-based geopolymers exhibited higher degrees of amorphization and crystalline phase diversification than those derived from BHG2 (Fig. 6). This trend is particularly evident at intermediate calcination temperatures (750°C) and elevated NaOH concentrations.
Structural evolution of BHG5 and BHG2 geopolymers via FTIR spectroscopy
The FTIR analysis was conducted to evaluate the structural evolution of geopolymer matrices derived from the BHG5 and BHG2 clays. These clays were heated at various calcination temperatures and activated using NaOH solutions of increasing concentration. Figure 7 presents the corresponding FTIR spectra, highlighting molecular rearrangements associated with carbonate decomposition, aluminosilicate reorganization and zeolite phase formation.
FTIR spectra (KBr pellet) of geopolymers synthesized from clay fractions (a–d) BHG5 and (e–h) BHG2. Precursors were calcinated at 25°C, 550°C, 750°C and 950°C and activated with 10, 12 and 14 M NaOH solutions.

Figure 7 Long description
The image contains eight FTIR spectra labeled (a) to (h), showing the structural evolution of geopolymers synthesized from BHG clays. Each spectrum displays wavenumber in centimeters to the power of negative one on the x-axis and intensity on the y-axis. The spectra are differentiated by calcination temperatures and NaOH concentrations: 14M, 12M, 10M and BHG. Key peaks and molecular rearrangements are marked with specific wavenumbers. The spectra illustrate changes associated with carbonate decomposition, aluminosilicate reorganization and zeolite phase formation. Each sub-image highlights different molecular interactions and structural changes in the geopolymers under varying conditions.
In the BHG5-based systems, clear vibrational modifications can be observed in the carbonate region. Specifically, the ν2 and ν4 modes of calcite, at 872 and 713 cm–1 (Yu et al., Reference Yu, Kirkpatrick, Poe, McMillan and Cong1999; Joshi et al., Reference Joshi, Kalyanasundaram and Balasubramanian2013), diminish or shift following alkaline activation (Fig. 7a–d). A sharper 872 cm–1 band and a shoulder at 866 cm–1 (García-Lodeiro et al., Reference García-Lodeiro, Fernández-Jiménez, Palomo and Macphee2010) appear in GBHG5550 specimens (Fig. 7b), with the shoulder remaining pronounced at 10 M NaOH, despite a decrease in intensity. Τhis is indicative of a partial calcite-to-pirssonite transformation. Additionally, new bands at 687–688 cm–1 emerge in materials activated with 12–14 M NaOH, corresponding to ν4CO32⁻ vibrations in pirssonite and other hydrated carbonates (Adler & Kerr, Reference Adler and Kerr1963; Estep et al., Reference Estep, Kovach, Hiser, Karr and Friedel1970), reflecting the progressive rearrangement of carbonate ions and their transformation into secondary mineral phases.
In contrast, BHG2-derived geopolymers (Fig. 7e–h) exhibit less pronounced spectral changes in the carbonate region. A weak band at ∼1456 cm–1 suggests limited carbonation during curing (Bernal et al., Reference Bernal, Rodriguez, Mejia de Gutiérrez, Provis and Delvasto2011); however, the absence of new crystalline sodium carbonates in the XRD data confirms that this effect is primarily non-crystalline. Unlike BHG5, which shows the clear formation of pirssonite and other double carbonates, BHG2 fails to undergo comparable secondary carbonate crystallization, probably due to its lower initial Ca content and reduced reactivity. Quartz remains unaffected in both systems, with persistent Si–O–Si stretching bands observed at 778–797 and 694 cm–1 (Lee & Van Deventer, Reference Lee and Van Deventer2003; Kaufhold et al., Reference Kaufhold, Hein, Dohrmann and Ufer2012).
The inert behaviour of BHG2 under alkaline conditions leads to negligible spectral variation, confirming the lack of geopolymerization processes. A pivotal indicator of structural reorganization in both matrices is the shift of the asymmetric Si–O–T stretching vibration. In BHG5 specimens, this band shifts from 1023 cm–1 in the calcined clay to 1018–1019 cm–1 in the activated products (Chandrasekhar & Pramada, Reference Chandrasekhar and Pramada1999; Heller-Kallai & Lapides, Reference Heller-Kallai and Lapides2007), indicating increased cross-linking and the formation of Q4 silicate environments.
A similar shift is observed in BHG2 specimens, where the band transitions from 1031 to 997 cm–1 in the GBHG2550 series (Fig. 7f), suggesting the dissolution of reactive phases and subsequent gel formation. However, this shift is more pronounced in sample BHG5, implying more extensive aluminosilicate restructuring. The bands at 476 cm–1 are attributed to the in-plane bending of Si–O and Al–O linkages (Post & Borer, Reference Post and Borer2002; Gao et al., Reference Gao, Lin and Wang2013), originating from the reconstruction of the AlO4 and SiO4 tetrahedra that characterize the geopolymer structure (Soleimani et al., Reference Soleimani, Naghizadeh, Mirhabibi and Golestanifard2012).
Only BHG5-based systems show evidence of zeolitic phase formation via FTIR spectroscopy (Ozer & Soyer-Uzun, Reference Ozer and Soyer-Uzun2015). The GBHG5750 spectra (Fig. 7c) show multiple bands at 732, 707, 662 and 433 cm–1, attributed to four- and six-membered ring structures and Si–O–Al bending modes characteristic of hydrosodalite (Fernández-Jiménez & Palomo, Reference Fernández-Jiménez and Palomo2005; Rees et al., Reference Rees, Provis, Lukey and Van Deventer2008; Liew et al., Reference Liew, Kamarudin, Bakri, Luqman, Nizar, Ruzaidi and Heah2012; Tchakouté et al., Reference Tchakoute Kouamo, Rüscher, Kong and Kamseu2016; González-García et al., Reference González-García, Téllez-Jurado, Jiménez-Álvarez and Balmori-Ramírez2017; Sore et al., Reference Sore, Messan, Prud’Homme, Escadeillas and Tsobnang2020). These bands vary with NaOH concentration, confirming that zeolite nucleation is dependent on activator molarity. In contrast, the BHG2 spectra do not display comparable ring-structure markers, indicating either limited or a lack of crystallization of zeolitic phases despite similar activation conditions. Water incorporation is observed in both systems through the appearance of bands in the 1600–1650 cm–1 range, which correspond to the bending vibrations of H–OH groups (Maragkos et al., Reference Maragkos, Giannopoulou and Panias2009). These bands are more prominent in BHG5, probably due to a more extensive formation of gel-phase networks that retain bound water molecules. This moisture-related signature aligns with the greater curing efficiency and geopolymer stability observed in the BHG5 formulations.
In summary, the FTIR data (Fig. 7) reveal that BHG5-based geopolymers undergo more pronounced structural reorganization, including carbonate transformation, tetrahedral network development and zeolite crystallization, than those derived from BHG2. These differences stem from the distinct chemical compositions and reactivities of the precursor clays, as well as their specific responses to thermal treatment and alkaline activation.
Compressive strength
Compressive strength tests conducted after 28 days of curing revealed marked differences in mechanical performance between geopolymers synthesized from BHG2 and BHG5 clays under varying thermal and alkaline conditions (Table 5). These differences reflect the interplay between mineralogical composition, phase evolution and gel cohesion.
Compressive strength values (error ±0.05 MPa) of hardened geopolymer pastes synthesized from BHG2 and BHG5 clays calcined at various temperatures (550°C, 750°C and 950°C) and activated with various NaOH concentrations.

Table 5 Long description
The table measures the compressive strength of geopolymer pastes made from BHG2 and BHG5 clays, calcined at temperatures of 550°C, 750°C, and 950°C, and activated with NaOH concentrations of 10, 12, and 14 molars. For BHG2 clay, the highest compressive strength is 6.14 MPa at 950°C with 10 molar NaOH. In contrast, BHG5 clay shows a peak strength of 6.64 MPa at 750°C with 14 molar NaOH. Generally, BHG5 clay exhibits higher compressive strengths across all conditions compared to BHG2. The data suggests that both the type of clay and the calcination temperature significantly influence the compressive strength, with BHG5 clay at 750°C showing the most promising results. Caution should be taken when interpreting these results due to the error margin of ±0.05 MPa.
BHG2-based formulations generally displayed low compressive strength values, ranging from 0.48 to 1.7 MPa, with the notable exception of 10GBHG2950, which reached 6.14 MPa. Hence, calcination at 950°C activated the illitic clay sufficiently to enable improved mechanical development under 10 M NaOH. The improved performance probably stems from illite dehydroxylation and the partial crystallization of reactive species, which improved binder cohesion.
However, increasing the alkaline concentration to 12 and 14 M caused the compressive strength values to decline to 1.08 and 0.34 MPa, respectively, probably due to excessive pore formation and insufficient structural densification (Khale & Chaudhary, Reference Khale and Chaudhary2007; Zuhua et al., Reference Zuhua, Xiao, Huajun and Yue2009), as is supported by SEM observations (Fig. 8b). The compressive strength of samples calcined at 550°C and 750°C did not exceed 0.96 MPa, indicating poor activation efficacy at intermediate temperatures, in accordance with the limited amorphization and mineral transformation observed via XRD.
SEM micrographs of alkali-activated samples (a) 10GBHG2950, (b) 14GBHG2950, (c) 12GBHG5750 and (d) 12GBHG5750 at high magnification.

Figure 8 Long description
The image A shows a scanning electron micrograph labeled 'Geopolymer gel' with a scale of 100 micrometers. The image B shows another micrograph labeled 'Geopolymer gel' with a similar scale. The image C shows a micrograph highlighting 'Cracks' and 'Air bubbles' with a scale of 100 micrometers. The image D shows a micrograph labeled 'Hydrosodalite' with a scale of 20 micrometers.
In contrast, BHG5-based geopolymers developed substantially higher compressive strengths, ranging from 0.81 to 8.12 MPa, confirming that calcination at 750°C and activation with 12 M NaOH are the optimal conditions for developing mechanical strength. Comparable compressive strength levels have been reported in the literature for geopolymers based on illitic raw materials. For instance, Vasic et al. (Reference Vasic, Terzic, Radovanovic, Radojevic and Warr2022) reported relatively low compressive strengths, not exceeding 13.7 MPa, for a geopolymer produced from a mixture of 40% low-illitic raw clay and 60% brick tile residue activated with 10 M KOH and Na2SiO3. Similarly, Seiffarth et al. (Reference Seiffarth, Hohmann, Posern and Kaps2013) obtained promising bending tensile strength values of ∼8 MPa using a 50/50 feldspar/calcined clay mixture. The compressive strength improvement observed in the present study is primarily attributed to the decomposition of calcite during calcination (Figs 4e & 5b), which produces reactive CaO. This process is clearly supported by the thermal analysis results, where BHG5 exhibits a ∼2% weight loss at 700–800°C, consistent with calcite breakdown (Fig. 4e). Correspondingly, the calcite peak disappears in the XRD trace of BHG5 after thermal treatment at 750°C (Fig. 5b), confirming the transition to CaO. Upon alkaline activation, the newly formed CaO reacts to generate secondary cementitious phases that improve matrix cohesion and contribute directly to the increased compressive strength observed in 12GBHG5750 (Prud’homme et al., Reference Prud’homme, Michaud, Joussein, Peyratout, Smith and Arii-Clacens2010, Reference Prud’homme, Michaud, Joussein, Peyratout, Smith and Rossignol2011; Essaidi et al., Reference Essaidi, Samet, Baklouti and Rossignol2013).
Specifically, CaO reacts with silicate species and Na+ ions to form cementitious phases, which significantly promote gel densification and cohesion, thereby exceeding simple mechanical reinforcement. Other BHG5 samples calcined at 750°C and activated with 10 or 14 M NaOH showed slightly lower, yet still substantial, compressive strengths of 6.64 and 4.32 MPa, respectively, indicating a robust activation window (Heah et al., Reference Heah, Kamarudin, Mustafa Al Bakri, Bnhussain, Luqman and Khairul Nizar2013). Samples calcined at 550°C (GBHG5550) yielded intermediate compressive strengths of between 4.32 and 6.54 MPa, highlighting effective reactivity due to metakaolinite formation and partial carbonate decomposition. Conversely, BHG5 samples calcined at 950°C exhibited significant decreases in of compressive strengths (0.81–1.30 MPa). These decreases are attributed to the formation of inert crystalline phases, such as mullite and plagioclase (Mahmoudi et al., Reference Mahmoudi, Srasra and Zargouni2010; Azzouz et al., Reference Azzouz, Alouani and Tlig2011), which reduced the available reactive content.
In summary, the BHG5 clay demonstrates superior mechanical behaviour across various thermal and alkaline activation strategies. This is attributed not only to the aluminosilicate components but especially to its carbonate-rich composition, which generates reactive calcium oxide (CaO), leading to the nucleation of additional cementitious phases. In contrast, BHG2, despite being richer in kaolinite, lacks this specific contribution and exhibits lower mechanical strength, except under specific high-temperature/low-alkalinity conditions. These findings underline the critical roles of precursor chemistry and thermal history in tailoring the mechanical properties of geopolymer binders.
Microstructural characteristics
Figure 8 presents the SEM micrographs of selected alkali-activated samples synthesized from BHG clays under various NaOH concentrations and calcination conditions. A comparison between 10GBHG2950 (Fig. 8a) and 14GBHG2950 (Fig. 8b) reveals notable microstructural differences despite the use of the same clay precursor (BHG2 calcined at 950°C).
The 10GBHG2950 geopolymer exhibits a more homogeneous and slightly denser matrix compared to 14GBHG2950, which was synthesized using 14 M NaOH. The latter displays a more irregular and porous morphology, indicating a less efficient geopolymerization process. This suggests that excessive alkalinity may hinder the development of a cohesive matrix, consistent with the lower compressive strength observed for the 14 M NaOH-activated sample, which decreased from 6.34 to 0.34 MPa.
Figure 8c,d corresponds to the same sample, 12GBHG5₇5₀. At a higher magnification (Fig. 8d), the formation of spherical particles becomes evident. These features are attributed to the crystallization of zeolitic phases, such as hydrosodalite (Felsche et al., 1986; Vaičiukynienė et al., Reference Vaičiukynienė, Vaitkevičius, Rudžionis, Vaičiukynas, Navickas and Nizevičienė2016), as confirmed by XRD. Although the microstructure appears less compact compared to 10GBHG2950 and 14GBHG2950, sample 12GBHG5750 demonstrated the highest compressive strength (Table 5). This is attributed to the higher CaO content in the BHG5 clay, which is ∼23.35 wt.% (Table 2). The high CaO content probably contributes to the formation of additional cementitious phases during activation (Bernal et al., Reference Bernal, Rodriguez, Mejia de Gutiérrez, Provis and Delvasto2011). These CaO-rich phases increase structural densification and improve mechanical performance despite the apparent porosity (Bernal et al., Reference Bernal, Rodriguez, Mejia de Gutiérrez, Provis and Delvasto2011).
Regarding the environmental stability and durability of the synthesized geopolymers, the materials developed, particularly from sample BHG5, possess a stable matrix. The presence of calcite in the raw clay (BHG5) leads to the formation of a hybrid geopolymeric network in which N–A–S–H and C–(A)–S–H gels coexist (Li & Ikeda, Reference Li and Ikeda2024; Stroscio et al., Reference Stroscio, Barone, Fernandez-Jimenez, Lancellotti, Leonelli and Mazzoleni2024). This hybrid structure has been well documented to improve durability by reducing porosity and limiting the leaching of alkali ions (Garcia-Lodeiro et al., Reference Garcia-Lodeiro, Palomo, Fernández-Jiménez and Macphee2011; Razeghi Tehrani et al., Reference Razeghi Tehrani, Arjomand, Behbahaninia and Kargari2024). Moreover, the formation of secondary crystalline phases such as hydrosodalite, observed in the XRD traces, contributes to the immobilization of the alkaline activator within the aluminosilicate framework. These microstructural features, combined with the significant compressive strength achieved (∼8 MPa), indicate good potential for long-term stability in ambient conditions.
Conclusions
This study demonstrates the feasibility of synthesizing geopolymer binders from illitic-kaolinitic clays from southern Tunisia. The comparative analysis of BHG2 and BHG5 highlights that mineralogical impurities are pivotal to performance: the presence of carbonates in BHG5 promotes the formation of secondary calcium-based cementitious phases after calcination at 750°C, leading to superior strength compared to the hematite-rich BHG2.
The novelty of this work lies in the successful activation of low-purity illitic clays, shifting the focus from high-grade metakaolin to widely available regional resources.
The achieved compressive strength of ∼8 MPa validates these binders for non-structural applications, such as stabilized earth blocks or interior partition units. Although the current mechanical results are moderate, they provide a solid baseline for the valorization of local Tunisian clays. Our future research will focus on further increasing this compressive strength to meet higher standards for other structural requirements and exploring the long-term durability of these binders under various environmental conditions. This study opens up a sustainable pathway for low-energy construction materials adapted to regional needs.
Supplementary material
The supplementary material for this article can be found at https://doi.org/10.1180/clm.2026.10034.
Author contributions
Conceptualization: ZJ, FG, IL, CL and SM; methodology: ZJ, CL and SM; software: ZJ and FG; validation: IL, CL and SM; formal analysis: ZJ; investigation: ZJ; resources: ZJ, FG, IL, CL, and SM; data curation: ZJ; writing – original draft preparation: ZJ; writing – review and editing: ZJ, FG, CL and SM; visualization: ZJ, FG, IL, CL and SM; supervision: CL and SM. All authors have read and agreed to the published version of the manuscript.
Acknowledgements
The authors are grateful to Dr Miriam Hanuskova, Department of Engineering ‘Enzo Ferrari’, University of Modena, and Reggio Emilia, Modena, Italy, for the BET surface area measurements.
Financial support
The authors are pleased to acknowledge the Tunisian Ministry of Higher Education and Scientific Research for its help in financing internships in Italy. The authors would also like to thank the University of Modena and Reggio Emilia (Italy) for covering the costs of materials and analyses.
Competing interests
The authors declare none.






 Open access

