





Introduction
Background and motivation
Confronted with the situation that “[v]olunteering practices are evolving quickly in the twenty-first century” (Davis, Reference Davis2020, p. 10), volunteer research is struggling to better capture the dynamic volunteer landscape, thereby improving understanding and enabling appropriate responses. Yet, the increasing importance of informed volunteer management is evident as almost one billion people volunteer every month, performing equivalent labor to approximately 61 million full-time jobs (United Nations Volunteers (UNV) Programme, 2021). Their commitment not only makes a significant contribution to local and global economic development, (Smith & Stebbins, Reference Smith, Stebbins, Stebbins, Grotz and Smith2016) but is also indispensable in the political, social, and ecclesiastical sectors (Lamprecht et al., Reference Lamprecht, Fischer and Stamm2020).
Current research disagreement on volunteering, motivation, and religion
Despite previous research efforts and although motivational factors are the most researched aspect in volunteering research (Wilson, Reference Wilson2012), significant uncertainty remains about how the aspect of “religion” plays into this context. Focusing on Christianity as the largest religion, approaching 3 billion people worldwide in the next decades (Hackett & Stonawski, Reference Hackett and Stonawski2017), the debate encompasses the following aspects:
Christian religiosity (Aksoy & Wiertz, Reference Aksoy and Wiertz2024; Ohlendorf & Sinnemann, Reference Ohlendorf, Sinnemann, Klein and Zimmermann2017) is significantly associated with increased voluntary engagement in American and European contexts (Liedhegener et al., Reference Liedhegener, Pickel, Odermatt, Yendell and Jaeckel2019; Merino, Reference Merino2013). This circumstance is not caused by a substitution effect (Odermatt, Reference Odermatt2023) whereby religious volunteering replaces civil society volunteering among Christian volunteers. Instead, both types of engagement—ecclesiastical and civil society—are typically high (Horstmann, Reference Horstmann2013; König et al., 2023; Merino, Reference Merino2013). However, the motivational factors leading to the increased voluntary engagement are highly debated. Two prevalent perspectives emerge in this debate: On one side, social religiosity is viewed as the primary driver. This includes positive volunteer role models (Pickel, Reference Pickel, Bedford-Strohm and Jung2015), network relationships as access points (Horstmann, Reference Horstmann2013; Merino, Reference Merino2013), and attendance at religious events (Aksoy & Wiertz, Reference Aksoy and Wiertz2024; Odermatt, Reference Odermatt2023). Conversely, research frequently highlights personal religiosity (intrinsic religious beliefs and personal religious practices) as driving factors. Examples include religious identity (Liedhegener et al., Reference Liedhegener, Pickel, Odermatt, Yendell and Jaeckel2019), high spirituality (König et al., 2023), and implicit and explicit religious beliefs (Liedhegener, Reference Liedhegener2022; Ohlendorf & Sinnemann, Reference Ohlendorf, Sinnemann, Klein and Zimmermann2017; Pickel, Reference Pickel, Bedford-Strohm and Jung2015; Reinke & Zimmerhof, 2016).
Overall, present uncertainty regarding which religious aspects contribute to volunteer motivation in what ways presents a crucial challenge for organizations involved in voluntary work, both ecclesiastical and civil, as it is well-known that a thorough understanding of motivational structures can greatly enhance recruitment and retention efforts (Clary et al., Reference Clary, Snyder and Ridge1992, Reference Clary, Snyder, Ridge, Miene and Haugen1994).
Possible causes of disagreement in research on volunteering, motivation, and religion
A potential cause for the ambiguity observed in current research may stem from a lack of alignment between research approaches and instruments with the actual subject matter—namely, religious motivational factors. For instance, the Volunteer Functions Inventory (VFI), which is the most widely used quantitative instrument in volunteer motivation research (Chacón et al., Reference Chacón, Gutiérrez, Sauto, Vecina and Pérez2017), does not include items that assess religious motivations. That this circumstance constitutes an important limitation for research in religious contexts has already been pointed out shortly after its publication (Allison et al., Reference Allison, Okun and Dutridge2002). Nonetheless, the VFI and other instruments that are not assessing religious motivational factors are widely used to research Christian volunteers’ motivation (Bellamy & Leonard, 2015; Fernandes, Reference Fernandes2017; Ralston, Reference Ralston2018; Sloan, Reference Sloan2018)—even with the explicit aim of identifying specifically religious motivations (Ohlendorf & Sinnemann, Reference Ohlendorf, Sinnemann, Klein and Zimmermann2017), a task inherently doomed to failure. Studies that, in contrast, include religious motivational factors in their methodological setup and instruments adopt vastly different approaches: Some supplement existing volunteer research instruments with additional items (Erasmus, Reference Erasmus2016; Winston et al., Reference Winston, Cerff and Kirui2012); others treat religion as a singular item or construct (Forbes & Zampelli, Reference Forbes and Zampelli2014; Lamprecht et al., Reference Lamprecht, Fischer and Stamm2020); yet others compile their own item lists (Graakjær-Hjort & Skræddergaard, 2022; Pickel, Reference Pickel, Bedford-Strohm and Jung2015) or opt for qualitative/mixed-methods approaches (Erasmus, Reference Erasmus2016; Reinke & Zimmerhof, 2016).
Likewise, the ambiguous state of current research could also be attributed to a lack of comparability among conducted empirical studies. The variation is not confined to research perspectives and instruments; it further extends to differences in the geographical focus of research projects, civil sectors and church-denominational contexts investigated, as well as the types of voluntary activities that volunteers engage in. These aspects constitute essential contextual information for understanding the complex motivational factors driving volunteers, as differing contexts can significantly influence their motivational structures (Lamprecht et al., Reference Lamprecht, Fischer and Stamm2020; United Nations Volunteers (UNV) programme, 2021).
Two potential avenues to systematize the context dependency
Recognizing the need to conceptually “reimagine volunteering” (Davis, Reference Davis2020, p. 3) to fit the increasingly dynamic and diverse volunteering contexts of the 21st century (Davis, Reference Davis2020), UN Volunteers (UNV) were tasked with developing a new volunteering framework for the “2030 Agenda” in order to “fully harness the power of volunteering for the Sustainable Development Goals” (Davis, Reference Davis2020, p. 3). The resulting UNV 2020 framework distinguishes five variables within which volunteering activities can be mapped (Davis, Reference Davis2020, pp. 9–11):
-
• Structure (formal/informal)
-
• Site (offline/online)
-
• Intensity (episodic/regular)
-
• Aspiration (self-building/community building)
-
• Category (mutual aid, service, campaigning, participation, leisure)
The framework’s proven success in the United Nations’ “State of the World’s Volunteerism Report” suggests that it may also facilitate a systematic understanding of Christian volunteers’ motivations across varied contexts of engagement—or at least help to pinpoint current inconsistencies in research reporting on this topic.
Objective and research questions
Currently, there is not only significant disagreement regarding which motivational factors and barriers constitute volunteer motivation of Christian volunteers. It also remains unclear what causes these disagreements and why integrative summaries of existing research yield widely divergent conclusions.
To facilitate future field building by orienting readers to current theoretical and methodological strengths and weaknesses, this study addresses these issues by conducting a scoping review in order to systematically map the research in this area. The central research question posed is: What research approaches are employed (e.g., research instruments, frameworks, study formats), which populations are researched (e.g., age, denomination), and what volunteering contexts are studied (e.g., geographical location, civil society or church projects; assessed via the UNV 2020 model and the four functions of the church)?
Methods
Protocol and registration
A scoping review approach following the “JBI Manual for Evidence Synthesis—2024 Edition” (Aromataris et al., Reference Aromataris, Lockwood, Porritt, Pilla and Jordan2024, p. 162) and reporting according to the “PRISMA Extension for Scoping Reviews (PRISMA-ScR)” (Tricco et al., Reference Tricco, Lillie, Zarin, O’Brien, Colquhoun, Levac, Moher, Peters, Horsley, Weeks, Hempel, Akl, Chang, McGowan, Stewart, Hartling, Aldcroft, Wilson, Garritty and Straus2018, p. 467) was selected. After an initial exploratory web search for existing literature reviews (utilizing ProQuest, Scopus, Index Theologicus, Google Scholar, PROSPERO, and OSF Registries), the scoping review was registered with OSF Registries, where the review protocol was subsequently archived (Fröh, Reference Fröh2024).
Eligibility criteria
To be included in the review, sources needed to satisfy both formal and substantive criteria. Formally, only English- or German-language research literature related to empirical studies (quantitative, qualitative, or mixed-methods) was considered. They had to be published either in peer-reviewed journals or as part of habilitation and dissertation theses, contributions to edited volumes, monographs, or research reports. Substantively, the following criteria were applied:
-
1. The study population examined had to include Christian volunteers (explicitly identifiable either through self-identification by individuals or through their involvement in a Christian volunteer project). The reported results must be clearly and distinctly attributable to this specific segment of the study population.
-
2. The research object was required to focus on volunteering motivation, including factors and barriers.
-
3. The research context had to pertain to formal volunteering within civil society or church-based voluntary projects.
The eligibility criteria were utilized to formulate eight exclusion criteria serving as precise instructions for the screening team. The criteria and their description given to the screening team can be found in Appendix A (Exclusion criteria).
Search strategy
A three-step process was implemented to identify relevant research literature (for an extended elaboration of the process, see: (Aromataris et al., Reference Aromataris, Lockwood, Porritt, Pilla and Jordan2024, pp. 169–170)). In the initial step, key terms were identified through iterative searches on Google Scholar and within the “Social Science” category of the ProQuest databases. This identification involved examining titles, abstracts, keywords, and occasionally full texts from pertinent studies.
In the second step, these identified key terms were employed to search across all included databases (ProQuest, Scopus, Wiley Online Library, Index Theologicus) for literature published up to and including February 2026 (the main search cycle was conducted on August 1, 2024, followed by an updating search cycle on February 20, 2026). An exact list of ProQuest databases used is provided in Appendix A (ProQuest databases used), while documented and annotated search queries can be found in Appendix A (Search queries for all databases).
In the final step, texts included after full-text screening served as a basis for two further searches: First, a snowball search was conducted using their bibliographies; second, a citation search was carried out via Google Scholar.
Selection of sources of evidence
All sources identified through the search process were imported into Rayyan as .ris files (Ouzzani et al., Reference Ouzzani, Hammady, Fedorowicz and Elmagarmid2016). Subsequently, potential duplicates were addressed using Rayyan’s duplicate detection tool, and finally, the remaining dataset was manually reviewed for any overlooked duplicates.
The screening of these prepared sources proceeded in three steps. The first step involved two raters (JF and SF) conducting a pilot test of the selection criteria:
-
1. Random selection of 50 titles/abstracts from the sources identified through search steps 1 and 2.
-
2. Independent screening of the sources against the selection criteria within the categories “Yes/Maybe/No” using Rayyan’s screening view (“Blind On”).
-
3. Comparison of the screening results (“Blind Off”).
An inter-rater reliability (IRR) assessment using the squared-weighted Cohen’s kappa statistic yielded a value of
$ {\kappa}_{\nu }=0,97 $
 . In the second stage, the rating team independently screened all sources based on titles and abstracts using Rayyan. This phase resulted in an IRR of
$ {\kappa}_{\nu }=0,71 $
. In the second stage, the rating team independently screened all sources based on titles and abstracts using Rayyan. This phase resulted in an IRR of
$ {\kappa}_{\nu }=0,71 $
 . For the third stage, full texts for sources rated as “Yes” or “Maybe” were retrieved and utilized in the snowball and citation searches described in Section “Search strategy.” All accessed full texts, along with those identified via these methods, were transferred to Microsoft Excel. Subsequently, all these texts were independently screened by the rating team based on their full content using MAXQDA 24, with screening decisions independently recorded in Microsoft Excel. The IRR for this step was
$ {\kappa}_{\nu }=0,68 $
. For the third stage, full texts for sources rated as “Yes” or “Maybe” were retrieved and utilized in the snowball and citation searches described in Section “Search strategy.” All accessed full texts, along with those identified via these methods, were transferred to Microsoft Excel. Subsequently, all these texts were independently screened by the rating team based on their full content using MAXQDA 24, with screening decisions independently recorded in Microsoft Excel. The IRR for this step was
$ {\kappa}_{\nu }=0,68 $
 .
.
At the end of all stages, any discrepancies in classification were resolved through joint discussion.
Data charting process
Content analysis involved coding three groups of characteristics. The first group (I) included information regarding the research format of each study. A second set of characteristics (II) documented details about volunteers. The third group (III) described the volunteer projects under investigation, informed by both the UNV 2020 model and the four functions of the church.
Methodologically, a coding process consisting of two cycles was designed: In the first coding cycle, basic information related to the research format (Group I), study participants and co-researchers (Group II), as well as volunteer projects (Group III) were recorded using “Attribute Coding.” (Saldaña, Reference Saldaña2013, p. 70) Additionally, in-depth analysis of motivation definitions utilized in the sources (Group I) was prepared via “Structural Coding.” (Saldaña, Reference Saldaña2013, p. 83) The first coding cycle began with a pilot phase (coding team: JF, YR for coding the main search and JF, SF for coding the updating search); cycle: 2x joint coding, 3×5 independent coding; unweighted kappa coefficient
$ {\kappa}_n=0.97 $
 (Brennan & Prediger, Reference Brennan and Prediger1981); percentage agreement for each individual code: lower quantile at 95.65%, minimum at 91.3%, lowest outlier at 60.87%). This demonstrated that all codes were assigned with sufficient reliability. Subsequently, independent coding of all sources was continued by the coding team. Differences in coding were ultimately resolved through discussion of the relevant sections.
In the subsequent second coding cycle, passages identified as relevant during the first cycle via structural coding underwent “Elaborative Coding” (Saldaña, Reference Saldaña2013, p. 229). This phase was conducted by a single coder (JF).
The characteristics of the codes utilized in both coding cycles are listed and described in Appendix A (Coding characteristics).
Data analysis
The coded data were evaluated using various methods consistent with the employed coding procedures. For data examined through Attribute Coding, a frequency analysis was conducted on the results. This included calculating both absolute and relative frequencies of codes, their distribution (e.g., via graphs and box plot diagrams), as well as performing a comprehensive correlation analysis (notation: probability of the null hypothesis ->
$ {p}_{\chi^2} $
 , Cramér’s V ->
$ V $
, Cramér’s V ->
$ V $
 , adjusted Pearson’s residuals ->
$ r $
, adjusted Pearson’s residuals ->
$ r $
 ). The full analysis pipeline is available via GitHub (Fröh, Reference Fröh2026).
For data analyzed using Elaborative Coding, a purely descriptive-narrative mapping of results was conducted, consistent with the primary aim of a scoping review (Aromataris et al., Reference Aromataris, Lockwood, Porritt, Pilla and Jordan2024).
Results
Selection of sources, source characteristics, and coding
Of the 2,485 potential sources identified through database searches, 500 were duplicates. An additional 100 sources could not be retrieved from ProQuest due to a database error that prevented one of the search results pages from loading. Of the remaining 1,885 potential sources, 1,757 were excluded based on title and abstract screening. Of the 156 sources that passed the first screening round, 130 could be retrieved for full-text screening. Through full-text screening, an additional 68 sources were excluded, with the most frequent reason (n = 49) being that the study population was either non-Christian or that the results could not be distinctly attributed to the Christian segment of the population. Based on the 62 sources identified through database searches, an additional web, bibliography, and citation search was conducted, yielding 50 further potential sources. Of the 50 sources identified for full-text screening, 46 were accessible and reviewed in full. Of these, 17 sources met all inclusion criteria. In total, 79 relevant and accessible sources were identified for the scoping review. Figure 1 presents the selection process in a PRISMA 2020 flow diagram. The characteristics and coding of all included sources are fully documented in Appendix A (Exclusion criteria, List of identified sources, Coding Group I, and Coding Groups II and III).
PRISMA 2020 flow diagram. For the reasons, see Appendix A (Exclusion Criteria).

Fig. 1. Long description
The flowchart is divided into three vertical stages.
1. Identification Phase.
Under Identification of studies via databases and registers, 2485 records were identified from ProQuest n equals 1369, Scopus n equals 687, Wiley n equals 346, and Index Theologicus n equals 83. 600 records were removed before screening, including 500 duplicate records and 100 records not retrievable.
Under Identification of studies via other methods, 50 records were identified from Websites n equals 35 and Bibliography and Citation searching n equals 15.
2. Screening Phase.
For databases, 1885 records were screened, with 1757 records excluded. 156 reports were sought for retrieval, but 26 were not retrieved. 130 reports were assessed for eligibility, and 68 were excluded for seven specific reasons. This left n equals 62.
For other methods, 50 reports were sought for retrieval, but 4 were not retrieved. 46 reports were assessed for eligibility, and 29 were excluded for eight specific reasons.
3. Included Phase.
A total of 79 studies were included in the review, consisting of 62 from databases and 17 from other methods. These 79 studies resulted in 81 reports of included studies.
Mapping of research format
The following results are based on the assigned codes, which are documented in full in Appendix A (Coding Group I):
A total of 79 studies published between 1989 and 2026 were analyzed. The distribution of publication dates is shown in Figure 2. More than half of the studies were doctoral dissertations (n = 42; 53.2%), approximately one third were journal articles (n = 27; 34.2%), six were monographs, and four were book chapters (see Figure 3).
Number of studies per year.

Fig. 2. Long description
The horizontal X-axis is labeled Year and ranges from 1989 to 2026. The vertical Y-axis is labeled Number of studies and ranges from 0 to 11 with horizontal dashed grid lines at intervals of 2.
From 1989 to 2010, the number of studies is low and sporadic, mostly fluctuating between 0 and 2.
Starting in 2011, there is a noticeable increase in research activity.
Key data points include:
* 2011 to 2012: 2 studies each.
* 2013 to 2014: 4 studies each.
* 2015: 3 studies.
* 2016: A sharp rise to 7 studies.
* 2017: 5 studies.
* 2018: 3 studies.
* 2019: 4 studies.
* 2020: 2 studies.
* 2021: 5 studies.
* 2022: 6 studies.
* 2023: The highest peak with 11 studies.
* 2024: 1 study.
* 2025: 4 studies.
* 2026: 1 study.
Percentage distribution of publication types.

The studies were authored by first authors from a total of 13 different countries (see Figure 4), with the majority based in the United States (n = 49; 62%), followed by Germany (n = 10; 12.7%) and the United Kingdom (n = 5; 6.3%). In total, only four studies originated from outside Northern Europe or North America.
Map of the relative frequency of first authors’ countries, color-coded for <10% (yellow), >10% (orange), and > 50% (red). The map was created using MapChart: https://www.mapchart.net/world.html.

The first authors represent 21 different disciplines, including the humanities, social sciences, education, and economics. Education is the most represented field, with 22 researchers (27.9%), followed by theological disciplines (n = 17; 21.5%), predominantly practical theology (n = 13; 16.5%).
Notably, there is a significant association between the first author’s country and their discipline (
$ {p}_{\chi^2}<0,01;V\approx 0,58 $
 ). Relative to the overall lower publication volume, theological studies are markedly overrepresented in Germany and Finland (
$ {r}_{Germany}\approx 4;{r}_{Finland}\approx 5 $
). Relative to the overall lower publication volume, theological studies are markedly overrepresented in Germany and Finland (
$ {r}_{Germany}\approx 4;{r}_{Finland}\approx 5 $
 ).
).
In 36 of the studies (45.6%), an explicit theoretical framework guiding the study design and data analysis is reported. Overall, 13 different frameworks are explicitly employed, with three clearly dominant: 12 studies (16.2%) primarily adopt a functional psychology perspective, and 7 studies each (9.5%) apply phenomenology and self-determination theory (SDT).
Regarding research designs, quantitative approaches slightly predominate (n = 39; 49.4%), closely followed by purely qualitative studies (n = 31; 39.2%). Nine additional studies employed a mixed-methods approach, all combining surveys and interviews. Overall, surveys were conducted in nearly 60% of the cases (n = 47; see Figure 5). Interview-based approaches were the second most frequent (n = 36; 45.6%), occasionally combined with focus group discussions (n = 7).
Relative frequency of the research methods used, based on the total of n = 79 studies providing this information.

Forty-two of the 79 studies (53.8%) reported the research instruments used. A wide range of 38 different instruments were employed. Only the VFI was used more than twice (n = 11 unmodified, n = 3 adapted). Notably, the VFI was applied not only in quantitative designs but also in four of six qualitative studies that coded their results using instruments originally intended for quantitative data.
Overall, the majority of studies (n = 59; 74.7%) employed a conceptual approach that allowed for the identification of both non-religious and religious motivational factors and barriers. Sixteen studies (20.3%) were designed to capture only non-religious factors, while four studies (5%) were exclusively open to religious factors.
Statistically, the latter appears to reflect a particularly European perspective, as studies exclusively focused on religious factors were only conducted by authors in the United Kingdom and Belgium (
$ {p}_{\chi^2}<0.05;V\approx 0,52;{r}_{\mathrm{UK}}\approx 3.7;{r}_{\mathrm{Belgium}}\approx 4.4 $
 ). Another significant association exists between content openness and research design (
$ {p}_{\chi^2}<0,01;V\approx 0.37 $
). Another significant association exists between content openness and research design (
$ {p}_{\chi^2}<0,01;V\approx 0.37 $
 ): Quantitative studies show a strong correlation with investigating exclusively non-religious motivational factors and barriers (
$ {r}_{\mathrm{non}-\mathrm{religious}}\approx 4.5 $
): Quantitative studies show a strong correlation with investigating exclusively non-religious motivational factors and barriers (
$ {r}_{\mathrm{non}-\mathrm{religious}}\approx 4.5 $
 ) and exhibit a negative correlation with content openness (
$ {r}_{\mathrm{open}}\approx -4.2 $
) and exhibit a negative correlation with content openness (
$ {r}_{\mathrm{open}}\approx -4.2 $
 ).
).
At the conceptual level, only 24 of the studies (30.4%) employed a comparative approach, distinguishing between subgroups within their datasets. Across these studies, 13 different comparison categories were analyzed. The three most frequently recurring categories were comparisons between Christians and non-religious individuals (n = 6; 7.6%), between different generations (n = 5; 6.3%), and between genders (male/female; n = 5; 6.3%).
Finally, the first coding cycle revealed that 23 studies (29.1%) provided a definition for the construct “motivation.” Of these, 15 studies cited a source for their chosen definition, with only two instances in which two studies referred to the same definition. The definitions corresponded to three sub-constructs of motivation identified in the studies:
-
1. Intrinsic motivation (n = 8)
-
2. Extrinsic motivation (n = 6)
-
3. Christian motivation (n = 1)
Analysis of these definitions in the second coding cycle revealed a relatively consistent meta-concept despite the varied sources. Across all studies, motivation was defined as the driving forces that generate behavior. Depending on the definition used, the specific driving forces varied (see Figure 6). The most common driving force was “desire” (intrinsic: achieving goals; extrinsic: avoiding punishment or obtaining reward). Other predominantly intrinsic driving forces included “need fulfillment” (psychological or social), “pursuit of relief,” “emotional arousal,” and “belief in one’s own efficacy.” For the Christian motivation definition, the driving forces were “obedience” (to God and Christ) and “empowerment” (by the Holy Spirit) (Fong, Reference Fong2021, 50).
Hierarchical code–sub-code model of the definitions of “motivation.” (Meta-concept: yellow; driving forces: blue; specification of driving forces: red).

Fig. 6. Long description
A hierarchical diagram titled Hierarchical Code-Subcode Model. At the top is a yellow tag labeled Driver Producing Behaviour. Six arrows originate from this meta-concept, pointing down to blue driving force tags organized into three blue-bordered boxes.
1. The first box on the left is labeled Intrinsic Motivation. It contains four blue tags: Need for Satisfaction, Seeking Relief, Emotional Arousal, and Agency Beliefs. From Need for Satisfaction, two arrows point down to red sub-code tags: Psychological Functions and Social Functions.
2. The second box on the right is labeled Christian Motivation. It contains two blue tags: Obedience and Empowerment. An arrow from Obedience points down to a red tag labeled To God and Christ. An arrow from Empowerment points down to a red tag labeled By the Holy Spirit.
3. A central vertical arrow from the top meta-concept points down to a third box at the bottom labeled Intrinsic and Extrinsic Motivation. This box contains one blue tag: Desire. Three arrows originate from Desire, pointing down to three red sub-code tags: Get Reward, Reach Goal, and Avoid Punishment.
Mapping of volunteers
To further describe study participants, information on their age, sample size per study, and denominational affiliation was collected. The following results are based on the assigned codes, which are documented in full in Appendix A (Coding Groups II and III).
Regarding participants’ age, only 53 studies (67.1%) reported relevant information. Of these, 25 studies provided exact age ranges, while 28 studies reported only a minimum age. The number of study participants was reported in 96.2% of the studies, ranging from 5 to 14,595 participants. For the 33 qualitative studies, the mean was
$ {\overline{x}}_{\mathrm{qual}}\approx 19 $
 and the median
$ {m}_{\mathrm{qual}}=15 $
and the median
$ {m}_{\mathrm{qual}}=15 $
 . For the quantitative studies, the mean was
$ {\overline{x}}_{\mathrm{quant}}=2343 $
. For the quantitative studies, the mean was
$ {\overline{x}}_{\mathrm{quant}}=2343 $
 and the median
$ {m}_{\mathrm{quant}}=489 $
and the median
$ {m}_{\mathrm{quant}}=489 $
 (see Figure 7).
Box plot distribution of the number of study participants by research design.

Fig. 7. Long description
The figure consists of two side-by-side box plots with teal-colored boxes.
Left Panel: Distribution qualitative.
The Y-axis is labeled Participants and ranges from 0 to 50 with increments of 10. The X-axis is labeled Research Design with the category qualitative. The box spans from approximately 11 to 24 participants, with a median line at 15. The lower whisker extends to 5 and the upper whisker extends to 43. A single outlier is plotted as a circle at approximately 57.
Right Panel: Distribution quantitative.
The Y-axis is labeled Participants and ranges from 0 to 14000 with increments of 2000. The X-axis is labeled Research Design with the category quantitative. The box spans from approximately 250 to 3300 participants, with a median line at 500. The lower whisker extends near 0 and the upper whisker extends to approximately 7200. Three outliers are plotted as circles at approximately 10700, 12100, and 14600.
Two-thirds of the studies (n = 51; 64.6%) reported participants’ denominational affiliation. As far as can be determined, the represented denominations were roughly one-third Catholic, one-third Protestant, and one-third non-denominational churches.
Mapping of volunteer projects
To map the volunteer projects that formed the context of each study, project location and context were coded. Additionally, the projects were synthesized according to the UNV 2020 model (Davis, Reference Davis2020). The following results are based on the assigned codes, which are documented in full in Appendix A (Coding Groups II and III).
Regarding project locations, 65 studies (82.3%) reported this information clearly. Of these, 35 cases (44.3%) were based in the United States and 8 cases (10.1%) in Germany. An additional 13 project locations appeared sporadically, as shown in Figure 8. It is important to note that there is an almost perfect positive correlation between the first author’s country and the project locations studied (
$ {p}_{\chi^2}<0.01;V\approx 0.9\Big) $
 .
.
Relative frequency of project locations as a proportion of the total number of reported locations (n = 60), color-coded for <10% (yellow), >10% (orange), and > 50% (red). The map was created using MapChart: https://www.mapchart.net/world.html.

For 62 of the studies (78.5%), the project context could be determined: 26 studies (32.9%) focused exclusively on civil society engagement, representing the most common context. Another 16 studies (20.3%) examined both civil society and church-based engagement, while 20 studies (25.3%) considered exclusively church-based engagement.
The framework synthesis for the UNV 2020 model yielded a mixed picture (see Figure 9). Regarding the variable “structure,” all examined volunteer projects corresponded to formal volunteering, as dictated by the literature review’s selection criteria. In terms of “aspiration,” 67% of the projects (n = 53) for which this variable could be assigned aimed at community promotion. For all other variables, it can initially be noted that fewer than half of the studies provided relevant information.
Diagrams of the framework synthesis for the UNV 2020 model.

Fig. 9. Long description
The five pie charts are arranged in three rows.
Top-left chart titled Structure.
- 100.0 percent formal in blue.
Top-right chart titled Site.
- 72.2 percent no information in light gray.
- 26.6 percent offline in blue.
- 1.3 percent both in red.
Middle-left chart titled Intensity.
- 55.7 percent no information in light gray.
- 32.9 percent regular in blue.
- 11.4 percent episodic in red.
Middle-right chart titled Aspiration.
- 67.1 percent community-building in blue.
- 32.9 percent no information in light gray.
Bottom-left chart titled Category underscore U N 2020.
- 58.2 percent no information in light gray.
- 40.5 percent service in red.
- 1.3 percent leisure in blue.
For the studies that could be synthesized, the following picture emerges: The “intensity” of the examined projects requires regular, rather than episodic, engagement in 32.9% to 11.4% of cases. All engagement occurs primarily offline (variable “location”). The volunteer projects predominantly fall under the “service” category (40.5%), with only one exception in the leisure sector (Seago, Reference Seago1993).
Discussion
Discussion of Group I: Research format
The increasing frequency and volume of studies on Christian volunteer motivation indicate a growing research field. This aligns with the general trend in volunteer motivation research (Ma & Konrath, Reference Ma and Konrath2018), which extends into the area of Christian volunteer motivation.
Several solid foundations of this emerging field can be noted. First, the geographic distribution of first authors primarily covers German- and English-speaking regions, consistent with the study selection criteria. Second, research designs and methodologies are roughly balanced between qualitative and quantitative approaches, supplemented by mixed-methods studies, showing no notable bias. Third, the theoretical frameworks and research instruments used correspond to common concepts in general volunteer research (VFI and SDT) and are complemented by a wide range of additional frameworks, likely reflecting the diversity of represented disciplines. This results in a reasonable multi-perspectivity in approaching the phenomenon. Fourth, there is substantial content openness: despite many non-theological or non-religious studies, both religious and non-religious aspects are considered equally as motivational factors and barriers.
Against these solid foundations, the review also identifies several potential biases that need to be addressed to clarify current discrepancies and achieve a well-founded understanding of the subject.
First, a low comparability of results is evident. The diversity of research fields, and consequently the range of theoretical frameworks and instruments applied, significantly limit result comparability and thus the synthesis of a growing evidence base. To date, actual comparability is only possible for studies using a functional-psychological framework with the VFI. Therefore, it is important to expand the use of instruments beyond the VFI within functional approaches. This would reduce reliance on a single instrument and address questions regarding the VFI’s suitability in the context of religious motivation research (e.g., Allison et al., Reference Allison, Okun and Dutridge2002). Additionally, increased research using non-functional approaches is necessary. This would provide a dataset for comparing functional and substantive perspectives.
A second issue lies in the absent definition of “motivation.” The mapping above shows that the concept of “motivation” is not explicitly clarified in over 70% of the studies. This is particularly problematic for quantitative studies, which constitute more than half of the dataset, leaving the relationship between the construct “volunteer motivation” and the broader construct “motivation” unresolved. Moreover, the interpretation of results appears to rely on a purely intuitive-associative understanding of “motivation.” The studies lack a critical reflection on whether, and to what extent, the instruments used actually capture the authors’ intuitive-associative conception of motivation and thus whether the data can be interpreted objectively. Future research should therefore provide a more transparent clarification of the underlying understanding of motivation. Additionally, it would be valuable to establish a coherent relationship among the different interpretive perspectives, enabling a multifaceted yet precise description of the phenomenon.
A third issue highlighted by the present mapping is the insufficient engagement with existing research. The data suggest several causes for this weak reception. First, as shown by the forward and backward searches, the discoverability of relevant studies is often limited, as publications in church-based research are sometimes not indexed in standard academic databases (see Chapter 4.4). Second, a significant portion of relevant findings is published in theses and dissertations. The forward and backward searches revealed that these works are rarely, if ever, cited or recognized by the broader research community. Third, theoretical references within individual studies mostly cite research from the same discipline. The field appears structured such that studies primarily feed back into their own disciplinary discourse and literature searches are conducted only within that discourse, despite the review showing that many disciplines engage with the research topic. The limited engagement with existing research in the theoretical sections of the examined studies has several consequences. First, references to and contextualization by prior research are scarce across the various sections of examined studies: Based on weak theoretical reception of prior work, data interpretation occurs in isolation. As a result, the potential strength of multi-perspectivity from the involvement of multiple disciplines remains unused, and claimed desiderata and implications lack contextualization and discourse. For research on the motivation of Christian volunteers, three consecutive steps emerge. First, an assessment of the field’s actual productivity through citation network analysis would be useful, following the approaches of Aksnes and Price (Aksnes et al., Reference Aksnes, Langfeldt and Wouters2019; Price, Reference Price1965). If the results confirm the situation revealed by the mapping, the next step should involve a quality assessment of the existing research in the field (which could not be included in this review due to scope limitations). Subsequently, the studies deemed qualitatively sufficient could be used for a framework synthesis to consolidate and condense the current state of research.
Finally, it is problematic that a misalignment exists between research perspectives, instruments, and the subject matter. At first glance, content openness, that is, the consideration of both non-religious and religious aspects, appears high. However, the results of the scoping review indicate that this openness is more theoretically intended than actually realized.
One reason for this is that, for the overall high proportion of quantitative studies, openness to religious aspects usually arises from one of the following three situations. First, studies include “religion” as a single construct, sometimes represented by a single item, such as “To fulfill religious obligations or beliefs” (Berger, 2006, p. 121). Second, studies differentiate by religious affiliation and then indirectly extrapolate the effect of affiliation on the primarily examined non-religious constructs (Grönlund et al., 2023). Third, studies allow respondents, via “additional analyses” (Jensen, 2016, p. 55), to independently report further motives in text fields—religious aspects were often mentioned this way, but the approach provides limited scope for in-depth analysis. As a result, the actual number of studies enabling an in-depth understanding of religious motivational aspects is smaller than it initially appears.
Another reason is the strong correlation between quantitative research and the study of exclusively non-religious aspects, as well as the negative correlation between quantitative research and content openness. This is partly due to the frequent use of the quantitative VFI, which is an instrument capturing only non-religious aspects. Consequently, religious motivational factors are primarily examined in qualitative settings, significantly limiting representativeness compared with what would be expected from a balanced number of quantitative and qualitative studies.
For future research, this implies that the study of religious motivational aspects needs to expand from primarily qualitative to quantitative approaches. This would not only aid in assessing the representativeness of existing qualitative findings but also improve the differentiation of the construct of religious motivation used in quantitative studies. A challenge for this endeavor is the limited availability of research instruments that allow systematic investigation of religious aspects. Based on the present findings, there is therefore a need to proceed in the opposite manner from what has been observed in some previous studies (Akintola, Reference Akintola2011; Fernandes, Reference Fernandes2017; Tomazos, Reference Tomazos2024): Instead of applying quantitative instruments that may exclude religious aspects to systematize data from qualitative studies, religious motivational aspects identified qualitatively should be quantitatively tested for representativeness and appropriate research instruments developed for this purpose. This is particularly relevant for theology, which is both inherently focused on Christianity and the second-largest discipline in research on Christian volunteer motivation. Rather than relying solely on meta-constructs such as “religious affiliation” or “spiritual satisfaction” (Grönlund et al., 2023, p. 15), theology should translate its nuanced expertise on Christianity into correspondingly differentiated research instruments. The generally high content openness of other disciplines investigating the topic indicates potential interest in these results and opportunities for interdisciplinary collaboration.
Discussion of Group II: Volunteers
The mapping of volunteers surveyed in the studies reveals both positive foundations of existing research and areas of untapped potential.
A positive aspect is that the available sources generally provide good documentation and distribution of fundamental determinants (age, gender, denomination) consistent with solid research practice. This allows for deeper contextualization by comparing various subsamples across multiple studies.
Critically, the broadly collected participant information captures too few variables, leaving untapped potential:
Both, previous research and the results of this scoping review, suggest collecting further personal information that provides insight into participants’ social religiosity. This includes social factors such as upbringing in a Christian-influenced family, frequency of attending religious events, regularity of volunteering, employment status, and significant family responsibilities.
Thus far, their omission results in a lack of necessary contextual information about the study population, limiting the ability to interpret results accurately. For example, in Dageid, “employment” is reported as a central motivational factor. Further data collection on participants, however, revealed that the respondents’ context is shaped by severe unemployment (Dageid et al., 2016, p. 578).
This demonstrates the context dependence of identified motivational factors and the need for more detailed contextual information. Including these aspects in demographic questionnaires at the start of studies would substantially strengthen the data foundation and allow straightforward comparisons across these dimensions. This would better enable investigation of whether, and which, motivational aspects are specifically fulfilled through volunteering.
Discussion of Group III: Volunteer projects
Regarding the information on the studied volunteer project contexts, the present results can hardly be described as a “mapping,” revealing substantial gaps. These gaps concern both the documentation and diversity of a) project locations studied and b) project contexts.
A clear geographic limitation of the studied project locations can be observed: Due to the language restriction of the studies included in the review, the primary location of researchers in English- and German-speaking regions is unsurprising. However, an almost perfect correlation between the first author’s country and the project locations was also observed. This becomes highly problematic for research reception if a language region contains only studies conducted within the same geographic area, with no (e.g., translated) findings from other global regions. Prospectively, better availability of research from other language regions through English translations is needed. However, if the cause of the gap is that the research topic has scarcely been studied in other language and geographic regions, meaning it is not merely a reception problem due to language barriers, then future research should place greater focus beyond Europe and North America. The need for geographic expansion arises primarily from the characteristics of the research subject, “motivation of Christian volunteers.” Christianity is now a globally dispersed religion. While in 1910 over 80% of all members of Christian churches were located in the so-called “Global North” (North America, Europe, Australia, Japan, and New Zealand), by 2010 nearly two-thirds of Christians worldwide resided in the Majority World (Hackett & Grim, Reference Hackett and Grim2011). According to the mapped research status, the data collected for the German- and English-speaking research context exhibit a geographically highly anachronistic distribution, more appropriate for the 19th or early 20th century. Thus, the accessible research is in substantial discrepancy with the actual global distribution of relevant study sites.
Furthermore, the present mapping also reveals a striking deficiency in the consideration of study contexts for the volunteer projects examined. This is discussed below based on the sources’ coding by (i) project context and (ii) according to the UNV 2020 model.
Project Context: Only about half of all studies clearly indicate whether the volunteer work studied is civil society-based or church-based. The remaining studies either do not differentiate or provide no information on the project context. Given the findings on volunteer motivation presented in this scoping review, this lack of differentiation is problematic. For example, Reinke and Zimmerhof, using a typological approach, found that the motivation types identified strongly correlate with the project context of engagement, on a scale from purely church-based to purely civil society-based (Reinke & Zimmerhof, 2016). Considering the diversity of motivational factors identified across studies, it is highly plausible that these do not apply uniformly to all Christian volunteers; rather, dependence on project context is generally likely.
Since only 25.3% of the studies specifically focus on church contexts, generalization of the existing research findings for church leadership purposes is limited. Considering that (at least in the German-speaking context) Christian volunteers are equally active in civil society and church settings (Odermatt, Reference Odermatt2023), church-based volunteering is relatively under-researched.
UN Volunteers 2020 Model Reference Frame: For four of the five “key variables shaping volunteering” identified in the UNV 2020 model (Davis, Reference Davis2020, p. 10), the scoping review reveals a disparate picture (as only formal volunteering was examined, this variable is excluded from consideration): While descriptions of the volunteer project contexts examined provide information on project aspiration in 67,1% of studies, fewer than half report on the variables of location, intensity, or type of activity. The studies that do provide this information present a highly uniform picture: All aspiration data fall under “community development,” all location data fall under “offline,” and with only one exception, all projects are classified as “service” in terms of category.
Four sets of implications follow from this result. First, for policymaking and church leadership, the findings of existing research can only be considered valid for a subset of actual volunteer contexts, so caution is required when applying general regulations. Second, to address this issue, future research on the motivation of Christian volunteers should deliberately include previously neglected contexts (Aspiration: self-development; Location: online; Category: other than “service”).
Second, the review results invite a critical reflection on the UNV 2020 model itself. This raises the question of whether the “neglected contexts” identified in the review are genuinely under-researched or simply represent relatively rare forms of formal volunteering. A statistical examination of the actual distribution of volunteer project contexts would help meaningfully situate the variable spectrum proposed by the model. The results also invite a critical reflection on the model’s productivity itself, at least for the volunteer sector studied. For instance, whether the distinction between “online” and “offline” as a project location is meaningful is debatable, especially in light of media-theoretical considerations (Campbell, Reference Campbell2021).
Third, analogous to the critical reflection of the UNV 2020 model, the review results also suggest a critical evaluation of the “Theory of the New Volunteering” (Seidelmann, Reference Seidelmann, Grab and Meyer-Blanck2016, pp. 50–60), which gained prominence in the German-speaking context toward the end of the last century. The findings on the variable “intensity” are particularly notable: They indicate that predominantly “regular” (rather than “episodic”) volunteering projects have been studied. Given that, according to the Theory of the New Volunteering, engagement should appear far more project-based (Heinze & Olk, Reference Heinze, Olk, Kistler, Noll and Priller1999), the same questions arise as in the previous section: (a) Is project-based episodic volunteering under-researched, (b) does this reflect the actual distribution of volunteering opportunities, or (c) is the Theory of the New Volunteering itself an inadequate model in this context?
Fourth, due to the lack of statistical information on the actual types of volunteer projects offered, it remains unclear whether the proportionally higher share of diaconal projects reflects a research bias toward these projects or the actual distribution of available volunteer opportunities. If a research bias toward diaconal projects is the cause, future research should aim to provide a more comprehensive view of church-based and civil-society volunteer projects. Otherwise, there is a risk that the motivational structures identified primarily among participants in diaconal activities will be directly generalized to other church and societal contexts. This could hinder volunteer recruitment and retention and, consequently, reduce both the satisfaction and effectiveness of engagement. If, however, the higher proportion of diaconal projects reflects the actual availability of volunteer opportunities, it remains to be asked whether this outcome mirrors the interests of potential Christian volunteers or results from a structural limitation of church and societal participation options. If church and societal volunteer opportunities potentially limit non-professional engagement primarily to the diaconal field, a significant portion of volunteers’ potential motivational aspects remains unaddressed. It must be noted for practice: The application of existing research findings in church leadership should again be approached with caution regarding generalization.
Limitations
The study is subject to both methodological and content-analytical limitations. Methodologically, the discoverability of relevant sources was challenged by the partial lack of indexing, especially for church-related publications. Additionally, access to potential sources was limited by technical issues (ProQuest database errors affecting 100 potential sources), limited digitization of older sources, and licensing restrictions through the University of Bonn. Lastly, while complementing the keyword-based search with snowballing and citation-search procedures increased the number of identified sources, the possibilities for reporting this process are limited (Hiebl, Reference Hiebl2023). Thus, this part of the search process is only reconstructable to a limited extent.
On the content-analytical side, limitations include that only a single coder was available for the process of elaborative coding of motivation definitions. Furthermore, the interpretation of the collected results is partly constrained by the absence of comprehensive data on the actual availability of volunteer projects, which would have allowed a precise determination of potential biases in previous research approaches.
Conclusion and outlook for future research
To facilitate future field building and effective application of prior research results, this paper examines why findings at the intersection of volunteering, motivation, and religion often appear contradictory or disjunct. Approaching the field of Christian volunteer motivation from a science-of-science perspective, we conducted a scoping review: Of 2,485 potentially relevant contributions, a three-stage co-screening process yielded 79 English- and German-language sources for analysis.
We identify three main reasons why results diverge:
-
1. First, the engagement with the subject across a broad range of disciplines leads to limited comparability between studies (divergent frameworks and instruments), over 70% of the studies do not define “motivation” explicitly, and the studies in general show insufficient engagement with existing scholarship.
-
2. Second, an instrument–phenomenon mismatch exists: Widely used tools (e.g., VFI) omit religious items, pushing religious motives into qualitative designs and limiting representativeness.
-
3. Third, studies are systematically missing context. Key participant variables that likely correlate with motivation (Christian family background, frequency of religious participation, regularity of volunteering, employment status, and major family responsibilities) are neglected. Similarly, project-context variables (especially the UNV 2020’s “key variables shaping volunteering” (Davis, Reference Davis2020, p. 10) Site, Intensity, or Category) are underreported and skew toward offline (Site), regular (Intensity), and service (Category).
For practice and policymaking, this emphasizes the need to apply findings with context matching: The evidence base is concentrated geographically (notably the United States and Germany with strong author–site colocation) and underrepresents church-only contexts (25.3% of studies).
For further research, field building would benefit from: (i) explicit definitions of motivation and declared analytical lenses; (ii) alignment of instruments with religious content (including quantitative items for religious motives); (iii) routine reporting of participant and UNV project-context variables; and (iv) broader sampling beyond Europe/North America and beyond regular, offline, service roles. These steps address the specific sources of divergence identified here and enable more cumulative synthesis.
Acknowledgements
The help of Yasutthera Raban, University of Bonn, in co-coding the first cycle of the selected sources was much appreciated.
Author contribution
Conception and design as well as material preparation and data collection were conducted by Johannes Fröh. Screening was conducted by Stefanie Fröh and Johannes Fröh, while further analysis was performed and the first draft of the manuscript was written by Johannes Fröh. All authors aided in the translation of and commented on previous versions of the manuscript. All authors read and approved the final manuscript.
Funding statement
The research was supported by the Zentrum für Kirchenentwicklung at the University of Zurich (UZH) through the funding of a doctoral position as part of the project “Wahrnehmung von Motivationen und Stärkung von Freiwilligenarbeit im Rahmen kirchgemeindlicher Innovation und Umbauprozesse.”
Competing interests
The authors declare that they have no known competing financial interests or personal relationships that could have appeared to influence the work reported in this paper.
A. Appendix
Exclusion criteria
Based on the selection criteria described in Section “Eligibility criteria,” eight exclusion criteria for the screening process were subsequently formulated. These are:
-
1. Non-Christian: Studies were excluded if it was not clearly identifiable that the study participants and/or co-researchers could be attributed as “Christian.” This did not mean that all study participants and co-researchers had to be Christian, but rather that the presentation of results had to make it clear which aspects of the investigated motivational factors and barriers applied to the Christian part of the study population.
-
2. Non-voluntary: Studies that did not focus on volunteers were excluded. The frequently debated borderline case of “service learning”Footnote 1 was also excluded, as it is “part of instruction and closely linked to academic learning” (Seifert et al., Reference Seifert, Zentner and Nagy2012, p. 13), allowing only a very limited scope for individual volunteer motivation.
-
3. Not related to volunteer motivation: Studies were excluded that either did not address volunteer motivation or merely referenced the results of other studies without making an original research contribution on the topic.
-
4. Informal volunteering: Studies on informal volunteering were excluded.
-
5. Incorrect volunteering context: Studies were excluded if the examined volunteer projects were clearly not situated within the realm of church-based or civil society engagement.
-
6. Non-empirical: Studies that were purely non-empirical were excluded.
-
7. Inappropriate publication format: Studies were excluded if they originated from the field of grey literature or represented multiple publications or re-analyses of the same research data.Footnote 2 In the latter case, the publication containing the most comprehensive information was included. Studies whose data had already been partially included in the scoping review through other publications were only considered if the presentation of results clearly distinguished between data sources, ensuring that only the previously unconsidered research data were included in the analysis.Footnote 3
-
8. Incorrect language: Studies that were not available in German or English were excluded.
For exclusion criteria 1 and 2, a restriction was applied to quantitative studies: In some cases, studies with a not exclusively Christian study population or with participants not exclusively engaged in volunteering had to be excluded, as the presentation of results did not differentiate according to the categories relevant for the review.Footnote 4 However, studies whose population met at least 95% of the required criteria were still included, as the potential error regarding the research question was considered not significant at p < 0.05.
ProQuest databases used
Step 1 of the search strategy:
British Periodicals, Digital National Security Archive, ERIC, International Bibliography of the Social Sciences (IBSS), Library & Information Science Abstracts (LISA), PAIS Index, Periodicals Archive Online, Periodicals Index Online, ProQuest Dissertations & Theses Global: The Humanities and Social Sciences Collection, PTSDpubs, Sociological Abstracts, Sports Medicine & Education Index, The Annual Register: A Record of World Events, Worldwide Political Science Abstracts.
Step 2 of the search strategy—used for the main search cycle on August 1, 2024:
Acta Sanctorum, African Writers Series, Annual Bibliography of English Language and Literature (ABELL), Annual Bibliography of English Language and Literature (ABELL), The Annual Register: A Record of World Events (1758–current), ARTbibliographies Modern (ABM) (1974–current), ARTbibliographies Modern (ABM) for DFG, Bertolt Brechts Werke, Bertolt Brechts Werke, Black Short Fiction and Folklore, Black Women Writers, British Periodicals (1681–1939), C19: The Nineteenth Century Index, Caribbean Literature, Coronavirus Research Database, Die Deutsche Lyrik in Reclams Universal-Bibliothek, Digitale Bibliothek Deutscher Klassiker, Digital National Security Archive, Early Modern Books, Early English Books Online, Ebook Central, Ebook Central, ERIC (1966–current), Gerritsen Women’s History Collection of Aletta H. Jacobs, Goethes Werke, International Bibliography of Art (IBA), International Bibliography of the Social Sciences (IBSS) (1951–current), Irish Women Poets of the Romantic Period, Kafkas Werke, Latin American Women Writers, Latino Literature: Poetry, Drama, and Fiction, Library & Information Science Abstracts (LISA) (1969–current), Literature Online, Luthers Werke, PAIS Index (1914–current), Patrologia Latina, Periodicals Archive Online, Periodicals Index Online, ProQuest Dissertations & Theses Global: The Humanities and Social Sciences Collection (1637–current), ProQuest Historical Newspapers: The Boston Globe (1872–1927), ProQuest Historical Newspapers: Chicago Tribune (1849–1922), ProQuest Historical Newspapers: The Guardian and The Observer (1791–1900), ProQuest Historical Newspapers: The Jewish Advocate (1905–1990), ProQuest Historical Newspapers: The Jewish Exponent (1887–1990), ProQuest Historical Newspapers: Los Angeles Times (1881–1922), ProQuest Historical Newspapers: The New York Times (1851–1922), ProQuest Historical Newspapers: The Wall Street Journal (1889–1922), ProQuest Historical Newspapers: The Washington Post (1877–1922), PTSDpubs (1871–current), Publicly Available Content Database, Schillers Werke, Scottish Women Poets of the Romantic Period, Sociological Abstracts (1952–current), South and Southeast Asian Literature in English, Sports Medicine & Education Index (1970–current), Teatro Español del Siglo de Oro, Worldwide Political Science Abstracts (1909–current).
Step 2 of the search strategy—used for an updating search cycle on February 20, 2026:
Acta Sanctorum; African Writers Series; Annual Bibliography of English Language and Literature (ABELL); ARTbibliographies Modern (ABM); ARTbibliographies Modern (ABM) for DFG; Bertolt Brechts Werke; British Periodicals; C19: The Nineteenth Century Index; Coronavirus Research Database; Die Deutsche Lyrik in Reclams Universal-Bibliothek; Digitale Bibliothek Deutscher Klassiker; Digital National Security Archive; Early Modern Collection; Ebook Central; Education Research Index; Gerritsen Women’s History Collection of Aletta H. Jacobs; Goethes Werke; International Bibliography of Art (IBA); Kafkas Werke; Library & Information Science Abstracts (LISA); Literature Online; Luthers Werke; Patrologia Latina; Periodicals Archive Online; Periodicals Index Online; ProQuest Dissertations & Theses Global: The Humanities and Social Sciences Collection; ProQuest Historical Newspapers: Chicago Tribune; ProQuest Historical Newspapers: Los Angeles Times; ProQuest Historical Newspapers: The Boston Globe; ProQuest Historical Newspapers: The Guardian and The Observer; ProQuest Historical Newspapers: The New York Times; ProQuest Historical Newspapers: The Wall Street Journal; ProQuest Historical Newspapers: The Washington Post; PTSDpubs; Publicly Available Content Database; Schillers Werke; Teatro Español del Siglo de Oro
Search queries for all databases
Search terms used for each database and comments on the execution of the search. These do not include “spirituality” as a search term as the first search step (inductive evaluation for key terms based on pertinent studies) did not yield any significant improvement in search output

Table A1. Long description
The table is divided into four primary sections based on the database used:
1. ProQuest: Uses the N O F T field tag. The string combines terms for volunteering (e.g., Volunteer asterisk, lay ministry, Ehrenamt asterisk), motivation (e.g., motivation asterisk, M T V, barrier question mark), and religious context (e.g., church, Christian, F B O, C R O, Kirche). It includes German and English synonyms.
2. Scopus: Uses the T I T L E dash A B S dash K E Y field tag. The string is similar to ProQuest but formatted for Scopus syntax. A comment notes that German umlauts must be literals in quotation marks, though asterisk wildcards work for terms like religio asterisk.
3. Wiley Online Library: The search is restricted to the Abstract field. The string uses explicit OR and AND operators between term clusters. A comment explains that the search was limited to abstracts to avoid over 200,000 hits from full-text searches. It also notes technical issues where the asterisk functioned as a 0 or 1 character wildcard and the question mark had no function.
4. Index Theologicus: Uses the All Fields tag. The string manually lists variations like Ehrenamtliche, Ehrenamtlicher, and Ehrenamtler because the asterisk wildcard was unreliable. A comment notes that only English plurals were automatically recognized, requiring manual entry of German plural forms.
Coding characteristics
The coding characteristics shown in Table A2 were used for the first coding cycle. Attribute-coded categories were assigned one of two code types: The code type “Open” refers to categories whose sub-codes were determined from the studies themselves (e.g., sub-code “Germany” in the category “Country of Researchers”). The code type “Closed” refers to categories whose sub-codes were predefined and only assigned (e.g., sub-code “quantitative” in the category “Research Design”). Structurally coded categories were assigned the code type “Structural.”
Overview of the coding characteristics used for Coding Cycle 1, with code categories (bold) and sub-codes (indented)

Table A2. Long description
The table is divided into three primary sections.
Group I: Research format
- Publication year: Year of the study’s publication. Type-Code: Open.
- Publication type: Scientific publication format (Journal article, Monograph, Book chapter, Dissertation). Type-Code: Closed.
- Country of researchers: Country of the first author’s research institution. Type-Code: Open.
- Field/discipline: Field or faculty of the first author. Type-Code: Open.
- Research design: Quantitative, qualitative, or mixed-methods. Type-Code: Closed.
- Research method: Method used (e.g., interview, survey). Type-Code: Open.
- Theoretical framework: Perspective or model applied (e.g., self-determination theory). Type-Code: Open.
- Research instrument: Instruments used for surveys. Type-Code: Open.
- Content orientation: Open/both, exclusively non-religious, or exclusively religious. Type-Code: Closed.
- Comparative approach: Categories if a comparative approach is used. Type-Code: Open.
- Definition of motivation: Motivation definition used in the study. Type-Code: Structural.
Group II: volunteers
- Age range: Age of volunteers in the study population. Type-Code: Open.
- Number: Number of volunteers in the study population. Type-Code: Open.
- Denomination: Denominational affiliation of volunteers. Type-Code: Open.
Group III: volunteer projects
- Project location: Location of examined volunteer projects. Type-Code: Open.
- Context: Sponsorship or organizational context (Civil society, Church, Both). Type-Code: Closed.
- Type: Coding based on the U N Volunteers 2020 model including Structure (informal/formal), Place (online/offline/both), Intensity (regular/episodic), Aspiration (community-building/self-development), and Category (leisure/participation/recruitment/service/mutual aid). Type-Code: Closed.
For the second coding cycle, the coding characteristic listed in Table A3 was defined. This corresponds to the identically named characteristic structurally coded in the first cycle, with the difference that the categories were now openly coded using elaborative coding.
Coding characteristic used for Coding Cycle 2, with code category (bold)

Table A3. Long description
The table consists of three columns: Code category, Description, and Type-Code.
Row 1: The header row contains the labels Code category, Description, and Type-Code.
Row 2: A spanning row across all three columns identifies Group I: research format.
Row 3: Under the Code category column is the bolded text Definition of motivation. The corresponding Description is Motivation definition used in the study. The Type-Code is listed as Open.
List of identified sources
Akintola, O. (2011). What motivates people to volunteer? The case of volunteer AIDS caregivers in faith-based organizations in KwaZulu-Natal, South Africa. Health Policy and Planning, 26(1), 53–62. https://doi.org/10.1093/heapol/czq019
Batson, C. D., Oleson, K. C., Weeks, J. L., Healy, S. P., Reeves, P. J., Jennings, P., & Brown, T. (1989). Religious prosocial motivation: Is it altruistic or egoistic? Journal of Personality and Social Psychology, 57(5), 873–884. https://doi.org/10.1037/0022-3514.57.5.873
Bellamy, J., & Leonard, R. (2015). Volunteering Among Church Attendees in Australia. In L. Hustinx, J. von Essen, J. Haers, & S. Mels (Eds.), Religion and Volunteering: Complex, contested and ambiguous relationships (pp. 121–143). Springer International Publishing. https://doi.org/10.1007/978-3-319-04585-6_7
Berger, I. E. (2006). The influence of religion on philanthropy in Canada. Voluntas: International Journal of Voluntary and Nonprofit Organizations, 17(2), 110–127. https://doi.org/10.1007/s11266-006-9007-3
Bragg, R. F. (2013). A study of the functional motivation of boomers and older adults who volunteer through church. Ed.D., Dallas Baptist University. https://www.proquest.com/docview/1494527755/abstract/F56921D86BDA44FFPQ/1
Browning, K. (2022). Church volunteers’ perceptions of organizational leadership factors influencing intention to stay. Ph.D., Indiana Wesleyan University. https://www.proquest.com/docview/2703358371/abstract/E0859B27E2454952PQ/1
Brummer, A., & Freund, A. (2008). Freiwilliges Engagement: Motive—Bereiche—Klassische und neue Typen. In J. Hermelink & T. Latzel (Eds.), Kirche empirisch. Ein Werkbuch zur vierten EKD-Erhebung über Kirchenmitgliedschaft und zu anderen empirischen Studien. Gütersloher Verlagshaus.
Cepeda-Russell, P. M. (2021). The impact of short-term mission trips on religiosity and motivations for helping in college students. Ed.D., Liberty University. https://www.proquest.com/docview/2531294287/abstract/7AC622C530DD48A5PQ/1
Choi, S.-H. (2013). The impact of religious volunteering on faith: Perceptions of first-generation Korean-American elderly. [Doctoral dissertation, Trinity International University]. https://www.proquest.com/docview/1431983350/abstract/7B53A8A5D8624CF1PQ/1
Clerkin, R. M., & Swiss, J. E. (2013). Religious motivations and social service volunteers: The interaction of differing religious motivations, satisfaction, and repeat volunteering Clerkin. Interdisciplinary Journal of Research on Religion, 9, 19.
Curtis, D., Cnaan, R. A., & Evans, V. (2014). Motivating mormons: An analysis of what motivates members of the Church of Jesus Christ of Latter-day Saints to volunteer and donate. Nonprofit Management and Leadership, 25(2), 131–145. https://doi.org/10.1002/nml.21113
Dageid, W., Akintola, O., & Sæberg, T. (2016). Sustaining motivation among community health workers in aids care in Kwazulu-Natal, South Africa: Challenges and prospects. Journal of Community Psychology, 44(5), 569–585. https://doi.org/10.1002/jcop.21787
Denning, S. (2021). Religious faith, effort and enthusiasm: Motivations to volunteer in response to holiday hunger. Cultural Geographies, 28(1), 57–71. https://doi.org/10.1177/1474474020933894
Domaradzki, J., & Walkowiak, D. (2021). Does religion influence the motivations of future healthcare professionals to volunteer during the COVID-19 pandemic in Poland? An exploratory study. Journal of Religion and Health, 60(3), 1507–1520. https://doi.org/10.1007/s10943-021-01231-8
Domingo, J. J. L. (2011). From pulpit to practice: A qualitative cross-disciplinary exploration of the factors within a faith-based community that contribute towards sustained urban renewal [Ed.D., Argosy University/Seattle]. https://www.proquest.com/docview/883387047/abstract/7E811DA9B7CD46D2PQ/1
Dunaetz, D. R., & Bocock, J. (2020). Ministry involvement of church staff and volunteers: The role of organizational commitment and work engagement (SSRN Scholarly Paper 3683271). Social Science Research Network. https://papers.ssrn.com/abstract=3683271.
Evangelische Kirche in Deutschland. (2023). Wie hältst du’s mit der Kirche? Zur Bedeutung der Kirche in der Gesellschaft. Erste Ergebnisse der 6. Kirchenmitgliedschafsuntersuchung. Evangelische Verlagsanstalt.
Fernandes, V. J. (2017). Volunteer motivation, organizational commitment, and engagement: Knights of Columbus explanatory case study [D.M., University of Phoenix]. https://www.proquest.com/docview/2027315076/abstract/D7EF1B12F4564A48PQ/1
Fogarty, S. G. (2013). The impact of senior pastor leadership behaviors on volunteer motivation [Ph.D., Regent University]. https://www.proquest.com/docview/1420266115/abstract/82421195649D4C77PQ/1
Fong, S. (2021). A qualitative descriptive study of how Christians are motivated to volunteer [Ed.D., Grand Canyon University]. https://www.proquest.com/docview/2514705304/abstract/77D26C7DA8ED45F3PQ/1
Garland, D. R., Myers, D. R., & Wolfer, T. A. (2009). Protestant Christian volunteers in community social service programs: What motivates, challenges, and sustains their service. Administration in Social Work, 33(1), 23–39. https://doi.org/10.1080/03643100802508627
Graakjær-Hjort, B., & Skræddergaard, K. B. (2022). Fellowship as driving force: Volunteering in the Evangelical Lutheran Church in Denmark. Studia Theologica—Nordic Journal of Theology, 76(2), 130–149. https://doi.org/10.1080/0039338X.2021.1939781
Gray, C. A. (2003). A naturalistic investigation of voluntary service in faith -based adult literacy programs: Altruism, education, and spiritual development [Ed.D., Northern Illinois University]. https://www.proquest.com/docview/305315167/abstract/39C29AA4856944F1PQ/1
Grell, D. (2023). Pursuing Jesus Christ until we meet him face-to-face: A Biblical and Theological challenge to retired baby boomers to become transformed disciples of Jesus Christ who faithfully serve him in the context of their local church [D.Min., Biola University]. https://www.proquest.com/docview/2808449826/abstract/3ECCDF4AEA74D71PQ/1
Grönlund, H., Cnaan, R. A., Kang, C., Yamauchi, N., Compion, S., & Butcher, J. (2023). Religion and episodic volunteering. Voluntary Sector Review, 14(1), 62–83. https://doi.org/10.1332/204080521X16352770684838
Heist, H. D., Cnaan, R. A., Sportmann, A. S. R., & Evans, V. C. (2022). The emigration of pro-social behaviors: A comparative analysis of Colombian and US Latter-day Saints. VOLUNTAS: International Journal of Voluntary and Nonprofit Organizations, 33(1), 173–187. https://doi.org/10.1007/s11266-020-00243-4
Hustinx, L., Van Rossem, R., Handy, F., & Cnaan, R. A. (2015). A cross-national examination of the motivation to volunteer. In L. Hustinx, J. von Essen, J. Haers, & S. Mels (Eds.), Religion and Volunteering: Complex, contested and ambiguous relationships (pp. 97–120). Springer International Publishing. https://doi.org/10.1007/978-3-319-04585-6_6
Jensen, B. (2016). Reasons they serve: Older adults’ motivations to volunteer in faith-based organizations [Ph.D., Colorado State University]. https://www.proquest.com/docview/1820076358/abstract/8F16E9D06BBF4F40PQ/1
Johnson, J. A. (2007). Getting and staying involved: What motivates volunteers in a non-profit organization [Ph.D., Capella University]. https://www.proquest.com/docview/304720694/abstract/1DD7142DC14348ECPQ/1
Johnson, K. (2012). From beliefs to virtuous behaviors: The influence of god-concepts on intentions to volunteer [Ph.D., Arizona State University]. https://www.proquest.com/docview/1034448585/abstract/83494FEC5FB14703PQ/1
Johnson, K. A., Cohen, A. B., & Okun, M. A. (2016). God is watching you…but also watching over you: The influence of benevolent God representations on secular volunteerism among Christians. Psychology of Religion and Spirituality, 8(4), 363–374. https://doi.org/10.1037/rel0000040
Kelley, L. D. (2019). Volunteer motivation for Catholics: Volunteers at a Catholic Church in Central Arizona [Ed.D., Grand Canyon University]. https://www.proquest.com/docview/2181636697/abstract/ADF83C00FDF34E3APQ/1
Kelly Wicker, K. L. (2023). Improving volunteerism through a narrative inquiry of the Black volunteer perspective [Ed.D., University of Dayton]. https://www.proquest.com/docview/2915913867/abstract/3704646811C647AEPQ/1
King, A. C. (2023). A case study of the faith motivations of clergy, staff and volunteers in church social action. University of Huddersfield.
König, J., & Maschke, D. (2014). Ehrenamtlichkeit in der Evang.-Luth. Kirche in Bayern: Abschlussbericht. Institut für Praxisforschung und Evaluation der Evangelischen Hochschule Nürnberg. https://kidoks.bsz-bw.de/frontdoor/index/index/docId/1598
König, J., Maschke, D., & Schröder, A. M. (2023). Ehrenamt in der Evang.-Luth. Kirche in Bayern: Zwischenbericht 1. Phase: Quantitative Online-Befragung Zentrale Ergebnisse. Institut für Praxisforschung und Evaluation der Evangelischen Hochschule Nürnberg.
Kpanake, L., Dounamou, T., Sorum, P. C., & Mullet, E. (2019). What motivates individuals to volunteer in Ebola epidemic response? A structural approach in Guinea. Human Resources for Health, 17(1), 81. https://doi.org/10.1186/s12960-019-0409-x
Lawson, L. S. (2008). A description of motivational factors and voluntary giving in a Christian community based organization (Vol. 70, Issues 3-A, p. 1033). Tulane University.
Lewis, N. (2026). Christian Church volunteers’ experiences of serving their community post COVID-19 pandemic [Ph.D., Grand Canyon University]. https://www.proquest.com/docview/3297650963/abstract/FD55BF3F74724473PQ/1.
Locke, K. J. (2002). Self-transcendence in relation to self-actualization and the effect on motivation in the church [Ed.D., The Southern Baptist Theological Seminary]. https://www.proquest.com/docview/305520050/abstract/E8B8FB63B8F04FC4PQ/1
Louw, D. (2022). Organizational climate factors that impact volunteer retention in a faith-based NPO in New York City [D.Min., Lancaster Bible College]. https://www.proquest.com/docview/2708837344/abstract/2E2D5DC19ECA48FEPQ/1
Maran, D. A., & Tirassa, M. (2023). Religious orientation and motivations in a sample of Italian catholic volunteers. Fieldwork in Religion, 18(1), 127–149. https://doi.org/10.1558/firn.25269
Mayer, H. A. (1999). A study of volunteer motivation at Flamingo Road Church, Fort Lauderdale, Florida [Ed.D., University of Sarasota]. https://www.proquest.com/docview/304548209/abstract/3CD73788768C46ADPQ/1
Mayes, B. S. (2023). Examining Church volunteer retention and service time through a self-determination lens [D.P.A., Valdosta State University]. https://www.proquest.com/docview/2917407975/abstract/675EF6F8EC174DDCPQ/1
McBath, G. L. (2014). Comprehending Collegiate volunteer experiences post-September 11, 2001: A hermeneutic phenomenological study [Ph.D., Northcentral University]. https://www.proquest.com/docview/1559212146/abstract/46A5DA4AE1AB4C97PQ/1
McDonald, Y. H. V. (2016). Restorative justice: Transformation Project Prison Ministry’s reason for growth and motivation of the volunteers [D.Min., Asbury Theological Seminary]. https://www.proquest.com/docview/1818474057/abstract/3DCC0F085AA4389PQ/1
McNutt, M. (2025). Exploring factors influencing long-term volunteer engagement and retention in student ministry [D.Min., Eastern University]. https://www.proquest.com/docview/3202650195/abstract/8F50B886436944CBPQ/1.
Moore, L. (2019). Volunteerism and church members: Connecting self-determination theory and participation in the Black Church [Ed.D., Ashland University]. https://www.proquest.com/docview/2760532190/abstract/2ABC2A7A11DF45B5PQ/1
Muers, R., & Britt, T. (2012). Faithful untidiness: Christian social action in a British City. International Journal of Public Theology, 6(2), 205–227. https://doi.org/10.1163/156973212X634939
Muralidharan, S. (2023). Mediating roles of karma and self-enhancement in the effect of religious and spiritual primes on bystanders’ reporting intention. International Journal of Consumer Studies, 47(1), 189–201. https://doi.org/10.1111/ijcs.12820
Ndambuki, R. N., & Wilson, J., & Machira, C. G. (2025). Personal factors influencing volunteer retention in the Word of Faith Churches in Kenya. International Journal of Research and Innovation in Social Science, IX(IV), 2821–2830. https://doi.org/10.47772/IJRISS.2025.90400208.
Ndambuki, R. N., & Wilson, J., & Machira, C. G. (2025). Relationship between authentic leadership and volunteer retention in word of faith churches in Kenya. International Journal of Research and Innovation in Social Science, IX(II), 1040–1050. https://doi.org/10.47772/IJRISS.2025.9020083.
Ochola-Adolwa, L. (2017). A study of the macro, social and psychological factors that influence the civic participation practices of Christians at Mavuno Church, Nairobi, Kenya[D.I.S., Fuller Theological Seminary, School of Intercultural Studies]. https://www.proquest.com/docview/1914683819/abstract/484F7C08E11945EEPQ/1
Osei, S. R. (2021). Volunteers’ motivation and spiritual capital at a Black Baptist Church: A qualitative descriptive study [Ed.D., Grand Canyon University]. https://www.proquest.com/docview/2563840501/abstract/5D0A014D8704DFFPQ/1
Porkka, J. (2019). The young confirmed volunteers of the Evangelical Lutheran Church of Finland: Motivation, religiosity, and community. University of Helsinki.
Ralston, S. J. (2018). Functional motivations to volunteer in Northern Utah’s non-Mormon Christian Congregations [Ed.D., Grand Canyon University]. https://www.proquest.com/docview/2065190434/abstract/3952C950D0B43E3PQ/1
Reihs, S. (2000). Zur Motivation ehrenamtlicher Mitarbeiterinnen und Mitarbeiter in der Kirche. In I. Lukatis, R. Sommer, & C. Wolf (Eds.), Religion und Geschlechterverhältnis (pp. 157–169). VS Verlag für Sozialwissenschaften. https://doi.org/10.1007/978-3-322-99439-4_12
Reinke, T., & Zimmerhof, C. (2016). Ehrenamtliches Engagement im Bistum Speyer: Eine Typologie zu Motivation, Merkmalen und Rahmenbedingungen. Zentrum für angewandte Pastoralforschung.
Ridley, L. E. (2015). Motivational factors promoting postmodern volunteerism in Christian religious organizations [Ph.D., University of Phoenix]. https://www.proquest.com/docview/1724665046/abstract/94DFF2C2593D483APQ/1
Saunders, B. (2020). Christian international volunteering: Unpacking motivations and engagements with poverty, injustice and inequality. Aberystwyth University.
Schendel, G. (2023). Lektor:innen und Prädikant:innen—semiprofessionelle und qualifizierte Ehrenamtliche als Treiber kirchlicher Veränderung. Pastoraltheologie, 112(7), 293–316. https://doi.org/10.13109/path.2023.112.7.293
Seago, T. (1993). Motivational factors influencing participation in selected Southern Baptist church choirs [Ed.D., University of Houston]. https://www.proquest.com/docview/304059186/abstract/ABCAB93F613A4A1FPQ/1
Seidelmann, S. (2016). Altruismus, Geselligkeit, Selbstentfaltung: Motive Ehrenamtlicher in der evangelischen Kirche. Ed. W. Gräb & M. Meyer-Blanck (1st ed.). Verlag Herder.
Sherrer, J. B. (1999). Continued volunteerism by adult Sunday school teachers: A comparison of motivational functions [Ed.D., Oklahoma State University]. https://www.proquest.com/docview/304554216/abstract/DEAD105CAE4147AFPQ/1
Sinnemann, M. (2017). Engagement mit Potenzial: Sonderauswertung des vierten Freiwilligensurveys für die evangelische Kirche. creo-media.
Sinnemann, M. (2022). Kirche, Religion und Engagement in der Zivilgesellschaft: Sonderauswertung des fünften Freiwilligensurveys (1st ed.). Nomos.
Sloan, J. V. (2018). A causal-comparative study of generational differences in functional motivations to volunteer for religious organizations. [Ph.D., Grand Canyon University]. https://www.proquest.com/docview/2139396480/abstract/8EB920B0ECA640A5PQ/1
Smith, J. R. (2023). A thematic analysis of religious identity and volunteer motivation among emerging adult members of the church of Jesus Christ of Latter-Day Saints [Ph.D., Mississippi State University]. https://www.proquest.com/docview/2903837078/abstract/AA26D746C8924F4APQ/1
Stacer, M. J., & Roberts, M. R. (2018). “Reversing the trend”: The role of mentoring in offender reentry. Journal of Offender Rehabilitation, 57(1), 1–21. https://doi.org/10.1080/10509674.2017.1416439
Tomazos, K. (2024). Angels of the night: Exploring street-aid volunteer tourists and faith-based volunteer tourism. Tourism Recreation Research, 49(4), 683–698. https://doi.org/10.1080/02508281.2022.2089818
Wade, J. A. (2016). Initial and long-term homeless shelter volunteerism: An interpretative phenomenological analysis study[Ph.D., Walden University]. https://www.proquest.com/docview/1841908656/abstract/9A3FBEFBD706458FPQ/1
Weatherspoon Willis-Jones, T. (2014). Motivations for volunteering in a faith-based mentoring program [Walden University]. https://scholarworks.waldenu.edu/dissertations/78
Weber, V. E. (2017). The voices of megachurch volunteers in short-term missions (STM) work: A phenomenological study [Ph.D., Fielding Graduate University]. https://www.proquest.com/docview/1884295458/abstract/D1D07201DB32441BPQ/1
Wolfer, T. A., Myers, D. R., Polson, E. C., & Bevis, B. (2017). Baby boomers as congregational volunteers in community ministry. Religions, 8(4), Article 4. https://doi.org/10.3390/rel8040066
Woodstock, J. G. (1998). A study of volunteer teachers in the mid-week young adult religious education program of the Church of Jesus Christ of Latter-Day Saints [Ph.D., University of Wyoming]. https://www.proquest.com/docview/304458423/abstract/4AB32AC9697A4E9DPQ/1
Yeung, A. B. (2004). The octagon model of volunteer motivation: Results of a phenomenological analysis. Voluntas: International Journal of Voluntary and Nonprofit Organizations, 15(1), 21–46. https://doi.org/10.1023/B:VOLU.0000023632.89728.ff
Yoon, A. (2025). Critical influences on the recruitment and retention of volunteer Sunday school teachers [Ph.D., Lancaster Bible College]. https://www.proquest.com/docview/3234435652/abstract/5F765AA756CD4815PQ/1.
Zollo, L., Ciappei, C., Faldetta, G., & Pellegrini, M. M. (2022). Does religiosity influence retention strategies in nonprofit organizations? VOLUNTAS: International Journal of Voluntary and Nonprofit Organizations, 33(2), 284–296. https://doi.org/10.1007/s11266-020-00293-8
Coding Group I
Coding of Group I. In addition to each coded study, the categories of Group I are included with the following abbreviations: Publication Year (Year); Publication Type (Type, where J = Journal Article, C = Book Chapter, D = Dissertation, M = Monograph); Country of Researchers (Country); Research Design (Design, where qual = qualitative, quant = quantitative, mm = mixed-methods); Research Method (Method); Theoretical Framework (Framework); Research Instrument (Instrument); Content Orientation (Orientation, where o = open/both, er = exclusively religious factors, enr = exclusively non-religious factors); Comparative Approach (Approach). For research instruments, the abbreviations used in the studies are applied where specified. A list of abbreviations for the instruments is provided in Appendix A (Research instruments used by sources and their abbreviations)

Table A4. Long description
The table contains 12 columns: Author, Year, Type, Country, Discipline, Design, Method, Concept, Instrument, Open, Approach, and Definition of motivation.
Key entries include:
* Akintola (2011): South Africa, Psychology, qualitative, Interview/group discussion, Functional Psychology, open orientation, focused on psychological and social needs satisfaction.
* Batson et al. Study 1 (1989): United States, Psychology, quantitative, Laboratory experiment, religious orientation, comparing Christian versus non-religious.
* Bellamy and Leonard (2015): Australia, Public administration, quantitative, Survey, Functional Psychology, V F I instrument.
* Brummer and Freund (2008): Germany, Practical Theology, quantitative, Survey, K M U instrument.
* Choi (2013): United States, Educational Studies, qualitative, Interview.
* Dageid et al. (2016): Norway, Psychology, qualitative, Interview.
* Domaradzki and Walkowiak (2021): Poland, Social Sciences, quantitative, Survey, exclusively non-religious factors.
* Evangelische Kirche in Deutschland (2023): Germany, Practical Theology, quantitative, Survey, K M U instrument.
* Fong (2021): United States, Educational Studies, qualitative, Interview/Survey, Self-Determination Theory S D T, focused on obedience to God and Christ.
* Heist et al. (2022): Finland, Public Administration, quantitative, Survey, comparing United States versus Colombia.
* Maran and Tirassa (2023): Italy, Psychology, quantitative, Survey, Functional Psychology, V M Q instrument.
* Porkka (2019): Finland, Diaconal Studies, quantitative, Survey, Social learning theory, V F I instrument.
* Yeung (2004): Finland, Practical Theology, qualitative, Interview, Phenomenology, focused on achieving goals and emotional arousal.
* Zollo et al. (2022): Italy, Economics and Business, quantitative, Survey, Functional Psychology, V F I and Religiosity Scale.
Coding Groups II and III
Coding of Groups II and III. In addition to each coded study, the categories are included with the following abbreviations: Age Range (Age); Context (where c = civil society, r = church, b = both); Structure (where f = formal); Place (where off = offline, on = online, b = both); Intensity (where r = regular, e = episodic); Aspiration (where C = community-building)

Table A5. Long description
The table contains 11 columns: Author, Age, Number, Denomination, Project place, Context, Structure, Location, Intensity, Aspiration, and U N Volunteers 2020.
Key data points include:
* Akintola: Age 20 to 55, Number 57, South Africa, Context z, Structure f, Location off, Intensity r, Aspiration G, U N Volunteers Service.
* Batson et al. Study 1 and 2: Numbers 54 and 71, Protestant and Catholic, Context z, Structure f, Location off, Intensity e, Aspiration G, U N Volunteers Service.
* Bellamy and Leonard: Age 15 plus, Number 3363, Australia, Context b, Structure f, Aspiration G.
* Clerkin and Swiss: Age 14 to 18 and 23 plus, Number 4319, multiple denominations including Methodist and Catholic, United States, Context z, Structure f, Location off, Intensity e, Aspiration G, U N Volunteers Service.
* Evangelische Kirche in Deutschland: Age 14 plus, Number 5282, Germany, Context b, Structure f.
* Grönlund et al.: Number 6108, Protestant and Catholic, Context z, Structure f, Location off, Intensity e, Aspiration G, U N Volunteers Service.
* Hustinx et al.: Number 7186, Catholic, Structure f.
* König and Maschke: Number 10689, Germany, Context b, Structure f, Aspiration G.
* Seidelmann: Age 14 plus, Number 12142, Protestant, Context b, Structure f.
* Sinnemann: Two entries with numbers 4065 and 14595, Protestant and Catholic, Germany, Context b, Structure f.
Abbreviations used in the table: Context c for civil society, r for church, b for both; Structure f for formal; Place off for offline, on for online, b for both; Intensity r for regular, e for episodic; Aspiration C for community-building.
Research instruments used by sources and their abbreviations
Abbreviations and full names of research instruments used by sources

Table A6. Long description
The table contains two columns: Abbreviation and Research instrument's full name. The entries are as follows:
* A C O: Attitudes towards Charitable Organizations
* A H O: The Attitudes Towards Helping Others Scale
* A L I: Authentic Leadership Inventory
* B I A C: Belief Into Action Scale
* C M S: Choral Meaning Survey
* E V S: European Values Study
* F V M: Faith-based Volunteer Motivation Survey
* F W S: Freiwilligensurvey
* I M I: Intrinsic Motivation Inventory
* K M U: Kirchenmitgliedschaftsuntersuchung der E K D
* L B D Q: Leader Behavior Description Questionnaire
* LeBe: Fragebogen zur Lebensbedeutung
* M L Q dash 5 X: Multifactor Leadership Questionnaire
* O C S: Organizational Climate Scale
* P I L: Purpose in Life Test
* P O I: Personal Orientation Inventory
* R O S dash R: Religious Orientation Scale-Revised
* S E E H: Skala der Einstellungsstruktur Ehrenamtlicher Helfer
* T L S: Trust in the Leader Scale
* U W E S dash 9: Utrecht Work Engagement Scale
* V C I: Value Congruency Instrument
* V F I: Volunteer Functions Inventory
* V F I dash A: Volunteer Functions Inventory—Adapted Version
* V M I: Volunteer Motivation Inventory
* V M Q: Volunteer Ministry Questionnaire
* V M S: Volunteer Motivation Scale
* W V S: World Values Survey

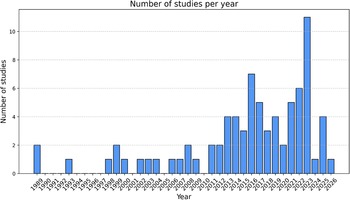
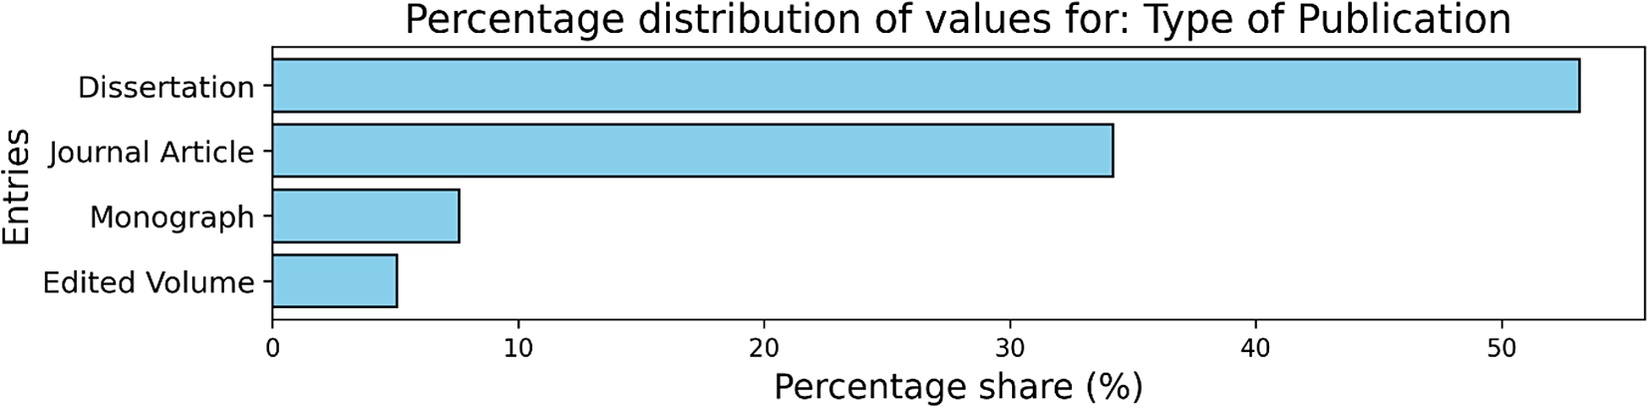

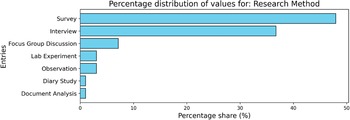
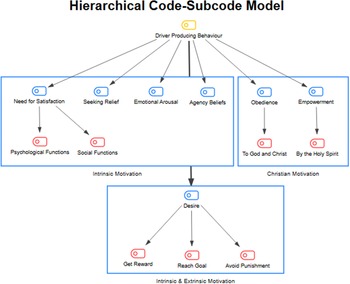
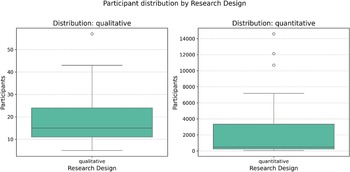

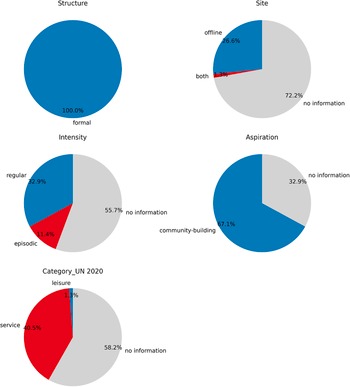
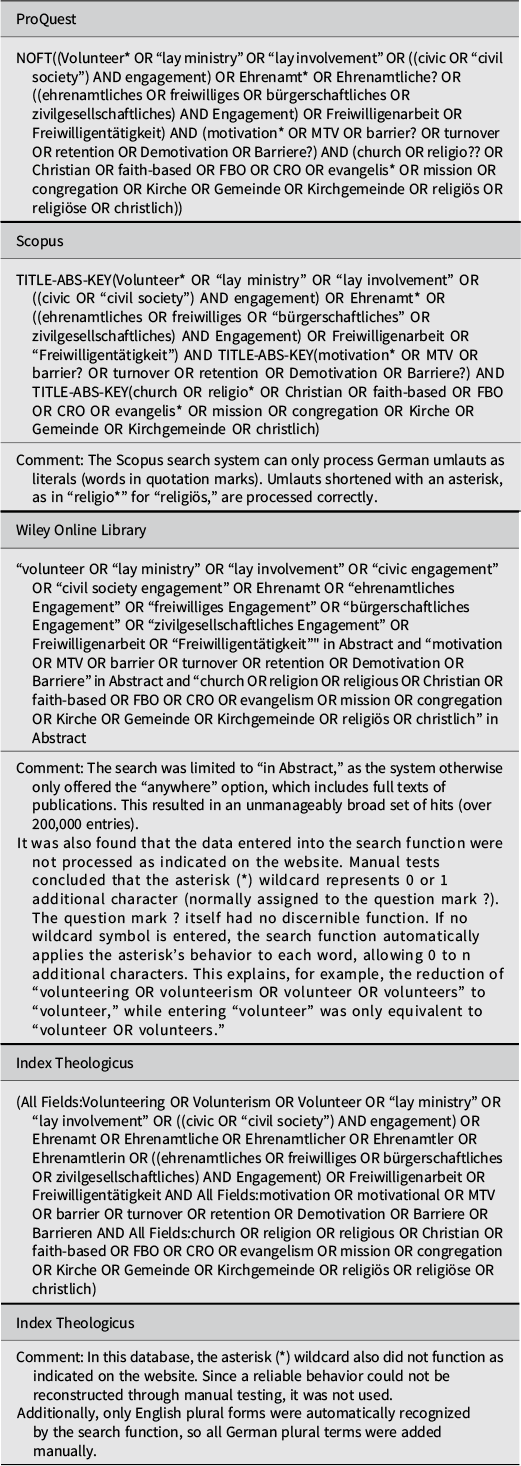
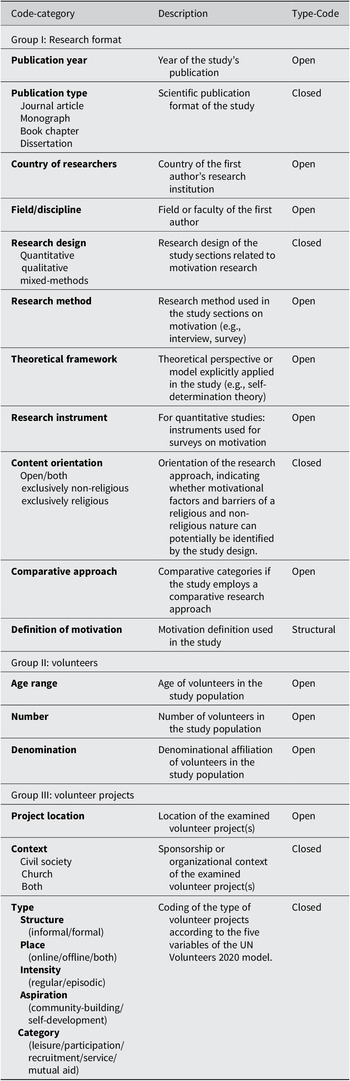
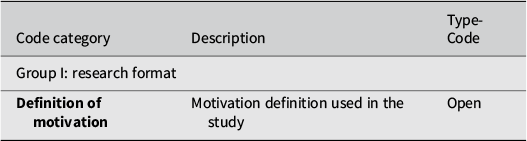
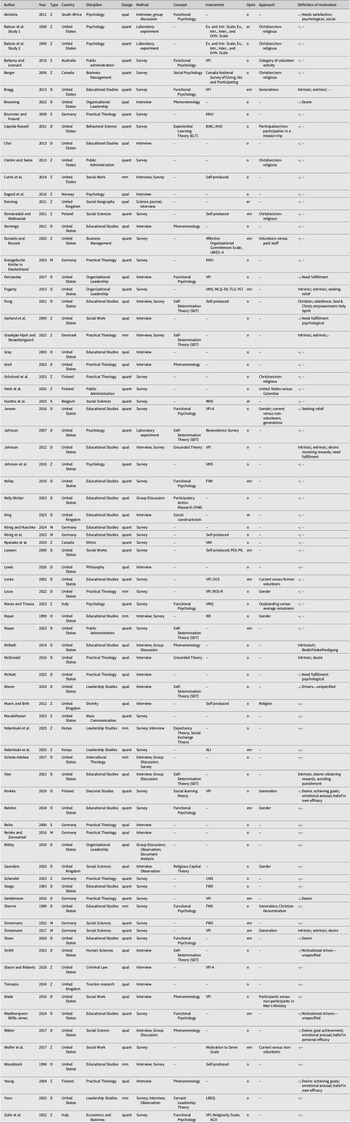
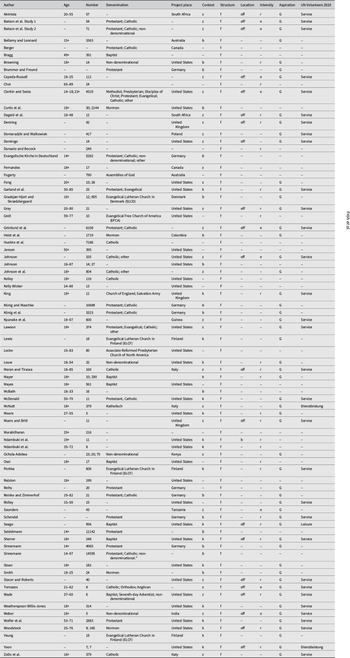
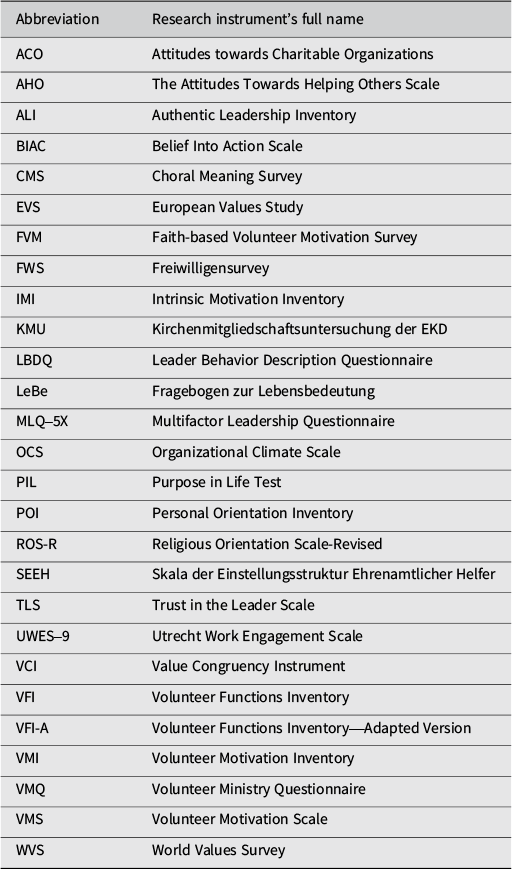

 Open access

