


Introduction
The widespread scarcity of water for agricultural production in arid/semi-arid environments, especially in the Mediterranean region, has necessitated the implementation of strategies aimed at increasing the water use efficiency with which it is used. Irregular and uneven precipitation distribution, as well as climate change, have a significant impact on the viability of agricultural production in these areas (İnce Kaya and Yazar, Reference İnce Kaya and Yazar2016; Shammout et al., Reference Shammout, Qtaishat, Rawabdeh and Shatanawi2018). Effective management of water resources is the key to sustainability and profitability of the crop, thus encouraging the development of new techniques for efficient water management under the effect of climate change. The scarcity of water resources necessitates appropriate management and use of the available water, given that the agricultural sector is one of the activities that demand more water. As a result, agricultural water consumption efficiency must be maximized to ensure maximum productivity with minimal water input. Among the irrigation management strategies developed for water scarcity conditions are conventional deficit, partial root-drying (PRD) and regulated deficit irrigation (RDI). English and Nuss (Reference English and Nuss1982) defined deficit irrigation as the practice of applying less irrigation water than what is required to fully replace water used by the crop. RDI is a significant water-saving strategy that has recently emerged in irrigated agriculture. Crops subject to RDI are permitted to have some water deficit in less sensitive growth stages, as well as a reduction in yield (Chartzoulakis and Maria, Reference Chartzoulakis and Maria2015; Chai et al., Reference Chai, Gan, Zhao, Xu, Waskom, Niu and Siddique2016).
Bell pepper (Capsicum annuum L.) is an important vegetable crops that is widely grown in many different regions of the world because of its important economic value. Dorji et al. (Reference Dorji, Behboundian and Zegbe-Dominguez2005) stated that bell pepper production is confined to semiarid environments where water shortage is the major limiting factor for agricultural production, increasing the need for optimizing irrigation water management. Bell pepper is sensitive to both low and high water stresses, especially at the blossom-stage (Yahaya et al., Reference Yahaya, Alao and Odigie2012). Several studies reported that water stress affected the fresh and dry matter (DM) yield reduction (Costa et al., Reference Costa, Ortuño and Chaves2007; Dugo et al., Reference Dugo, Orgas and Fereres2007; Ferrara et al., Reference Ferrara, Lovelli, Di Tommaso and Perniola2011; Zotarelli et al., Reference Zotarelli, Dukes, Scholberg, Femminella and Muñoz-Carpena2011; Abdelkhalik et al., Reference Abdelkhalik, Pascual, Nájera, Domene, Baixauli and Pascual-Seva2020). Adequate amount of soil water during the crop-growing period is required for optimal plant and fruit growth, and high fruit yield and quality (Dalla Costa and Gianquinto, Reference Costa and Gianquinto2002 ; Delfine et al., Reference Delfine, Tognetti, Loreto and Alvino2002; Dorji et al., Reference Dorji, Behboundian and Zegbe-Dominguez2005; Gonzalez-Dugo et al., Reference Gonzalez-Dugo, Testi, Villalobos, López-Bernal, Orgaz, Zarco-Tejada and Fereres2020).
Testing agricultural management strategies are commonly carried out in the field. Hence the information obtained through traditional research by qualitative analysis has many limitations. Because of changing climate and weather parameters, there is a need for computerized based statistical tool which can provide decision support system for more than several decades. Therefore, simulation models can be a vital tool in future agricultural research and climate change mitigation strategies. Today, models are important tools to predict the effect of the water resources management for irrigation purposes and crop adaptation to different types of agricultural management. The advantages of using models are that simulations are cheaper and faster than field trials and that one can get more and higher level of detail from the simulation runs (Ragab, Reference Ragab2015; El-Shafie et al., Reference El-Shafie, Osama, Hussein, El-Gindy and Ragab2017; Dewedar et al., Reference Dewedar, Mehanna and El-Shafie2019; Marwa et al., Reference Marwa, El-Shafi, Dewedar, Molina-Martinez and Ragab2020). Thus, models could be utilized for scheduling irrigations and estimation of water requirements of crops, predicting the effect of climate change on agricultural production and to forecast crop yields as well as salt accumulation in the soil (Hirich et al., Reference Hirich, Choukr-Allah, Ragab, Jacobsen, El Youssfi and El Omari2012; İnce Kaya et al., Reference İnce Kaya, Yazar and Sezen2015; Ragab, Reference Ragab2015; Silva et al., Reference Silva, Baptista, Meneses and Ragab2017; Marwa et al., Reference Marwa, El-Shafi, Dewedar, Molina-Martinez and Ragab2020).
The SALTMED model is a physically based model that employs the well-known equations for water and solute transport, evapotranspiration and water uptake. It was created to forecast soil salinity and moisture profiles, salinity leaching requirements, soil nitrogen dynamics and nitrate leaching, soil temperature, water uptake and evapotranspiration (Ragab, Reference Ragab2002). SALTMED model is a generic model that can be used for a variety of irrigation systems including furrow, drip and sprinklers, soil types, crops and trees, water application strategies such as deficit, full, partial root-zone drying (PRD) and different water qualities. The SALTMED model can run with different scenarios under different conditions and crop parameters to evaluate the future impact on irrigation management and predict water distribution under automatic irrigation scheduling. The SALTMED model has a database for different soils and crop parameters (Ragab et al., Reference Ragab, Choukr-Allah, Nghira, Hirich, EChoukr‐Allah, Ragab, Bouchaou and Barceló2016).
The SALTMED model was successful in predicting the soil moisture, yield and DM of tomato grown under different water qualities and all the water application strategies using furrow and drip irrigation systems in Egypt and Syria (Ragab et al., Reference Ragab, Malash, Gawad, Arslan and Ghaibeh2005). In Brazil, the SALTMED model was used to investigate the effect of climate change on the water requirements of cabbage, carrot and castor bean (Montenegro et al., Reference Montenegro, Montenegro and Ragab2010). The SALTMED model was successfully calibrated and validated for various field crops such as quinoa, sweet corn and chickpea in Morocco (Hirich et al., Reference Hirich, Choukr-Allah, Ragab, Jacobsen, El Youssfi and El Omari2012, Reference Hirich, Ragab, Choukr-Allah and Rami2014). Silva et al. (Reference Silva, Baptista, Meneses and Ragab2017) demonstrated in Portugal that the SALTMED model accurately simulated tomato yield in unheated greenhouse conditions.
Marwa et al. (Reference Marwa, El-Shafi, Dewedar, Molina-Martinez and Ragab2020) reported that the SALTMED model is an efficient tool for predicting yield and total DM. Alkhasha and Al-Omran (Reference Alkhasha and Al-Omran2019) highlighted that the SALTMED model is reliable for predicting soil moisture and salinity distribution of tomato yield. İnce Kaya et al. (Reference İnce Kaya, Yazar and Sezen2015) highlighted that the SALTMED model can simulate high relation between soil moisture, total DM and grain yield for quinoa in different irrigation arid environments. Pulvento et al. (Reference Pulvento, Riccardi, Lavini, D'andria and Ragab2013) reported that the SALTMED model can predict soil water content and yield of quinoa crop grown under saline and freshwater conditions in Italy. According to Abdelraouf and Ragab (Reference Abdelraouf and Ragab2017), using the model could yield reliable results for soil moisture and nitrogen dynamics. According to Abdelraouf and Ragab (Reference Abdelraouf and Ragab2018), simulating total DM, yield and water using the SALTMED model produced good results with R 2 = 0.99 between observation and simulation over two seasons. The SALTMED model used in Syria by Gawad et al. (Reference Gawad, Arslan, Gaihbe and Kadouri2005) showed the impact of the irrigation method on the soil class, the irrigation salinity water on soil water content, and salinity distribution in the soil profile. The results demonstrated that the SALTMED model is useful in the management of water, crops and soil under field conditions. Dewedar et al. (Reference Dewedar, Plauborg, Marwa, El‐shafie and Ragab2021) investigated the effect of surface and subsurface drip irrigation systems, as well as irrigation levels, on bean yield and evaluated the performance of the SALTMED model. Soil water content, total DM yield, bean yield and water productivity (WP) were all accurately predicted by the model. All these above investigations revealed that SALTMED model accurately predicted soil water and salinity distribution in the crop root-zone, yield and DM of various field and vegetable crops grown under different irrigation management and environmental conditions.
The objectives of the current study are to evaluate the SALTMED model performance on bell pepper irrigated with subsurface and surface drip systems using conventional deficit irrigation, RDI, PRD in a semi-arid environmental conditions in the Mediterranean region.
Material and methods
Location description
The field trials were conducted in 2016 and 2017 at the Tarsus Soil and Water Resources Research Substation (36°53′ N latitude and 34 °57′ E longitude, with an altitude of 30.0 m above mean sea level). Typical Mediterranean climatic conditions prevail in the study area. The average annual rainfall is 616 mm and irregularly distributed throughout the year with the majority occurring in autumn, winter and the beginning of spring. The annual evaporation rate from a Class A pan is 1487 mm, the mean annual temperature is 17.8°C, and the mean relative humidity is 71%. Weather data, including rainfall, maximum and minimum air temperatures, air humidity, wind speed and solar radiation, were collected daily from an automatic recording meteorological station located at the experimental site for the study years, as well as long-term mean climatic data spanning the period 1950 to 2019. In general, the 2016 growing season was relatively wet, with 81.8 mm of total rainfall, compared to 17.2 mm for the 2017 growing season. Rainfall received in May–June 2016 was also higher than the long-term average.
The soil at the site is deep with a medium texture (silty-clay-loam) and is classified according to the USDA Soil Taxonomy (Soil Survey Staff, 2014). The available soil water content (AWC) was 88.3 mm in the 0–60 cm soil depth. The soil was slightly alkaline (pH suspension (1:1) = 7.91–8.11), the electrical conductivity of the soil saturation extract (ECe) ranged from 0.91 to 1.03 dS/m, and the volumetric soil water contents (VSWC) at field capacity and permanent wilting point were 38.9–42% and 24.9–27%, respectively. The mean bulk density of soil layers ranged from 1.30 to 1.45 g/cm3.
Experimental design and treatments
The field experiment was set up in a split-plot with four replications. The main plots in the experiment were assigned to two drip irrigation methods, surface drip (SfDI) and subsurface drip systems (SbDI), and five different irrigation regimes were considered and assigned to sub-plots: Full irrigation (I100), conventional deficit irrigations (I50 and I75), RDI and PRD are the names given to these regimes (PRD50). Each sub-plot measured 6 m long by 6 crop rows wide. One-meter gaps were provided between each plot to avoid effect of irrigation treatment. Full irrigation (I100) plots under both drip systems were replenished to field capacity after a 25% soil water depletion in the effective root depth (40 cm). RDI plots received 50% of their water requirements as I100 until flowering, at which point they received 100% of their water requirements as I100. Throughout the growing season, I75 and I50 received 75 and 50% of I100, respectively; The PRD50 treatment was supplied with 50% of I100, however alternative drip laterals supplied water the in each application.
Drip systems
In this field study, two drip irrigation systems, subsurface (SDI) and surface drip (DI) were used. Surface drip plots (SfDI) show lateral pipes with built-in emitters 0.33 m apart and a discharge rate of 2.0 l/h. In SfDI plots, 6 m long drip lateral lines were manually laid about 10 cm away from 0.70 m plant rows. Two drip laterals were placed on both sides of the plant row, 20 cm away from the centre of the plant row, in PRD50 plots. In SbDI plots, lateral lines were buried at 20 cm below the soil surface. A chisel plough was used to create relatively shallow furrows in SbDI plots for this purpose. Drip laterals with in-line emitters at a flow rate of 2.0 l/h and spaced at 0.33 m intervals were used in SbDI treatment plots. The duration of water delivery to each treatment was controlled by gate valves installed at the inlet end of each lateral.
The cultural practices
On 19 April 2016 and 11 April 2017, 3 weeks old seedlings of the local bell pepper variety Zafer (C. annuum L.) were transplanted into the treatment plots with 0.70 m row spacing and 20 cm plant spacing. A compound NPK fertilizer was applied to all treatment plots in the same amount several days before transplanting the bell pepper seedlings in the plots. N-P2O5-K2O (15%-15%-15%) was applied to the band in the plant rows and incorporated into the soil at rates of 50 kg/ha N, 50 kg/ha P2O5 and 50 kg/ha K2O. Three weeks after transplanting, the rest of N was applied through fertigation. During each irrigation application, 1.25 kg of urea (46% N) was dissolved in 100 L water in the fertilizer tank. By means of fertigation, the experimental plots received 164 kg/ha of N. All trial plots received a total of 214 kg/ha N in the experimental years.
Soil water measurements
VSWC measurements began shortly after transplanting and ended on the last harvest date of each growing season. VSWC was measured using a gravimetric sampling method at 0–20 cm, 20–40 cm and 40–60 cm soil layers one day before irrigations until harvest in four replications in SfDI and SbDI fully irrigated plots. In other treatment plots, VSWC observations were carried out a day before every other irrigation application. Water balance equation was used to estimate actual plant evapotranspiration (ETa) of bell pepper:

where ETa represents actual plant evapotranspiration (mm), R represents effective rainfall (mm), and Irr represents irrigation water applied in each treatment plot (mm). Dper is the depth of percolation below the root zone (in millimeters); Roff is the experimental plot runoff (mm); ΔS is the change in soil water storage in 60 cm depth at planting and harvest (mm). In this study, rainfall amounts greater than the soil water deficit at 60 cm depth were considered deep percolation.
WP was calculated for bell pepper as follows (Yazar et al., Reference Yazar, Howell, Dusek and Copeland1999):

where WP is the water productivity (kg/m3); ETa is the actual plant evapotranspiration (mm); Y is the yield of irrigated treatments (kg/ha).
Yields of bell pepper plants in each treatment plot were determined by harvesting manually. The harvested area in each trial plot was 14 m2 (four rows, each 5 m long). Bell pepper plants were harvested five times per growing season during the experimental years. The above ground DM yield was tracked over time by cutting all plants within a 1.0 m long row section for each plot at ground level every two weeks until the final harvest. Bell pepper plant samples were dried in drying oven at 65°C. A portable plant canopy analyser (LAI-2000, Li-COR, Lincoln, Nebraska, USA) was used for measuring leaf area index (LAI) of bell pepper plants in the experimental treatments at with 2-week intervals throughout the growing season.
SALTMED model calibration and evaluation
The SALTMED model requires some data regarding the crop and soil characteristics, daily weather and irrigation data. To run the model for bell pepper, crop input data such as maximum plant height, LAI, maximum and minimum rooting depths, planting and harvest dates and length of plant growth stages are required, which were obtained from the field experiments. The crop coefficients (Kc), basal crop coefficients (Kcb) and fraction cover (Fc) for bell pepper for the initial, mid and end growth stages were obtained from the literature (Pereira et al., Reference Pereira, Paredes, López-Urrea, Hunsaker, Mota and Shad2021). Field and laboratory measurements, as well as literature, were used to obtain input data for the experimental soil characteristics, which included depth of each soil horizon, saturated hydraulic conductivity (ks), saturated and initial soil water contents and salinity profiles (Table 1, Table 2 and Table 3). The SALTMED model also required irrigation data for different treatments as well as daily weather data from the experimental site as input data. The data used for model calibration and evaluation came from field tests conducted in Tarsus, Turkey's eastern Mediterranean region, over two cropping seasons (2016 and 2017). The model calibration was carried out by taking as reference full irrigation treatments (I100) for both drip systems carried out in 2016. The calibration process began with the initial measured/estimated values of crop and soil parameters, which were then gradually changed one at a time until the calibrated yield was equal to or very close to the observed yield. By fine-tuning the literature-based values of Kc, Kcb, Fc and photosynthesis efficiency, a good agreement between simulated and observed values of bell pepper yield, total DM, and soil water content was obtained.
Description of physical and chemical characteristics of the experimental soil

FC, Field capacity; PWP, Permanent wilting point; BD, Bulk density; ECe, Electrical conductivity of the saturation extract; OM, Organic matter.
Long-term mean monthly and 2016–2017 growing seasons' climatic data

Input parameters required for calibration and validation of the SALTMED model for bell pepper

The SALTMED model was evaluated for the rest of treatments considered by comparing simulated and observed bell pepper yield, total DM and soil water content and WP data of treatments other than the I100 treatments in 2016 and all treatments in 2017. Statistical and graphical procedures were used to assess the agreement between simulated and observed data. The measured and simulated data were plotted in the graphical approach to assess model performance visually.
Four statistical indicators were used to determine the goodness of fit between observed and simulated values: relative error (RE), root mean square error (RMSE), normalized root mean square error (NRMSE) and coefficient of determination (R 2):


where Oi is the observed value i, Si is the simulated value$\overline {\;O}$ and $\bar{S}$
 are the mean of observed and simulated values and n is the number of treatments.
Statistical analysis
Using SAS's JMP Statistical software, an analysis of variance was performed to evaluate the statistical effect of irrigation treatments on yield and DM yield, WP (SAS Institute, Inc., Cary, NC, USA). The LSD test was used to compare treatment means (Steel and Torrie, Reference Steel and Torrie1980).
Results
Experimental results
Table 4 shows the seasonal total irrigation quantity, bell pepper evapotranspiration (ETa), DM yield and WP values for the various deficit irrigation regimes used on surface and subsurface drip systems during the experimental years. Table 5 shows the statistical analysis of the aforementioned parameters. The seasonal total amount of irrigation water applied to SfDI plots in the 2016 growing season ranged from 335 mm in SfI50 and SfPRD50 treatments to 545 mm in SfI100 treatments; the corresponding values for SbDI plots ranged from 307 to 489 mm. The total irrigation amount in SfDI treatment plots varied from 359 mm in SfI50 and SfPRD50 to 647 mm in SfI100 in the second year of the field experiment; the corresponding values for SbDI treatment plots ranged from 335 to 618 mm. SbDI100 plots received 10 and 4.5% less irrigation water than SbDI100 plots in the 2016 and 2017 growing seasons, respectively, due to lower surface evaporation losses under SbDI. Because of the warmer weather conditions that prevailed during the 2017 growing season, the total amount of irrigation water applied to treatments in 2017 was 16 and 21% higher in I100 treatment plots under SfDI and SbDI, respectively, than in 2016. In 2016, RDI plots received 5.0 and 19.3% less water than I100 plots under SfDI and SbDI, respectively; the corresponding vales in 2017 were 11.9 and 9.9%. In 2016, bell pepper crop water use (ETa) values ranged from 484 mm in SfPRD50 to 693 mm in SfI100 in SfDI treatments, and from 456 mm in SbPRD50 to 635 mm in SbI100 in SbDI treatments. In the second year, ETa values in the surface drip plots ranged from 529 mm in SfPRD50 to 797 mm in SfI100, and from 501 to 760 mm in SbDI treatments.
Seasonal irrigation, actual crop evapotranspiration (ETa), observed and simulated yield and dry matter, relative error, observed and simulated WP values for the different treatments under SfDI and SbDI systems in two growing seasons

** LSD grouping at P < 0.01 level, * LSD grouping at P > 0.05, P > 0.05 ns (not significant). a–f letters indicate significant differences at 0.05 probability level.
Summary of the statistical analysis on yield, WP, DM yield and LAI of the bell pepper for the treatments in two growing seasons

*, **Significant differences at 0.05 and 0.01 probability levels, respectively, according to LSD; ns, nonsignificant; ETa, Actual crop evapotranspiration; DM, dry matter; LAI, leaf area index; WP, water productivity; IWP, Irrigation water productivity; LSD, least significant difference; CV, coefficient of variation.
Bell pepper yield and DM yield
In the first year, bell pepper yield values ranged from 45.5 t/ha in SfPRD50 to 75.7 t/ha in SfI100 under the surface drip system, and from 54.1 t/ha in SbPRD50 to 74.2 t/ha in SbI100 under the subsurface drip system. In the second year, bell pepper yield values ranged from 45.4 t/ha in SfPRD50 to 70.6 t/ha in SfI100 in SfDI, and from 46.4 t/ha in SbPRD50 to 71.5 t/ha in SbI100 in SbDI. Bell pepper yield values were discovered to be higher in 2016 than in 2017. The difference in yield between the two experimental years can be attributed to the occurrence of higher air temperatures during the flowering growth stage in 2017. Fresh bell pepper yield was significantly reduced by water stress in the deficit irrigation treatments in the study years (P <0.05). As shown in Tables 4 and 5, there was no significant difference in yield between the SfDI and SbDI systems in both growing seasons. Despite the fact that there was no significant difference in bell pepper yield between SfDI and SbDI, all treatments except I100 produced higher yields under SbDI than SfDI. Irrigation treatments, on the other hand, resulted in a significantly different yield for the 2016 and 2017 growing seasons (P < 0.01). Except for I75 in 2017, the I100, RDI, and I75 treatments produced similar yield during the experimental years, and these three treatments produced significantly higher yields than I50 and PRD50.
DM yield values for the different treatments yield changed between 5.61 t/ha in SfI50 and 8.48 t/ha in SfI100 with the SfDI system, and DM values varied from 4.67 t/ha in SbI50 to 8.04 t/ha in SbI100 under SbDI in the first year. In the second year, DM yields changed between 4.32 t/ha in SfPRD50 and 6.11 t/ha in SfI100 with the SfDI system, and varied from 4.61 t/ha in SbPRD50 and 7.14 t/ha in SbI100 under the SbDI system as indicated in Table 4. Regarding the DM yields in both growing seasons, irrigation systems, treatments and their interaction was significantly different with (P < 0.01) as shown in Table 5. In 2016, SfDI plots produced a significantly higher DM yields than SbDI, however, in 2017, SbDI treatments produced higher DM yield values than SfDI treatment plots. In the previous publication by Bozkurt Çolak (Reference Bozkurt Çolak2021), detailed information on yield, DM yield, WP and soil water content variation with time in the experimental years was provided.
Water productivity
Table 4 also shows the WP values of bell pepper under different treatments for SfDI and SbDI methods in the 2016 and 2017 growing seasons. WP values in the first year ranged from 9.4 kg/m3 in SfDIPRD50 to 12.7 kg/m3 in SbDI75 and SbDI50. WP values changed from 8.6 kg/m3 in SfPRD50 to 9.7 kg/m3 in SfI75 with the SfDI system in the second year and ranged between 9.4 kg/m3 in SbI100 and SbI50 and 10.7 kg/m3 in SbI75 with the SbDI system. WP values were significantly different for irrigation systems (P < 0.01) and treatments (P < 0.01). In present study, SfI75 and SbDI75 treatments resulted in higher WP than Sf-SbI100, Sf-SbRDI and Sf-SbI50, Sf-SbPRD50 in 2016; and greatest WP was determined in SbDI50 and SbDI75 in 2017 growing season. Because of higher ETa and lower yield in 2017, WP values were significantly higher in the first year than in the second.
Modelling results using SALTMED model
Calibration and evaluation of soil water content
The soil water content calibration was done using the data of full irrigation treatments considered in the 2016 growing season. In the application of the SALTMED model, the simulated soil layers were 0–20 cm and 20–40 cm since root-zone depth of the bell pepper is 40 cm (Bozkurt Çolak, Reference Bozkurt Çolak2021). The model evaluation for soil water content was conducted for 2017 growing season soil water content data using the calibrated soil input parameters obtained during 2016 season. There was a strong agreement between simulated and observed soil water contents in 0–20 cm and 20–40 cm soil layers for both drip systems as depicted in (Figs 1(a)–1(d) and 2(a)–2(d)), respectively. For the surface drip system (SfDI), the R 2 was 0.98 and 0.88 for 0–20 cm soil layer in 2016 and 2017 growing season, respectively; for subsurface drip system (SbDI), the R 2 was 0.97 and 0.95 for 2016 and 2017, respectively. For the SfDI system, the R 2 was 0.95 and 0.92 for 20–40 cm soil layer; for SbDI, the R 2 was 0.97 and 0.93 for 2016 and 2017, respectively. These figures revealed that the SALTMED model simulated soil water content slightly lower than the observed values. Figures 1(a)–1(d) also show the RMSE values between the observed and simulated soil water content. The RMSE for evaluated data was 0.007 and 0.017 for the SfDI system in 2016 and 2017, respectively, and 0.009 and 0.012 for the SbDI system, indicating that the SALTMED model estimated the soil water content almost perfectly. The high R 2 and low RMSE values for the relation between observed and simulated soil water content indicated that the model's ability to predict soil water content. Hirich et al. (Reference Hirich, El Omari, Lamaddelana, Hamdy, Jacobsen, Jelloul and Choukr-Allah2013) reported high agreement between simulated and observed soil water content in a quinoa study in Morocco, with R 2 values of 0.91 and 0.83 for 0–30 cm and 30–50 cm soil layers, respectively.
Measured and simulated soil water content at 0–20 cm soil depth under surface drip (SfDI) and subsurface drip (SbDI) in the experimental years. (a) SfDI in 2016; (b) SbDI in 2016; (c) SfDI in 2017; (d) SbDI in 2017. The red line is the regression line.

Measured and simulated soil water content at 20–40 cm soil depth under surface drip (SfDI) and subsurface drip (SbDI) in the experimental years. (a) SfDI in 2016; (b) SbDI in 2016; (c) SfDI in 2017; (d) SbDI in 2017. The red line is the regression line.

Simulated yield, DM and WP using SALTMED model
Bell pepper yield
The calibration and evaluation process revealed a close relationship between simulated and observed bell pepper yield values as shown in (Figs 3(a)–3(d)). The REs between the observed and the simulated yield obtained in the 2016 season varied from 0.0 to −9.71% in SfDI treatments, and changed between 0.0 and 8.94% in SbDI; while for the 2017 season, it varied from 2.25 to 10.82% in SfDI treatments, and it changed between −4.53 and 9.05% in SbDI treatments. The average RE was 5.50% for SfDI, and 4.41% for SbDI in 2016; the corresponding values for the 2017 growing season were 6.75 and 5.91%, respectively for SfDI and SbDI. The SALTMED model accurately predicted the bell pepper yield based on the closeness of the RE to zero and the maximum 10.82%. In 2016, the determination coefficient R 2 was 0.999 for SfDI and 0.992 for SbDI treatments; in 2017, R 2 was 0.987 and 0.982 for SfDI and SbDI treatments, respectively.
Measured and simulated dry matter yield under surface drip (SfDI) and subsurface drip (SbDI) in the experimental years. (a) SfDI in 2016; (b) SbDI in 2016; (c) SfDI in 2017; (d) SbDI in 2017. The red line is the regression line.
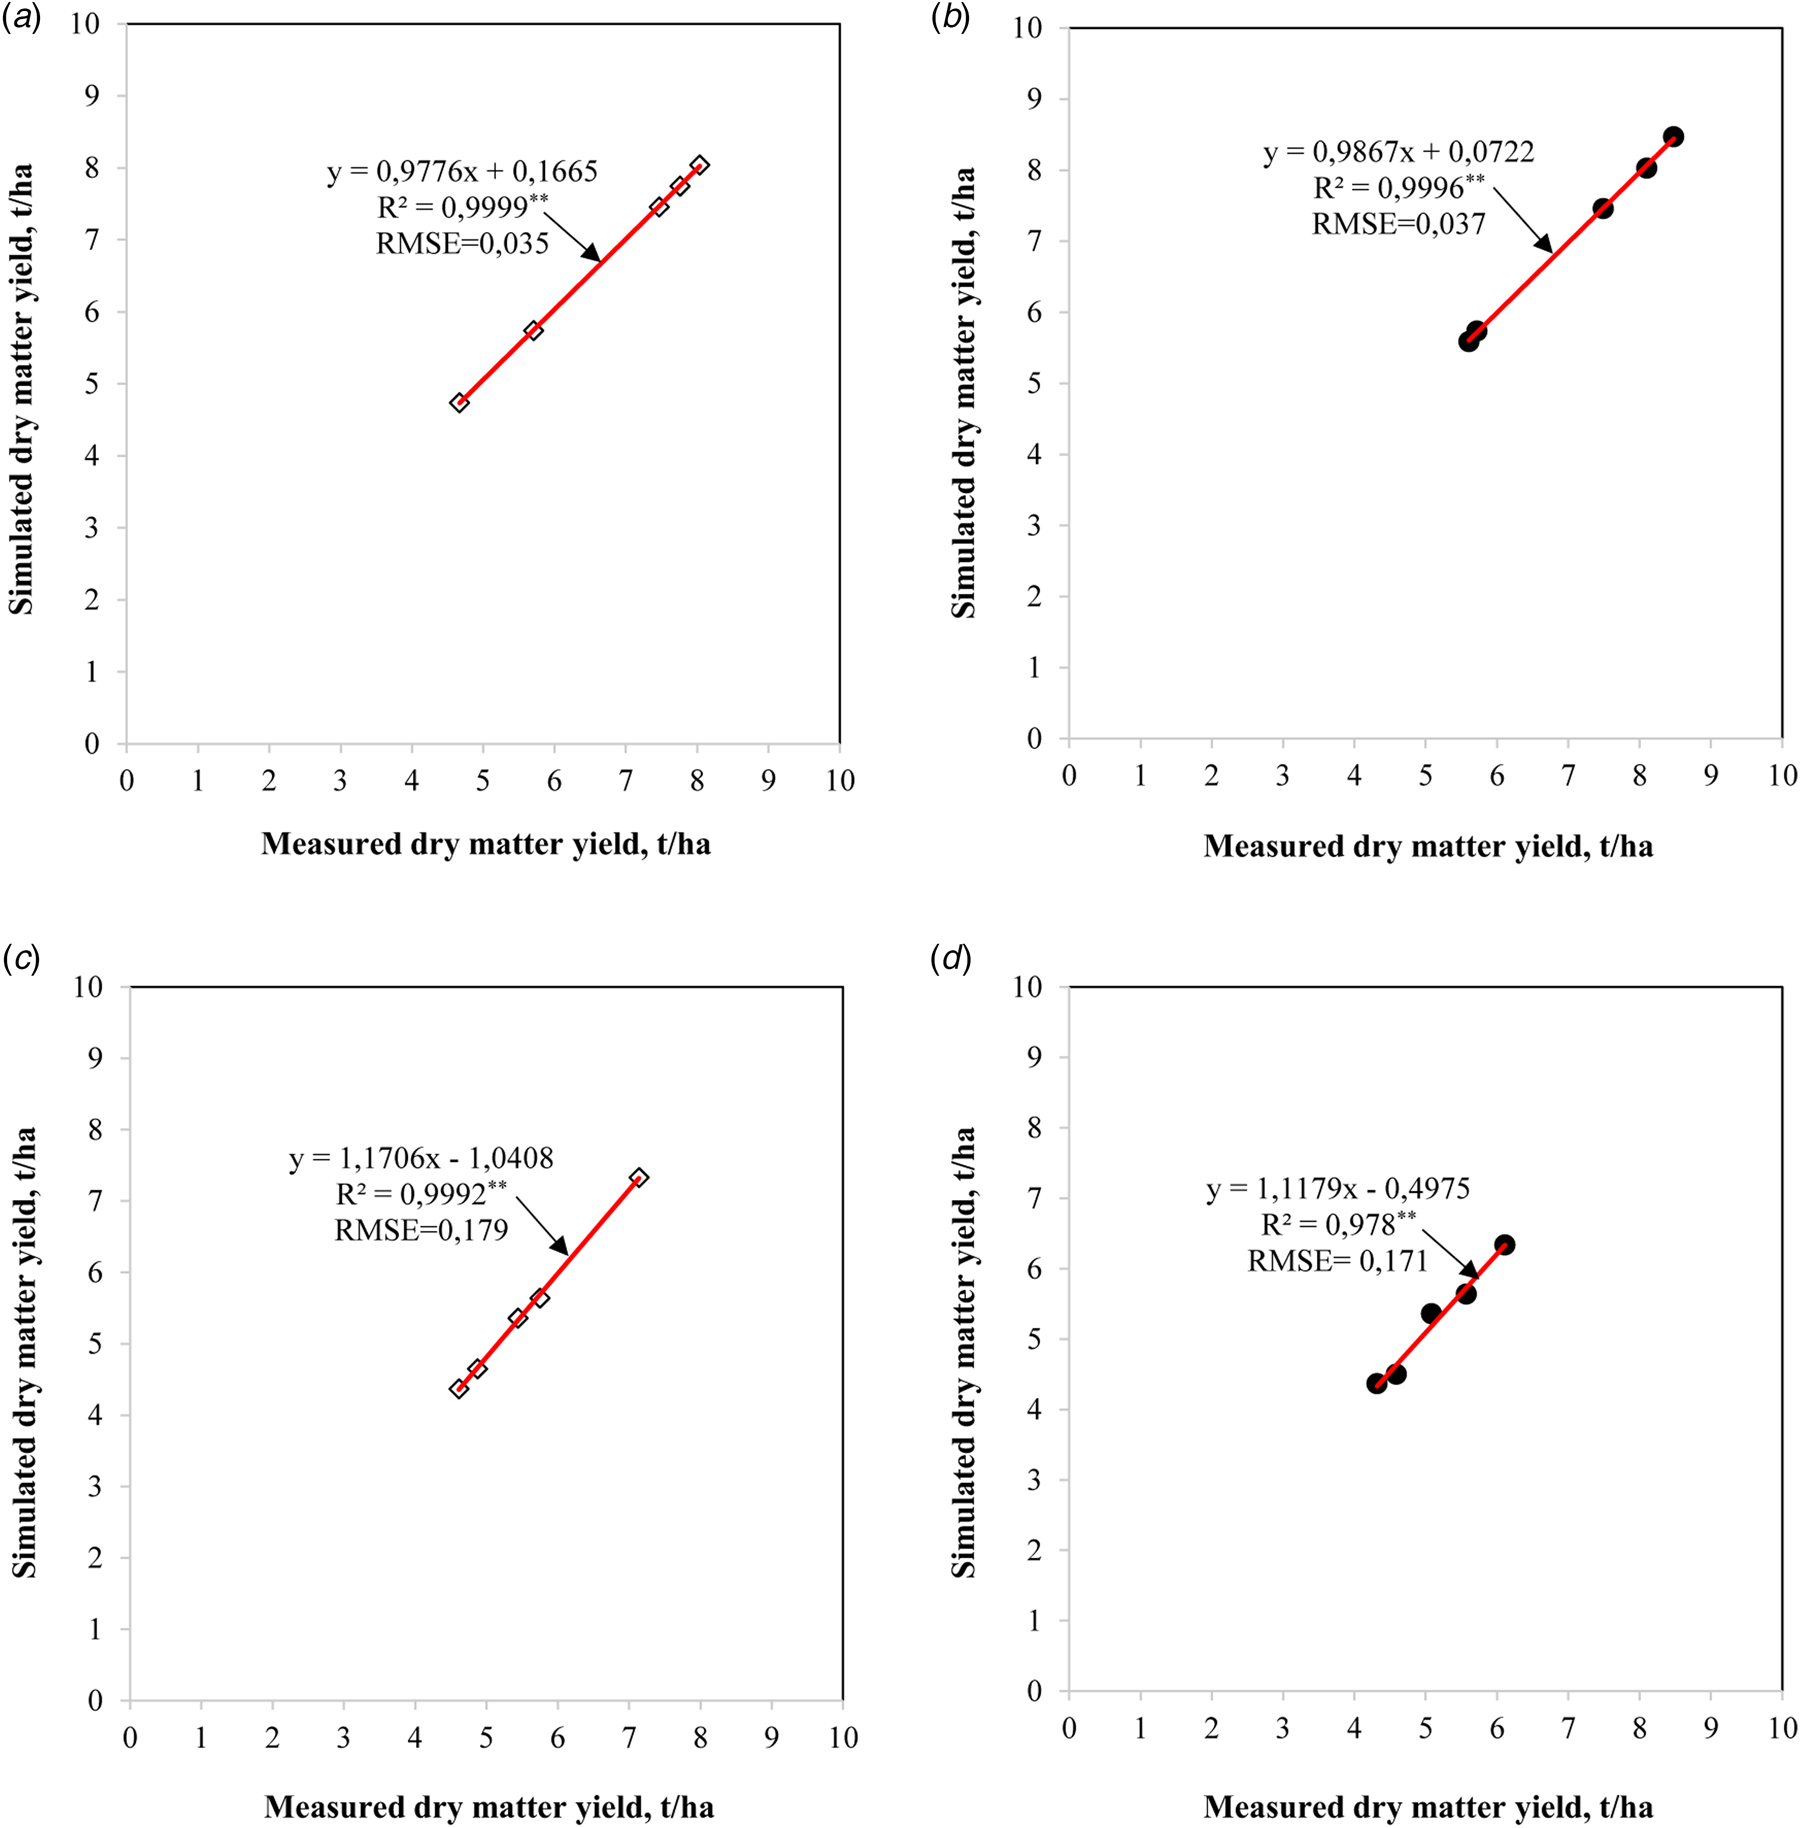
Total DM yield
Figures 3(a)–3(d) show a very good relationship between measured and simulated DM yields in the experimental years, with R 2 equal to 0.99 for SfDI and SbDI treatments in 2016, and 0.971 and 0.974 for SfDI and SbDI respectively in 2017. The results showed that the SALTMED model predicted total DM accurately for the experimental years.
Water productivity
Figure 4 depicts a two-year combined 1:1 relationship between the experimental treatments measured and simulated WP values. Figure 4 indicated an acceptable relationship between observed and simulated WP values with an R 2 of 0.74, indicating the model's ability to simulate the WP reasonably well. Relatively lower R 2 value between the observed and simulated WP values is probably due to greater difference between observed and simulated WP values in PRD50 and I75 treatments in DI in the first year. The REs between the measured and the simulated WP obtained in the 2016 season varied from 0.0 to −9.68% in SfDI treatments, and changed between 0.0 and −10.75% in SbDI; while for the 2017 season, it varied from −2.16 to −7.93% in SfDI treatments, and it changed between −1.06 and 8.92% in SbDI treatments. Statistical indices such as RMSE values varied from 0.6669 to 0.8784 in SfDI and SbDI in 2016; and changed between 0.4778 and 0.5757 for SfDI and SbDI, respectively in 2017. Hirich et al. (Reference Hirich, El Omari, Lamaddelana, Hamdy, Jacobsen, Jelloul and Choukr-Allah2013) showed that the WP 1:1 relation between the measured and simulated WP indicated a close agreement with R 2 of 0.876.
Measured and simulated yield under surface drip (SfDI) and subsurface drip (SbDI) in the experimental years. (a) SfDI in 2016; (b) SbDI in 2016; (c) SfDI in 2017; (d) SbDI in 2017. The red line is the regression line.

Discussion
Because of higher air temperatures and less rainfall during the 2017 growing season, seasonal actual crop evapotranspiration (ETa) values were generally higher in 2017 than in 2016. Because of reduced evaporation from the soil surface in the SbDI plots, bell pepper plants in SfDI plots used 8.4 and 4.6% more water than SbDI plots for the I100 treatments in the 2016 and 2017 seasons, respectively. Since SbDI kept the soil surface is kept dry under SbDI, therefore SbDI caused decreased the surface evaporation, and thereby reduced the water use. Kong et al. (Reference Kong, Li, Wang and Huo2012) reported similar findings that seasonal actual crop water use (ETa) of bell pepper under SbDI were lower than under SfDI. They reported that the minimum and maximum ETa were found for SfDI plots (362–451 mm in 60 cm soil depth) and SbDI plots (301–438 mm), respectively. Crop water use decreased as water stress increased, as seen in the I50 and PRD50 treatments, where soil water content gradually decreased below 50% of available water just after flowering growth stage and fell below 50% level during fruit set and maturation periods. Bell pepper plants used 7 and 9% less water in RDI treatments than I100 in SfDI and SbDI, respectively. The experimental results showed that the maximum and minimum ETa were found in the I100 and PRD50 plots in two growing seasons.
The evaluation of the SALTMED model performance indicated that there was high agreement between measured and simulated yield, DM yield, soil water content and WP values proving that the SALTMED model is a powerful tool in predicting these parameters. The RMSE values were 0.649 for SfDI and 4.117 for SbDI in 2016 and 2.685 and 3.448 for SfDI and SbDI, respectively, indicating that the SALTMED model predicted the bell pepper yield reasonably well. These findings are consistent with the findings of Silva et al. (Reference Silva, Ragab, Duarte, Lourenço, Simões and Chaves2013), who obtained an R 2 of 99% between measured and simulated chickpea yields and supported the findings of Pulvento et al. (Reference Pulvento, Riccardi, Lavini, D'andria and Ragab2013) who reported a good relation between measured and simulated quinoa yield with R 2 = 0.95, RMSE = 0.19. Hirich et al. (Reference Hirich, El Omari, Lamaddelana, Hamdy, Jacobsen, Jelloul and Choukr-Allah2013) reported that the average RE in the predicted maize yield in 2010 was −10.92%, on the other hand in 2011 and 2012, RE values were 0.34 and −0.14%, respectively. The determination coefficient R 2 is equal to 0.93, indicating that there is a strong correlation between observed and simulated values, indicating that the SALTMED model is a powerful tool for yield prediction. Rameshwaran et al. (Reference Rameshwaran, Tepe, Yazar and Ragab2015) investigated the impact of saline water on sweet pepper yield and tested SALTMED in predication of soil water content and relative yield in the greenhouse study in Antalya, Turkey. The simulation results showed the model’ ability to predict the measured soil water contents in 0–20 cm, 20–40 cm and 40–60 cm soil layers. They also reported that the SALTMED model simulated relative yields reasonably well. Silva et al. (Reference Silva, Baptista, Meneses and Ragab2017) showed that the SALTMED model accurately simulates tomato yield in an unheated greenhouse.
The results show that the SALTMED model can accurately simulate DM yield under various deficit irrigation conditions. SfDI and SbDI had RMSE values of 0.04 and 0.03, indicating that the model slightly underestimated the simulated DM yields. The REs between the observed and the simulated DM yield obtained in the 2016 season varied from 0.0 to 9.09% in SfDI treatments, and changed between 0.0 and −9.63% in SbDI; while for the 2017 season, it varied from −1.16 to −5.51% in SfDI treatments, and it changed between 1.91 and 5.21% in SbDI treatments. The average RE was 5.13% for SfDI, and 5.41% for SbDI in 2016; the corresponding values for the 2017 growing season were 2.73 and 3.15%, respectively for SfDI and SbDI. These findings supported the findings of Silva et al. (Reference Silva, Ragab, Duarte, Lourenço, Simões and Chaves2013), who discovered a close relationship between observed and simulated chickpea DM with an R 2 of 0.99. According to Pulvento et al. (Reference Pulvento, Riccardi, Lavini, D'andria and Ragab2013), the total DM of quinoa has an R 2 of 0.96 and an RMSE of 0.35. Hirich et al. (Reference Hirich, El Omari, Lamaddelana, Hamdy, Jacobsen, Jelloul and Choukr-Allah2013) discovered a close relationship with R 2 equal to 0.93 between observed and simulated total DM for sweet corn, indicating that the SALTMED model accurately estimated DM yields.
The results of the SALTMED model performance evaluation have shown that this model can be used successfully for predicting yield, DM, crop water use, soil water content, etc. Therefore, the SALTMED model can be utilized for predicting the effects of climate change on crop yield, soil salinization, agricultural production of various crops.
Conclusion
The evaluation of SALTMED model performance revealed that a close match between simulated and observed bell pepper yields under the different deficit irrigation strategy conditions. The REs between the observed and the simulated yield obtained varied between with minimum 0.0 and maximum 10.8%. A very good relationship between observed and simulated total DM during two growing seasons, indicating that the SALTMED model reasonably well predicted DM yield for treatments considered. The observed and simulated WP 1:1 relation indicated a good agreement with R 2 of 0.74 for combined data of two experimental years (Fig. 5).
The relationship between the measured and simulated water productivity (WP). The red line is the regression line.

The SALTMED model was shown in this study to be capable of predicting soil water content, yield, total DM yield and WP over two production years under various irrigation management conditions.
Financial support
The Turkish Scientific and Technical Research Council (TUBITAK) provided the financial support for the project TUBITAK ERA-NET-215O951.
Authorship
AY and YBC conceived and designed the study. YBC, ST and AA conducted data gathering. ST performed statistical analyses. AY and ST wrote the article. CIK and AY carried out the SALTMED model running and evaluation.
Conflict of interest
The authors declare there are no conflicts of interest.
Ethical standards
Not applicable.


