


Industrial policy: definitions and the resurgence hypothesis
Industrial policy refers to government initiatives that aim to shift resources towards particular sectors of the economy in order to improve the economic competitiveness or growth prospects of a country.Footnote 1 Under most definitions, industrial policy interventions are those that go beyond solving obvious market failures (e.g., they do not cover basic public service provision) or providing redistribution. A non-exhaustive list of policies which have been discussed under this heading includes targeted subsidies to innovative, high-tech, or otherwise strategic sectors, procurement policy designed to stimulate certain types of output, applied research and development funding, targeted support for technical and vocational education, or the setting up of institutions designed to facilitate coordination in particular economic sectors.Footnote 2
There is widespread agreement in the literature that such policies were popular in many developed economies in the 1960s and 70s, but that they (or at least their most obvious manifestations) fell out of favor in the post-1980 era. The reasons behind this decline go beyond the scope of this study, but likely included an increasing preoccupation with government failure, together with the perceived ineffectiveness of many such initiatives.Footnote 3
Several authors have however argued that industrial policy is experiencing a resurgence. Some have put forward arguments in favor of governments taking such approaches. Mazzucato (Reference Mazzucato2011, Reference Mazzucato2021b), Chang and Andreoni (Reference Chang and Andreoni2020), and Rodrik (Reference Rodrik2004) are some of the most highly-cited works in this regard, although there is some heterogeneity in terms of policy prescriptions. Other authors have simply noted an increase in economic approaches that could receive the label in various developed economies.Footnote 4 The rise in industrial policy approaches in the UK has also been documented in a series of mostly qualitative works including Berry (Reference Berry2016, Reference Berry2020), Coulter (Reference Coulter2022), and Silverwood and Woodward (Reference Silverwood and Woodward2018).
If such a development is really taking place, it would mark an important departure from the neoliberal policy consensus of the post-1980 era, which has so far been surprisingly resilient in the face of challenges.Footnote 5 However, the existence, extent and nature of this hypothesized shift are far from clearly established. Some of the most pressing questions include:
1. Is there any systematic evidence for governments’ economic approaches evolving in this direction? This is a challenging question, because the multidimensional nature of industrial policy makes providing reliable long-run indicators of its use difficult. The most rigorous quantitative evidence currently available derives from the Global Trade Alert database,Footnote 6 which uses human coding of domestic policy measures that may impact international trade, starting from 2008. This data suggests an upward trend in protectionist measures, which offers some support for the revival hypothesis over this time frame.Footnote 7 To provide stronger evidence however, it would be useful to develop more explicit indicators of industrial policy as distinguished from trade policy, as well as to examine them over a longer time horizon.
The qualitative literature on UK economic policy has also documented a rise in industrial policy approaches in the past decade. Berry (Reference Berry2016) provides an early account of limited moves in this direction during the 2010–2015 coalition government, and Berry (Reference Berry2020) notes the increasing importance of industrial policy during the May government, while casting doubt on the extent to which the shift in rhetoric and institution-building reflects a fundamental departure from the neoliberal policy regime. Coulter (Reference Coulter2022) reviews the same developments, which he traces back to the pre-2010 Labour Government, while expressing substantial skepticism on their durability and effectiveness. Finally Silverwood and Woodward (Reference Silverwood and Woodward2018) and Woodward and Silverwood (Reference Woodward and Silverwood2023), while again acknowledging the shift in rhetoric and some aspects of policy, emphasize the continuity between business-friendly policies during the Thatcher years and the newer approaches. Given these debates and uncertainties, developing quantitative indicators of industrial policy use in the UK would allow a more precise identification of the extent, timing, and nature of the hypothesized shift.
Perhaps as a result of the difficulty in providing such indicators, the literature on industrial policy has often used policy papers emanating from various government departments as an important source of primary evidence. This methodological approach is well justified in the UK, as “command papers”—that is, official papers filed by the executive with Parliament—are a highly institutionalized and long-running account of government strategies, priorities and actions.Footnote 8 While consulting such documents is a natural first step, skeptics would argue that a purely qualitative effort risks a selective reading of particular fragments or documents. In section “Topic evolutions in the 1983-2022 command papers,” I therefore make use of the full sample of almost five thousand papers produced by British governments between 1983 and 2022, together with the structural topic model of Roberts et al (Reference Roberts, Stewart, Tingley, Lucas, Leder-Luis, Gadarian, Albertson and Rand2014, Reference Roberts, Stewart and Tingley2019) to provide quantitative estimates of shifts in content that could be related to industrial policy. I find a significant increase in the post-2010 period in topics that reflect themes from the recent industrial policy literature, including business support, government planning, systems-building, long-term economic strategizing, the green transition, and infrastructure. This is especially the case in the post-2016 May-Johnson period. This provides evidence for an increase in governments’ interest in such approaches.
2. If such evolutions can be identified, are they central to governments’ economic agendas or marginal developments? The increases described in point 1 are accompanied by many other developments in the case of the UK, including changes in welfare policy, Brexit, and the COVID pandemic, which were in fact more present in the public debate. The emerging literature on the new industrial policy in the UK is also ambivalent regarding the degree of commitment from governments to the new approachesFootnote 9 and the extent to which they have supplanted longer-running neoliberal approaches.Footnote 10 Section “Topics in the post-2010 period” presents an in-depth analysis of documents from the post-2010 period, by classifying the economic policy topics from this period, mapping the links between those topics, and modeling their importance using the level of engagement from readers, inclusion in the most important policy documents, and centrality in the topic network. I find that topics that reflect key themes from the industrial policy literature are not only rising, but central to the new economic policy agenda.
3. What does the new industrial policy agenda consist of? Proponents of the “new” industrial policy are generally quick to clarify that much of what was in fashion in the 1960s and 70s needs to be updated in the form of novel approaches.Footnote 11 In section “Understanding topical content,” I use a text summarization algorithm to extract the most characteristic content from the policy papers identified by the model as representative for the new approaches. The results show that the documents do indeed reflect an approach based on selective interventions that reflect policy prescriptions from the new industrial policy literature.
4. What are the causes of these developments? While it is unlikely that a simple causal story underlies the recent rise in interest in industrial policy, and a full causal account lies beyond the scope of this study, I take two steps towards exploring potential explanations. A first step relies on the language indicating the motives behind the interventions. I use an automated sentiment analysis procedure to extract sentences containing negative language, which almost always relates to the problems the policy is meant to address. The results indicate that concerns related to British companies’ competitiveness are the most commonly cited problems in the most representative documents, providing support for the idea that it is objectives related to economic competitiveness driving this policy shift. I also examine the extent to which evolutions in industrial policy content can be linked to political changes or major external events. The results show only limited evidence for this, which suggests that longer-running structural factors may be equally or more important.
The primary objective of the paper is identifying content related to industrial policy and its evolution over time, so the focus of the theoretical review in the following will be on previous work dealing with what industrial policy is, especially for its contemporary proponents, rather than broader discussions concerning the political logic behind particular policies,Footnote 12 or their effectiveness.Footnote 13 The following two aspects of the definition of industrial policy will be relevant for our discussion.
Goals
While older arguments focused almost exclusively on some combination of economic growth and international competitiveness as their objectives, newer approachesFootnote 14 include the tackling of problems such as climate change, the aging society, or regional inequality among the justifications for intervention. The merging of green and industrial policies over the past decade is also a common theme in the empirical literature.Footnote 15 The implication for our analysis is that selective policies that target objectives beyond growth and competitiveness need to be included in the operationalization of industrial policy.
Instruments
An important theoretical distinction is between industrial policy as selective interventions, targeting particular sectors in order to promote their growth, as opposed to also including horizontal interventions, targeting all sectors. Selective policies can include, according to Crafts and Hughes (Reference Crafts and Hughes2013), the promotion of national champions or state-owned-enterprises; state aid/subsidies for particular sectors or firms; trade policy designed to favor particular sectors; public procurement towards the same objective; targeted educational policies such as apprenticeships; capital provision through state-owned banks or other institutions; enterprise zones and other geographical clustering initiatives; and the selective funding of particular technological developments. There is wide support in the literature for including these kinds of polices in any reasonable operationalization of the concept of industrial policy, so the same is done here. There is a less clear-cut case for so-called “horizontal” policies. These are interventions that seek to alter the costs and benefits faced by all businesses. At the limit, the inclusion of all these approaches under a definition of industrial policy risks diluting the concept too much, so we will not refer to, for example, education-improving initiatives as industrial policy. However, Crafts and Hughes (Reference Crafts and Hughes2013) argue some horizontal policies can in practice be quite selective in terms of which sectors benefit from them—for example an infrastructure policy that acts as an implicit subsidy to the green energy industry, or R&D incentives that favor research-intensive sectors. In interpreting the results of the statistical models, we will therefore also consider a broader operationalization of industrial policy which includes such horizontal policies if they can be linked to particular sectors.
Another important distinction regarding the instruments of industrial policy relates to the theoretical rationale for intervention and, arising from that, the methods being employed. The traditional approach saw industrial policy as addressing market failures—even if those failures were predicated on strong assumptions. As a result of this, the policy tools employed would have been widely understood interventions such as taxes, subsidies, or government provision. Newer approachesFootnote 16 focus on systems failure and systems-building, that is the solving of the coordination problems entailed by the adoption of new technologies. Instead of taxes and subsidies for particular firms, policymakers may identify particular areas of technological advancement (such as artificial intelligence, or hydrogen energy) and build institutions designed to coordinate the adoption of those technologies. The practical implication for this analysis is that policies related to the systems-building approach have to be included in any contemporary understanding of industrial policy, in addition to polices justified through a market failure logic.
Topic evolutions in the 1983–2022 command papers
The United Kingdom is an important case for evaluating claims of a renewed interest in industrial policy because it is perceived in the literature as one of the clearest examples of government disinvolvement from the economy in the post-1980 era,Footnote 17 making it a “least likely” case which can provide a clear verification of the resurgence claim. The period of analysis begins in 1983, with the beginning of the second Thatcher government, and therefore well into the post-1979 neoliberal era. This time frame allows examining in detail any contrasts between recent developments and the previous three decades. The most natural threshold for the current period, which is compared to the past and then examined in more detail, is the beginning of the Conservative-led government in May 2010. Using this threshold allows distinguishing the economic policy of the 2010s from both the approaches of the previous center-left governments, as well as from the immediate aftermath of the global financial crisis. Additionally, evolutions in the period after July 2016 are examined separately in some models, as an important shift inside the Conservative Party, away from the relatively economically liberal Cameron governments to the more statist May and Johnson governments has been noted in the literature.Footnote 18
The sample used in this section contains 4867 documents, representing all command papers other than international treaties published between 1983 and the end of the Johnson government in 2022—an average of about 124 papers per year. These documents have been widely used in the historical literature, including on industrial policy, as they constitute a long-running, institutionalized, way for governments to present their approaches to policy.Footnote 19 Command papers are used by the executive to introduce policy initiatives and major legislation, to solicit public consultations, to report on the activities of all government bodies, and to answer inquiries from parliamentary committees. Particularly important documents from the recent period—those explicitly identified as policy proposal papers and also white papers—will be also analyzed separately in section “Understanding topical content.” International treaties, which are included among the command papers for historical reasons but are legal documents rather than policy-related papers have been eliminated using the algorithm described in Appendix 1. As can be seen in Figure 1 in Appendix 1, the output of papers per year remains, on average, remarkably constant over the long run, but there can be substantial variation from one year to the other, especially in election years. (Note that command papers can only be dated at the level of the yearly parliamentary session before 2010).
Topic correlation network, post-2010 policy papers.

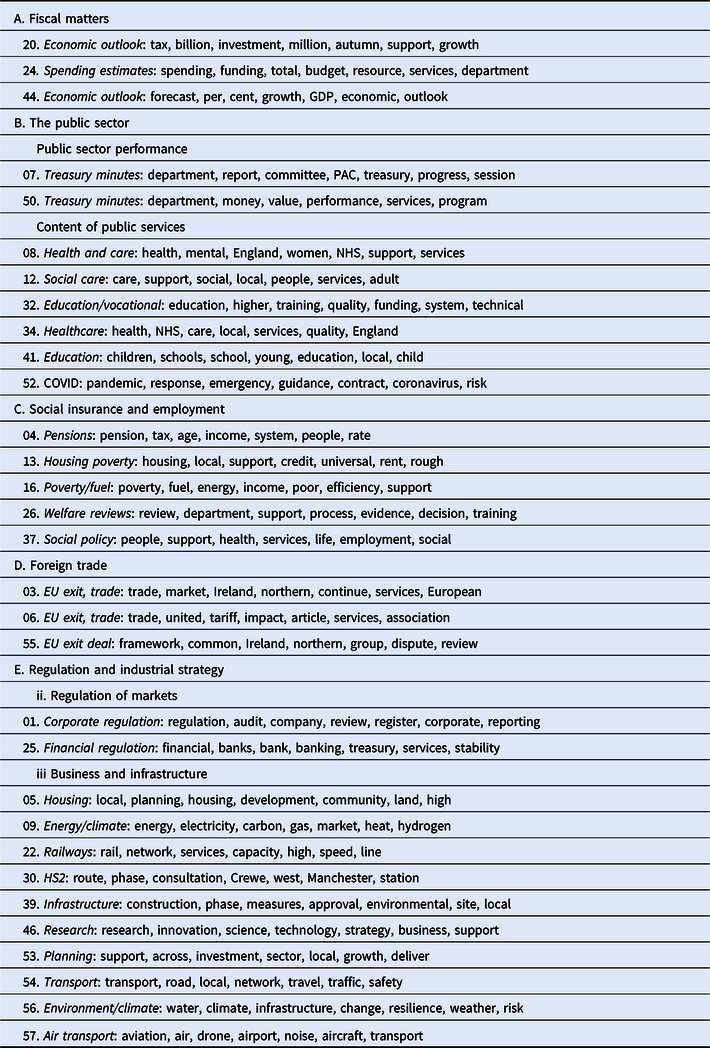
A first step in evaluating the hypothesis of a rise of industrial policy approaches is testing whether content that could be linked to such approaches has become more prevalent relative to the baseline of the post-1980 era. Changes in the content of the documents over the observation period will therefore be estimated using the structural topic model of Roberts et al (Reference Roberts, Stewart, Tingley, Lucas, Leder-Luis, Gadarian, Albertson and Rand2014, Reference Roberts, Stewart and Tingley2019). This unsupervised learning technique identifies the topics prevalent within a corpus of documents as well as their relations with document-level covariates. Topics are intuitively defined as clusters of terms which are likely to occur in the same document, and each document is assumed to be a mixture of multiple topics. Topics can be characterized by lists of representative terms, as well as by the content of their most representative documents. The number of topics to be estimated can be decided by the researcher, and there is a trade-off between choosing fewer topics, which lead to ease of interpretation and statistical power, and more topics, which lead to a more comprehensive account of the content of the corpus. Mimno and Lee (Reference Mimno and Lee2014) have developed an automated topic number selection algorithm, which will be used in the following to avoid a potentially subjective choice of parameter. Applying Lee and Mimno’s criterion has led to 81 topics in this case. The interested reader can consult the full characterization of all topics in the appendix, but given the substantive focus of the paper, I will analyze the roughly 38 topics that relate to economic policy, in its widest definition, and among these only characterize in detail those that can be related to industrial policy. Topics emerge in a random order from the model, but it is useful to classify them under various aspects of economic policy to organize the discussion, as is done in Table 1. In addition to the set of characteristic words for each topic presented here, I also examined the documents most representative for each in order to form the labels and classification.
Topics in the 1983–2022 sample

Other topics
1. Legislation, 6. Property registration, 7. Crime, 9. Nuclear safety, 17. Legal language, 18. Children, 19. Culture, 21. Crime, 22. Fire and safety, 23. Legal language, 24. Culture/heritage, 26. Wales; 27. Asylum, 30. Police, 31. Justice, 34. Litigation, 37. Water, 38. Maritime, 42. Dates, 43. Inquiries, 44. Foreign/Hong Kong, 47. Gender, 48. Select committees, 50. Northern Ireland, 51. Committees, 52. Foreign policy, 54. Legal language, 56. Place names, 57. Independent reports, 58. Prisons, 61. Scotland, 65. Elections, 66. Health and safety, 67. Media, 68. Media, 70. Security, 71. Generic language, 73. Justice, 75. Defence, 77. EU, 78. Medical/medicines, 81. Health and safety.
Note: The label for each topic is based on the lists of characteristic terms and its representative documents, listed in Appendix 2. For each entry, terms with the highest probability within the topic are listed.
Topics under headings A-D deal with aspects of economic policy related to fiscal matters, the public sector, welfare and employment, and foreign trade, and are not immediately relevant to understanding industrial policy. They are discussed in more detail in Appendix 2.1. A large and diverse fifth set of topics (E) is especially relevant for our analysis, as it deals with economic regulation and other types of government intervention. A first set of six topics within this group (E-i) deal with competition, merger regulation, and anti-trust policy in various areas such as transport or the media. The next set of regulation-related topics (E-ii) shows more substantive variety. Topic 55 relates to language used in public consultations. This is included among the economic topics because in practice the list of representative documents is dominated by consultations on various regulatory interventions in the economy. Topic 60 deals with the regulation of financial institutions and includes papers on banking reforms after the 2008 crisis, mortgage regulations, and related matters. Topic 59 is linked to a wide variety of papers from all periods related to the environment and pollution, some of which deal with regulation, An increase in the prevalence of topics in group E-ii may not necessarily indicate an increase in industrial policy, but could be connected with an increasingly interventionist approach.
Beyond these regulation-related topics, a very substantial group of topics (E-iii) deals with other forms of economic intervention, including those related to business support, infrastructure, energy, and R&D, Topics included in this “business and infrastructure” group have obvious relevance for the industrial policy hypothesis, as they can be connected to issues and interventions that are frequently discussed in recent works on industrial policy. Topic 2 deals with transport, and the list of representative documents is dominated by those related to a proposed high-speed rail system, which is also linked with the government’s decarbonization plans. Topic 5 deals with a wide variety of policies related to scientific research, R&D, business support, and innovation. Representative documents include papers on research and economic growth from the 2010s as well as older science strategy papers. Topic 8 is associated with documents dealing with various reform and economic intervention plans. Examples of top documents include plans for dealing with the economic impact of the COVID pandemic, Johnson’s “building back better” economic strategy, and post-Brexit immigration reforms, which are all connected by the use of a common language related to government support of various sectors and long-term economic strategy. Given that many of these documents call themselves plans (for growth, for immigration, etc.), I refer to this topic as planning, with the complex subject matter associated with it to be explored in more detail in the next sections. (Note this does not imply the use of policies sometimes labeled planning in the post-War era of industrial policy). Additionally, topic 74 deals with energy and its impact on the climate. Representative documents focus on various government policies pursuing energy security and decarbonization. All four of the “business and infrastructure” topics discussed above reflect themes and language that could be connected to industrial policy, and an increase in their prevalence would provide preliminary support for the hypothesis of its revival. Less clearly related to industrial policy is topic 10, on agriculture. The most representative documents come from the 1980s and 90s. These are generally financial reports on agricultural output and the operation of the various schemes for agricultural support, and have significant similarities with those related to expenditure control from group A. Finally, topic 80 deals with a wide variety of housing-related matters, including social housing, planning, and mortgages and homeownership, which are not commonly associated with discussions of industrial policy.
Evolutions over time
A first approach to modeling topic evolution, that follows the recommendations in Roberts et al. (Reference Roberts, Stewart and Tingley2019) is to use a flexible, nonparametric, modeling of time trends. Appendix 2 presents this approach for the economic topics that show the most significant changes over time, using a ten-degree polynomial function of time. This allows the reader to examine topic evolution visually, but does not allow simple statistical tests of change. A second, more rigorous approach presented in Tables 2 and 3, is to compare topic proportions between a recent period, which can be defined as either post-2010 or post-2016, and the earlier period. Both methods provide the same substantive conclusions, which indicate that topics related to points D-iii (business and infrastructure) and D-ii (regulation) increased in prevalence in the later periods, while topics related to public finance, competition, and public sector performance declined in prevalence. This shows clear support for the hypothesis of an increase in topics commonly associated with a more activist economic policy, and a decline in topics associated with liberalization. (The increases in foreign trade topics is not surprising in the context of Brexit).
Increases and decreases in topic prevalence, post-2010 compared to pre-2010

Note: Table shows estimated changes in topic proportions for all economic topics which show significant changes at the 95% confidence level. Standard errors presented in brackets next to coefficients. Three pay/healthcare topics also show significant coefficients that cancel each other (1.72, −1.12, −.73)
Increases and decreases in topic prevalence, post-2016 compared to pre-2010
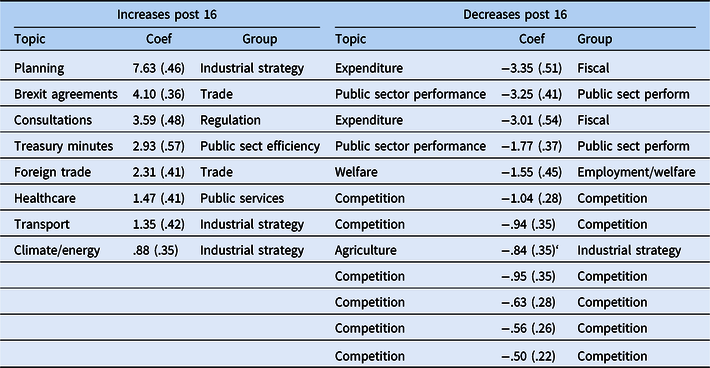
Note: Table shows estimated changes in topic proportions for all economic topics which show significant changes at the 95% confidence level. Standard errors presented in brackets next to coefficients. Three pay/healthcare topics also show significant coefficients that cancel each other (2.17, −1.13, −.83)
Table 2 shows that almost all of the topics that saw significant increases after 2010 relate to business support, planning, and regulation. Examination of topic 15, on the economic outlook, also reveals strong connections to the same themes, as it reflects a dual emphasis on expenditure control and economic growth which was not present in the public finance topics encountered earlier in the sample. Almost all of the topics that declined in importance relate to expenditure control, public sector performance, competition, and work/welfare, with two small exceptions. The agriculture topic (10) shares connections with the industrial policy topicsFootnote 20 but also the public finance topics, as representative documents are generally concerned with expenditures on agricultural support programs. The very small decline in the environmental regulation topic is harder to interpret, beyond noting that it is not substantively significant. Table 3 shows that these patterns are even clearer when comparing only the post-2016 era to the pre-2010 period. Moreover, the graphical illustrations in Appendix 2.2 show that the increases identified in Tables 2 and 3 correspond to persistent long-run trends rather than being driven by transitory episodes of focus on particular topics. Further results in Appendix 2.2 also provide some external validation for the conclusions. The appendix first shows that in the case of three topics for which we have strong prior expectations regarding their evolutions in the 2010s—energy, financial regulation, and transport—their behavior in the flexible modeling largely corresponds to those expectations. Second, an analysis of corporate subsidies in the UK in the post-2010 period, based on the Global Trade Alert Subsidy Tracker database confirms that subsidies related to transport, energy, and green policy have been dominant in this period, and have seen an increase in the post-2016 period (Appendix 2.2).
One important question regarding these evolutions is whether they reflect gradual, long-run trends, versus being associated with particular moments in time. Two possible influences on the economic agenda in this period were changes in government and major exogenous events. Regarding the first, a large body of literature has associated the decline of classical industrial policy with the 1979 election of the Thatcher government,Footnote 21 which motivates analyzing the effects of subsequent shifts in 1997 and 2010. Regarding the second, the 2008 global financial crisis and subsequent government bailouts have been linked to the rise of industrial policy approaches,Footnote 22 while Brexit has been seen as an opportunity to remove EU limitations on state aidFootnote 23 as well as bringing a new, more statist generation of conservative politicians to the fore.Footnote 24 The COVID pandemic has led to large increases in government involvement in the economy throughout the world.Footnote 25 While it would be impossible to test for gradual effects over longer time horizons from these developments to changes in the economic policy topics, we can examine a limited form of the hypothesis by testing for discontinuities in topic prevalence around key dates, in the presence of more or less flexible time trends. In Table 4, I present results using a third-degree polynomial for modeling the long-run trend, and estimate the discontinuities induced in all topics by the political shifts in 1997 and 2010 as well as, in a separate model, by the 2008 global financial crisis (dated as September 2008), Brexit (June 2016), and the COVID period (January 2020).
Discontinuous changes in topic prevalence

Note: Table presents all economic topics that show significant changes at the 95% confidence level for the 1997 and 2010 changes of government and the three important events. Third power time trend included in all models.
The results offer limited support for some discontinuities arising from government changes, with the 2010 shift appearing to be associated with more substantial changes than the one in 1997. The 2010 shift is associated with a decline in both public sector performance topics, a small but statistically significant increase in the planning topic (1.9 percentage points compared to a total increase of 5–8 percentage points identified in Tables 2 and 3), as well as a rise in the particular approach to economic objectives outlined in the economic outlook documents. The results regarding the major events are less clear, with minimal meaningful discontinuities identified for the first two. The rise of the foreign trade and Brexit topics after 2020 can be explained through the departure from the EU that took place in this period. These patterns show that, while it would be impossible to discount a longer-term effect from partisan changes or events such as the financial crisis or Brexit on changes in economic policy approaches, there is only limited indication of discontinuous shifts, and instead the hypothesis of gradual evolutions—that may have been triggered by political or external changes—receives more support.
Topics in the post-2010 period
In order to evaluate the importance and the precise nature of the evolutions identified in the previous section, this section presents a re-estimation of the STM model on a sample limited to post-2010 command papers. This allows focusing in more depth on the recent era while taking advantage of the richer data structure available for this period. In order to focus on important policy work, I have selected for the analysis in this section only those command papers which are explicitly identified as policy papers, therefore eliminating from the sample papers which may reflect more routine business or the work of independent bodies. (Doing this is only possible in the post-2010 period, as this classification only became available in the data in this period). The same type of topic model as in the previous chapter is therefore estimated on a corpus containing the 956 policy papers produced by the Cameron, May, and Johnson governments. The same automated algorithm selected a model with 57 topics. (Given the smaller time frame, the lower number is plausible). I again classified the topics which may be relevant for economic policy on the basis of the top keywords and the most representative documents according to the scheme used in section “Topics in the post-2010 period,” with the results presented in Table 5.
Topic modeling, post-2010 policy papers
Other topics
2. Legal language, 10. Crime, 11. Bills, 14. Defense, 15. Bills, 17. Draft bills, 18. Foreign affairs, 19. Environment, 21. Justice, 23. EU law, 27. Scotland, 28. Draft bills, 29. Committee responses, 31. Justice, 33. Terrorism, 35. Human rights, 36. Crime, 38. Implementation reviews, 40. Crime, 42. Reviews, 43. Pre-legislative scrutiny, 45. Wales, 47. Legislation reviews, 48. Migration, 49. Media, 51. Consultations, litigation.
Topics A–D are not immediately relevant to industrial policy and are discussed further in the appendix. The fifth group however deals with regulation in the first subset and industrial strategy in the second. Topics in this second subset relate to business support, research and development, energy and climate, transport, and infrastructure. Among these, a topic that contains references to economic intervention and planning in general (topic 53) will be shown to be particularly important in the following. Just like in the previous section, I labeled this topic as planning given the frequent use of the term in the titles of the most representative documents.
Evaluating the relative importance of the various topics discussed in the above is necessary for understanding whether content related to industrial strategy is truly central to the economic policy agenda in this period. In the following, four measures of topic importance are presented—a classical one based on topic proportions, and three which I argue are more rigorous, based on centrality in the topics’ network structure, on interest from readers, and on the inclusion in major policy papers.
Topic proportions
A simple indicator of topic importance is its proportion in the sample. This method has some limitations, in that it does not take into account the varying importance of the documents, connections between topics, or interest from the public, but is a useful starting point for the analysis. Table 6 presents the top individual topics, as well as the proportions of the aggregate groups from Table 5, in the post-2010 period. The results show that the basic insights emerging from the over-time analysis in section “Topic evolutions in the 1983-2022 command papers” receive some validation. Topics related to industrial strategy are the largest group in the post-2010 policy papers, and even more so post-2016. The “planning” topic is close to the top of the ranking, and only surpassed by one of the Brexit topics in the post-2016 period. Other industrial policy-relevant topics, including energy and climate, vocational training, and housing are also featured in the top ten. Topics related to fiscality have a very low proportion, and those related to deregulation and competition are largely absent. Two topics related to public sector performance are at the top of the rankings when looking at individual topics, but make up only a moderate share of the corpus when looking at groups. Separate results for the 2010–2016 period and the post-2016 period presented in Table 7 suggest that the rise of the planning topic took place largely in the post-2016 period.
Topic and group proportions 2010–2022

Topic and group proportions, 2010–2016 (left) post-2016 (right)

Note: Topics showing significant increases between the two periods: EU exit deal; EU exit trade; Planning; Health/care EU exit, trade.
Centrality in the topic network
Topics can correlate with each other by sharing more or less overlap in their set of characteristic words. We can therefore estimate the full correlation matrix between each of the 57 topics, and form a network of connections between them by setting a threshold for the level beyond which topics are taken as linked. Figure 1 presents the network that emerges when setting a threshold of .05, but similar conclusions will emerge by setting a slightly higher or lower level. Figure 1 shows that, for example, the infrastructure topic is directly linked to the HS2 topic (the largest infrastructure project in this period), and to public consultations (which are a key part of each infrastructure proposal). It also has second-order connections to railways in general and to judicial matters (infrastructure projects are frequently challenged in court).
Network centrality has been used as an indicator of importance in many settings, including website ranking in search results or academic prestige rankings.Footnote 26 The intuition is that a “node” in the network (a topic in our case) that connects to other nodes that themselves connect to other nodes, is more influential than one which is cut off from the rest. Topics relating to important institutional processes can also play this central role—for example the “bills” topic dealing with language related to draft legislation, but in the analysis we will focus on the importance of the economic topics only. Table 8 presents results using the three most widely used centrality indicators, but other measures would paint a similar picture. An unsophisticated indicator is the number of links for each node. A fuller measure is that given by the “eigenvector centrality” of each node. Intuitively, this gives high scores to nodes that are connected to many nodes that themselves are connected to many nodes, and so on. A third commonly used measure is the “betweenness” of the node. Intuitively, this is the number of times each node is passed when taking a trip between any two nodes in the graph—a node with high betweenness is much like important junctions on a city map.
Topic importance, post-2010 economic topics

As can be seen in Table 8, all three methods agree on the planning topic (53) being at the top, with the research (business support, innovation) topic in second place by two of the methods and in third place by one of them. We can confidently say, therefore, that the content of these two topics—dealing with government plans for infrastructure, business support, and stimulating innovation—is central within this corpus. Beyond these two, the social policy topic also has high ranking in terms of betweenness and number of degrees (but less so in terms of eigenvector centrality). Outside of this top three, topics from the business and infrastructure, E-iii, group such as housing, transport, energy/climate, and high-speed rail, dominate the rankings, together with those related to the most important public services—healthcare and education. Also notable is the lower ranking of topics related to spending and the absence of topics related to public sector efficiency, both classic themes of the post-1980 liberalization era.
Document popularity
Command papers vary a lot in terms of their relevance for potential readers including industry representatives, public sector employees, civil servants, foreign entities, or the general public. The official documents portal, which is the only government source for all command papers, ranks them by the overall number of views, which can be used as an indicator of importance. For the analysis in this section, I have grouped the documents by year of publication, so each document has a views ranking among all command papers within its year group.
Given that view counts tend to follow a power law distribution,Footnote 27 the most natural way to model the ranking is by taking the natural logarithm of the rank, and estimating the predictive effect of higher ranking on the likelihood of encountering each topic As there are varying numbers of policy papers in each year, the ranking has been normalized to a 0–100 scale—and we can think of a value of 5 as the fifth highest percentile of views, with a log(rank) value of ln(5) = 1.60. (Other approaches to modeling the rank-topics connection, including by using a simple linear connection, by modeling the connection using a third-power spline, or using a fully flexible 10-power polynomial function, provide similar conclusions.
Table 9 presents the predictive effect of an increase in the rank corresponding to one logarithm point on the probability of encountering each topic. The results show that the social policy and the planning topics, which were at the top of the rankings based on network structure are also at the top here. Two other topics, related to education and to vocational education are also reliably associated with more interest. Aside from these four, the energy and climate topic also shows a large estimate, but narrowly misses the 95% confidence level. These results again suggest that a set of topics connected by a focus on economic and social planning, vocational/skills education, and energy and decarbonization may be particularly important in this corpus. The results in the lower panel of Table 9 also suggest that the dominance of planning, social policy, and vocational education can be more clearly associated with the May-Johnson period than the Cameron years, suggesting the increasing importance of such topics on the agenda.
Topic importance according to document views

White papers
A final useful indicator of topic importance is whether the topic is associated with documents which are white papers—that is, major policy proposals. The methodology for deciding what is a white paper, which is not completely straightforward, is presented in Appendix 3. There are only 45 clearly identified white papers over 12 years, making it more difficult to obtain strong statistical associations between this indicator and the topics. Even with this shortcoming, Table 10 illustrates a pattern which is similar to that suggested by the other two importance measures. The planning topic is the only one to be significantly predicted by the white paper indicator at the 95% level, with the vocational education and general education topics following it in the rankings, but only significant at the .10 level.
Topic importance by inclusion in white papers

Topic importance summary
The criteria used in this section provide substantial overlap in their identification of important topics, and lead to a group of six topics that can be reliably labeled as important in this period. Aggregating the centrality measures in Table 7 leads to planning, research, and social policy as the top three topics, the first two of which are directly related to industrial policy. If adding topics which are associated with higher rank in Table 8, the topics of education, vocational education, and marginally energy and climate are added to this top three, with the latter two again directly related to industrial policy. The white paper criterion confirms the importance of the planning and vocational education topics. Evidence from the long-run analysis in section “Topics in the post-2010 period,” and from two of the topic importance measures in this section suggests the dominance of topics related to selective policies that can be connected to industrial policy approaches is most clearly associated with the post-2016 period, with the planning topic becoming dominant during this latter period. This association between topics indicative of industrial policy and the post-Brexit era, characterized by the rise of the more statist wing of the Conservative party, suggests the possibility of a causal connection, although the analysis in Table 4 also shows the effect was not immediate. The list of six topics identified in this section as important for understanding economic policy in the post 2010-era will be examined in detail in the next section.
Understanding topical content
The STM model ranks documents on how closely they are associated with any given topic, so the most representative command papers for each topic can be consulted to better understand the content. Doing this can help us evaluate the extent to which important topics reflect a desire to change policy in the direction of selective intervention that could be interpreted as industrial policy, versus reflecting other uses of the language related to government intervention. A qualitative reading and account of the representative papers is one way to do that, and has been widely employed in similar studies in the past. There are however potential pitfalls of relying only on qualitative appraisals, including potential bias and motivated reasoning on the part of the researcher. In this section, I take an alternative approach by using methods from the field of natural language processing to remove at least some of the subjectivity from the process of understanding the content of documents.
Algorithmic methods for text summarizationFootnote 28 can generate summaries of complex texts with surprising accuracy. The basic approach of such methods is to take a fragment of text (most commonly a sentence) as a node in a network. The links between these fragments are given by the degree of overlap in the vocabulary used. Centrality for a sentence in such a network means that its vocabulary has significant overlap with the vocabulary of other sentences, which in their turn have significant overlap with other sentences, and so on. Sentences with higher centrality scores are more representative for the text as a whole. Selecting the top n sentences (and arranging them in their order in the text) can therefore produce a representative summary of the text. I will employ this approach here, by using the LexRank algorithm developed by Erkan and Radev (Reference Erkan and Radev2004) and implemented in software by Spannbauer (Reference Spannbauer2022), but do not aim to provide readable summaries of the documents—this would generally require more text than practical to present here. Selecting only a small number of fragments—three in the results below—can provide an unbiased representative sample from the document, which can set an objective baseline for our understanding of the content. I do that in the following for the top five documents from the planning, research, and social policy topics, and the top three documents from the other important topics. As this still generates a substantial amount of text, the full results are presented in Appendix 4, and the following paragraphs discuss how the results relate to our examination of industrial policy.
Topic 53 (planning) is most closely associated with five documents that refer to government efforts to reallocate resources towards innovation-related activities, as well as towards local-level economic growth. A “leveling up” white paper deals, according to the automated summary, with “plans for local investment” entailing “three main areas for investment: improving communities and place, people and skills, and supporting local business.” A hospitality sector strategy deals with government support for “the creation of the next generation of hospitality start-ups, and [encouraging] them to take advantage of emerging technology and digital trends,” and bringing “sector leaders and businesses together with the UK’s world leading innovation system, including universities and Innovate UK.” Johnson’s “plan for growth” revolves around R&D expenditure, a regulatory system for an innovative economy, and government spending on hydrogen energy. Additional representative papers include an infrastructure strategy which entails the setting up of a government bank to invest in projects that facilitate a “green industrial revolution,” as well as to support “economic regeneration” in “towns which are most in need.” On the same note, a fifth paper, on “local growth” deals with expenditure and regulatory changes to “give greater incentives for local growth.” The planning topic therefore displays some of the key themes in the new industrial policy literature, including the digital revolution and start-ups,Footnote 29 innovation,Footnote 30 green growth,Footnote 31 and the entrepreneurial state.Footnote 32 The forms of specificity most clearly encountered in the documents related to particular technologies and activities, rather than firms or markets, which will be the case in the other topics as well.
The research topic (46) touches upon very similar issues. It includes among its most representative documents an “innovation and research strategy,” arguing for investment in “translational research at Public Sector Research Establishments […] which support businesses to develop innovative products and services.” A “plan for growth” similarly deals with research expenditure including “supporting 8 Great Technologies, where the UK could lead the world in their development.” A white paper on “regulation for the fourth industrial revolution” deals with reform to “facilitate the rapid and safe introduction of emerging products, services and business models.” Additional representative papers include a forensic science strategy, which deals with digital technologies in policing, and an “industrial strategy” white paper that lists as its main objectives increasing R&D spending as a share of GDP, as well as increasing spending on vocational education, STEM education, digital infrastructure, electric vehicles, and “Sector Deals—partnerships between government and industry aiming to increase sector productivity.” The topic therefore also reflects themes from the literature, including public research institutes,Footnote 33 technology-specific selectivity,Footnote 34 the fourth industrial revolution,Footnote 35 and government-industry partnerships.
The social policy topic (37) is represented by documents which are only marginally connected to industrial policy, and in some cases may reflect older preoccupations with motivating the disabled or the unemployed to take up employment, as well as purely public health concerns. Note however that the representative documents for this topic come from the first Cameron cabinet rather than the more recent period. The same can be said about the (non-vocational) education topic.
The vocational education topic (32) is represented by papers that deal with efforts to reallocate funding and attention towards technical educational pathways. A first paper deals with increasing the provision of technical education for 16-year-olds as well as for employed adults. A higher education white paper discusses promoting a “competitive market” that includes non-traditional providers in higher education that “will serve students, employers and taxpayers better.” Another “skills for jobs” paper promises to increase the provision of vocational training and to “give employers a central role” to “shape technical skills provision so that it meets local labor market skills needs.” These documents share a common theme, in the desire to promote the vocational educational route at the secondary and tertiary levels, using non-traditional providers and with business involvement. These objectives echo ideas from both the varieties of capitalism and industrial policy literatures, and represent a sharp departure from the strong emphasis put in the 1990s and 2000s on increasing university enrollment.
The sixth important topic, energy and climate (topic 9), is first represented by a paper on natural gas, which states that “[a]ddressing obstacles to future investment is a key objective for the Government.” Gas is promoted as an energy source to “ensure security of supply and an affordable energy mix as we move in to a low-carbon economy.” Another paper on “planning our electric future” deals with policy alternatives for reforming the electricity market to facilitate the transition to low-carbon energy. Another paper focuses on subsidies (“incentives”) for renewable energy to households. These papers therefore deal with reallocating resources towards the clean energy sector—a key proposition of the new industrial policy literature.
Motivations
One approach to examining the motivations behind the revival of interest in industrial policy is to rely on the reasoning expressed in the documents themselves. By motivations in this context, I understand the problems identified as justifying the proposed policy changes. While these can be affected by both strategic misrepresentation and by unconscious motivated reasoning, analyzing them can be useful in evaluating the case for an industrial policy approach. Encountering motivations reflecting the logic of industrial policy, such as those related to supporting particular companies, technologies, or activities, would provide further support for the resurgence hypothesis. It can also bolster the case that the industrial policy-related topics reflect a policy shift in this direction rather than a retrospective analysis or description of the current situation. The task of identifying language related to problems (negative sentiments) has received lots of attention in the field of natural language processing. The intuition behind all sentiment analysis methods is that the presence of negative and positive words in blocks of text can be measured in order to form indicators of the negativity or positivity of the text. I use Rinker’s (Reference Rinker2013) widely employed QDAP dictionary for positive and negative terms, together with the software implementation of Proellochs (Reference Proellochs2021), to identify language related to problems in the post-2010 command papers. To evaluate the motivations (problems) associated with the topics discussed in the previous section, I have used the same representative documents and identified all sentences expressing negative sentiment, using the methodology discussed in Appendix 5. A qualitative consultation of all such sentences (generally in the range of 10 to 50 for each paper) is highly illustrative for understanding the reasoning of the authors (see the full list of sentences in the replication materials). However, to avoid a potentially biased reading of this evidence, the sentences have been ranked on the basis of their centrality in the text, using the same algorithm as in the previous section, and we will only consider the top three sentences, presented in Appendix 5, for the analysis. This ensures that a fixed number of important (that is, strongly connected to the rest of the document) negative sentences are examined to discern the problems identified by the authors of the documents.
Negative sentences from representative documents for the planning topic refer almost exclusively to two considerations, namely problems encountered by various types of businesses, and regional inequality. The leveling up paper brings up problems related to the absence of six types of “capitals” (physical, human, innovative, financial, social, and institutional) in some regions, which means they “are unable to attract or retain talent, businesses are less likely to invest and innovate, civic institutions tend to lack capacity and capability.” The second representative document makes references to the persistent financial troubles of the hospitality industry. The third document focuses on the fact that “the UK leads Europe on early-stage business investment, but lags behind the US on a proportional basis,” and the need to improve government funding for such investment. The fourth document refers to infrastructure investment which “has been volatile and stop start” and would benefit from “the government’s unique position to support those risks where the private sector simply cannot.”
The research and innovation topic is represented by sentences stating that businesses are not adopting innovations in design, that “UK innovation is still seen internationally as excellent in science but weak in commercialization,” that the UK is losing its edge in high-tech areas such as nuclear energy, that businesses facing complex regulation will be less likely to innovate, that a government insurance scheme is needed to manage risk in foreign investment for British firms, and that “the UK risks losing out in the race to develop the technologies and innovations that will shape the businesses and markets of the future.”
The energy and climate topic is represented almost entirely by sentences dealing with problems faced by the energy sector, especially in relation to green energy schemes. Problems include that “support for other forms of generation could undermine certainty for gas investors,” that “as the amount of intermittent and inflexible low-carbon generation increases, gas plant load factors are likely to become increasingly uncertain,” and that “market failures that apply to electricity markets in general mean that the level of investment in reliable capacity is likely to be lower.” The vocational education topic is unsurprisingly dominated by problems related to the insufficient provision of industry-relevant vocational training, which is summarized by stating that “technical education remains the poor relation of academic education.”
These results suggest that the perception of inappropriate business performance in the absence of government intervention is the primary motivation quoted for policies related to the planning, research, vocational education, and energy/climate topics, which have in their turn been shown to be central post-2010 economic policy. The problems being identified using this methodology relate overwhelmingly to the low competitiveness of British business, including its difficulties in adopting new technologies. To this classic industrial policy motivation, the documents add occasional references to regional economic inequality, which appears to be an important component of the post-2010 policy agenda (Jennings et al Reference Jennings, McKay and Stoker2021). At the same time, motivations related to the green energy transition are largely absent from the results. Whether this reflects governments’ limited commitment to such goals beyond the public rhetoric is an open question. More generally, a fuller account of the causal mechanisms behind the rise the new industrial policy remains a challenge for future research.
Conclusions
The evidence accumulated over the last four sections contributes to answering a set of outstanding questions in the literature on industrial policy in the UK and beyond. First, while the literature has argued for the revival of industrial policy approaches, quantitative evidence for the extent, timing, and importance relative to other developments, of this revival was limited. This paper provides a rigorous confirmation of insights from the qualitative literature that a clearly distinguishable increase in content dealing with selective interventions that reflect themes and prescriptions from the new industrial policy literature has taken place in the UK, and that this was most likely a gradual process that cannot be easily linked to a single event or political change. The paper also goes beyond the literature in showing that such content has come to occupy a central role on the new economic policy agenda. There are obvious continuities between business-friendly policies enacted in the post-1980 era, which according to Woodward and Silverwood (Reference Woodward and Silverwood2023) also included targeted support for politically important sectors, and the approaches identified here, but there are also important distinctions. The evidence from the output of the topic models, the automated summarization, and the analysis of language related to motivations helps provide a clearer picture of the goals, motivations, and instruments, of the new industrial policy agenda in the UK.
Goals
A key feature of the new industrial policy approach highlighted in previous literature on the UK and beyond is that its aims go beyond traditional preoccupations with growth and competitiveness, and also include environmental,Footnote 36 and socialFootnote 37 considerations. The analysis offers support for a wide conceptualization of industrial policy in the British case, in which objectives related to reducing regional inequality, achieving net zero, and responding to crises such as COVID, are seen as comparable in importance to those related to economic performance. At the same time, the deeper analysis of motivations from section “Motivations” reinforces the importance of traditional preoccupation with firm performance. An acknowledgement of the possible contradictions between the social and economic goals is not easily visible in either the quantitative analysis presented here or in a careful reading of the most important documents.
Instruments
The logic of the new industrial policy in the UK appears to de-emphasize classic mechanisms for intervention, such as state-owned enterprises, targeted subsidies (although many forms of expenditure can be ultimately seen as subsidies for particular sectors), or trade barriers. Instead, the emphasis is placed on the following elements: First, innovation is seen as both key to plans for industrial renewal and the UK’s natural competitive advantage. This echoes policy prescriptions from the new literature on industrial policy.Footnote 38 As an immediate implication, the forms of specificity being pursued relate to particular technologies and particular activities in the production process (e.g., R&D and its commercialization), rather than the classical forms of specificity related to broad sectors, firms, or markets. The choice of these technologies and activities is driven by the belief they are key to future economic development,Footnote 39 by the UK’s perceived comparative advantage in research-intensive fields, and by broader goals such as decarbonization.
Additionally, region-specific policies are also encountered as a component of the “leveling up” agenda. Such transfers are presented as investments that will raise the productivity of left-behind regions, but also likely follow a political logic.Footnote 40 Connected to this, the emphasis on vocational education is a continuing theme through the documents. This is seen as a complement to the plans for industrial development, and represents a radical departure from the emphasis on general high-level skills which was believed to complement the UK’s liberal market economy.Footnote 41
Reflecting the prescriptions of the systems-building approach,Footnote 42 the new industrial policy also entails significant institutional development, through the many organizations being set up to intermediate between government and industry, between industry and academia, and within industries. As Coulter (Reference Coulter2022) notes however, the rapid turnover of such organizations, arising from rapid political turnover, can limit their effectiveness.
The fact that aspects of the new industrial policy can be encountered in many cases beyond the UKFootnote 43 suggests that the trend may have substantial staying power. The results on the importance of these themes on the economic policy agendas of recent British governments, point in the same direction in the UK. Whether this leads to shifts in the UK’s growth model or even variety of capitalism, or conversely whether it will lead to a rapid counter-reaction paralleling the one against classical industrial policy remains to be explored.
Supplementary material
The supplementary material for this article can be found at https://doi.org/10.1017/bap.2023.37.
Competing interests
The author has no competing interests to declare related to this manuscript.


 Open access