


Financial literacyFootnote 1 is a highly relevant skill for individuals in today’s society as many decisions involve complex financial choices from dealing with student loans and credit card debt, to purchasing a car or a home and choosing mortgage products, to investing in the stock market or pension plans. Financial literacy has also been found to improve financial inclusion (Grohmann et al., Reference Grohmann, Klühs and Menkhoff2018). However, as many as 3.5 billion adults in the world, the equivalent of 2.5 times the population of China, do not understand very basic concepts of financial literacy according to the Standard and Poor’s Ratings Services Global Financial Literacy Survey, the first comprehensive international assessment on financial knowledge (Klapper et al., Reference Klapper, Lusardi and Van Oudheusden2015). While there are substantial differences across countries with financial literacy ranging from 13 percent in Yemen to 71 percent in Denmark (Klapper et al., Reference Klapper, Lusardi and Van Oudheusden2015), financial illiteracy remains widespread around the world. Indeed, more than half of the population from Australia, Japan, the US, and many European countries is financially illiterate (Lusardi & Mitchell Reference Lusardi and Mitchell2011). Similarly, low levels of financial literacy are also common in less developed countries (Atkinson and Messy, Reference Atkinson and Messy2011).
Past research has provided a partial picture on the sources of financial literacy differences across countries. As Cupak et al. (Cupák et al., Reference Cupák, Fessler, Silgoner and Ulbrich2021) underscore, differences in observable individual characteristics cannot fully account for the observed difference in financial literacy across countries, and part of the cross-country differences correlate with country-level cultural factors (Ahunov and Van Hove, Reference Ahunov and Van Hove2020). Furthermore, while there is empirical evidence suggesting that social and economic preferences predict a wide range of behaviors and economic choices,Footnote 2 ‘the relationship between country-level preference profiles and aggregate economic outcomes is essentially uncharted territory’ (Falk et al., Reference Falk, Becker, Dohmen, Enke, Huffman and Sunde2018). To design policies and programs aiming at improving financial knowledge, a better understanding of international differences in financial literacy and the potential role of fundamental economic and social preferences such as altruism, risk-taking, reciprocity, patience, or trust is needed. This is the main objective of this paper.
Exploiting a novel global data set, the Global Preference Survey, which captures economic and social preferences across 76 countries (Falk et al., Reference Falk, Becker, Dohmen, Huffman and Sunde2023), we analyze the relationship between financial literacy and economic and social preferences and uncover the following two stylized facts. First, we document a strong association between country-level preferences and financial literacy, finding that patience and risk-taking are positively associated with financial literacy, whereas altruism is negatively associated with financial literacy. Second, we find important differences in the association between financial literacy and preferences by the level of economic development. Patience is only salient in countries above the median GDP per capita, whereas we find a diverging association of trust and positive reciprocity with financial literacy for countries above and below the median GDP per capita. In wealthier countries, trust and positive reciprocity are significantly and positively associated with financial literacy, whereas the opposite is true in impoverished countries. Quite interestingly, we also show how the observed relationship between financial literacy and preferences appears to emerge exclusively about risk-diversification and interest compounding knowledge, the two components of the financial literacy index with the lowest rate of correct answers at the country level.
We then identify several institutional and cultural variables as potential drivers of the association between preferences and financial literacy. Legal origin absorbs all of the association as far as concerns risk-taking and about half of the association with trust and positive reciprocity in countries below the median GDP per capita; and all of the association with trust in countries above the median. The association between altruism and financial literacy vanishes and that of trust is cut in half in countries below the median GDP per capita when introducing controls for the countries’ main religious groups. Noteworthy is the fact that the relationship between patience and financial literacy in wealthier countries appears very robust and not channeled through different institutional controls.
The rest of the paper is organized as follows. We begin by briefly reviewing the literature related to our work. The subsequent section describes the data and the sample used in the analysis. We next report the main empirical results for the financial literacy index, along with heterogeneity analysis and the results for the different subcomponents of the index. The final section concludes with a summary of the contributions our findings offer.
1. Summary of the literature
Because of the dire consequences of the lack of financial literacy, there has been considerably academic and public interest in understanding its determinants over the past years. Country-specific studies have found that individual socio-demographic characteristics are related to financial literacy, including gender (Annamaria and Mitchell, Reference Annamaria and Mitchell2014; Lusardi and Mitchell, Reference Lusardi and Mitchell2008), race and ethnicity (Lusardi and Mitchell, Reference Lusardi and Mitchell2007), education (Christelis et al., Reference Christelis, Jappelli and Padula2010; Lusardi, Reference Lusardi2012), low-wages and unemployment status (Lusardi and Tufano, Reference Lusardi and Tufano2015), and urban versus rural residence (Leora and Panos, Reference Leora and Panos2011).Footnote 3 There is also evidence showing the salience of family background including parental education or whether the parents held stocks or retirement accounts when the respondents were teenagers (Annamaria and Mitchell, Reference Annamaria and Mitchell2014; Hira et al., Reference Hira, Sabri and Loibl2013; Mahnaz and Horton, Reference Mahnaz and Horton2014). Most recently, Brown et al (Reference Brown, Henchoz and Spycher2018), Davoli and Hou (Reference Davoli and Hou2021) and Davoli and Rodríguez-Planas (Reference Davoli and Rodríguez-Planas2020) have analyzed the cultural dimension of financial literacy, finding that it is strongly influenced by cultural characteristics.
Fewer studies, often conducted on small samples, focus on the importance of country-level institutional and cultural factors in explaining observed differences in financial literacy and in general cross-country evidence is scarcer, for lack of better data. Jappelli (Reference Jappelli2010) finds that a country’s economic literacy, measured with the economic literacy of its business leaders, is directly related to the country’s human capital and generosity of resources available for financial investment (proxied with social security contributions rate).Footnote 4 Cupak et al. (Cupák et al., Reference Cupák, Fessler, Silgoner and Ulbrich2021) identify similar relationships on representative samples of twelve countries, employing the OECD/INFE financial literacy survey and counterfactual decomposition techniques. Ahunov & van Hove (Ahunov and Van Hove, Reference Ahunov and Van Hove2020) and De Beckker et al (Reference Beckker, Kenneth and Van Campenhout2020), using the Standard and Poor’s Financial Literacy Survey and the OECD/INFE, respectively, uncover correlations between financial literacy and national cultures measured by mean of Hoefstede’s cultural dimensions such as individualism, power distance and uncertainty avoidance. The findings from these two studies diverge possibly due to differences in sample sizes and/or the non-representativeness of Hofstede’s cultural proxies. Our study contributes to this cross-country framework by using comparable and standardized measures of both financial literacy and preferences for a large set of countries. We further identify a differential pattern by economic development allowing us to identify relevant institutional factors for impoverished countries.
While there is a vast literature in behavioral and experimental economics showing that social and economic preferences are important in explaining individuals’ behaviors and economic choices such as highest educational attainment, saving, smoking, and donating (Åkerlund et al., Reference Åkerlund, Golsteyn, Grönqvist and Lindahl2016; Barsky et al., Reference Barsky, Juster, Kimball and Shapiro1997; Dohmen et al., Reference Dohmen, Falk, Huffman and Sunde2009; Falk et al., Reference Falk, Becker, Dohmen, Enke, Huffman and Sunde2018; Golsteyn et al., Reference Golsteyn, Grönqvist and Lindahl2014; Tomomi et al., Reference Tomomi, Camerer and Nguyen2010, among others), the unavailability of data until recently has made it harder to analyze the relationship between aggregate economic outcomes and country-level preference measures (Falk et al., Reference Falk, Becker, Dohmen, Enke, Huffman and Sunde2018). Using the Global Preference Survey and exploiting cross-country variation, Falk and co-authors document a positive correlation between patience and economic development, risk taking, or entrepreneurship, as well as between negative and positive reciprocity and social outcomes (Falk et al., Reference Falk, Becker, Dohmen, Enke, Huffman and Sunde2018). In another paper, these authors also document a positive association between patience and years of schooling or gross national savings (Sunde et al, Reference Sunde, Dohmen, Enke, Falk, Huffman and Meyerheim2022). Patience and risk-aversion are found by Potrafke (Reference Potrafke2019) to positively relate to intelligence, whereas merging the Global Preference Survey with data from the Program for International Student Assessment, Hanushek et al (Reference Hanushek, Kinne, Lergetporer and Woessmann2022) find that patience and risk-taking in the country of origin of migrant students have opposing effects (positive effect of patience and negative of risk-taking) on students’ math, science and reading test scores in the country of residence. Our work contributes to this literature by providing empirical evidence of the salience of preferences and financial literacy and by documenting diverging patterns based on the country’s level of economic development. Albeit our estimates are only capturing correlations, to the extent that they are robust to a battery of sensitivity test and that we identify potential cultural drivers, our work calls for further analysis underlying the causal pathways between preferences and financial literacy.
2. Data and sample
Our analysis combines two country-level standardized data sets: the Standard & Poor’s Ratings Services Global Financial Literacy Survey (S&P FL Survey hereafter) and the Global Preference Survey (GPS hereafter).
The 2014 S&P FL Survey provides us with information about the country’s level of financially literacy. More specifically, the S&P FL index measured through the survey captures the fraction of a representative country-level sample which understands three out of four basic financial concepts, namely (1) risk diversification, (2) inflation, (3) numeracy and (4) interest compounding. This information is collected for over 140 countries around the word, it is nationally representative and comparable across countries.
The GPS constitutes the first comprehensive attempt to representatively measure economic preferences at a global scale (Falk et al, Reference Falk, Becker, Dohmen, Enke, Huffman and Sunde2018). Covering over 76 countries, the GPS measures individual-level preferences in the social domain, namely positive and negative reciprocity, trust, and altruism, and in the economic domain, namely patience and risk-taking preferences.Footnote 5 In order to construct country-level preferences, to match with the country-level measure of financial literacy from the S&P FL Survey, we follow Sunde et al (Reference Sunde, Dohmen, Enke, Falk, Huffman and Meyerheim2022). We weight preferences with the Gallup sampling weights to ensure population representativeness and obtain country-level preference measures by collapsing each preference at the country level. More details about S&P FL Survey, the GPS, and the variables construction are presented in Appendix A.
In addition, we also merge data on financial literacy and preferences with additional country-level data on GDP per capita, education, institutional and cultural characteristics of the country. A complete list of the variables and sources used is found in Appendix Table A.3.
We restricted the sample to countries available in both datasets, leaving us with a total of 74 countries. Countries in our sample cover five continents and different levels of development, ranging from high-income countries such as Australia and Canada to lower income countries such as Rwanda or Afghanistan. Our sample is composed of the same number (37) of wealthier and impoverished countries, based on whether they are above or below the median GDP per capita in our sample. Table 1 displays the average mean and standard deviation for all six preference measures, the S&P FL index and its four subcomponents for the whole sample and by level of economic development. There is considerable variation in average preferences between wealthier (columns 3 and 4) and impoverished countries (columns 5 and 6). While most of the preferences have sample-wide averages around zero, when splitting the sample in two groups according to economic development, we observe quite diverging patterns. Patience, trust, and negative reciprocity display positive means in wealthier countries, whereas risk-taking, positive reciprocity and altruism exhibit negative averages. The opposite is true for countries with GDP below the sample median. Patience and trust, especially, displays quite diverging values, ranging between 0.16 and 0.05 in wealthier countries to − 0.15 and − 0.10 in impoverished countries.
Summary statistics

Notes: Wealthy (impoverished) countries are countries with GDP per capita above (below) the sample. Each preference is normalized to have mean 0 and standard deviation 1 in the individual-level data, then country averages are computed using sampling weights provided by Gallup (see Appendix A for further detail on the preference measures). The Financial Literacy variables are country-level percentage of individuals who have correctly answered the question(s). GDP is expressed in current international dollars converted by purchasing power parity (PPP) conversion factor. Average schooling (Expected schooling) is measured in number of years capped at 15 (18) years; Subjective math-skills are assessed on a 11-point Likert scale; GINI index ranges from 0 to 100; Legal Right Index ranges from 0 to 10; Legal Origin and Religion are a set of mutually exclusive dummy variables, and we report here the % of individuals falling within each category. A more detailed description of the variable is presented in Appendix Tables A.2 and A.3
Financial literacy rates differ substantially between the two groups of countries, with 30% of the population being financially literate in impoverished countries compared to 45% in wealthier ones. This 15 percentage point gap highlights significant disparities in financial knowledge across development levels, though both groups fall considerably short of universal financial literacy.
Irrespective of wealth status, risk diversification and interest compounding are the two areas where all countries struggle the most, with risk diversification being the index subcomponent with the wider gap between wealthier and impoverished countries (48% versus 35% of correct response rate population-wide). Risk diversification being troublesome irrespective of wealth status does not come as a surprise as there is ample evidence that risk diversification is the concept people have the most difficulty grasping, regardless of the status of the country economy. Besides having a high fraction of incorrect responses, the risk-diversification question is also often linked to a higher share of ‘do not know’ answers (e.g., Annamaria and Mitchell, Reference Annamaria and Mitchell2014), showing that most respondents might not understand the question, and are simply unfamiliar with concepts such as stocks and bonds.
As far as concerns the challenges with interest compounding question, this question measures -in part- the numeracy skills of individuals and their capacity to do calculations related to interest rates, making it more complicated as compared to the other two questions that relate to basic concepts.Footnote 6
Unsurprisingly, we also observe differences in the human capital and economic development indicators across the two groups of countries, and a prevalence of German and Scandinavian commercial laws among the richer countries.
Figure 1 shows distinct associations between the S&P FL index and preferences by the level of economic development. There is a clear positive association between the S&P FL index and patience in countries above the median GDP per capita, and between the S&P FL index and risk-taking in countries below the median. In contrast, the association between S&P FL index and trust is negative in countries below the median.
Preferences and financial literacy, by whether below (a) or above (b) median GDP per capita. Notes: on the x-axis, we plot the percentage of adult population classified as financially literate in cach country, according to the S&P financial literacy index, on the y-axis the country level value of preferences from the global preferences survey. In (a): countries with GDP pe in PPP below the sample median; in (b) countries with GDP pe in PPP above the sample median.

3. Analysis and results
3.1 Average associations between financial literacy and preferences
Table 2 presents the results of a set of OLS regressions of country-level financial literacy on country-level preferences. The left-hand side variable is the percentage of adults correctly answering 3 out of 4 financial literacy questions in the S&P survey in a given country. Each panel presents results using a different measure of preference as key right-hand side variable and the average association between the S&P FL index and the preference across the 74 countries is estimated holding constant the country log GDP per capita and sequentially adding other covariates controlling for human capital development at the country level.
Financial literacy and preferences

Notes: The dependent variable is the country-level percentage of individuals who have correctly answered 3 out of 4 financial literacy questions in the S&P survey. All regressions include a constant, a control for log of GDP pc in PPP and robust standard errors (in parenthesis). Column (4) reports average marginal effects from a logit model.
* p < 0.1, **p < 0.05, ***p < 0.01
Column 1 of Table 2 reveals that patience is positively associated with financial literacy in our sample, whereas trust and altruism are negatively related to financial literacy after controlling for the country’s log GDP per capita. As financial literacy has been found in the literature to be closely related to education and human capital development (Jappelli, Reference Jappelli2010; Cupák et al., Reference Cupák, Fessler, Silgoner and Ulbrich2021), in column 2 we further control for the average schooling of the adult population and the expected schooling for children in each country. Following the findings that financial literacy is related to math ability (measured with numeracy by Skagerlund et al., Reference Skagerlund, Lind, Strömbäck, Tinghög and Västfjäll2018), in column 3, we further control for a subjective measure of math skills at the country level, which proxies for math cognitive ability. While the association between financial literacy and patience or altruism remains unchanged, the association between financial literacy and trust becomes weaker and is no longer statistically significant once country differences in education are accounted for. Interestingly, after controlling for differences in education across countries, financial literacy is positively associated with risk-taking (albeit only marginally at the 10 percent level) and negatively associated with positive reciprocity.
Based on our baseline estimates, shown in column 3 of Table 2, a one standard deviation increase in patience is associated with 7.05 percentage points increase in financial literacy,Footnote 7 the equivalent of an increase of 18.75 percent in financial literacy given the S&P FL index averages 37.60 percent in our sample.Footnote 8 This association is statistically significant at the 1 percent level. Estimates in column 3 also reveal that a one standard deviation increase in risk-taking is associated with 2.26 percentage points increase in financial literacy,Footnote 9 the equivalent of an increase of 6 percent in financial literacy.Footnote 10 However, this association is only statistically significant at the 10 percent level. In contrast, a one standard deviation increase in altruism or positive reciprocity is associated with a decrease of 7.87 and 6.85 percent, respectively, in financial literacy.Footnote 11 Both coefficients are statistically significant at the 5 percent or lower. These results hold when using a Logit instead of a linear regression as shown in column 4 of Table 2. The Logit regression model allows us to better accommodate the fractional nature of the dependent variable, a proportion bounded between 0 and 1.
3.2 Heterogeneity by Economic Development
Average associations between financial literacy and preferences in our sample conceal notable differences by whether the country is below or above the median GDP per capita. Table 3 reports estimates from regressions of the S&P FL index on the different preferences by level of economic development using the following model:
 \begin{align*}{\text{S}}\& {\text{PFL}}{{\text{I}}_{\text{j}}} & = {{\beta}_0} + {{\beta}_1}{\text{Preferenc}}{{\text{e}}_{\text{j}}} + {{\beta }_2}{\text{AboveMedianGD}}{{\text{P}}_{{\text{pc}}}}_j\\
&\qquad+\,{{\beta}_3}\left( {{\text{AboveMedianGD}}{{\text{P}}_{{\text{pc}}}}_j{\text{x Preferenc}}{{\text{e}}_{\text{j}}}} \right) + Z{'_j}{\beta _4} + {{\varepsilon}_{\text{j}}}\end{align*}
\begin{align*}{\text{S}}\& {\text{PFL}}{{\text{I}}_{\text{j}}} & = {{\beta}_0} + {{\beta}_1}{\text{Preferenc}}{{\text{e}}_{\text{j}}} + {{\beta }_2}{\text{AboveMedianGD}}{{\text{P}}_{{\text{pc}}}}_j\\
&\qquad+\,{{\beta}_3}\left( {{\text{AboveMedianGD}}{{\text{P}}_{{\text{pc}}}}_j{\text{x Preferenc}}{{\text{e}}_{\text{j}}}} \right) + Z{'_j}{\beta _4} + {{\varepsilon}_{\text{j}}}\end{align*}Financial literacy and preferences by level of economic development

Notes: The dependent variable is the country-level percentage of individuals who have correctly answered 3 out of 4 financial literacy questions in the S&P survey. All regressions include a constant and robust standard error (in parenthesis).”Above median log(GDP)” is a dummy for countries with GDP pc above the sample median. Column (4) reports average marginal effects from a logit model.
* p < 0.1, **p < 0.05, ***p < 0.01
where  $S\& PFL{I_j}$ is the S&P FL index, which measures financial literacy at country $j$ level; ${\text{Preferenc}}{{\text{e}}_{\text{j}}}$ is the GPS preference measured at the country $j$;
$j$;  ${\text{AboveMedianGD}}{{\text{P}}_{{\text{pc}}}}_j$ is a dummy variable indicating whether country j’s GDP per capita is above the median GDP per capita in our sample; and $({\text{AboveMedianGD}}{{\text{P}}_{{\text{pc}}}}_j{\text{x Preferenc}}{{\text{e}}_{\text{j}}}$) is the interaction between the two aforementioned variables. The vector ${Z_j}$ includes country-level covariates that will vary with the estimated specification. Standard errors are heteroscedasticity robust.
In the equation above,  ${\hat \beta _1}$ measures the average association between the country-level S&P FL index and country-level preference, say patience, in countries below the median GDP per capita. The coefficient, ${\hat \beta _2}$, measures the average difference in financial literacy between countries with a GDP per capita above the median (wealthier countries) and those below (impoverished countries). The coefficient, ${\hat \beta _3}$, measures the differential association between financial literacy and preference in wealthier relative to impoverished countries. Finally, the sum of the coefficients ${\hat \beta _{1{\text{ }}}},{\text{ }}{\hat \beta _2},{\text{ }}and{\text{ }}{\hat \beta _3}$, namely $\left( {{{\hat \beta }_1} + {{\hat \beta }_2} + {{\hat \beta }_3}} \right)$, measures the overall association between the country-level S&P FL index and country-level preference in countries with GDP per capita above the median.
Panel A of Table 3 reveals that patience is only salient in wealthier countries. The positive association between financial literacy and patience observed in Table 2 is solely driven by countries whose GDP per capita is above the sample median. Based on estimates of column 3, a one standard deviation increase in patience is associated with an increase of about 30 percent in financial literacy in countries above the median GDP per capita.Footnote 12 This effect is statistically significant at the 1 percent level. In contrast, there is no association between patience and financial literacy in countries below the median. This difference by countries’ economic development is statistically significantly different from zero at the 1 percent level (see  ${\hat \beta _3})$.
Moving to trust, we find a diverging association with financial literacy for countries above and below the median GDP per capita. A one standard deviation increase in trust is associated with an increase of 7.47 percent in financial literacy in wealthier countries, but with a decrease of 12.63 percent in impoverished countries.Footnote 13 These effects are statistically significant at the 5 percent level. While the coefficients  ${\hat \beta _1}$ and ${\hat \beta _3}$ have opposite signs for risk-taking and altruism, we do not have enough precision to reject the null hypothesis ${H_0}:{\hat \beta _3} = 0$.
Furthermore, the observed negative association between positive reciprocity and financial literacy when using the whole sample of 74 countries is driven solely by countries with a GDP per capita below the median. In these countries, a one standard deviation increase in positive reciprocity is associated with a decrease of 11.45 percent in financial literacy.Footnote 14 It is important to underscore that such association is inexistent in countries above the median GDP per capita as  $\left( {{{\hat \beta }_1} + {{\hat \beta }_2} + {{\hat \beta }_3}} \right)$ = 0.01 with a standard error of 0.076.
These findings are robust to different validation tests. First, in column (4) of Table 3, we estimate the parameters of our preferred specification through a fractional Logit model. Doing so, does not affect the main results. In Appendix Table B.1, we estimate a fully interacted model with all covariates interacted with the above the median GDP per capita dummy. While some of the estimates lose precision, the direction of the associations remains stable. Finally, in Appendix Table B.2, we consider different definitions of country economic development by estimating our baseline specificationFootnote 15 using GDP quartiles (Panel A), income groups defined by the World Bank (Panel B), and an OECD-countries indicator (Panel C). Our main results are mostly robust to these alternative measures of economic development. The major difference is observed for OECD-countries where we observe higher financial literacy for those with higher levels of risk-taking. This may suggest that the differential effect of risk-taking is not exclusively driven by economic development but by an overall improved policy and legal framework.
3.3 Institutional and Cultural Drivers
To explore which factors may be driving these correlations, we introduce in our OLS model other relevant controls capturing institutional and cultural factors which previous studies have deemed to be relevant in explaining financial literacy. As the culture of a country may influence the degree of interest and investment in financial knowledge, we introduce proxies for cultural institutions.
Results are presented in Table 4.Footnote 16 Column 1 presents our baseline model for comparison purposes. Column 2 adds to the baseline model the Gini index. This index measures the extent to which the income distribution among individuals within a country deviates from a perfectly equal distribution (with an index close to 1 being very unequal and an index close to 0 being very equal). As conjectured by Ahunov & van Hove (Ahunov and Van Hove, Reference Ahunov and Van Hove2020) in their analysis of national culture and financial literacy, in highly unequal countries less people may have the material means to invest in their financial education. Column 3 adds to our baseline model the legal rights index, which measures the degree to which collateral and bankruptcy laws protect the rights of borrowers and lenders and thus facilitate lending, and column 4 adds to the baseline model the legal origin of the country, which is a strong determinant of the depth of a country’s financial markets (Rafael et al., Reference Rafael, Florencio, Shleifer and Vishny1997, Reference Rafael, Florencio, Shleifer, Vishny, Constantinides, Harris and Stulz2013). Both covariates aim at capturing institutional differences across countries that are likely to be associated with financial knowledge. Column 5 controls for the share of the population of each country that belongs to the three most widely spread religions in the world, as countries in which the majority of population follow a particular religion may have different incentives to invest in financial literacy (Grohmann et al., Reference Grohmann, Klühs and Menkhoff2018). Finally, columns 7 and 8 include controls for geographical characteristics of the country and for the share of population in the country older than 65 years. Following Falk et al (Reference Falk, Becker, Dohmen, Enke, Huffman and Sunde2018), we control for a set of geographic variables that have been proposed as potential determinants of preferences in the literature. To the extent that these geographical factors also shape human capital accumulation in the country (and hence, financial literacy), not including such controls may lead to omitted variable bias. A similar motive is also behind the choice of including country-level age structure as an additional control variable. In fact, recent evidence has underscored systematic variation in preferences over the life cycle (Sunde, Reference Sunde2023), and the link between age-related cognitive and physical decline, financial literacy, and intertemporal decision-making (Bialowolski et al., Reference Bialowolski, Cwynar and Weziak-Bialowolska2022; Huffman et al., Reference Huffman, Maurer and Mitchell2019; James et al., Reference James, Boyle, Yu, Han and Bennett2015).
Financial literacy and preferences: additional controls

Notes: The dependent variable is the country-level percentage of individuals who have correctly answered 3 out of 4 financial literacy questions in the S&P survey. All regressions include a constant, controls for education and math skills and robust standard errors (in parenthesis).”Above median log(GDP)” is a dummy for countries with GDP pc above the sample median. Geographical controls are: average precipitations, average temperature, distance to the nearest waterway, latitude, rugged terrain, distance to Equator (as in Falk et al, Reference Falk, Becker, Dohmen, Enke, Huffman and Sunde2018). Age structure is the share of population being 65 years old or older.
* p < 0.1, **p < 0.05, ***p < 0.01
As a first result, it is worth noting how preferences on patience remains practically unaffected by the introduction of new controls. To put it differently, the relationship underlined in Table 3 between patience and financial literacy in countries above the median GDP per capita appears very robust and not channeled through the different institutional controls we have added to the specification.
As far as concerns risk-taking, trust, altruism and positive reciprocity, we observe a noticeable change, in magnitude and significance of the correlations, following the introduction in the model of legal origin, and religion dummies. Legal origin absorbs all of the association as far as concerns risk-taking and about half of the association with trust and positive reciprocity in countries below the median GDP per capita; and all of the association with trust in countries above the median. At the same time, the association between altruism and financial literacy vanishes and that of trust is cut in half in countries below the median GDP per capita when introducing controls for the countries’ main religious groups. Appendix Table B.3, which reports the full set of estimates, suggests that emphasizing traits common among Protestantism would increase financial literacy in countries below the median GDP per capita. Similarly, emphasizing traits common among Scandinavian legal origin would also benefit financial literacy in impoverished countries. Column (6) in Table 4 reveals that continent dummies absorb most of the correlation between financial literacy and risk-taking and positive reciprocity.
3.4 Subcomponents of Financial Literacy
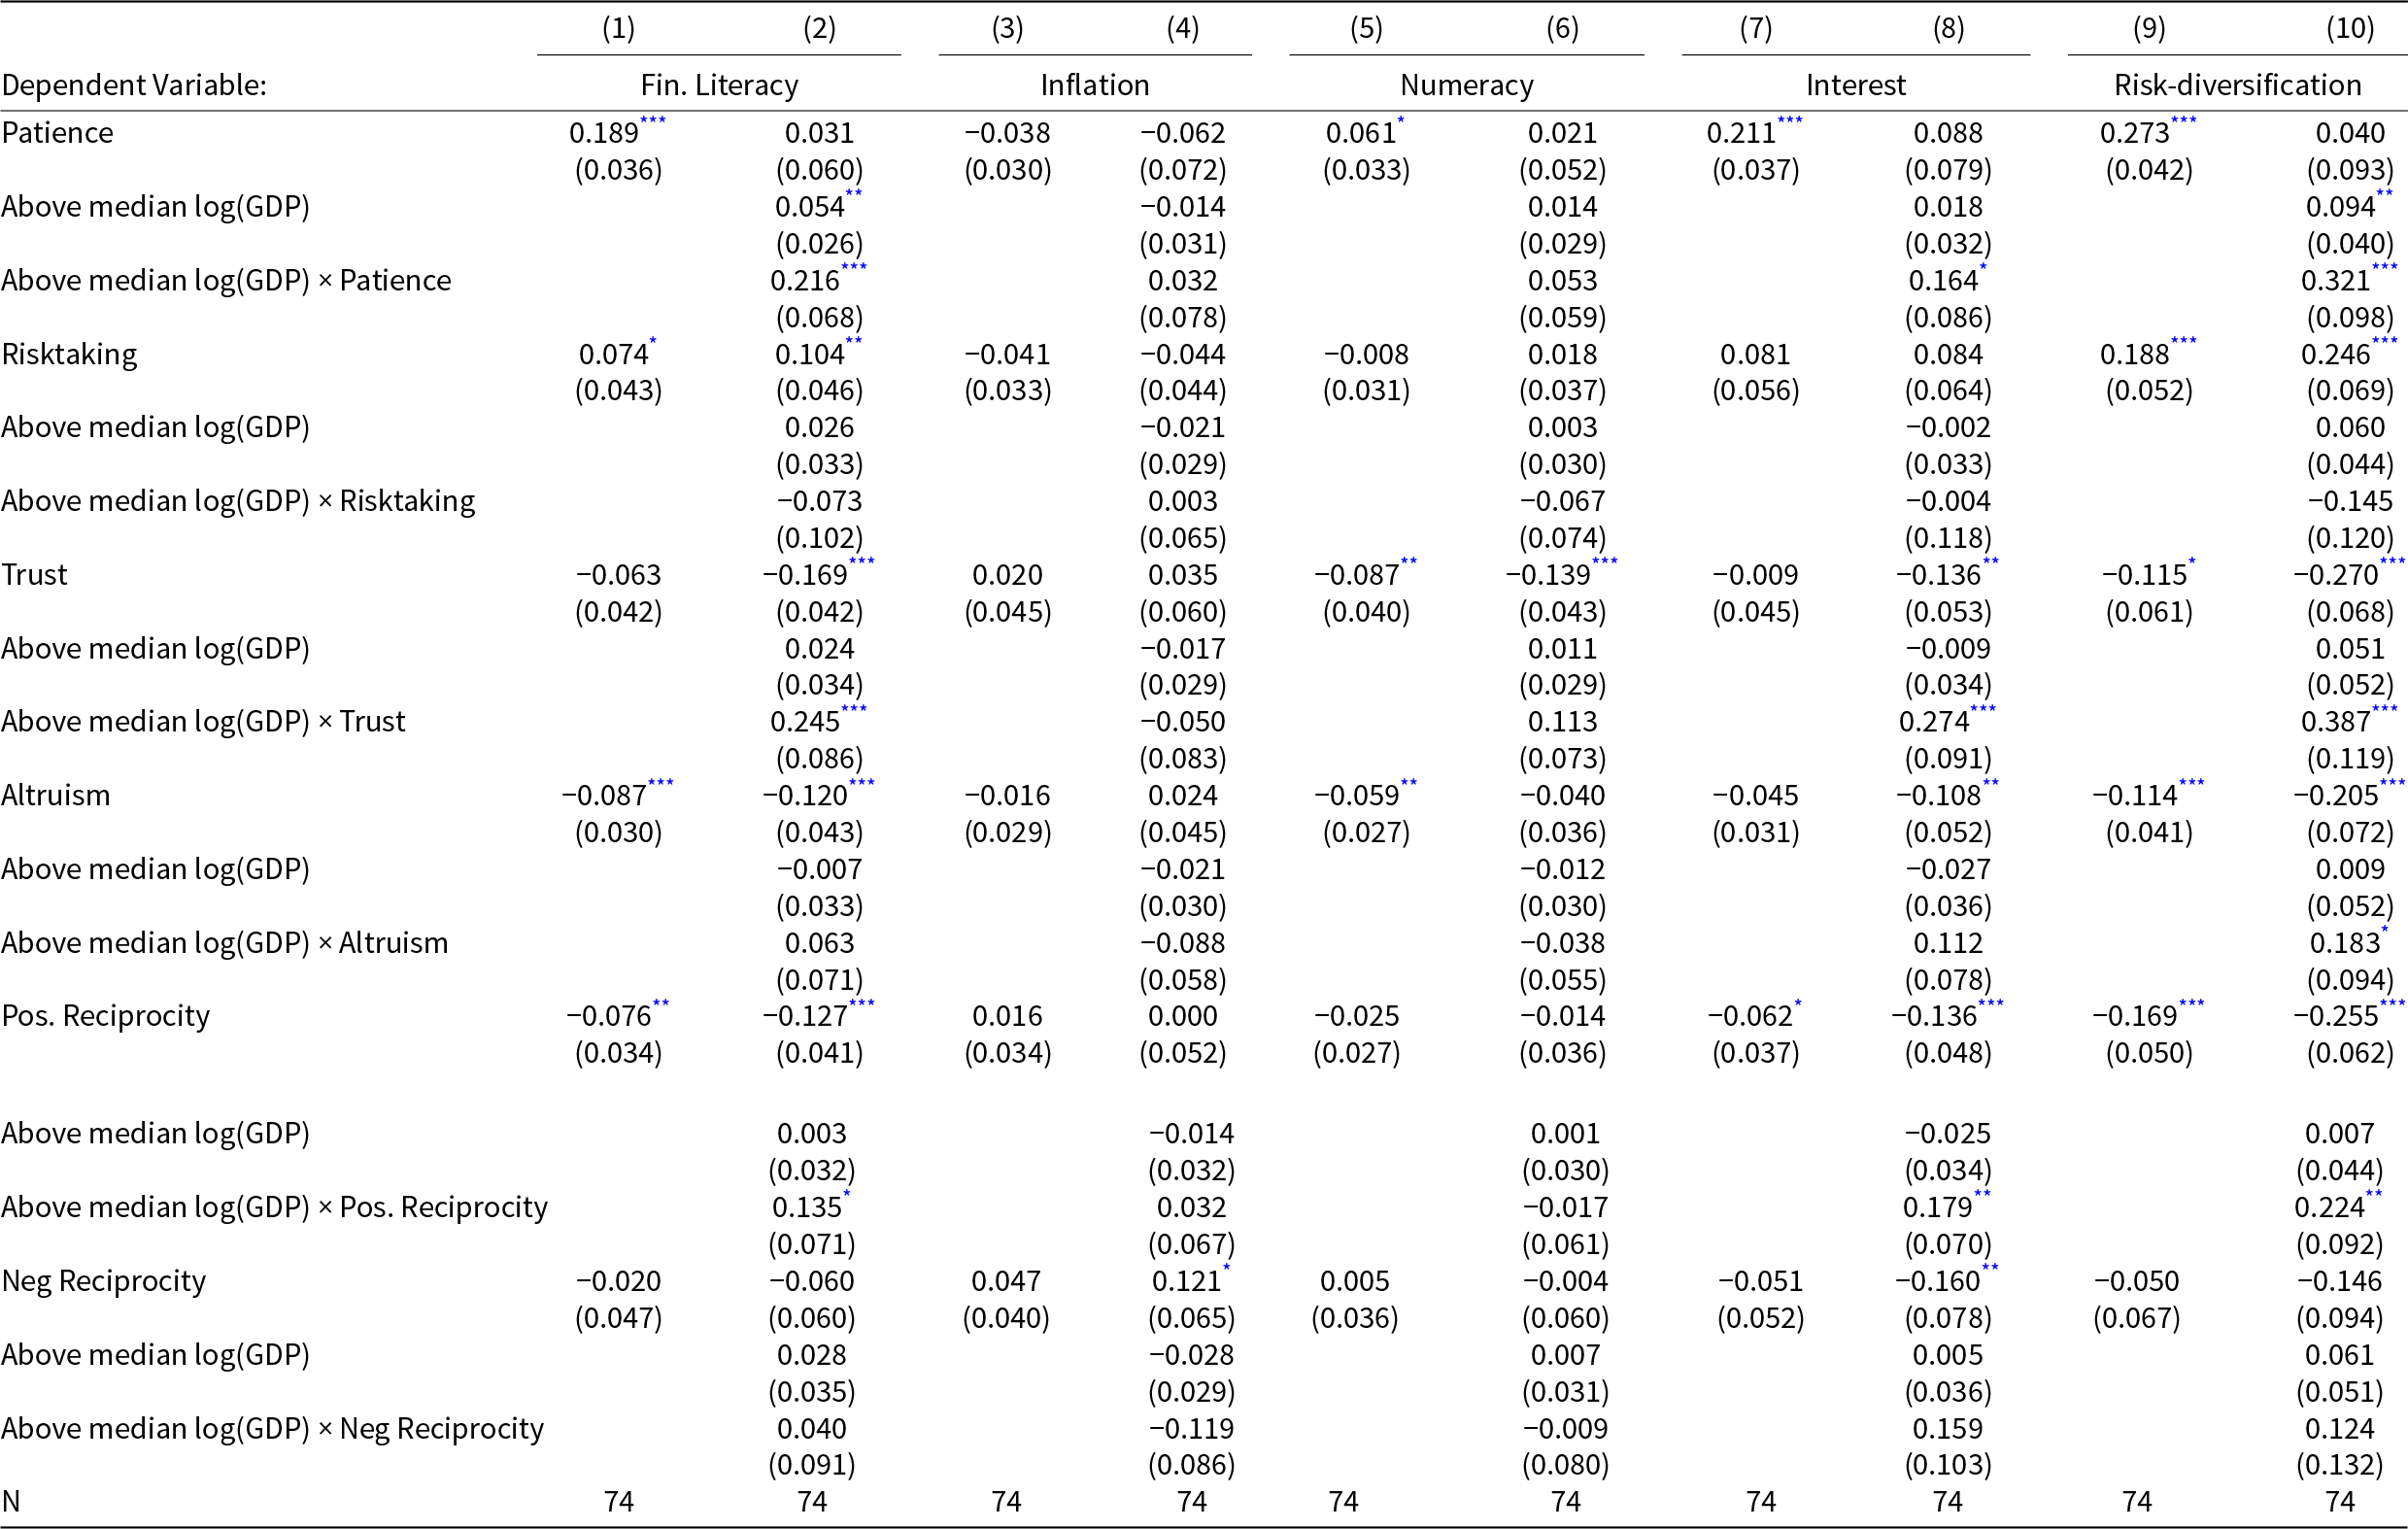
As a last step, we try to disentangle which field of knowledge is mostly associated to preferences and analyze the different subcomponents of the financial literacy index. The S&P FL index is composed of four different questions on risk diversification, inflation, numeracy, and interest compounding, with quite different response rates across the countries. For example, the questions on inflation and numeracy are the ones that exhibit the highest response rate, with more than half of the sample answering them correctly, whereas, on average, 60 percent of people exhibit illiteracy as far as concern the risk diversification concept (see Table 1). While being correlated with each other (Appendix Table A.4), these questions capture different aspects of financial literacy, and hence may exhibit heterogeneous relationship with preferences. Table 5 estimates our baseline specification, replacing the overall financial literacy index with the four different sub-components of the S&P FL index.
Financial literacy sub-questions and preferences

Notes: The dependent variable is the country-level percentage of individuals who have correctly answered 3 out of 4 financial literacy questions (column (1)-(2)) or the specific questions (column (3)-(10)). All regressions include a constant, education and math skills regressors as in Table 3, column (6) and robust standard errors.
Odd columns control also for log of GDP per capita.”Above median log(GDP)” is a dummy for countries with GDP per capita above the sample median.
* p < 0.1, **p < 0.05, ***p < 0.01
Interestingly, inflation does not appear to correlate with any of the GPS preferences. As for the share of population correctly answering the numeracy question, we observe an association with trust, regardless of the country’s economic development measured by the GDP per capita.
The subcomponents of the S&P FL index that truly correlate with preferences, however, are the ones related to risk-diversification and interest compounding. Based on estimates from column 10 of Table 5, a one standard deviation increase in the country-level measure of patience is associated with an increase of about 41 percent in the rate of people correctly answering the risk-diversification question in countries with GDP per capita above the median.Footnote 17 Furthermore, the difference by countries’ economic development is statistically different from zero at the 1 percent significant level. In contrast, risk-taking, altruism, and positive reciprocity are associated with the rate of people correctly answering the risk-diversification question only in countries below the GDP sample median, as the effect in countries above the median is not precisely estimated – that is, the estimated  $\left( {{{\hat \beta }_1} + {{\hat \beta }_2} + {{\hat \beta }_3}} \right)$ is not significantly different from zero. In fact, a one standard deviation increase in risk-taking is associated with an 18 percent increase in the rate of correct responses to the risk diversification question. A one standard deviation increase in altruism and positive reciprocity corresponds to a 17 percent and a 21 percent decrease in the rate of correct responses to the risk diversification question.Footnote 18
Trust has, like with the general index of financial literacy, a diverging effect according to the economic development: a one standard deviation increase in trust is associated with an increase of about 11 percent in the rate of correct responses to the risk diversification question in wealthier countries (significant at the 10 per cent), and with a decrease of 18 percent in impoverished countries (significant at the 1 per cent).Footnote 19
Similarly, based on the estimates of column 8 we observe that, for countries above the median GDP per capita, a one standard deviation increase in patience (trust) is associated with a statistically significant increase of around 22 percent (8 percent) in the rate of respondents answering correctly the question on interest compounding.Footnote 20 In contrast, in countries below the median, a one standard deviation increase in trust and altruism diminish the rate of correct response by around 8 percent. At the same time, a one standard deviation increase in positive reciprocity decreases financial literacy by about 10 percent in countries below the median.Footnote 21
4. Discussion and conclusion
4.1 Discussion of the results
While the literature observes large differences in average financial literacy across countries (Annamaria and Mitchell, Reference Annamaria and Mitchell2014), meaningful cross-country evidence on the topic is scarce. Preferences and financial literacy both are considered to be important correlates of general well-being in the population, but the interplay between the two has not been widely studied. Merging two global, representative, and relatively novel datasets, the Global Preference Survey and the Standard & Poor’s Ratings Services Global Financial Literacy Survey, we uncover important differences in the association between financial literacy and preferences by the level of economic development.
In countries below the median GDP per capita, we document a higher level of financial literacy in countries with higher levels of risk-taking, but with lower levels of trust, positive reciprocity, and altruism. Countries’ legal origin drives all of the association with risk-taking and about half of the relationship with trust and positive reciprocity. The countries’ distribution of major religions drives the association between altruism and financial literacy. Ultimately our results document that the association between these preferences and financial literacy in countries below the median GDP per capita appears to be driven by institutional factors, suggesting that training program and policies emphasizing certain traits associated with Scandinavian legal origin or Protestantism would help improve financial literacy.
Interestingly, patience is only salient in countries above the median GDP per capita, with higher financial literacy in countries with higher level of patience. Importantly, this association is very robust, and it is not driven by a multitude of institutional or cultural factors known to be related to financial literacy. This positive association between financial literacy and patience is somewhat in line with the work of Hanushek et al (Reference Hanushek, Kinne, Lergetporer and Woessmann2022) and with the idea that human capital investment decisions are, by nature, intertemporal decisions, and hence inextricably linked to cultural traits, such as time preferences, related to the valuation of present versus future payoffs. Furthermore, as pointed out by Lusardi et al. (Annamaria et al., Reference Annamaria, Michaud and Mitchell2017), if more patient households would be more inclined to invest in human capital and, more specifically, in financial knowledge, education and wealth levels are likely to be important factors of heterogeneity in the patience-knowledge association. The lack of relationship between patience and financial literacy in impoverished countries, and the generally lower level of patience, might be related to the more uncertain horizon that populations in those countries may face.
The last interesting result of our analysis relates to the differential relationship between preferences and the four sub-components of the financial literacy index. The associations outlined above only emerge when knowledge on risk diversification and interest compounding are taken into account, the two financial literacy questions people struggle the most with (Annamaria and Mitchell, Reference Annamaria and Mitchell2014). In contrast to other studies, we analyze the link between financial literacy and preferences in a unified framework, by looking at both social and economic preferences as possible correlates of financial literacy. This is important because preferences do not typically affect decisions and life outcomes in an isolated manner bur rather jointly, hence it makes sense to consider them in a unified framework.Footnote 22 Our analysis is, to some extent, similar to the ones performed by Ahunov & van Hove (Ahunov and Van Hove, Reference Ahunov and Van Hove2020) and De Beckker et al (Reference Beckker, Kenneth and Van Campenhout2020). The first employ the Standard and Poor’s Financial Literacy Survey while the latter the OECD/INFE financial literacy surveys to uncover correlations between financial literacy and national cultures measured by mean of Hoefstede’s cultural dimensions, such as individualism, power distance and uncertainty avoidance. However, the findings from these two studies diverge, possibly due to differences in sample sizes or the non-representativeness of Hofstede’s cultural proxies. In fact, differently from the GPS, Hofstede’s measures of national culture are the result of interviews to non-representative samples of IBM employees, and, while being still in use, the validity of these measures have been largely criticized (see, e.g., Shaiq et al., Reference Shaiq, Khalid, Akram and Ali2011). Hence, our study contributes to this cross-country framework by using comparable and standardized measures of both financial literacy and preferences for a large set of countries. Moreover, we identify a differential pattern by economic development allowing us to identify relevant institutional factors specific for impoverished countries.
4.2 Limitations and endogeneity
This study explores associations between financial literacy, risk preferences, and cultural traits across countries, making no causality claims. While our cross-country data and aggregated preference measures uncover novel correlations that provide valuable insights for future research, several limitations must be considered when interpreting our results.
First, when analyzing a complex construct like financial literacy, confounding factors present a significant challenge, as it is difficult to control for all relevant variables. Preferences are not inherently bestowed on certain countries; institutional and societal characteristics contribute to their development while also influencing country-level financial literacy accumulation.
Second, bidirectional relationships may exist between financial literacy and preferences. Countries with more developed financial markets might provide better opportunities for individuals to access financial information, potentially strengthening preferences such as patience and risk-taking. More patient individuals may self-select into activities that promote financial knowledge, anticipating long-term returns on such human capital investment (Meier and Sprenger, Reference Meier and Sprenger2013). Simultaneously, gaining financial knowledge could affect individuals’ deep time preferences (Lührmann et al., Reference Lührmann, Serra-Garcia and Winter2018). Different studies demonstrate that time preferences correlate with financial information acquisition and better financial outcomes (Lührmann et al., Reference Lührmann, Serra-Garcia and Winter2018; Meier and Sprenger, Reference Meier and Sprenger2012, Reference Meier and Sprenger2013), while financial literacy interventions can alter individuals’ subjective discount rates and time preferences (Lahav et al., Reference Lahav, Rosenboim and Shavit2015; Lührmann et al., Reference Lührmann, Serra-Garcia and Winter2018). Thus, the directionality between time preferences and financial literacy remains ambiguous.
Third, we cannot control for factors such as present bias and exponential growth bias, both linked with financial behavior and patience. The GPS patience measure captures a concept close to present bias, as respondents indicate their willingness to delay gratification. Since both present-bias and exponential-growth bias appear negatively correlated with financial literacy (Almenberg and Gerdes, Reference Almenberg and Gerdes2012; Wang and St John, Reference Wang and St John2025), omitting these measures likely creates a downward bias in our estimates of the patience-financial literacy relationship.
While it is challenging to address the endogeneity of preferences, evidence suggests their origins lie deeper than economic development. Becker et al (Reference Becker, Enke and Falk2020), utilizing GPS data, show that preference differences between populations are largely explained by distant migration patterns of early ancestors, somewhat confirmed by Galor & Özark (Reference Galor and Özak2016). Falk et al (Reference Falk, Becker, Dohmen, Enke, Huffman and Sunde2018) and Wang et al (Reference Wang, Rieger and Hens2016) provide evidence that aggregate preferences strongly relate to cultural and geographic conditions. It is reasonable to consider preferences as deep determinants affecting financial literacy, possibly through proximate determinants such as GDP or country wealth. However, distinguishing preference effects on financial literacy from other factors possibly determined by preferences remains econometrically challenging, which is why our results should be interpreted as robust correlations rather than evidence of causal relationships.
Though some instrumental variables have been used to address financial literacy endogeneity in other contexts (Behrman et al., Reference Behrman, Mitchell, Soo and Bravo2012; Grohmann et al., Reference Grohmann, Klühs and Menkhoff2018; Ricci and Carratelli, Reference Ricci and Carratelli2017), there is, to our knowledge, no paper successfully instrumenting preferences at the country level. As there is no suitable instrumental variable for all our preference measures, we cannot use an IV estimation strategy.
While it should be underlined that our results do not imply causality, the robust correlations found in our analysis stress the importance of further research into the causal link between financial literacy and preferences. Overall, our study underlines the need for additional studies and theories to explain a possible link between financial literacy and different preferences in the context of varying levels of economic development. Furthermore, it suggests that designing policies to improve financial literacy requires a multi-faceted approach that considers not only the formal institutional framework where initiatives are promoted but also the societal and cultural context.
Despite these limitations, our study advances the understanding of financial literacy’s relationship with cultural and behavioral attributes across national contexts. Future research employing longitudinal designs or natural experiments could further illuminate the mechanisms underlying these associations and potentially address questions of causality beyond the scope of this investigation.
Supplementary material
The supplementary material for this article can be found at https://doi.org/10.1017/S1474747225100048.


 Open access