


Introduction
Social status has become an important concept in political science to explain recent radical right successes. Defined as the ranked esteem that is accorded to social groups, social status is useful to capture perceptions of societal decline and stigma. Although the concept has been around for decades (Lipset, Reference Lipset1955), the growing interest in resentment among the radical right, Trump, and Brexit supporters has revived research on status politics (Breyer, Reference Breyer2024a; Cramer, Reference Cramer2016; Carella & Ford, Reference Carella and Ford2020; Gest et al., Reference Gest, Reny and Mayer2018; Gidron & Hall, Reference Gidron and Hall2017, Reference Gidron and Hall2020; Hochschild, Reference Hochschild2018; Kurer & van Staalduinen, Reference Kurer and van Staalduinen2022; Kurer, Reference Kurer2020; Oesch & Vigna, Reference Oesch and Vigna2022; Suryanarayan, Reference Suryanarayan2019). Despite this growing interest, we still have limited knowledge of how people perceive of social status and what it encompasses.
This study deals with the perceived sources and degree of contestation of current social status hierarchies, which we know little about due to ongoing structural changes in Western European societies. A number of interrelated developments have altered existing class and status hierarchies during the past decades, such as rising income inequality (Engler & Weisstanner, Reference Engler and Weisstanner2021), lower social mobility (Kurer & van Staalduinen, Reference Kurer and van Staalduinen2022), automation (Kurer, Reference Kurer2020), women's participation in the labour market (Murphy & Oesch, Reference Murphy and Oesch2016), migration movements and the increasing diversity of Western societies (Bonikowski, Reference Bonikowski2017). This makes it far from trivial to determine which attributes are important for people's sense of worth today. Additionally, recent evidence from Oesch and Vigna (Reference Oesch and Vigna2022) questions whether objective upheavals have even translated into shifts in social status perceptions.
As a result, there is uncertainty and debate in the literature about the relative importance of cultural and economic sources of status. The general consensus is that socioeconomic sources like occupation and income are crucial for social stratification (Harrits & Pedersen, Reference Harrits and Pedersen2019). Despite the increasing acknowledgment that social status also encompasses broader sociocultural perceptions (Abou-Chadi & Kurer, Reference Abou‐Chadi and Kurer2021; Bolet, Reference Bolet2021; Kurer, Reference Kurer2020), few researchers actually test to what extent cultural factors feed into social status. Furthermore, the existing studies cannot fully unravel the multiple dimensions of social status because economic and cultural sources of status are always intertwined in observational designs. For example, it remains unclear why the social status of men, and especially low-educated men, has decreased over the past decades, whereas women experienced a relative increase (Gidron & Hall, Reference Gidron and Hall2017). Is this really due to changing cultural gender norms, or is it simply a result of women's rising educational level and their increasing participation in more prestigious occupations, also resulting in higher incomes? While these structural developments go together in reality, it is important to disentangle and causally identify the relative effect of cultural and economic sources as this helps to understand peoples' political motivations to change or preserve their social status. Coming back to the example, if men are resentful about societal changes, it is important to know whether they are motivated by experiences of losing occupational prestige or also by attempts to preserve gendered status advantages compared to women.
Next to disentangling current status sources, a related crucial question is also assessed: Are the sources of social status agreed upon? I propose that the degree of consensus across different societal groups shows us how contested status sources are in the political arena. Agreement between groups points towards a stable and salient type of inequality, while divergence points to contested and potentially changing hierarchies. To what extent hierarchies have flattened is especially contested for gender, race and sexuality in current political debates on ‘culture wars’. Thus, the importance of and degree of consensus on cultural status sources are assessed here to come to an overall assessment of how they may impact status politics alongside economic ones.
This paper applies an innovative conjoint experiment to disentangle the economic and cultural sources of status in a systematic way for the first time. Conjoint designs have proven their large value to examine sources of multidimensional concepts (Hainmueller et al., Reference Hainmueller, Hopkins and Yamamoto2014; Horiuchi et al., Reference Horiuchi, Smith and Yamamoto2018) and can thus help us overcome the empirical challenge of assessing interrelated status sources. In the design developed here, respondents are asked to rank hypothetical profiles with randomized characteristics such as gender, migration background, occupation and income on the societal hierarchy. Crucially, this study assesses second-order perceptions of status. Respondents place others, not themselves, which allows me to derive an intersubjectively existing social status hierarchy. In contrast to the dominant focus on subjective social status in the recent political science literature (Bolet, Reference Bolet2023; Engler & Weisstanner, Reference Engler and Weisstanner2021; Gidron & Hall, Reference Gidron and Hall2017; Nolan & Weisstanner, Reference Nolan and Weisstanner2022; Oesch & Vigna, Reference Oesch and Vigna2022), I thus take a different, complementary perspective. While overall perceptions are certainly not unrelated to personal motivations, they put comparatively less emphasis on subjective benchmarks than self-placements. More specifically, when estimating one's own position in society, individuals are likely to try to maintain a positive self-concept, leading them to neither admit a very low nor a very high or privileged position (Evans & Kelley, Reference Evans and Kelley2004; Zollinger, Reference Zollinger2024a). An honest acknowledgment of status stratification is more likely when placing hypothetical others.
The conjoint experiment was carried out in an online survey in Switzerland, a Western European country with rather typical levels of inequality on different indicators. Thus, findings on the Swiss social status hierarchy likely broadly generalize to other Western European countries. Furthermore, Switzerland is a country with high polarization and a strong radical right party, making it a relevant case to assess the social status hierarchy in the context of perceptions of declining societal respect.
The results show that individuals perceive a clear status hierarchy based on economic as well as cultural sources. Occupation and race/ethnicity are especially important for positioning others regarding their social status. The high significance of race is striking for the Western European context, considering that its importance is more often denied in public debates in Europe than, for example, in the United States (De Genova, Reference De Genova2018; M'charek et al., Reference M'charek, Schramm and Skinner2014). Additionally, factors like income, education, gender and sexuality also affect status significantly, while a rural or urban place of residence does not seem central in the Swiss case. I also provide evidence of a strong underlying social status consensus. There is very little variation between subgroups in the evaluation of status sources.
The empirical contribution of this paper is relevant for the literature on status politics and roots of the radical right but also for scholars of inequality and polarization. I show that cultural types of inequality are acknowledged widely, even across groups of different status like those with and without a migration background. This implies that resentment against societal change is rooted in the differing evaluation of hierarchies, while perceptions of it are widely shared and not polarized. Conceptually, the study contributes to the literature on social status by measuring intersubjective perceptions of the status hierarchy. Asking respondents to place others according to their status, not themselves, provides a closer approximation of structural stratification, privilege and discrimination. This is a complementary perspective and an important foundation to the previous focus of the literature on status anxiety, as it shows which sources of status can be mobilized and become central for this type of resentment. Thus, the conjoint experiment developed here is also an important methodological advance for research on social hierarchies.
Theoretical framework
The social status hierarchy
Following the seminal work by Weber (Reference Weber1922), social status can be understood as the societal esteem that is accorded to social groups. In this conceptual tradition, status is defined as distinct from class: While class is an economic hierarchy based on production relations and the distribution of resources, the social status hierarchy embodies positive or negative evaluations of groups based on their ascribed worth (Weber, Reference Weber1922, pp. 177–180).Footnote 1 In the following, I use the term social status for the position an individual or group takes along this hierarchy of group esteem or recognition, the social status hierarchy.
The social status hierarchy is based on intersubjectively shared beliefs and cultural norms about which types of people are more esteemed and recognized compared to others (Ridgeway, Reference Ridgeway2019, pp. 3–4).Footnote 2 While there is thus a foundation in perceptions, inequalities based on social esteem have tangible consequences for people's lives. An esteem-based ranking of groups – distinguished by their lifestyle, descent, education or occupation – easily translates into objective legal, economic, ritual and ethnic separations, of which castes can be seen as the most extreme materialization (Suryanarayan, Reference Suryanarayan2019; Weber, Reference Weber1922).
Recent literature has assessed the importance of social status for political behaviour through a focus on the subjective self-placement of individuals, using the concept of subjective social status, or the ‘level of social respect or esteem people believe is accorded them within the social order’ (Gidron & Hall, Reference Gidron and Hall2017, p. S61).Footnote 3 I take a different, complementary perspective here, by theorizing and assessing societal perceptions of the overall status hierarchy, which corresponds to the intersubjective aspect of status. Such a structural perspective on status is important to put subjective self-placements and individual perceptions of status anxiety in perspective. For example, the White working class often features in narratives of being ‘left behind’ (Gest, Reference Gest2016). However, it is unclear to what extent Whiteness and occupational class are currently acknowledged as sources of status and how the non-White working class is ranked in comparison. Thus, I go beyond self-placements of the White working class, but instead assess how these factors are ranked overall and by different subgroups.
Other useful conceptualizations of status are situated between these two approaches of self-placements versus intersubjectivity. In particular, Gest (Reference Gest2016) introduces an approach to capture deprivation by asking interviewees to describe groups that are more or less central to society and by placing them in a set of four concentric circles that symbolize centrality versus periphery. My approach similarly tackles shared perceptions of group's position in society. However, Gest (Reference Gest2016) and Gest et al. (Reference Gest, Reny and Mayer2018) simultaneously ask respondents to place themselves within these circles. Thus, this measure is useful to capture how groups understand society in relation to their own position. My approach here is to ask about overall societal standards of worth and thus to abstract from self-placements as much as possible, even though status perceptions will likely always be related to some personal benchmark. In the following, I first discuss which sources should be relevant for the social status hierarchy. Second, I discuss the importance and implications of varying degrees of consensus on these sources.
What are the sources of social status?
Many political science studies that apply the concept of social status to reconcile the economic and cultural roots of resentment assume social status to be rooted in both economic and cultural dimensions (Cramer, Reference Cramer2016; Gidron & Hall, Reference Gidron and Hall2017; Gidron and Hall, Reference Gidron and Hall2020; Gest et al., Reference Gest, Reny and Mayer2018; Hochschild, Reference Hochschild2018). However, the mentioned studies often have no possibility to causally identify whether cultural sources like gender, race, sexuality and place matter alongside economic ones like occupation and income. Using observational data, it remains hidden whether status perceptions and shifts therein are impacted by economic or cultural factors.
The idea that an individual's position in society is determined by multiple dimensions is not new. As Bourdieu (Reference Bourdieu1984) argued, the balance between economic and cultural capital distinguishes between occupational groups with distinct lifestyles, next to the overall volume of capital.Footnote 4 Recent work by Damhuis (Reference Damhuis2020) shows how the multidimensional Bourdieusian framework can be fruitful in understanding how different socioeconomic groups form distinct grievances, ultimately leading them to support radical right parties. Compared to these approaches with a focus on class or socioeconomic groups, the promise of the social status concept is that it takes sociocultural group relations like those based on race and gender as seriously as economic group relations. The sociological theory behind status put forward by Ridgeway posits that sociocultural group characteristics like gender or race easily attach to perceptions of higher or lower worth and competence (Ridgeway, Reference Ridgeway2019, p. 38) and therefore have become politicized and meaningful axes of inequality in many societies. This perspective allows to assess how cultural capital is also fundamentally racialized, not only fundamentally classed (Cartwright, Reference Cartwright2022).
There is a wealth of evidence from political science and sociology on the isolated effects of different status sources in Western democracies. One's economic standing or opportunities – encompassing characteristics like income, occupation and education – have been shown to matter strongly for people's social status, meaning their standing in society (Evans & Kelley, Reference Evans and Kelley2004; Gidron and Hall, Reference Gidron and Hall2020). Occupation is traditionally seen as a characteristic that status is attached to meaningfully, in the sense that people holding certain jobs are seen as generally superior to others (Chan & Goldthorpe, Reference Chan and Goldthorpe2004; Weber, Reference Weber1922). An individual's occupation may not only feed into their economic capital but people also attach prestige to certain jobs. Socioeconomic categories carry a lot of weight for people's broader understanding of hierarchies in their society, demonstrably more so than cultural taste or moral categories (Harrits & Pedersen, Reference Harrits and Pedersen2019). Regarding education, which has economic as well as cultural connotations, van Noord et al. (Reference van Noord, Spruyt, Kuppens and Spears2019) found that it is considered a comparatively legitimate and uncontroversial foundation of social stratification.
Existing research also documents persisting cultural status hierarchies, most prominently based on gender and race. It shows that male, White individuals experience status advantage – being perceived as more competent – compared to female and/or non-White individuals in interpersonal encounters (Berger et al., Reference Berger, Rosenholtz and Zelditch1980). These disadvantages maintain and reinforce the overall inequality between men and women, as well as between racial groups, indicated by the fact that challenges to established hierarchies are often met by a backlash from the dominant group, be it Whites (Bobo, Reference Bobo1999; Wetts & Willer, Reference Wetts and Willer2018) or men (Rudman et al., Reference Rudman, Moss‐Racusin, Phelan and Nauts2012; Ridgeway, Reference Ridgeway2011). Next to gender and race, sexual orientation is another relevant sociocultural characteristic which leads to discrimination and thus plausibly lower status. It constitutes a related and intersecting factor in experiencing discrimination in a heteronormative environment (see Tilcsik, Reference Tilcsik2011), similar to discrimination based on gender and race in a White and male-dominated environment.
Recent debates on status politics in political science have further directed attention to geography and the local context as a potential source of disadvantage (Bolet, Reference Bolet2021; Harteveld et al., Reference Harteveld, van der Brug, de Lange and van der Meer2021; Rodríguez-Pose, Reference Rodríguez‐Pose2018). As established in ethnographic work, rural people tend to feel left behind not just on economic grounds but also because of a sense that urban elites have political power over rural areas and try to impose their liberal values on them (Cramer, Reference Cramer2016).
Is there a societal consensus on the sources of social status?
To achieve objective influence, the sources of the social status hierarchy have to be agreed upon by members of society, at least to a certain degree (Ridgeway, Reference Ridgeway2019). Social status would not develop a broader influence if it were only based on first-order perceptions, meaning self-evaluations, as these would be hard to reconcile with each other on a large scale. In contrast, a second-order consensus means that an individual may disagree with others about their own status, but they nonetheless know about the consensus and expect and understand that others treat them according to broader societal evaluations of worth or competence (Ridgeway, Reference Ridgeway2019, pp. 39-41).
It is not surprising that high-status groups agree with or at least acknowledge the sources of the current status hierarchy, even though this acknowledgement can also motivate them to deny or distance themselves from profiting from inequality (Knowles et al., Reference Knowles, Lowery, Chow and Unzueta2014). However, this is less self-evident for low-status groups. Still, the stability and stratifying impact of a status hierarchy strongly depends on its acceptance by different groups along the status hierarchy. This agreement can provide low-status groups rewards, like respect for being ‘reasonable’ but also by reducing insecurity in interactions (Anderson et al., Reference Anderson, Willer, Kilduff and Brown2012). However, if these rewards are insufficient or there are countervailing options, acceptance of the status order can also decrease (Ridgeway, Reference Ridgeway2019, pp. 61–64). There is an important distinction to be drawn between acknowledgment and endorsement of the sources of status (see Ulfsdotter Eriksson & Nordlander, Reference Ulfsdotter Eriksson and Nordlander2023). For a consensus to emerge and function, it is not necessary for either high- or low-status individuals to believe that societal standards of worth are justified.
It is crucial to test whether a consensus actually exists for contemporary status hierarchies. Even if gender, race, sexual orientation and place of residence significantly affect social status, this could also be driven by perceptions of a subset of the population, like progressives or people experiencing disadvantage themselves. An agreement among individuals regardless of their own group membership would point towards a rather stable and salient status hierarchy. It could also mean that, rather than perceptions, norms of equality may be contested: Everyone agrees that some groups experience disadvantages but not all agree that the status hierarchy should be less steep. In contrast, if low-status groups perceive of higher inequality according to their own cultural group membership, this speaks for a less salient status hierarchy. At least for high-status groups, discrimination is not as visible, implying a polarizing stalemate between claims and denial of disadvantage. More positively, this differing perception could also mean that the hierarchy under question is in the process of overturning, where norms for equality are accepted but not yet fully implemented. Finally, if disadvantaged groups perceive less inequality than high-status groups, this could point towards a compensatory mechanism, where individuals reject their lower position, possibly to conserve self-esteem. Again, this difference could also point towards ongoing processes of destabilizing and changing hierarchies, where previously subordinate groups manage to assign themselves increasing value.
For the economic sources of status, it is more likely that a consensus will emerge. The existing literature shows the importance of economic categories and resources for perceptions of societal hierarchies and the intergroup consensus underlying this (Harrits & Pedersen, Reference Harrits and Pedersen2018, Reference Harrits and Pedersen2019). Notions of economic ‘success’ or ‘failure’ have been found to dominate perceptions of general worth and self-worth (Lamont, Reference Lamont2018). For the more specific ranking of individual occupations according to their prestige, there is evidence both for a consensus (Treiman, Reference Treiman1976) as well as a more heterogeneous picture, where perceptions of esteem are less agreed upon by different societal groups (Guppy, Reference Guppy1984; Valentino, Reference Valentino2021).
For the cultural sources, more controversy is to be expected in light of recent political debates, even though there is also evidence for shared perceptions of hierarchies. Hagendoorn (Reference Hagendoorn1995) finds a consensus on ethnic hierarchies that are shared by both ethnic majority and minority groups. Regarding gender, a survey experiment by Auspurg et al. (Reference Auspurg, Hinz and Sauer2017) shows that respondents perceive lower earnings for women compared to men as fair – and that male and female respondents agree on this evaluation. However, prominent accounts of resentment among radical right supporters suggest a recent shift and disagreement in perceptions: Hochschild (Reference Hochschild2018) argues that predominantly White, middle class and male groups perceive women, racial and sexual minorities to have ‘cut in line’ in front of them on their way to achieve success and recognition. This would imply that certain right-leaning, historically privileged groups perceive of a higher position of historically disadvantaged groups than these groups themselves.
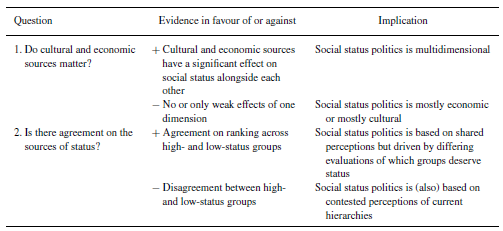
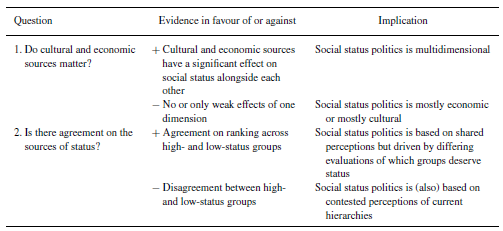
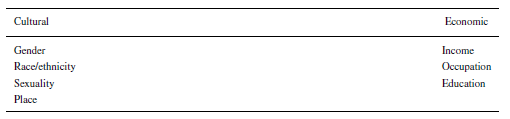
In Table 1, I summarize the two main questions of the study and what evidence would support which answer. For the first question, I assess the causal effects of economic and cultural sources alongside each other. For the second question, differences in status hierarchy perceptions between high- and low-status subgroups will be analysed.
Empirical approach
A conjoint design
To empirically assess the sources of social status and the degree of societal consensus, I used a conjoint experiment in which survey respondents evaluated profiles according to their societal position. In this design, all potential status sources can be displayed as profile characteristics alongside each other and their effects can be isolated from one another. For example, when information on income and occupation for a profile is provided and controlled for, the effects of place or gender should be primarily understood as going beyond their material implications. While this is of course a simplified view on intersecting dimensions of social status, the conjoint approach is advantageous to disentangle the determinants of multidimensional concepts (Hainmueller et al., Reference Hainmueller, Hopkins and Yamamoto2014). It can also mitigate social desirability bias by disguising the importance of a sensitive factor such as migration background for each individual choice respondents make (Horiuchi et al., Reference Horiuchi, Markovich and Yamamoto2022). This is crucial for studying sources of social identification (Titelman, Reference Titelman2023) or in this application, of social status.
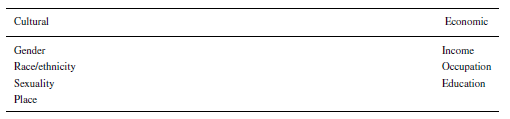
In the conjoint design, I distinguish between cultural and economic sources of social status. In Table 2, I classify group hierarchies according to gender, race/ethnicity, sexuality and place as conceptually cultural characteristics.Footnote 5 In contrast, attributes with an (even more) direct impact on an individual's economic opportunities, namely income, occupation and education, are labelled economic sources. Education has economic and cultural connotations and is therefore a source that is more open to interpretation. Overall, these sources are meant to cover the most salient characteristics in recent status politics debates in Western Europe and could certainly take more attributes, depending on the context.
The conjoint task asked respondents to evaluate two profiles and to choose the person that they deemed higher on the societal hierarchy. After an introduction to the topic (exact wording in Online Appendix B), I ask: “Below you see a table that shows characteristics of two different people. In Switzerland, some groups are more on top and others are more at the bottom. In your opinion, which of these two people is currently higher up in Switzerland? Please select this person”. Respondents were not only asked to choose the higher status person, but they also ranked both profiles on a scale of 1–10, where 10 means the highest societal position and 1 the lowest.
To detect the sources of status, this study does not rely on self-evaluations of status but instead measures how survey respondents place other people. Due to the conceptualization of status as an intersubjective hierarchy relying on a second-order consensus, this approach is more suitable compared to measures based on self-perceptions. For the purpose of capturing cultural narratives of worth, it also has advantages over associational measures, which have been used to measure objective occupational status (see Chan & Goldthorpe, Reference Chan and Goldthorpe2004). These rely on the assumption that people predominantly have close social interactions like friendships and marriages within one status group and then derive an occupational hierarchy based on associational patterns. However, associational measures may not capture the full extent of status perceptions and (dis)advantages linked to cultural narratives of worth: Social interactions may be more frequent within one occupational status group, but there may still be a status imbalance between members of the group based on, for example, gender or race.
Therefore, the conjoint results paint a more encompassing empirical picture of the current status hierarchy. The paired comparison of profiles, common to conjoint designs, also presents a relatively low cognitive burden for respondents, as they only have to decide which of two profiles is higher up in society.
Case selection and survey
The experiment was part of an online survey conducted together with the social research companies gfs.bern and Bilendi in the German-speaking part of Switzerland in December 2020 and January 2021. Switzerland is a suitable case to assess the sources of status for two reasons. First, compared to other Western European countries, it is a society with neither exceptionally high nor exceptionally low levels of income inequality (World Inequality Database, 2021) or cultural inequality. While the gender pay gap is above average (Eurostat, 2023), integration conditions for migrants – as an indicator for a racial hierarchy – are similar (Migrant Integration Policy Index, 2020) compared to the EU level. This makes it a typical case for the steepness of different kinds of inequality in Western Europe and likely also for the importance of different kinds of sources of the status hierarchy.
Second, Switzerland is a country with a strong radical right party, high ideological polarization (Zollinger & Traber, Reference Zollinger, Traber, Emmenegger, Fossati, Häusermann, Papadopoulos, Sciarini and Vatter2023), and a strongly developed cleavage between a universalist and a particularist pole, especially in its German-speaking part (Bornschier et al., Reference Bornschier, Häusermann, Zollinger and Colombo2021, 2090). This cleavage should make it harder for a societal consensus to emerge on the sources of group esteem because new left and far right voters likely deem different standards of societal worth to be important. Thus, the Swiss case is a hard test for the second question of interest.Footnote 6
Quota sampling was used to achieve a sample that matches quotas on gender, age, and education in the German-speaking Swiss regions (see Online Appendix A for details and descriptive statistics). The survey dealt with questions of social status and current political issues in Switzerland. The conjoint experiment was located close to the beginning of the survey, after asking some of the less sensitive sociodemographics (age, gender, education). Each respondent was asked to complete five tasks. The resulting sample size was 2541 respondents (of which 2382 completed all five choice tasks and 2436 all five rating tasks).Footnote 7
Experimental setup
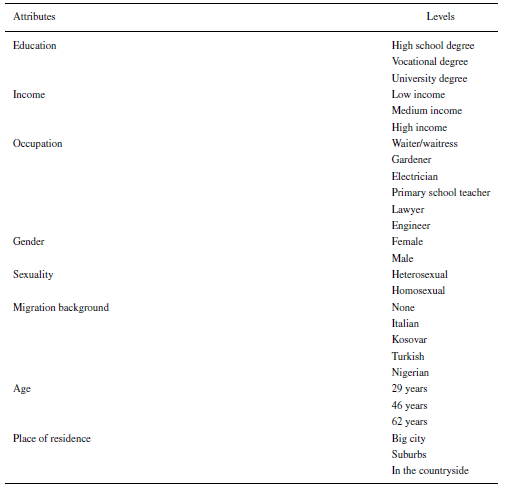
Table 3 displays the attributes and levels of the conjoint design. Each attribute varies between levels that cover a diverse but realistic range of characteristics that are additionally well-known to an average Swiss person. For occupations, different work logics and high/low levels of marketable skills according to Oesch (Reference Oesch2006) are covered to vary different factors that could affect occupational prestige.Footnote 8
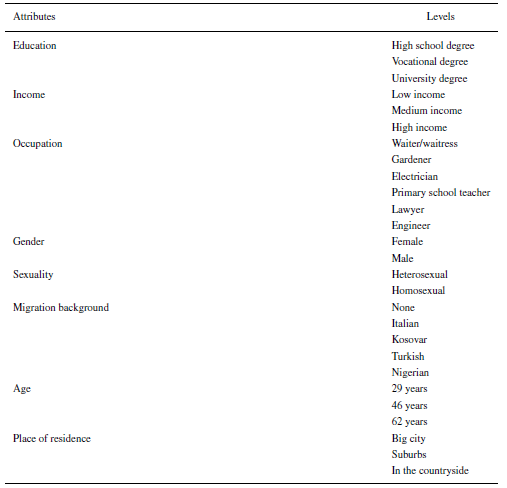
Note: For occupations, male/female German terms were displayed depending on the gender of the profile. See German wording in Table B1 in the Appendix.
The migration background attribute was chosen as a proxy for race/ethnicity. The two concepts are not congruent, but migration background is a more salient concept in Switzerland and many other European countries, even while predominantly used in a racialized way (Elrick & Farah Schwartzman, Reference Elrick and Farah Schwartzman2015). The chosen groups represent typical and large immigrant groups in Switzerland (Italian, Kosovar, Turkish) and/or are associated with different racial and religious groups. For example, a person with a Nigerian migration background is likely perceived to be Black. Specifying the country of origin might trigger some distinct stereotypes among respondents, as Hainmueller and Hangartner (Reference Hainmueller and Hangartner2013) have shown Swiss people to be prejudiced, e.g. against immigrants from the former Yugoslavia. However, these stereotypes are closely connected to ethnic/racial dimensions of social status, as their study also showed the importance of group conflict perceptions (Blumer, Reference Blumer1958) behind this prejudice. Thus, by including the migration background with a specific country of origin as a conjoint attribute, I am interested in capturing perceptions of the overall racial/ethnic group hierarchy, in which country and religious prejudices certainly also play a role.
In addition to the main attributes of interest, age is included to avoid masking, where respondents base their choice on excluded but potentially relevant attributes that they perceive to be linked to the included attributes (Bansak et al., Reference Bansak, Hainmueller, Hopkins and Yamamoto2021). For example, a waiter with a university degree may be imagined to be a rather young person who just earned their degree and is in-between jobs. Not specifically indicating the age of the person may thus bias the results, but I do not have specific expectations for the relation between age and social status.
A conjoint design is based on the random allocation of attribute levels to profiles (Hainmueller et al., Reference Hainmueller, Hopkins and Yamamoto2014). However, for many designs, it makes sense to impose constraints between attributes and implement a nonuniform distribution of attribute levels, so that only profiles that seem at least somewhat plausible to respondents are displayed. Here, I excluded impossible and very unlikely combinations between occupation and education, as well as between occupation and income (see Online Appendix C, where the implications of these restrictions are also discussed). The levels of two attributes were randomized according to a nonuniform marginal distribution so that they matched the real-world distribution in Switzerland more closely. These are sexuality (heterosexual: 80 per cent of profiles; homosexual: 20 per cent) and migration background (none: 60 per cent of profiles; Italian, Kosovar, Turkish and Nigerian: 10 per cent, respectively). This was done to avoid respondent frustration and thus to improve internal validity.
The Conjoint Survey Design Tool (Strezhnev et al., Reference Strezhnev, Hainmueller, Hopkins and Yamamoto2013) was used to implement this randomized weighted conjoint design with restrictions in Qualtrics. Furthermore, the position of attributes was randomized but kept constant within respondents. The sample size of 2382 for the choice-based outcome means that the design is powered at 80 per cent to detect a small effect size of 0.03 (average marginal component effect [AMCE]) (computed based on Stefanelli & Lukac, Reference Stefanelli and Lukac2020). The probability that the estimated coefficient has an incorrect sign (type S error) is 0 per cent and the exaggeration ratio (type M error) is 1.2, meaning that there is a low factor by which the magnitude of an effect may be overstated.
Results
The sources of status
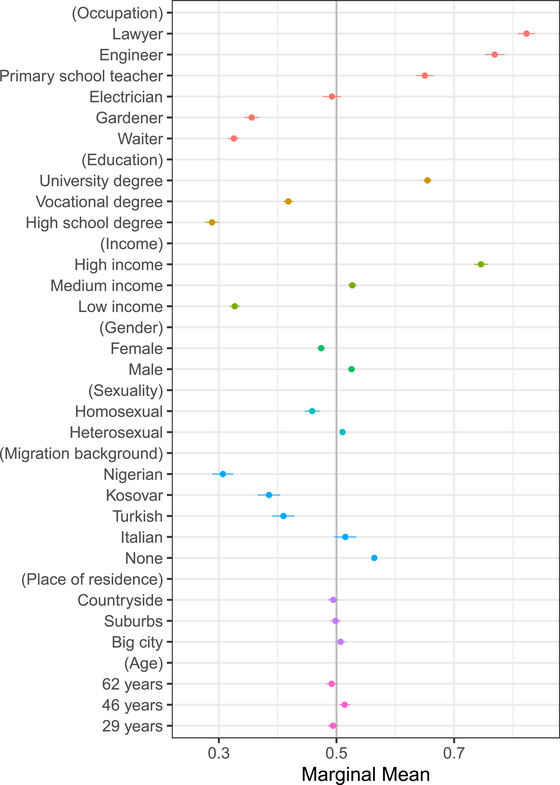
The results of the conjoint experiment are displayed in Figure 1 using marginal means.Footnote 9 This measure reveals the descriptive patterns of status evaluations, meaning the absolute favourability of respondents towards choosing levels of each attribute as being higher in status.Footnote 10 A marginal mean below 0.5 means a lower perceived social status, and a value above 0.5 a higher one. For example, we can see that lawyers are perceived as the highest status occupation, while electricians are evaluated neither positively nor negatively. Waiters are the occupation with the lowest status.
Marginal means for the sources of social status. [Colour figure can be viewed at wileyonlinelibrary.com]
Note: Results of the choice-based outcome of the conjoint. Standard errors were clustered to the level of respondents and bars display 95 per cent confidence intervals (see Table D2 in the Online Appendix.)
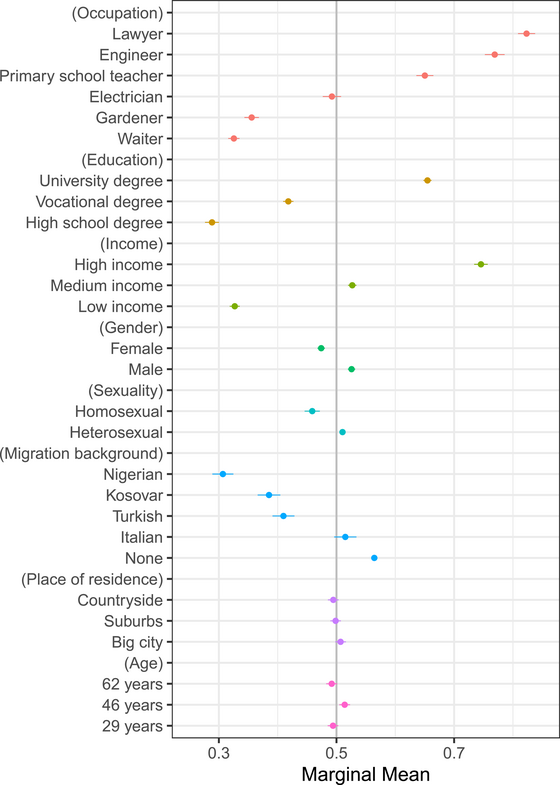
It becomes clear from Figure 1 that the perceived social status hierarchy is based on both economic and cultural sources. First, the three economic attributes are displayed on top and all of them, especially occupation, impact social status substantially and in the expected direction. There is a clear hierarchy from the professional and higher skilled occupations to the vocationally and lower skilled ones. Higher income and education levels are also perceived as more esteemed compared to their lowest levels.
Second, three out of the four cultural attributes also show clear effects in the expected direction. Compared to male profiles, female profiles are perceived to be positioned lower on the status hierarchy, controlling for the other attributes. Profiles with a gay or lesbian person see a status disadvantage of similar size. Compared to having none, all four different migration backgrounds are evaluated as being of lower status. Italian background profiles are seen rather neutrally, while profiles without a migration background profit from status advantage. There is also a clear hierarchy along the perceived race/ethnicity of the migration backgrounds: The less White or the more ethnically different the groups are likely assumed to be, the more status disadvantage they receive.
Regarding the fourth attribute, place of residence, there is no clear ranking between urban and rural areas. At least when other economic and sociocultural factors are taken into account, no meaningful geographical hierarchy remains. Finally, age does not substantially affect the status position.Footnote 11
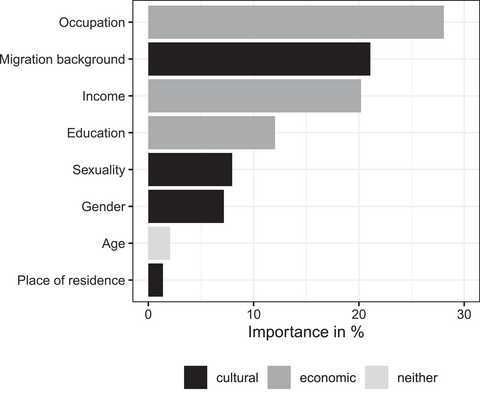
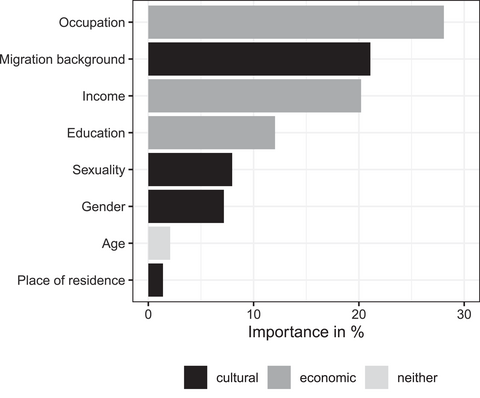
To establish more broadly that both economic and cultural attributes influence social status in a meaningful way, I assess the comparative importance of attributes. While marginal means of attributes with the same number of levels can be compared with each other (e.g., gender and sexuality), this is not possible for attributes with diverging numbers of levels, as they have different lower and upper bounds (Leeper et al., Reference Leeper, Hobolt and Tilley2020). Therefore, I created a new measure by rescaling AMCEs, a measure of the causal impact of each level for the choice-based outcome, and then computing the share that each attribute contributes to the overall range in AMCEs, a procedure similar to the calculation of part-worth utilities common to marketing applications of conjoints. This procedure is explained in more detail in Online Appendix E.
Figure 2 confirms that social status is a multidimensional concept and not just a proxy for economic characteristics. While occupation, income, and education are clearly important, the figure shows that the sociocultural attributes also substantively influence respondents' decisions about where to place profiles on the status hierarchy. Especially the migration background turns out to be important, second only to occupation, which speaks for respondents' recognition of a pronounced racial/ethnic hierarchy in Switzerland. The level of disadvantage ascribed to non-White or ethnic minority profiles is substantial, as the marginal mean of about 0.3 for the Nigerian migration background shows (Figure 1). This is an interesting finding for a Western European context, where racial disadvantage tends to be acknowledged less than, for example, in the United States (M'charek et al., Reference M'charek, Schramm and Skinner2014). Gender and sexuality – while being comparatively less decisive – still stand out substantively against the less important attributes of age and place of residence.Footnote 12
Importance of attributes by status dimension.
Note: Importance in per cent denotes the share an attribute contributes to the range of AMCEs of all attributes (see Table E2 in the Online Appendix.)
A consensus in status hierarchy perceptions
Is social status based on a societal consensus? To determine how cultural sources of the social status hierarchy matter and may be politicized, it is crucial to assess the degree of consensus around them between high- and low-status groups. In light of the results above, I focus on two noteworthy characteristics, namely the high importance of the migration background and the low importance of the place of residence. Other subgroup analyses are also discussed, and the detailed results are displayed in Online Appendix H.
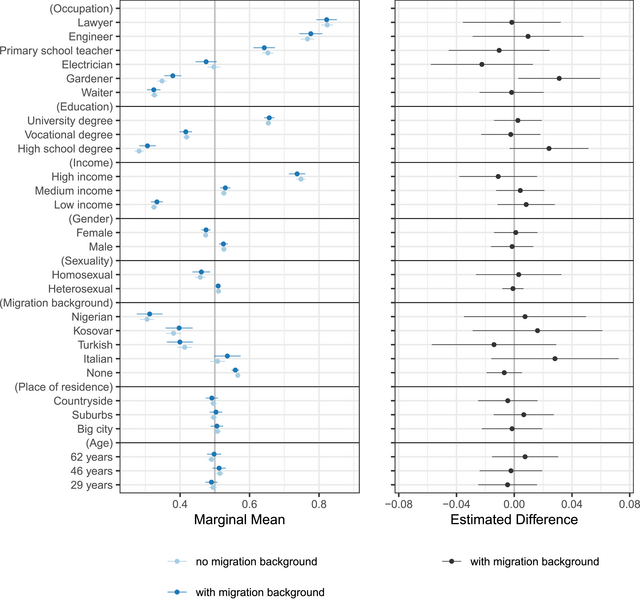
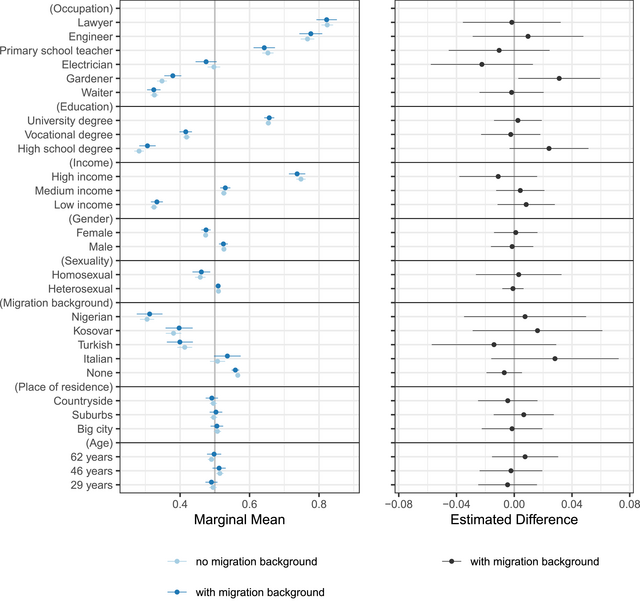
Figure 3 displays the marginal means by respondent subgroups according to their own migration background (left) as well as the difference between them (right).Footnote 13 The results show a broad consensus, especially for the cultural profile attributes. The strongly influential racial/ethnic status hierarchy is broadly agreed upon by respondents, regardless of their own (approximated) racial/ethnic group.Footnote 14 There is no significant difference for any of the cultural attributes and only one small divergence for one of the economic characteristics: People with a migration background tend to view the occupation of gardener as more valued. Importantly, the results show that people without a migration background acknowledge that their group overall enjoys status advantage compared to people with a migration background.
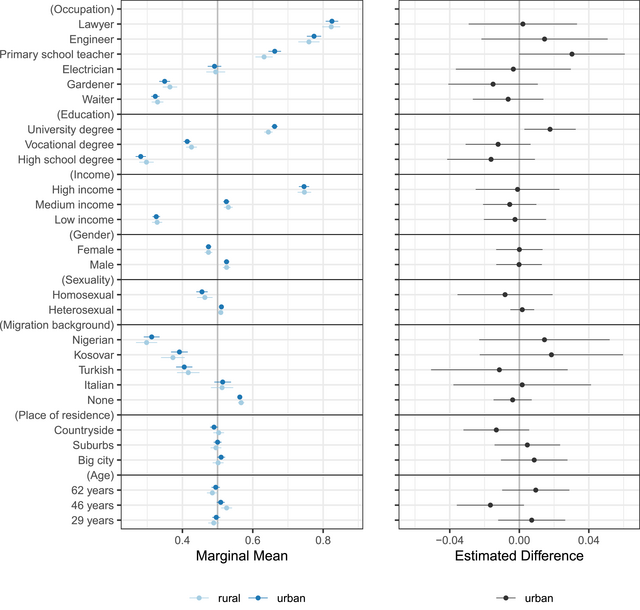
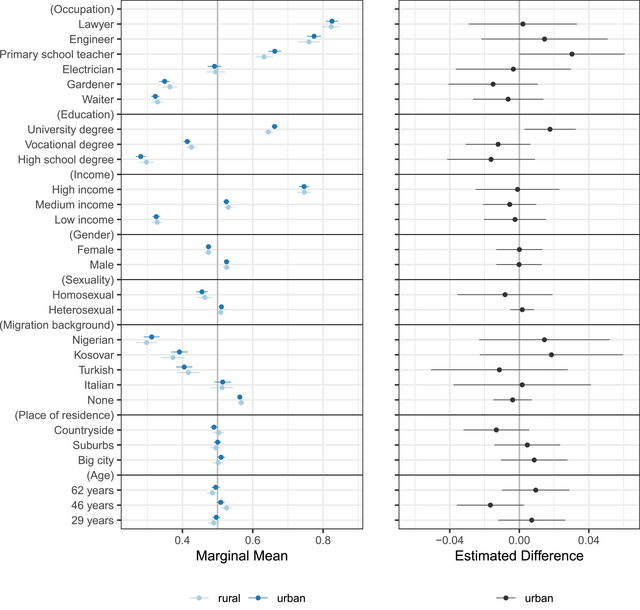
For the urban–rural debate, the above result did not show a hierarchical relationship in the aggregate. Figure 4 adds to this by showing that urban and rural inhabitants agree on this lack of ranking. In other words, respondents who live in rural places also do not perceive a hierarchy in which they are placed lower than urbanites. This means that the finding is not due to urban inhabitants' potential ignorance of their status advantage.Footnote 15
Subgroup heterogeneity by respondent migration background. [Colour figure can be viewed at wileyonlinelibrary.com]
Note: Results of the choice-based outcome of the conjoint: The left plot shows marginal means by respondent migration background, and the right plot shows the difference between the two groups. Standard errors were clustered to the level of respondents and bars display 95 per cent confidence intervals (see Table H2 in the Online Appendix.)
Subgroup heterogeneity by respondent urban or rural residence. [Colour figure can be viewed at wileyonlinelibrary.com]
Note: Results of the choice-based outcome of the conjoint: The left plot shows marginal means by a respondent place of residence, and the right plot shows the difference between the two groups. Standard errors were clustered to the level of respondents and bars display 95 per cent confidence intervals (see Table H3 in the Online Appendix.)
For the comparison of male and female respondents (Figure H3 in the Online Appendix), there is general agreement on the direction and magnitude of cultural status sources. However, women perceive somewhat stronger status discrepancies based on gender and race. This could suggest that female respondents – experiencing gender discrimination themselves – take sociocultural status disadvantages more seriously than men. However, the overall pattern similarity is still very high and men also perceive a significant status disadvantage for women.Footnote 16
To test more formally whether a wider selection of subgroup differences exists in the perception of the status hierarchy, Section H in the Online Appendix shows and discusses the results of a nested model comparison test using an analysis of deviance. This tells us whether any of the interactions between attributes and respondent characteristics differ from zero. The results confirm that there is a substantial subgroup consensus: There is no significantly differing status hierarchy perception by respondents' own high or low subjective social status (see Figure H1 in the Online Appendix). This means that even individuals who place themselves in a low-status position – which could indicate status anxiety – perceive similar standards of worth as high-status groups.Footnote 17 Further, even people with a low social dominance orientation or left-wing views are readily able to position people on the social status hierarchy according to these standards. Vice versa, even right-wing individuals perceive of the same status hierarchy as left-wing people (see Figure H2 in the Online Appendix), also acknowledging that substantial cultural and economic types of inequalities exist today.
Overall, the status hierarchy consensus is remarkably widespread. This means that perceptions of the type and importance of cultural and economic status sources are widely shared, independent of group status.
Conclusion
This paper assesses the contemporary social status hierarchy in the Western European case of Switzerland. To test whether cultural and economic sources of social status matter, it relies on a conjoint design to compare the effects of both alongside each other. The study pays special attention to cultural sources of status, as their importance for social inequality is less established in research and public debates. To assess whether cultural status sources are contested, subgroup differences are analysed.
Three results stand out: First, I demonstrate that social status is strongly affected by both economic and cultural sources. This highlights the importance of economic and cultural group relations for today's societal hierarchies in Western Europe. Occupational and racial/ethnic hierarchies turned out to be the most important for the Swiss sample to position other people, followed by income, education, sexuality and gender. In other words, both economic and cultural structural (dis)advantage between groups exist: This means that inequality today cannot be reduced to just economic or just cultural injustice (see also Fraser, Reference Fraser, Fraser and Honneth2003; Ridgeway, Reference Ridgeway2019).
Second, a rather surprising finding is that I do not detect any evidence supporting a rural–urban hierarchy perception. Rural and urban respondents did not perceive rural profiles to be lower in the social status hierarchy. This result is striking as previous studies have found meaningful culturally loaded spatial divides (Cramer, Reference Cramer2016; Harteveld et al., Reference Harteveld, van der Brug, de Lange and van der Meer2021; Rodríguez-Pose, Reference Rodríguez‐Pose2018). It seems that this divide is not based on a hierarchical structure where one pole is clearly subordinated to the other, at least not in the Swiss case. However, it should also be noted that place-based economic inequality is comparatively low in Switzerland (Stohr, Reference Stohr, Hanes and Wolcott2018). Nonetheless, rural–urban identities have been shown to be politicized in Switzerland as well (Zollinger, Reference Zollinger2024b). My results imply that this rural/urban divide is not necessarily rooted in perceptions of inferiority or superiority. Instead, identities and notions of what a valuable life should entail may simply differ (see Zollinger, Reference Zollinger2024a). It is also possible that analyses of rural resentment – also in other cases like the United States – to some degree pick up confounded racial, gender or class resentment or a general political deprivation.
Third, respondents show a remarkably high degree of consensus when placing people on the societal hierarchy. The clear ranking and consensus support the notion that social status is a salient and powerful factor in everyday life – and for political behaviour. For the perception of cultural status sources, people's own migration background and other sociocultural group memberships do not make a difference. Even respondents without a migration background perceive an equally strong disadvantage for People of Colour in today's society. These findings point towards salient, stable hierarchies that disadvantaged as well as privileged people are aware of.
Why do status hierarchy perceptions matter for politics? The fact that cultural and economic types of inequality are acknowledged widely, even across different societal and ideological subgroups, carries an important implication for their political contestation. It means that even right-wing individuals, who think that the erosion of established status orders is going too far, acknowledge that these status orders still exist. In contrast, my results do not support the view that status anxiety is rooted in perceptions that women, racial and sexual minorities have ‘cut in line’ in front of predominantly White, middle class and male groups (see Hochschild, Reference Hochschild2018). Thus, the results imply that resentment against changing societal hierarchies (Gidron & Hall, Reference Gidron and Hall2017) is rooted in the explicit ideological support for preserving status advantages for White people, men, heterosexuals and those with high economic resources. A broader implication is that polarized perceptions are not a prerequisite for the politicization of economic and cultural inequalities. In contrast, it is precisely the consensus in perceptions but disagreement in evaluations that makes these changing hierarchies so politically contentious (see also Häusermann et al., Reference Häusermann, Palmtag, Zollinger, Chadi, Walter and Berkinshaw2023). Open questions that arise from these results are how dynamic positive or negative evaluations of current status hierarchies are and how these translate into political behaviour. In terms of mitigation, it is important to consider how resistance to increasing equality can be reduced in times of shifting hierarchies.
These results were obtained by conducting a conjoint survey experiment in Switzerland. This design allows to systematically assess multidimensional sources of social status while reducing social desirability bias. It has also proven itself as a suitable instrument to detect the consensus in societal status evaluations. Nonetheless, it has its limitations regarding the selection of potential status sources. This study aimed to cover the most relevant status sources in recent debates about status politics and ‘culture wars’. However, it is likely that other factors, for example, (dis)ability (Canton et al., Reference Canton, Hedley and Spoor2023), cultural taste (Jæger & Larsen, Reference Jæger and Larsen2024), wealth (Savage et al., Reference Savage, Cunningham, Devine, Friedman, Laurison, Mckenzie, Miles, Snee and Wakeling2015, p. 92) or cis/transgender identities (especially in recent times of contention, see Magni & Reynolds, Reference Magni and Reynolds2023) would have also turned out to be relevant status sources. Additionally, the design is necessarily limited in the range of included levels per status source. It would have been particularly interesting to include more occupations. To achieve sufficient statistical power, the main focus was on vertical occupational distinctions. It is possible that occupational status would have been less consensually ranked had the design included additional and more detailed horizontal distinctions based on work logic (Sharlin, Reference Sharlin1980; Valentino, Reference Valentino2021).
Other limitations pertain to the Swiss case. Switzerland has some specific institutions like an educational system with a rather well-regarded vocational track and a welfare state combining conservative and liberal elements (Kriesi & Trechsel, Reference Kriesi and Trechsel2012, pp. 155–156). This means that first, occupations with vocational (but no university) education might receive less of a status disadvantage than in other countries. Second, status differentials are generally preserved across generations to a higher degree than for example in the Scandinavian, social democratic welfare state (Esping-Andersen, Reference Esping‐Andersen1990). However, further research is needed to assess whether a social democratic, more universalist welfare state goes along with less steep status hierarchy perceptions, or whether a more progressive status quo sharpens citizens' awareness of existing hierarchies. Overall, since Switzerland has experienced a similar politicization of sociocultural ‘identity politics’ questions (Zollinger & Traber, Reference Zollinger, Traber, Emmenegger, Fossati, Häusermann, Papadopoulos, Sciarini and Vatter2023) as well as income inequality as other advanced democracies, one could expect the sources of status to be broadly similar to other Western European countries.
Relating back to earlier research, it is possible that previous studies of subjective social status were not able to detect the importance of the status hierarchy based on migration background (Gidron and Hall, Reference Gidron and Hall2020) or gender (Evans & Kelley, Reference Evans and Kelley2004) because of a discrepancy between an individual's self-positioning and the positioning of other fictional people. When measuring self-placements, it is plausible that the direct reference groups of individuals move the perceived position towards the middle of the scale between 1 and 10. For example, a person belonging to a racial or ethnic minority may compare themselves to friends or relatives belonging to the same group. When comparing two profiles, one's own reference groups tend to become less salient than if one were to place oneself, which makes this a promising approach to measure the overall social status hierarchy. Thus, if researchers of status are interested in comparing dimensions of overall inequality and their contestation, the conjoint design introduced in this article can be a fruitful method.
Furthermore, the acknowledgment of racial/ethnic inequality may be weaker if respondents had been asked about the level of their own racial (dis)advantage. For the United States, Jardina (Reference Jardina2019) shows that it is not rare for White people, especially White identifiers, to recognize – and endorse – their racial privilege. Due to the more widespread denial of the importance of race as a category among the public (De Genova, Reference De Genova2018; M'charek et al., Reference M'charek, Schramm and Skinner2014), this might differ in Europe. However, by asking respondents to place hypothetical others, this study was able to show that Swiss respondents realize that migration affects societal hierarchies and that non-White groups experience status disadvantage. Future research should assess whether this holds for self-placements as well, meaning whether White Europeans are likely to admit their racial advantage regarding their own rank position. It is also worthwhile to ask about how ongoing changes to racial/ethnic hierarchies in Europe, like growing demographic diversity and access to citizenship by second- and third-generation immigrants, affect social status politics (see Bonikowski, Reference Bonikowski2017). If the upward status trajectory of racial minorities is understood as disrupting the ‘proper status order’ by parts of the White majority, this could explain the successful racist mobilization by far right actors like the Swiss People's Party (Michel, Reference Michel2015). More generally, while this study researches status perceptions in dynamic times, it only analyses them for one time point. Future research should also look more closely at perceptions of changing status hierarchies (see Breyer et al., Reference Breyer, Palmtag and Zollinger2023).
This article contributes to social science research interested in the political consequences of economic and cultural transformations by providing empirical evidence on the content of current social status hierarchies. Social status is a useful concept to integrate different structural societal inequalities into one larger picture, including hierarchies based on sociocultural group membership (gender, sexual orientation and race/ethnicity) and socioeconomic position. This helps contextualize the claims of being ‘left behind’ that are predominantly voiced by White lower- and middle-class groups (Bhambra, Reference Bhambra2017). When recognizing the multidimensional structure of social status, it becomes clear that these groups may express resentment not only in reaction to economic hardship but also in an attempt to retain their relative privilege on cultural dimensions (see also Suryanarayan, Reference Suryanarayan2019).
Acknowledgements
I would like to thank Tarik Abou-Chadi, Delia Zollinger, Noam Gidron, Sarah Engler, Thomas Kurer, Denise Traber, Eitan Tzelgov, Sarah de Lange, Helene Helboe Pedersen, Peter Hall, Daniel Bischof, Reto Mitteregger and the three anonymous reviewers for very helpful comments on the experimental design and paper. It was previously presented at the IPZ Pre-Publication Seminar at the University of Zurich, EPSA 2021 and the Challenges Seminar at the University of Amsterdam, and I would also like to thank audiences at these events for their helpful feedback.
Open access funding provided by Universitat Basel.
Data availability statement
All replication files (data and code) are available online in the Harvard Dataverse under the DOI: https://doi.org/10.7910/DVN/8JFKC1
Online Appendix
Table A1: Categorical variables
Table A2: Continuous variables
Figure B1: Screenshot of conjoint task
Table B1: Attributes of the conjoint design in original German language
Table C1: Constraints between levels of conjoint design: Excluded combinations
Figure D1: Average marginal component effects for the sources of social status
Table D1: Choice-based outcome, AMCEs
Table D2: Choice-based outcome, marginal means
Table E1: Choice-based outcome, rescaled AMCEs
Table E2: Choice-based outcome, importance of attributes
Figure F1: Rating outcome: Marginal Means
Figure F2: Rating outcome: Average Marginal Component Effects
Table F1: Rating outcome, AMCEs
Table F2: Rating outcome, marginal means
Figure G1: Interaction effects of profile migration background with all other profile attributes
Figure G2: Interaction effects by profile gender
Figure G3: Interaction effects by profile sexual orientation
Figure G4: Interaction effects by profile place of residence
Table G1: Interaction effects of profile migration background (PMB) with all other attributes, marginal means (MM)
Table H1: Analysis of deviance: Test for subgroup heterogeneity based on respondent characteristics (economic and cultural sources)
Figure H1: Subgroup heterogeneity by respondent subjective social status
Figure H2: Subgroup heterogeneity by respondent left/right self-placement
Figure H3: Subgroup heterogeneity by respondent gender
Figure H4: Subgroup heterogeneity by respondent sexual orientation
Figure H5: Subgroup heterogeneity by respondent education level
Figure H6: Subgroup heterogeneity by respondent age group
Table H2: Subgroup marginal means (MM) and difference in MM by respondent migration background (RMB)
Table H3: Subgroup marginal means (MM) and difference in MM by respondent place of residence (RP)


 Open access

