


1. Introduction
The planting of cover crops has been shown to contribute to a diverse set of beneficial outcomes for farms that engage in the practice while simultaneously providing wider ranging benefits by attenuating some of the negative externalities associated with production agriculture (Rejesus et al., Reference Rejesus, Aglasan, Knight, Cavigelli, Dell, Lane and Hollinger2021). From the producer’s perspective, use of cover crops have the potential to provide direct benefits including improvements in soil quality that are achieved by increasing soil microbial populations (Boswell et al., Reference Boswell, Koide, Shumway and Addy1998; Vukicevich et al., Reference Vukicevich, Lowery, Bowen, Úrbez-Torres and Hart2016; Sharma et al., Reference Sharma, Singh, Kahlon, Brar, Grover, Dia and Steiner2018), capturing and retaining soil moisture (Qi and Helmers, Reference Qi and Helmers2010; Villamil et al., Reference Villamil, Bollero, Darmody, Simmons and Bullock2006; Sharma et al. Reference Sharma, Singh, Kahlon, Brar, Grover, Dia and Steiner2018) and increasing soil organic matter (McDaniel, Tiemann, and Grandy, Reference McDaniel, Tiemann and Grandy2014). Cover crops have the potential to impair weeds (Masilionyte et al., Reference Masilionyte, Maiksteniene, Kriauciuniene, Jablonskyte-Rasce, Zou and Sarauskis2017), control pest populations (Sharma et al., Reference Sharma, Singh, Kahlon, Brar, Grover, Dia and Steiner2018), reduce soil erosion (Chen et al., Reference Chen, Rejesus, Aglasan, Hagen and Salas2022; Kaspar and Singer, Reference Kaspar and Singer2011), and mitigate nutrient leaching (Abdalla et al., Reference Abdalla, Hastings, Cheng, Yue, Chadwick, Espenberg, Truu, Rees and Smith2019). All of these benefits in turn create the potential for enhanced yields of the subsequent cash crop (Fageria, Baligar, and Bailey, Reference Fageria, Baligar and Bailey2005; Marcillo and Miguez, Reference Marcillo and Miguez2017).
In addition to potential productivity enhancements and increased resiliency that cover crops potentially provide at the farm level, the use of cover crops double as a conservation practice with positive environmental externalities including sequestration of greenhouse gasses (McDaniel, Tiemann, and Grandy, Reference McDaniel, Tiemann and Grandy2014; Poeplau and Don, Reference Poeplau and Don2015), reducing need for supplemental nitrogen fertilizer which lowers total energy inputsFootnote 1 and providing ecosystem services including enhancing pollinator and wildlife habitat (Blanco-Canqui et al., Reference Blanco-Canqui, Shaver, Lindquist, Shapiro, Elmore, Francis and Hergert2015; Ellis and Barbercheck, Reference Ellis and Barbercheck2015).
Given the potential benefits that cover crops provide, it is unsurprising that acres planted with cover crops in the United States (US) increased by 50% between 2012 and 2017 (Wallander et al., Reference Wallander, Smith, Bowman and Claassen2021). However, this only represents about 5% of harvested crop land (Wallander et al., Reference Wallander, Smith, Bowman and Claassen2021). As cover crops have garnered more attention as both a conservation and potential productivity-enhancing-practice, a number of explanations for low rates of adoption have emerged. Among these are perceived concerns associated with maintaining crop insurance eligibility while regularly using cover crops (Coppess and Schnitkey, Reference Coppess and Schnitkey2017; O’Connor, Reference O’Connor2013).
The purpose of this study is to empirically assess the relationship between crop insurance participation and cover crop use. This is achieved by using data from the US Department of Agriculture (USDA) Agricultural Resource Management Survey (ARMS) where a repeated cross section of farm level observations from 2012 and 2015–2021 (N = 119,166) were constructed. Specifically, our empirical model examines how cover crop acres (normalized by farm size) respond to changes in crop insurance expenditures (measured by farm paid premium per acre). To address sources of endogeneity, estimation is carried out using a control function approach, which is coupled with a double hurdle model to handle the large number of producers who are not engaged in any cover cropping practice.
We find statistically and economically significant effects between crop insurance expenditures and cover crop use at the “extensive margin,” but find no statistically significant effect at the “intensive margin.” Notably, we find a negative relationship between crop insurance expenditures and the decision to adopt cover crops (i.e., the extensive margin of cover crop adoption), while a positive (yet statistically insignificant at the 95% confidence level) correlation is associated with crop insurance expenditures and the extent of cover crop use among producers that have a positive share of acres planted with cover crops (i.e., the intensive margin of cover crop adoption). We also find that results vary significantly between the “instrumented” control function regression and the traditional “non-instrumented” regression. This, coupled with the divergent effects of crop insurance participation across the intensive and extensive margin, highlights the importance of controlling for endogeneity and allowing for corner solutions in the empirical model. To test for a response to the updated cover crop guidance provided in the 2018 Farm Bill we subset our sample into observations recorded prior to and after the 2018 Farm Bill and then re-estimate the model on each subset. We find that the disincentive effect identified at the extensive margin declines in magnitude by approximately 50% following the 2018 Farm Bill (in addition to becoming statistically insignificant).
This study contributes to the literature by explicitly addressing two modeling concerns present in existing studies. First, a potential source of endogeneity exists between cover crop adoption and crop insurance participation that has not been usually addressed in most of the empirical literature.
Namely, given that cover crops potentially limit losses from adverse weather conditions (Aglasan et al., Reference Aglasan, Rejesus, Hagen and Salas2024; O’Connor, Reference O’Connor2013; Won et al., Reference Won, Rejesus, Goodwin and Aglasan2024), the underlying level of risk of the producer has the potential influence the use of cover crops. The crux of the problem is that the inherent production risk associated with a producer is not easily observable which potentially creates a source of omitted variable bias in the empirical analysis. Further conflating the issue is the fact that recent literature suggests that cover crops are correlated with lower occurrence and magnitude of crop insurance losses in the FCIP (Aglasan et al., Reference Aglasan, Rejesus, Hagen and Salas2024; Won et al., Reference Won, Rejesus, Goodwin and Aglasan2024) introducing a potential source of simultaneity. These sources of endogeneity may explain the generally null effects found in previous analysis (Fleckenstein et al., Reference Fleckenstein, Lythgoe, Lu, Thompson, Doering, Harden, Getson and Prokopy2020; Lee and McCann, Reference Lee and McCann2019; Thompson et al., Reference Thompson, Reeling, Fleckenstein, Prokopy and Armstrong2021).
Second, as noted by Thompson et al. (Reference Thompson, Reeling, Fleckenstein, Prokopy and Armstrong2021), cover crop adoption is often treated as a dichotomous decision to adopt or not to adopt, which ignores decisions at the intensive margin. Conversely, cover crop adoption measured by acres (or share of acres) fails to capture determinants of adoption at the extensive margin, which do not necessarily translate to use at the intensive margin. Given that Thompson et al. (Reference Thompson, Reeling, Fleckenstein, Prokopy and Armstrong2021) find that characteristics associated with initial adoption and extent (or intensity) of cover crop use are quite different, the treatment of cover crop use in the empirical specification has the potential to significantly influence the results. Notably, traditional ordinary least square (OLS) regression applied to outcomes with a non-trivial number of “corner” solutions (i.e., like non-adoption or zero acres of cover crops) will lead to inconsistent estimates (Wooldridge, Reference Wooldridge2010).
Overall, two modeling concerns are observed in the existing literature that have not been simultaneously addressed before. Existing studies either account for endogeneity (Connor, Rejesus, and Yasar, Reference Connor, Rejesus and Yasar2021) or model cover crop adoption and use via corner solution models (Thompson et al., Reference Thompson, Reeling, Fleckenstein, Prokopy and Armstrong2021), but not both. To our knowledge, this study is the first to simultaneously account for both the “corner solution” nature of the dependent cover crop variable, while also addressing potential endogeneity in the empirical specification. We find that both issues are consequential to the conclusions drawn from the empirical analysis. Additionally, by using a large sample consisting of 119,166 farm level observations we alleviate concerns of statistical power associated with null effects derived from small sample sizes.Footnote 2
2. Background and literature review
As discussed in the previous section, cover crops provide a number of advantageous properties, however, these benefits are predicated on proper management including selecting appropriate species, seeding rates, planting period, and termination methods (Wayman et al., Reference Wayman, Cogger, Benedict, Burke, Collins and Bary2015). Failure to do so may lead to the cover crop preemptively competing with the cash crop by immobilizing nutrients and temporarily lowering soil moisture prior to planting the cash crop (Alonso-Ayuso, Gabriel, and Quemada, Reference Alonso-Ayuso, Gabriel and Quemada2014). Consequently, an improperly managed cover crop practice (and in some cases even a well-managed cover crop) may increase the risk of lower yieldsFootnote 3 (Deines et al., Reference Deines, Guan, Lopez, Zhou, White, Wang and Lobell2023; Garba, Bell, and Williams, Reference Garba, Bell and Williams2022; Miner et al., Reference Miner, Delgado, Ippolito and Stewart2020). This has historically led to guidelines for cover crop use that must be followed if producers wish to also maintain crop insurance coverage.
Past literature has posited that the complexity of these guidelines may have prevented farmers from adopting cover crops for fear of inadvertently violating the guidelines and losing crop insurance eligibility (Connor, Rejesus, and Yasar, Reference Connor, Rejesus and Yasar2021). As part of the 2018 Farm Bill, further guidance was established for insured producers to explicitly address concerns related to insurability of cash crops that follow a cover crop (Natural Resource Conservation Service, 2019).Footnote 4 Consequently, the primary mechanism by which crop insurance participation potentially serves as a disincentive to cover crop adoption (i.e., losing eligibility by inadvertently violating guidelines) was largely eliminated following the implementation of the 2018 Farm Bill. However, cover crops may also diminish the negative effects of adverse weather on crop yields (Kaye and Quemada, Reference Kaye and Quemada2017) which means that cover crops and crop insurance potentially both serve as risk management tools to some degree (Aglasan et al., Reference Aglasan, Rejesus, Hagen and Salas2024; O’Connor, Reference O’Connor2013; Won et al., Reference Won, Rejesus, Goodwin and Aglasan2024).Footnote 5 Moreover, past literature also notes the role that crop insurance coverage may play on cover crop use via a traditional moral hazard hypothesis in which an insured farmer reduces “effort” in farm production by not planting cover crops (Connor, Rejesus, and Yasar, Reference Connor, Rejesus and Yasar2021). Thus, it is possible to motivate a negative relationship between cover crop use and crop insurance participation through both a “redundant” risk management strategy perspective and a moral hazard point of view (Connor, Rejesus, and Yasar, Reference Connor, Rejesus and Yasar2021).Footnote 6
Although the potential negative relationship between cover crop use and crop insurance participation is often mentioned in existing literature, studies that empirically address the association between the two are scarce. Lee and McCann (Reference Lee and McCann2019) make use of the 2012 USDA ARMS to estimate a probit model to identify factors that influence the adoption of cover crops among 1,712 soybean producers. Using a binary indicator for enrollment within the Federal Crop Insurance Program (FCIP), they find no significant effect between crop insurance participation and cover crop adoption. Fleckenstein et al. (Reference Fleckenstein, Lythgoe, Lu, Thompson, Doering, Harden, Getson and Prokopy2020) conducted a primarily qualitative analysis through a series of interviews and elicited concerns related to cover crop adoption among Midwestern row crop producers. They generally conclude that crop insurance requirements do not serve as a major deterrent to cover crop adoption. Connor, Rejesus, and Yasar (Reference Connor, Rejesus and Yasar2021) use county level data spanning 2006–2015 on Indiana corn and soybean producers to examine the relationship between crop insurance participation and cover crop adoption rates. Using panel fixed effects and instrumental variables techniques, they find a statistically significant and negative relationship between county-level crop insurance participation rate and the county’s share of acreage devoted to cover crops. However, they note the magnitude of the effect is small, and negligible from an economic perspective. Thompson et al. (Reference Thompson, Reeling, Fleckenstein, Prokopy and Armstrong2021) utilize a novel survey data set consisting of 719 US Midwestern corn producers and make a notable contribution by recognizing that cover crop intensity (measured by share of farm acres with cover crops planted) and the binary decision to adopt cover crops on the farm may be subject to separate decision-making processes. They model cover crop use as a function of observable variables using a double hurdle model and find that the factors associated with cover crop adoption (i.e., extensive margin) are potentially different from the determinants of the extent of cover crop implementation (i.e., the intensive margin).Footnote 7 With respect to crop insurance’s influence on cover crop use, they find no statistically significant effect between cover crop use (at either the intensive or extensive margin) and a binary variable indicating when survey respondents reported that crop insurance requirements limited their ability to implement cover crops.
3. Data
The data set used for this study comes from USDA’s Agricultural Resource Management Survey (ARMS). As a nationally representative survey, ARMS serves as USDA’s primary source of information on the financial condition, production practices, and resource use of US farm businesses and the economic well-being of farm households. The survey is administered using several phases – a sample screener phase [Phase I], a field-level phase [Phase II], and a farm-level phase [Phase III], and targets about 5,000 fields and 30,000 farms each yearFootnote 8 . In this study, we pool data from Phase III of the ARMS, which has cover crop information for the following years: 2012 and 2015–2021. Crop insurance expendituresFootnote 9 , which we use as a proxy for crop insurance participation (or demand), was first cleaned to remove any observations with unrealistically high per acre crop insurance expenditures over $500 per acre.Footnote 10 Cover crop use was measured as the share of operating acres planted with cover crops. Values above one, which indicates that there are more cover crop acres than total farm operation acres, were dropped from the sample. The final cleaned sample consisted of 119,166 farm level observations.Footnote 11
Descriptive statistics are reported in Table 1. The average crop insurance expenditure in the sample was $7.34, however, this value includes many zero values of farms that did not purchase crop insurance. For the 42 percent of farm operators that had some level of FCIP participation (N = 49,687), the average expenditure was approximately $17.59 per acre. The average share of acres planted with cover crops by a farm was 3 percent, but as with crop insurance expenditures, this metric is influenced by many zero values. Among the 12 percent of respondents that planted cover crops, on average 27 percent of their operating acres were planted with cover crops. Conservation payments averaged $3.43 per acre in our sample. Farm operator characteristics gathered indicate that 6 percent of farms are run by female operators while 8 percent of farms are beginner farms (anyone that has operated a farm or ranch for less than 10 years). The mean age of an operator from the sample was approximately 60 years old. Farm ownership responses indicate that 50 percent of the farms in the sample were partly owned by the operator, 10 percent were rented, with the rest being fully owned by the operator. Twenty-nine percent of operators reported being a college graduate. The average farm was just over 1300 acres and allocated an average of 55 percent of that acreage to crop production. Fifty percent of farms indicated raising cattle on their farm. To account for the relative differences in moisture, temperature, and evapotranspiration across regions, we use monthly values of the Palmer Drought Severity Index (National Center for Environmental Information 2024) or “PDSI” averaged over 1990–2021 at the county level.Footnote 12 The average farm in the dataset was located in a county that had a PDSI of 0.36 on a scale ranging from −10 (most dry) to 10 (most wet).
Descriptive statistics

Preconstructed farm typology indicators in the ARMS dataset are used to control for farm type and are based on farm typology definitions developed by USDA Economic Research Service (Hoppe and MacDonald, Reference Hoppe and MacDonald2013). Retired farms, which are defined as having a gross farm cash income of less than $250,000 and an operator that reported being retired but continuing to engage in farming on a small scale, made up 4 percent of our sample. Residential (or “lifestyle” farms) made up 17 percent of our sample and are defined as those with GCFI less than $250,000 and have operators that reported a primary occupation other than farming. Nonfamily farms, which made up 5 percent of our sample, are defined as any farm (regardless of GCFI) where the operator and persons related to the operators do not own a majority of the business. The remaining farm classifications are used to characterize family farms (i.e. any farm where the majority of the business is owned by the operator or persons related to the operator) and are based on GCFI. Small family farms are defined in two sub groups; “lower-sales” farms (21 percent of our sample) are those with GCFI less than $100,000 while “higher-sales” farms (10 percent of our sample) are those with GCFI between $100,000 and $250,000. Large family farms (12 percent of our sample) are defined based on a GCFI between $250,000 and $500,000 and very large family farms (31 percent of our sample) are defined as any farm with a GCFI of more than $500,000.
4. Empirical model
The empirical model underlying each of our regressions is defined as:
 $$C{C_{it}} = \alpha + \gamma\ asinh\left( {{E_{it}}} \right) + \beta {X_{it}} + \theta + \lambda + {\epsilon _{it}}$$
where the variable CC
it
measures the percentage (%) of acres with cover crops planted as a share of total operating acres on farm i in crop year t. The key independent variable capturing FCIP participation, E
it
, is crop insurance expenditures measured as the premium per acre paid by the farm ($/acre). The vector X
it
contains other observable control variables that potentially influence the decision to adopt cover crops on the farm (extensive margin), as well as the farm acreage where cover crops are used. Because crop insurance expenditures (E
it
) contain zero values (indicating no crop insurance was purchased) and also tends to follow a right-skewed distribution, we use the inverse hyperbolic sine transformation which is denoted as $\textit{asinh}(.\text)$
(Bellemare and Wichman, Reference Bellemare and Wichman2020).Footnote
13
The terms θ and λ represent year and state fixed effectsFootnote
14
respectively.
$\textit{asinh}(.\text)$
(Bellemare and Wichman, Reference Bellemare and Wichman2020).Footnote
13
The terms θ and λ represent year and state fixed effectsFootnote
14
respectively.
The model structure that is used to estimate equation (1) is motivated by the large share of observations for which no cover crops were planted, meaning a value of zero is recorded for the dependent variable in this case. To explicitly model the fact that many farms choose a corner solution (i.e., not to plant cover crops on the farm), we make use of a double hurdle modeling structure (Cragg, Reference Cragg1971). In our empirical context, the first hurdle indicates the decision to initially adopt a cover crop practice. If a farmer does decide to plant a cover crop, the second hurdle characterizes the acreage allocated to cover crops. The first hurdle is estimated using a probit model. More formally, the first hurdle to be estimated is defined as:
 $$d_{it}=\beta _{1}+\beta _{2}\textit{asinh}\left(E_{it}\right)+\beta _{3}X_{it}+\theta +\lambda +v_{it}$$
where d it is a binary variable equal to one if farmer i planted cover crops in crop year t, zero otherwise. The second hurdle is functionally equivalent to the specification defined by equation (1) and is estimated via a truncated normal regression.
5. Identification strategy
As previously mentioned, a primary concern for identification is the fact that both cover crop use and crop insurance participation both potentially affect production risk, to varying degrees. Consequently, the underlying risk profile of a particular producer (i.e. the various moments that characterize their yield distribution) is likely to influence their decisions pertaining to participation in both planting of cover crops and purchase of crop insurance. Given that “risk” is not directly observable, a canonical case of endogeneity persists (i.e., due to omitted variables). Further, recent empirical evidence suggests that cover crops potentially reduce the occurrence and magnitude of crop insurance losses in the FCIP for perils related to extreme moisture levels (i.e. both drought and excess moisture) (Chen et al., Reference Chen, Rejesus, Aglasan, Hagen and Salas2022; Won et al., Reference Won, Rejesus, Goodwin and Aglasan2024). Consequently, the existing literature suggests that cover crops may directly attenuate the losses that crop insurance are designed to provide financial protection against leading to a case of simultaneity where increased cover crop use may lead to crop insurance being perceived as a redundant risk management strategy.
To address endogeneity in our empirical framework, we follow past literature and define an instrumental variable that utilizes the premium rating framework inherent to the FCIP as a way to generate exogenous variation in premium rates which in turn directly influence crop insurance demand (Tsiboe and Turner, Reference Tsiboe and Turner2023; Woodard and Yi, Reference Woodard and Yi2020). A number of policy parameters are internally defined each year by RMA using historical data from the FCIP. Notably, even though these parameters are defined using historic data (data which any individual producer may have contributed to), a single producer has negligible influence on their own premium rate due to the large number of producers that that contribute to the historic data series (Tsiboe and Turner, Reference Tsiboe and Turner2023).
Temporal and spatial variation in policy parameters is further made exogenous by smoothing operations that RMA applies to limit sharp discontinuities in premium rates across adjoining county boundaries and catastrophic loading which is done to account for extreme tail events being sparsely represented in historic data (Coble et al., Reference Coble, Knight, Goodwin, Miller, Rejesus and Duffield2010). In effect, this means that variation in these policy parameters that govern premium rates shift the premium rate curve in a way that is exogenous to current individual farmer demand for insurance (i.e., which is also exogenous to the omitted “inherent farm risk” variables in the error term of equation 1). For a more detailed discussion on crop insurance rating methods and how they produce an instrumental variable the is exogenous to producer crop insurance purchases, see the appendix.
Specifically, we make use of two policy parameters to define our instrument. The first being the county base rate α 65ct which represents the starting premium for an individual choosing a 65%Footnote 15 coverage level in county c and crop year t. Notably, α 65ct , represents the premium rate before any characteristics of an individual producer are used to customize the premium.Footnote 16 The second is the catastrophic loading factor δ ct which as noted above is used to attenuate sampling error for sparsely observed catastrophic events. Our final instrument is defined as τ 65ct = α 65ct + δ ct which represents the initial premium faced by a producer, prior to any information about a producer’s past production experience being used in the rating process. We refer to this instrument as the “initial rate.”
A major advantage of using the initial rate as an instrument over other common instrumentation strategies that make use of changes in subsidy rates (DeLay, Reference DeLay2019; Miao, Reference Miao2020; Yu, Smith, and Sumner, Reference Yu, Smith and Sumner2018) is that the initial rate provides extensive spatial variation which is lacking when using the instruments based on subsidy rates which only vary annually. The initial rate calculated for our sample had a mean value of $0.11 (reported in Table 1). In other words, on average, a producer in our sample faced an initial premium of $0.11 per dollar of insured liability before any further actuarial adjustments were made to their final premium quote.Footnote 17
Following previous literature, we incorporate our instrumental variables into the double hurdle framework by using a control function approach (Ricker-Gilbert, Jayne, and Chirwa, Reference Ricker-Gilbert, Jayne and Chirwa2011; Verkaart et al., Reference Verkaart, Munyua, Mausch and Michler2017). Implementation of the control function approach entails estimating the following reduced form model of crop insurance expenditures as a first stage, where X it contains other observable covariates that act as controls and τ 65ct represents our excluded instrument which captures the producers’ relevant initial premium rate:
 $${\rm asinh}\ (E_{it})=\alpha +\beta X_{it}+\varphi \tau _{65ct}+\theta +\lambda +\epsilon _{it}$$
The residuals from estimation of equation (4) are then included as a covariate for estimation of both equations that define the double hurdle model (in equation (2) and (3)). Table S2 in the appendix reports the results for estimation of the first stage equation (4) for the entire sample as well as samples characterized by before and after the 2018 Farm Bill. In each of these estimations, the initial premium rates is highly correlated with crop insurance expenditures.Footnote 18 Further, the relationship between the initial rate and crop insurance expenditures is negative indicating that the change in expenditures due to increases in the initial rate is due to a reduction in demand for insurance, rather than a higher initial rate increasing expenditures through purchase of the same level of insurance at a higher cost.
6. Results
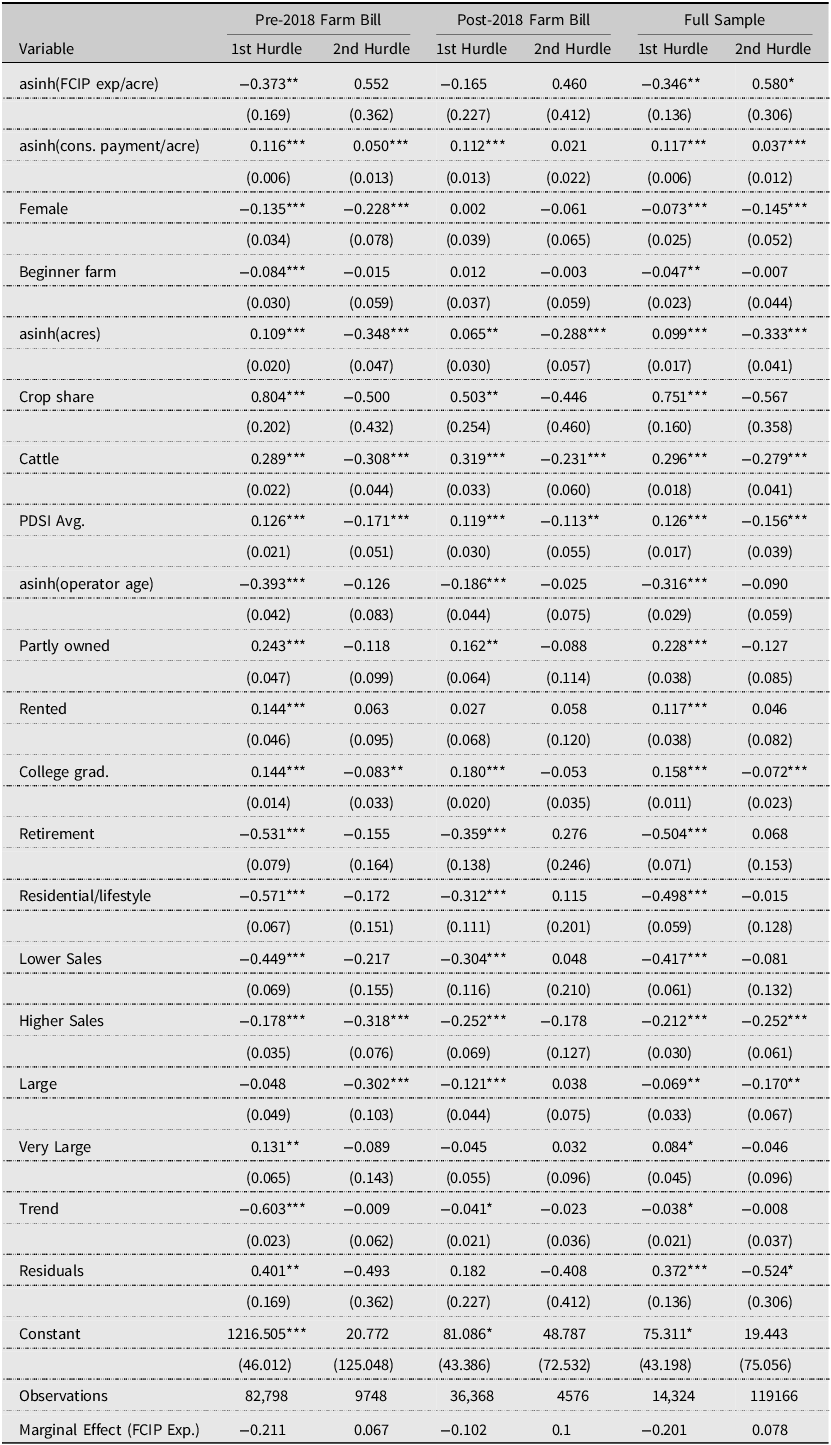
Table 2 reports regression results for the instrumented double hurdle model based on samples characterized by before and after the 2018 Farm Bill, as well as estimates based on the entire sample. Estimates from the full sample suggests a negative and statistically significant effect between FCIP expenditures and the decision to adopt cover crops (first hurdle) but a positive effect of weak statistical significance (10% confidence level) between FCIP expenditures and the share of acreage planted with cover crops (second hurdle). Separate estimates from prior-to and after the 2018 Farm Bill suggest effects of similar direction (negative first hurdle, positive second hurdle) but only the first hurdle results from before the 2018 Farm Bill are statistically significant. In other words, the results decomposed by Farm Bill period suggest higher FCIP expenditures are correlated with decreased likelihood of cover crop adoption prior to the 2018 Farm Bill only. Following the 2018 Farm Bill, no statistically significant relationships between FCIP expenditures and cover crop use (at either margin) are detectable.
Instrumented double hurdle regression results
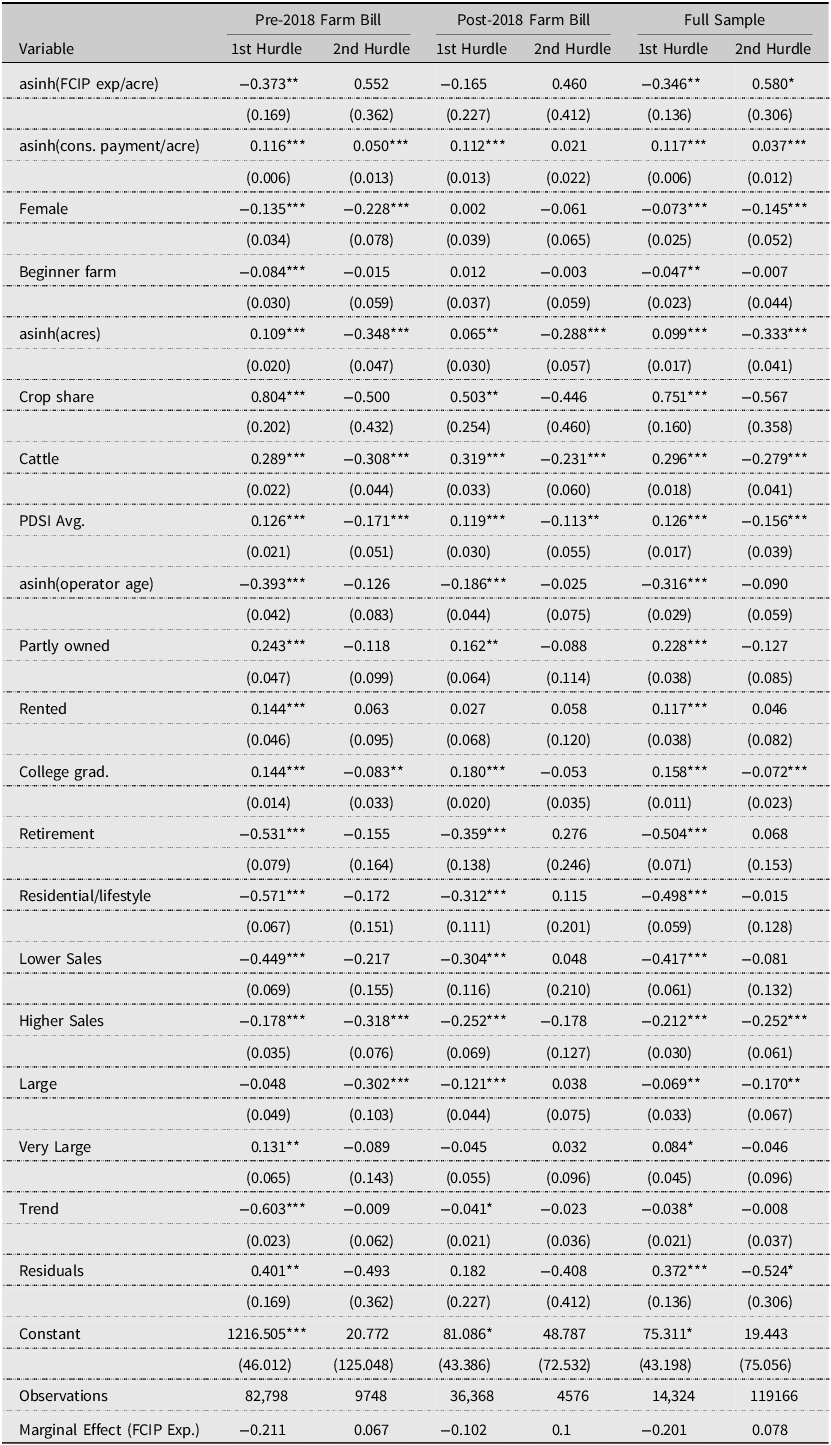
Notes: Standard errors in parentheses. * p < 0.1, ** p < 0.05, *** p < 0.01. The farm level data is from 2012 to 2021 Agricultural Resource Management Survey (ARMS) Phase 3 data. All models included additional controls for state and year fixed effects. Marginal Effects for FCIP Expenditures reported in the footer of the table are for a $1 increase per acre in crop insurance expenditures.
The marginal effects of increasing crop insurance expenditures by $1 per acre are reported in the footer of Table 2 (based on the mean expenditure of $7.34 this increase is approximately a 13.6% increase in expenditures on average).Footnote 19 Focusing on the first hurdle results, prior to the 2018 Farm Bill, the marginal effect of a $1 increase in FCIP expenditures per acre was a 21 percentage point decrease in the probability of adopting cover crops. After the 2018 Farm Bill, the same $1 increase in FCIP expenditures per acre was associated with a 10 percentage point decrease. Second hurdle results suggest 6.7 (pre-2018 Farm Bill) and 10 (post-2018 Farm Bill) percentage point increases in the share of acres planted with cover crops with the caveat that neither estimate shows FCIP expenditures to be a statistically significant determinant of cover crop use.
Figure 1Footnote 20 provides some additional context on the effects that instrumenting via a control function approach and modeling the limited nature of the dependent variable have on estimated marginal effects. Figure 1 depicts marginal effects for FCIP expenditures for the following model specification: OLS, two-staged least squares (TSLS), a standard double hurdle model, and an instrumented double hurdle model (from Table 2). These specifications capture (1) a model that makes no attempt to correct for endogeneity or explicitly model the limited dependent variable (OLS) (2) a model that corrects for endogeneity, but doesn’t model the limited dependent variable (TSLS), (3) a model that does not correct for endogeneity, but does model the limited dependent variable (standard double hurdle), and (4) a model that corrects for endogeneity and models the limited dependent variable (instrumented double hurdle).Footnote 21 Figure 1 also reports marginal effects for each model separately estimated on pre-2018 Farm Bill data, post-2018 Farm Bill data, and the full sample. Notably, all specifications that don’t simultaneously correct for endogeneity or explicitly model the limited dependent variable all have estimated marginal effects that are biased toward zero relative to the instrumented double hurdle specification. Interestingly, choosing to either not model the limited dependent variable (OLS, TSLS) or not correct for endogeneity (OLS, standard double hurdle) produces results that are very similar to what has been found in the existing literature (i.e. statistically and/or economically insignificant).
Marginal effects. Note: Dots in the upper portion of the figure represent point estimates for the marginal effects while the associated error bars represent 95% confidence intervals. The lower portion of the figure represents the model specification which is indicated by which combination of squares are filled in in the column directly below the point estimate. For the entire figure, green shading indicates that the marginal effect for a particular specification is statistically distinct from zero while gray shading indicates statistical insignificance. For example, the specification defined by the far-left column of the figure indicates a marginal effect that is close to zero, but positive and statistically significant and was estimated with an OLS model, did not use any form of instrumental variables, and was estimated on the full data sample. Alternatively, the specification defined by the far right column indicates a marginal effect above zero which is statistically insignificant and comes from the 2nd equation in a double hurdle model that was estimated using an instrumental variables strategy and was estimated on a sample consisting of observations from after the 2018 Farm Bill.

Focusing on the remaining coefficient estimates from our preferred model (Table 2) estimated on the full sample, we find that conservation payments per acre correlates positively with both measures of cover crop use while having a female operator is negatively correlated with both measures. Operating acreage, share of acreage devoted to crops, whether the farm raised cattle, average value of the PDSI index, and education status (i.e. indicator for college graduate, relative to less than college education) are all positively correlated with cover crop adoption but are negatively correlated (note that crop share is negative but statistically insignificant) with the share of acres planted with cover crops. Classification as a beginner farm and operator age are both negatively correlated with the probability of initial cover crop adoption, but have no statistically significant relationship with the share of acres planted with cover crops. Partly owned farms and rented farms are both more likely to initially adopt cover crops relative to fully owned farms, but do not have statistically different shares of acres planted to cover crops.Footnote 22 Farm typology indicators are all negatively correlated with the probability of initial cover crop adoption indicating that any family farm (i.e. retirement, lifestyle, lower and higher sales, large, and very large) is more likely to adopt cover crops relative to non-family farms (excluded category). The same farm typology indicators are also negatively correlated with cover crop use at the intensive margin relative to non-family farms, however “higher sales” and “large” farms are the only indicators to maintain statistical significance across both the first and second hurdle estimates.
A number of coefficient estimates, when viewed as a collection, suggest that resource constraintsFootnote 23 potentially inhibit cover crop adoption. For example, beginner farms are less likely to adopt cover crops. Additionally, the largest negative effects on adoption among the farm typology indicators are for farm classifications that all have the lowest gross cash farm incomes (retired, residential, lower sales). All of these coefficients are also insignificant within the second hurdle regression suggesting that once cover crops are adopted, which implies any resources constraints have necessarily been overcome, these farm characteristics no longer correlate with cover crop use. The result that farms with more total acres tend to be more likely to plant cover crops is also consistent with this idea, however, more acreage is also significantly correlated with smaller shares of total acreage being planted with cover crops.Footnote 24
7. Robustness checks
Our key independent variable, FCIP expenditures per acre, is both right skewed and includes many zero values making application of an inverse hyperbolic sine (IHS) transformation an appropriate choice. However, the IHS transformation is not scale invariant (Aihounton and Henningsen, Reference Aihounton and Henningsen2020; Bellemare and Wichman, Reference Bellemare and Wichman2020). For a variable x, the IHS function has little to no effect on values of x near zero and converges to log(2x) as x approaches infinity (Aihounton and Henningsen, Reference Aihounton and Henningsen2020). Thus the effect of the IHS transformation on the original data values is different based on the scale of the data (a choice that is potentially arbitrary). As a robustness check we re-compute our results after re-scaling FCIP expenditures per acre up and down by a factor of 10. Additionally, we estimate a set of results after instead applying a log transformation after adding 1 to avoid taking the log of zero.
Marginal effects for these estimations are reported in the appendix in figures S1-S3. Overall, our findings related to the relationship between various empirical specifications is preserved across all data transformations. Using OLS, 2SLS, or a standard double hurdle model (without instruments) all produce marginal effects that are biased toward zero and remain economically negligible. Applying the control function approach to the double hurdle model suggests qualitatively equivalent results relative to our main specification. Despite the differences in models being preserved, scaling our primary dependent variable does alter the magnitude of the estimated marginal effects. Scaling up by a factor of 10 results in most estimated marginal effects decreasing in magnitude slightly while scaling down by a factor of ten slightly increases the magnitude of the effect. However, the changes in magnitude of the marginal effects when taking the log of the dependent variable are minute.
Recognizing that a substantial number of farms in our sample report zero FCIP expenditures, as an additional robustness check, we estimate an alternative specification that keeps only observations that report positive crop insurance expenditures which restricts the sample to those farms that are already participating in the FCIP. Marginal effects estimated on this sub-sample of the data are reported in figure S4. Results from our preferred model (DH with instrumental variables) again suggest qualitatively equivalent results across pre and post 2018 Farm Bill subsets, however, estimation on the full data set (of FCIP participants) produces null effects at both margins of cover crop use. Notably, the magnitude of the marginal effect at the extensive margin prior to the 2018 Farm Bill is substantially larger among existing FCIP participants which is consistent with the idea that concerns about FCIP eligibility were a potential deterrent to cover crop adoption prior to the 2018 Farm Bill.
Finally, we incorporate the subsidy-based instrument proposed by (Yu, Smith, and Sumner, Reference Yu, Smith and Sumner2018) into our analysis by constructing an alternative instrument incorporating both the average subsidy rate for 65 and 75% yield protection policies (which we denote as S65 and S75 respectively) and the initial rate (τ 65ct ) as described in a previous section. The variables s65 and s75 are weak instruments (as indicated by 2SLS diagnostic tests) when used alone in our empirical setting, thus, we interact the average of the subsidy rates with our existing initial rate (i.e. τ 65ct [(s65+s75)/2] ). Marginal effects from using this alternatively defined instrument are reported in figure S5 and show qualitatively equivalent results to our primary specification.
8. Conclusion
This study contributes to a limited literature that assesses the relationship between cover crop use and crop insurance participation. The analysis presented here utilizes the US Department of Agriculture (USDA) Agricultural Resource Management Survey (ARMS) to construct a repeated cross section of farm level observations from 2012 and 2015–2021 (N = 119,166). An empirical model is then estimated to assess how cover crop use at the intensive and extensive margins correlates with crop insurance expenditures. Decisions on cover crop use at the intensive and extensive margin are modeled via separate processes by specifying a double hurdle model which is combined with a control function approach to address potential sources of endogeneity.
Contrary to previous literature, the results presented here find highly significant (both statistical and economic) effects between crop insurance participation and cover crop use. We attribute this to limitations in the empirical approaches used in prior studies. Specifically, treatment of endogeneity during estimation produces qualitatively different results compared to specifications that implicitly assume an exogenous relationship between insurance demand and cover crop use. Similarly, the competing effects observed at the intensive and extensive margin of cover crop use lead to estimated effects that are biased toward zero when separate processes for each decision are not explicitly modeled.
Our results are consistent with the narrative that uncertainty in crop insurance eligibility as it relates to cover crop use acted as a deterrent to cover crop adoption. However, we find evidence of this only with respect to use at the extensive margin (i.e. the dichotomous decision to adopt cover crops). With respect to the intensive margin (i.e. the share of acreage planted with cover crops) we find weakly significant effects between cover crop use and FCIP expenditures. Splitting our sample into distinct periods before and after the 2018 Farm Bill suggests that the disincentive effect identified in the entire sample is only statistically significant prior to the 2018 Farm Bill. Again, this is consistent with the narrative that explicit language in the 2018 Farm Bill that clarified cover crop use as a “good farming practice” and encouraged use of cover crops among insured producers may have eliminated prior reservations over cover crop use resulting in loss of crop insurance eligibility. It is worth noting that during this time period, some states were launching their own cover crop incentive programs. Any effects these programs had on cover crop adoption are accounted for via state and year fixed effects in our analysis, however, the existence of these incentive programs is emblematic of a more general effort to promote cover crop use. Similarly, the Pandemic Cover Crop Program was in effect for the 2021 and 2022 crop year which provided subsidy payments for cover crop use.
Our results represent a single characterization of cover crop use as it relates to a single farm risk management strategy: crop insurance. However, the broader relationship between conservation agriculture and farm risk management is far from being fully understood. Even though a number of empirical studies exist that document the ability of cover crops to mitigate agricultural risk, the effects of cover crops from a risk management perspective are highly variable. As noted in section 2, this is potentially due to the large variety of combinations of planting and termination dates, termination method, cover crop species, and cash crop species all of which are under the umbrella term of “cover crops.”Footnote 25 For example, there are many studies that find increases in yield of cereal cash crops following a grain legume cover crop (see Fageria, Baligar, and Bailey (Reference Fageria, Baligar and Bailey2005) for a review). Similarly, Marcillo and Miguez (Reference Marcillo and Miguez2017) conduct a meta-analysis of studies from 1965-2015 and find either neutral or positive yield effects of winter cover crops on corn. However, a number of studies have also found negative effects between cover crops and yields, especially in semiarid environments (see Nielsen et al. (Reference Nielsen, Lyon, Higgins, Hergert, Holman and Vigil2016) for a review). Yet, cases of cover crops mitigating the yield loss associated with extreme drought have also been observed (O’Connor, Reference O’Connor2013). Recent literature has assessed the role of cover crops in direct mitigation of crop insurance losses finding a negative associations between cover crop use and crop insurance losses for perils associated with extreme moisture levels (both excess moisture and drought) (Chen et al., Reference Chen, Rejesus, Aglasan, Hagen and Salas2022; Won et al., Reference Won, Rejesus, Goodwin and Aglasan2024).
Overall, the effects of cover crops on yields are, a-priori, ambiguous without knowing the precise combination of farmer decisions and climatic variables that characterize a cover crop practice. Adding to the potential variability in how cover crops may be perceived from a risk management perspective is the fact that some evidence suggests that the benefits to soil quality of conservation agricultural practices accumulate over time with continuous use (Karlen et al., Reference Karlen, Cambardella, Kovar and Colvin2013; Mbuthia et al., Reference Mbuthia, Acosta-Martínez, DeBruyn, Schaeffer, Tyler, Odoi, Mpheshea, Walker and Eash2015; Richter et al., Reference Richter, Hofmockel, Callaham, Powlson and Smith2007; Wood and Bowman, Reference Wood and Bowman2021). Thus, it may be rational from an agronomic perspective to view cover crops as a practice that enhances risk in the short term in exchange for increased resilience and yields in the long term.
Although our own results are robust to a number of alternative specifications, limitations in our empirical approach still exists. Specifically, availability of expenditures as the only measure of insurance demand provides an incomplete picture of farm preferences for crop insurance by obscuring details such as insurance plan type (for example, revenue vs yield protection), coverage levels, unit structure (i.e. basic, optional, or enterprise units). These characteristics all influence the level of crop insurance subsidies received by the farm and in turn alter the out-of-pocket cost of insurance. Use of farm level data that contains more detailed descriptions of crop insurance decisions has the potential to allow for more in-depth analysis and help understand whether the policy effects identified in this study permeate across the entire FCIP or if particular groups of producers and crop insurance policies were responsible for the aggregate level effects seen here.
Supplementary material
The supplementary material for this article can be found at https://doi.org/10.1017/aae.2025.12.
Data availability statement
The data set used for this analysis is from the USDA’s Agricultural Resource Management Survey (ARMS) and is a restricted farm level data set not generally available to the public. Thus, the author’s do not have the authority to directly provide data used in the analysis but can provide code to any researchers that have been approved to access the ARMS data set for purposes of replicating the analysis.
Acknowledgements
The findings and conclusions in this publication are those of the author(s) and should not be construed to represent any official USDA or U.S. Government determination or policy. This research was supported by the U.S. Department of Agriculture Economic Research Service.
Author contribution
Dylan Turner: Conceptualization, Data curation, Formal Analysis, Investigation, Methodology, Software, Visualization, Writing – original draft; Writing – review and editing Francis Tsiboe: Conceptualization, Data curation, Formal Analysis, Investigation, Methodology, Writing – original draft; Writing – review and editing Maria Bowman: Conceptualization, Writing – original draft; Writing – review and editing Roderick M. Rejesus: Conceptualization, Project administration, Writing – original draft; Writing – review and editing.
Financial support
The work of Rejesus on this manuscript was supported in part by USDA NIFA Hatch Project Nos. NC02696 and NC02959; USDA NIFA AFRI Competitive Grant No. 2019-68012-29818 (Enhancing Sustainability of US Cropping Systems Through Cover Crops and an Innovative Information and Technology Network), USDA NRCS Grant No. 2021-1033/NR213A750013G022 (RealTime Farmer Learning on Benefits of Cover Crops for Managing Soil Health, and Water and Nutrients Dynamics); USDA NRCS Grant No. NR233A7500116021 (Implementing a Climate-Smart Precision Cover Crop and Nitrogen Management Decision Support Tool); NASA Grant 80-NSSC23-M0034 (The NASA ACRES Consortium Subaward from U. of Maryland); and the Climate Adaptations through Agricultural and Soil Management Project (CASM) (from NCSU Reduction and Reversal of CO2 Research Endowment). The research effort of Rejesus is also (http://precisionsustainableag.org) part of a regional collaborative project supported by the USDA-NIFA, Award No. 2019-68012-29818, titled Precision Sustainable Ag Coordinated Agricultural Project (PSA CAP): A Cover Crop Network for Enhancing the Sustainability of US Cropping Systems.
Competing interests
All authors declare that they have no known competing financial interests or personal relationships that could have appeared to influence the work reported in this paper.
AI contributions to research
AI was not used to perform any part of this research.



 Open access

