



INTRODUCTION
Escherichia coli O157 causes an estimated 96 000 illnesses annually in the USA [Reference Scallan1]. Infections typically result in severe abdominal cramping and diarrhoea, which is often bloody [Reference Slutsker2]. Complications include haemolytic uraemic syndrome (HUS) and death.
E. coli O157 infection became nationally notifiable in the USA in 1994, and passive, national Laboratory-based Enteric Disease Surveillance (LEDS) began collecting information on laboratory-confirmed isolates in 1996. We used these data to describe temporal and geographical patterns of E. coli O157 isolates reported to the US Centers for Disease Control and Prevention (CDC) from 1996 to 2011 and the demographics of the persons whose clinical specimens yielded the isolates.
METHODS
We evaluated data on E. coli O157 isolates reported by state public health laboratories to CDC from 1996 to 2011. Clinical laboratories in all 50 states and territories are requested (and, in some states, required) to forward clinical isolates of E. coli O157 to their state public health department laboratory. State public health laboratories send reports containing information on patient's sex, age, race, ethnicity, and county and state of residence, as well as specimen source, serotype, and date of collection. Reports are sent electronically to CDC. Isolates with the same state identifiers that also match by age, state, and specimen source and have specimen isolation dates within 30 days of one another are considered duplicates and discarded.
We calculated average annual E. coli O157 isolation rates/100 000 persons by patient's state of residence (including District of Columbia), age, and sex using intercensal population estimates from the US Census Bureau. We used the 37th parallel north to define northern and southern states because it is conveniently the official border of multiple states. We defined a southern state as any state entirely south of the 37th parallel north and the remainder as northern states. In the analysis of northern vs. southern states, we excluded (1) Alaska and Hawaii, because they are not part of the contiguous USA, and (2) California and Nevada, because a large proportion of their population is on both sides of the 37th parallel north.
To explore urban/rural differences in annual E. coli O157 isolation rates, we analysed the data by census-derived categories of counties based on percentage of the population residing in a rural area: ⩽25%, 26–50%, 51–75%, and ⩾76%. We constructed standard and zero-inflated Poisson and negative binomial regression models. The zero-inflated count regression models account for the possibility that zero illness counts reported by some counties are related not to a true lack of illness, but to detection or reporting that is less complete than in other counties [Reference Hilbe3]. We conducted the analysis on all 3141 counties. To exclude counties that may have been more likely to have incomplete reporting, we also conducted the analysis on a dataset that excluded counties with a population <1000 and those that did not report any Salmonella or E. coli O157 isolates during the 16-year period. We then selected a best model based on quality of fit and epidemiology, and report estimated isolation rates by rural category with their 95% confidence intervals (CIs).
Data were analysed using SAS v. 9.3 (SAS Institute Inc., USA).
RESULTS
During 1996–2011, CDC received reports of 38 895 laboratory-confirmed E. coli O157 isolates from all 50 states and the District of Columbia. Of these, 36 841 (95%) were identified as O157:H7. Of the 35 095 isolates with known sources, 33 886 (97%) were from stool specimens and the remainder were from other sources including urine (163, 0·5%), blood (91, 0·3%), and wounds or abscesses (40, 0·1%). The average annual isolation rate nationally was 0·84/100 000 persons. In 1996, the isolation rate was 0·71/100 000 persons, which decreased to 0·62/100 000 persons in 1997 (Fig. 1). Isolation rates then steadily increased to a peak of 1·29/100 000 persons in 2000, followed by a decline to 0·76/100 000 persons in 2004. From 2004–2011, isolation rates were relatively stable with the exception of increases in 2006 and 2008.
Annual isolation of E. coli O157, USA, Laboratory-based Enteric Disease Surveillance, 1996–2011.

Of the isolates with patient data available, 53% were from female patients and the median age in patients was 15 (range 0–108) years. Comparatively, the median age of the general population was 37 years in 2010 [4]. Based on the 33 937 (87%) isolates with known patient's age and sex data, the highest isolation rate (3·19/100 000 persons) was in children aged 1–4 years (Table 1). The rate declined with increasing age to a nadir of 0·30/100 000 persons in those aged 30–39 years, then steadily increased to 0·62/100 000 persons in those aged 70–79 years and was similar (0·58) in patients aged ⩾80 years.
Average annual isolation rate (isolates/100000 persons) of E. coli O157 by age group and sex, USA, Laboratory-based Enteric Disease Surveillance, 1996–2011

For children other than infants (aged <12 months), laboratory-confirmed isolation rates were higher in boys than girls (Table 1). For infants and those in age groups ⩾20–29 years, the rates were higher in females than males.
In the contiguous USA, the average annual isolation rate was 1·52/100 000 persons in states in the north and 0·43 in states in the south. All states with an average annual isolation rate >1·0 were in the north (Fig. 2).
Average annual isolation rate of E. coli O157 by state, USA, Laboratory-based Enteric Disease Surveillance, 1996–2011 (n = 38895).

For the rurality analysis, we found significant overdispersion of illness counts relative to simple Poisson regression. In 3141 counties, 35% never reported an E. coli O157 isolate over the 16-year time span; 56% of the non-reporting counties had ⩾76% rural populations. We examined the occurrence of many zero illness counts in zero-inflated and other models, and found no evidence of zero inflation. A negative binomial regression model had the best fit. The model applied to the complete dataset estimated isolation rates in counties with ⩽25%, 26–50%, 51–75%, and ⩾76% rural populations as 0·81 (95% CI 0·73–0·89), 0·92 (95% CI 0·84–1·0), 0·81 (95% CI 0·74–0·88), and 0·67 (95% CI 0·61–0·73)/100 000 persons, respectively. We found similar results when this model was applied to the dataset that excluded the 105 (3%) counties that may have been more likely to have incomplete reporting.
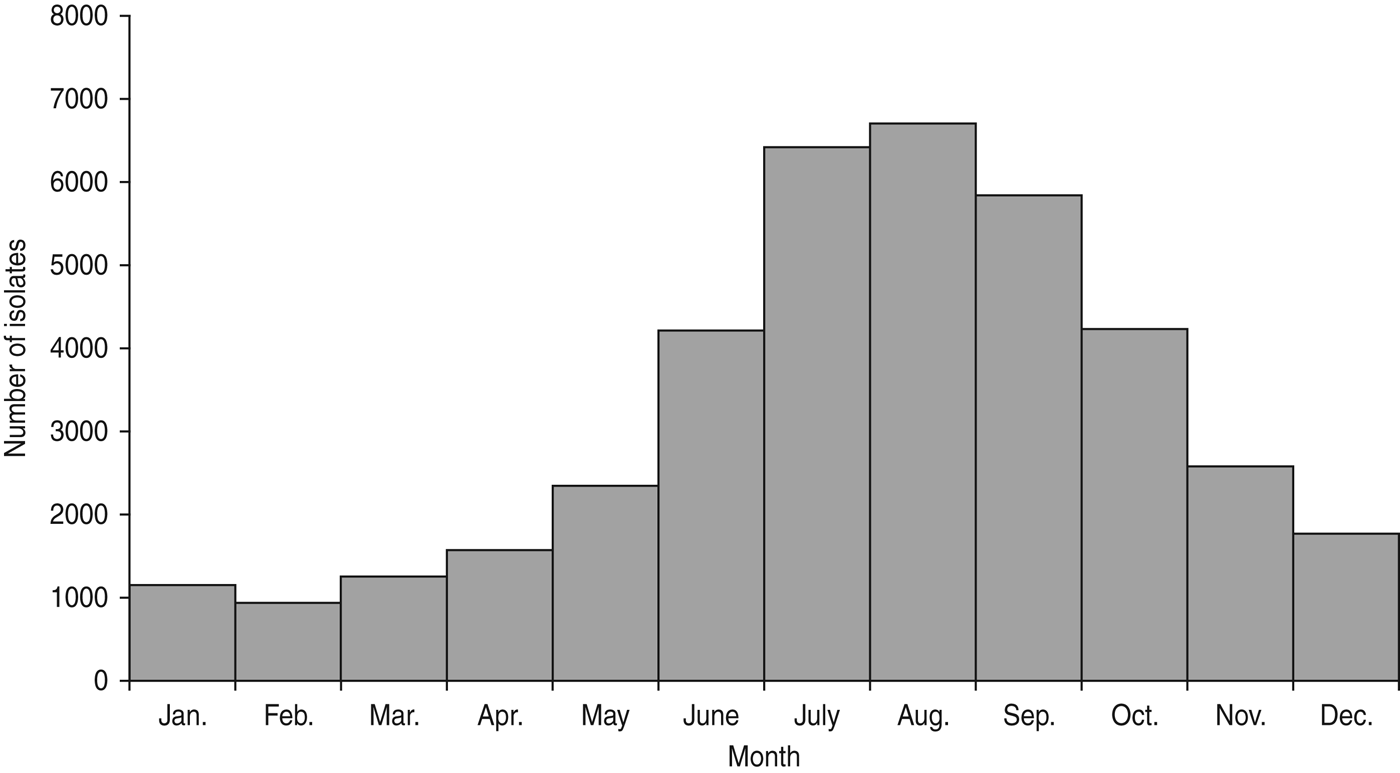
Infections were sharply seasonal, with 49% of isolates collected during July–September and only 9% during January–March (Fig. 3). This summer predominance was similarly present in both northern and southern regions.
Number of E. coli O157 isolates by month, USA, Laboratory-based Enteric Disease Surveillance, 1996–2011 (n = 38895).
DISCUSSION
This study is the first to evaluate longitudinal US national data on E. coli O157 infections and highlights the value of national surveillance programmes to evaluate geographically disperse data. Isolation rates were highest in northern states, during summer months, and in children aged 1–4 years.
The reason that states in the northernmost latitudes have higher incidence rates is not known, but this finding is consistent with other studies and reports [Reference Slutsker2, Reference Boyce, Swerdlow and Griffin5]. A multicentre hospital-based study during 1990–1992 reported a northern predominance [Reference Slutsker2], and the northernmost Foodborne Diseases Active Surveillance System (FoodNet) sites have reported a higher incidence than other sites [6], even after adjusting for outbreaks and testing practices [Reference Bender7]. In addition, analysis of outbreak data indicates a higher rate of outbreaks in northern than in southern states (CDC, unpublished data). This increasing incidence with increasing proximity to the poles may be a global phenomenon. Within continental Europe, reported rates tend to be higher in northern European countries, such as Germany and The Netherlands, than in southern European countries, such as Spain and Italy [Reference Caprioli, Tozzi, Kaper and O'Brien8]. In addition, in the UK and North America, incidence is highest in the northernmost countries, Scotland and Canada, respectively [Reference Waters, Sharp and Dev9]. Conversely, in the southern hemisphere, higher rates of illness tend to be reported from the more southerly nations. For example, Argentina, which has a high cattle density, has the highest reported incidence rates of HUS globally; most of Argentina's HUS cases are caused by Shiga toxin-producing E. coli infection, and the predominant serogroup is E. coli O157 [Reference Rivas10, Reference Rivas11]. The southern Africa region was among the first areas to report HUS cases [Reference Kibel and Barnard12] and reported the largest E. coli O157 outbreak in Africa [Reference Effler13]. A latitude effect suggests a climatic role in transmission of E. coli O157 or shedding in cattle, the primary reservoir [Reference Wells14]. Number of daylight hours has been reported to correlate positively with increased shedding of E. coli O157 by cattle. In an experimental study, cattle exposed daily for 60 days to ~12 h of natural light followed by an additional 5 h of artificial light were found to shed more E. coli O157 organisms than cattle exposed only to the 12 h of natural light [Reference Edrington15]. These authors suggested a possible role of melatonin, a hormone with seasonal fluctuations and possible effects on the immune system. Such a mechanism may explain our findings, given the longer daylight hours in northern than southern states in the USA during the summer.
Other possible reasons for our geographical findings include geographical differences in animal carriage, meat processing, or urbanization. In addition, environmental factors including water sources and cattle density may play a role. Studies in Canada and Germany found cattle density to be positively associated with incidence of E. coli O157 infections in humans [Reference Frank16–Reference Innocent, Mellor and McEwen18]. For this reason, we expected to find higher isolation rates in rural counties but instead found the lowest rate in the group of counties with the highest rural population. A large proportion of rural counties did not report a single case over the 16-year period. It is possible that persons in rural counties are less likely to have a stool cultured, or that clinical laboratories that serve rural areas test fewer samples for E. coli O157 or report cases less consistently; if so, our finding may be an artifact of diagnosis or surveillance. However, we found no evidence that non-reporting counties influenced our findings. Our finding is plausible if persons in rural counties have many opportunities for low-level exposure that results in immunological protection without clinical illness. An estimated 68% of E. coli O157 infections nationally are transmitted by food, so rural residence may not have a large role in determining variation in rates of illness [Reference Scallan1].
Consistent with other reports [Reference Slutsker2, Reference Ostroff19], we found that infections were most common in the summer months. While a study based on FoodNet Population Survey data found no seasonal variation in ground beef consumption patterns [Reference Taylor20], a higher proportion of cattle shed E. coli O157 during the summer months [Reference Hancock21], which probably relates to the increased prevalence of E. coli O157 contamination of beef during those months [Reference Williams22]. In addition, other modes of transmission such as waterborne and direct animal contact may also be affected by this increased shedding.
Incidence was highest in children aged 1–4 years. Person-to-person transmission has been well documented, accounting for 14% of US E. coli O157 outbreaks from 1982 to 2002, mostly in child daycare centres [Reference Rangel23]. Hygienic factors may result in more frequent exposure in children, and immunological susceptibility may also play an important role.
Sources of E. coli O157 infection include food, particularly ground beef, water, contact with animals or their environment, and direct contact with another person or fomite [Reference Rangel23]. Most prevention efforts have focused on decreasing the contamination of ground beef. The decline in incidence from 2000 to 2003 mirrored the 76% decline in contamination of ground beef samples with E. coli O157 from 2000 to 2004 [Reference Naugle24].
The pattern of isolation rates observed in our data, including the decrease in incidence from 2000 to 2004, correlates well with trends in FoodNet sites, which included 15% of the US population in 2009 [Reference Boyce, Swerdlow and Griffin5]. The increase in incidence from 1996 to 2000 may be due to increased testing by clinical laboratories [Reference Voetsch25]. In 2002, in response to continued outbreaks and ground beef recalls, USDA tightened regulations and the beef grinding industry made changes that were followed by marked declines in 2003 and 2004 in the proportion of ground beef samples that yielded E. coli O157 which possibly contributed to decreasing incidence [Reference Naugle26, Reference Naugle27]. The spikes in incidence in 2006 and 2008 may reflect actual increases in illnesses but could have been related to increased testing related to several large, multistate outbreaks. In 2006, an outbreak of E. coli O157 infections from contaminated spinach resulted in 205 illnesses in 26 states [28, Reference Wendel29]. In 2008, a widespread outbreak of Salmonella serotype Saintpaul infections associated mostly with contaminated jalapeño and Serrano peppers caused 1500 illnesses in 43 states [Reference Barton Behravesh30]. The increased awareness and publicity caused by these outbreaks may have led to increased patient visits and increased stool testing by physicians.
We did not calculate confidence intervals in our analysis because the surveillance system is designed to capture all isolates reported at the national level and does not represent a subset of isolates (e.g. National Antimicrobial Resistance Monitoring System) or of the population (e.g. FoodNet). Therefore, with no sampling within the surveillance system, there are no appropriate statistical methods to assess the uncertainty within it.
There are still limitations to the interpretation of these data. First, only persons with illness severe enough for the person to seek medical care and for which the provider ordered cultures are represented. Second, the completeness of reporting varies between states because public health requirements and infrastructure vary at the state and local level. Because our results correlate with trends found in FoodNet, this variation in reporting appears to have had a minimal effect on the evaluation of national patterns but does dictate caution in the interpretation of state and regional data. This is particularly an issue with Maine, Nebraska, Texas, and Wyoming; after 2006, these states began using a reporting system from which serogroup information could not be retrieved. There is also variability in information provided to the surveillance system. For example, nearly 13% of reports lacked age and gender information. However, there is no evidence on the extent that this may have biased the patterns related to age or gender.
Prevention of E. coli O157 infections depends on understanding mechanisms of transmission. Further research into decreasing carriage and shedding by cattle, preventing contamination of beef and other foods such as produce, and better understanding of the reasons for the higher incidence in northern states and for the summer seasonality could help in developing strategies to prevent illnesses. Analyses that estimate the proportion of illnesses attributable to specific foodborne (e.g. ground beef, leafy vegetables) and non-foodborne transmission routes could help in targeting prevention efforts.
ACKNOWLEDGEMENTS
The authors thank Robert M. Hoekstra (Centers for Disease Control and Prevention, Atlanta, GA), for his statistical support and guidance.
DECLARATION OF INTEREST
None.



