


Introduction
Improved grass growth and utilization is a key component of maintaining the economic and environmental sustainability of ruminant production systems in temperate environments (Peyraud et al., Reference Peyraud, van den Pol, Dillon and Delaby2010; Conant et al., Reference Conant, Cerri, Osborne and Paustian2017; Neal and Roche, Reference Neal and Roche2020). Chapman et al. (Reference Chapman, Kenny, Beca and Johnson2008) outlined how farm profitability is directly related to the quantity of grass grown and utilized through grazing on-farm. Perennial ryegrass (Lolium perenne L., PRG) is considered the most important temperate forage species used in pasture production (Easton et al., Reference Easton, Baird, Cameron, Kerr, Norriss and Stewart2001; McEvoy et al., Reference McEvoy, O'Donovan and Shalloo2011a). This is due to its high nutritive value and relatively low cost compared to other feed sources for ruminants (Finneran et al., Reference Finneran, Crosson, O'Kiely, Shalloo, Forristal and Wallace2010).
European grassland farmers are under increasing pressure to reduce the extent of fertilizer usage (Velthof et al., Reference Velthof, Lesschen, Webb, Pietrzak, Miatkowski, Pinto, Kros and Oenema2014), including a prescribed reduction of 20% from 2020 usage levels before the year 2030 (EU, 2020). A review of New Zealand (NZ) grass breeding stated that any further increase in fertilizer inputs above those already used by grassland farmers will not increase PRG dry matter (DM) production (Parsons et al., Reference Parsons, Edwards, Newton, Chapman, Caradus, Rasmussen and Rowarth2011). Alternative strategies for increasing DM production on commercial farms are therefore required. Grass growth and utilization can be improved through a combination of reseeding of poor-performing pastures with higher-performing grass varieties as well as better aligning grass growth and feed requirement over the grazing season (Shalloo et al., Reference Shalloo, Creighton and O'Donovan2011). The use of improved grass varieties, with increased DM production and nitrogen (N) use efficiency, will be required in the future to increase the efficiency of pasture production systems (O'Donovan et al., Reference O'Donovan, Lewis and O'Kiely2011; Cameron et al., Reference Cameron, Di and Moir2013).
The development of new grass varieties in Ireland has been directed mainly by recommended list (RL) evaluation trials since their establishment in 1973 (Grogan and Gilliland, Reference Grogan and Gilliland2011; Stewart and Hayes, Reference Stewart and Hayes2011). RL evaluations assess a variety's value for cultivation and use (VCU) through a system of mechanically defoliated plot trials, a protocol common throughout Europe. The Irish system involves assessing varieties for DM production, nutritive value and short term persistency across two growing seasons following an establishment year (DAFM, 2021). This system has been used effectively by breeders to select and develop PRG varieties with greater DM production over the last number of decades (Lee et al., Reference Lee, Matthew, Thom and Chapman2012; McDonagh et al., Reference Mcdonagh, O'Donovan, McEvoy and Gilliland2016). Nonetheless, mechanically defoliated plot trials are limited in terms of the information generated (O'Donovan et al., Reference O'Donovan, Lewis and O'Kiely2011; Kerr et al., Reference Kerr, Chapman, Thom, Matthew, Linden, Barid, Johnston and Corkran2012). These limitations include a lack of information on lifetime variety persistence, performance metrics under animal grazing scenarios, including tolerance to grazing pressures such as treading and plant pulling, and a limited number of evaluation sites across differing environments (Wilkins and Humphreys, Reference Wilkins and Humphreys2003; Kerr et al., Reference Kerr, Chapman, Thom, Matthew, Linden, Barid, Johnston and Corkran2012). Such limitations question the suitability of plot evaluation systems alone to deliver on the current needs of grassland farmers (Byrne et al., Reference Byrne, Gilliland, Mchugh, Delaby, Geoghegan and O'Donovan2017).
In order to overcome the limitations of plot evaluation trials in reflecting on-farm performance, Lee et al. (Reference Lee, Matthew, Thom and Chapman2012) recommended improved overall integration, and thus alignment, of plant breeding, variety evaluation, and farm systems analyses. Since 2015, PRG varieties in Ireland are ranked on a system called the pasture profit index (McEvoy et al., Reference McEvoy, O'Donovan and Shalloo2011a) based on performance values from the evaluation trials. This index ranks varieties on the sum of the economic performance of the key pasture metrics, namely total and seasonal DM production, sward persistency and quality. Such a system provides clear direction to farmers and plant breeders (McEvoy et al., Reference McEvoy, O'Donovan and Shalloo2011a) in selecting suitable varieties bespoke to their needs (McEvoy et al., Reference McEvoy, O'Donovan and Shalloo2011b). Similar indexes are being developed in other jurisdictions, including Australia and NZ (Chapman et al., Reference Chapman, Bryant, Olayemi, Edwards, Thorrold, Mcmillan, Kerr, Judson, Cookson and Moorhead2017; Leddin et al., Reference Leddin, Jacobs, Smith, Giri, Malcolm and Ho2018).
Despite refinements of the plot-based evaluation system, there is a lack of information on long-term sward performance under grazing. Grazed plots are rarely used in evaluation systems as they are considered prohibitively expensive (Gilliland et al., Reference Gilliland, Barrett, Mann, Agnew and Fearon2002). Conflicting evidence of how well mechanically defoliated plots and animal grazed plots relate to each other have been reported (Frame and Hunt, Reference Frame and Hunt1971) with more recent studies reporting no significant differences in DM production between the two strategies (Cashman et al., Reference Cashman, McEvoy, Gilliland and O'Donovan2016). An NZ sheep grazing trial provided some information on the DM production performance of PRG varieties over a 10-year period (Chapman et al., Reference Chapman, Muir and Faville2015). While providing some useful information on the long term growth of PRG varieties, the dataset from that study had some shortcomings, including representation of only one trial site. Conducting PRG variety evaluations on-farm has been promoted as the most accurate way to assess the value of varieties to farmers (Wilkins and Humphreys, Reference Wilkins and Humphreys2003; Smith et al., Reference Smith, Ludemann, Lewis, Malcolm, Banks, Jacobs, Fennessy and Spangenberg2014). The evolution of technology in the form of PastureBase Ireland has provided researchers with access to commercial grassland data that was previously unavailable (Hanrahan et al., Reference Hanrahan, Geoghegan, O'Donovan, Griffith, Ruelle, Wallace and Shalloo2017). PastureBase Ireland acts as both a grassland management decision support tool for farmers who use it regularly and as a national database of grassland growth information which can be utilized by researchers, as is the case with the current study.
The objective of the current study was to quantify the phenotypic performance (DM production and grazing events) of ten PRG varieties over a 7-year period (2013–2019) on commercial Irish grassland farms. The results from this study could be instrumental in progressing the development of the PPI and promoting the use of on-farm data as an indicator of variety performance.
Materials and methods
This longitudinal study of PRG variety performance was based on data collected from 559 paddocks across 98 commercial Irish grassland farms between the years 2013 and 2019 inclusive. Each farm acted as a replicate and paddocks were treated as the experimental unit nested within each farm. Farms were located across a range of agroclimatic regions on differing soil types; all operating grass-based ruminant production systems in the Republic of Ireland, of which the majority were dairy farms. All participating farmers used PastureBase Ireland (Hanrahan et al., Reference Hanrahan, Geoghegan, O'Donovan, Griffith, Ruelle, Wallace and Shalloo2017) to assist with grassland management decisions. The farms (number of farms in parenthesis) were located in the following counties: Cavan (1), Cork (29), Donegal (3), Galway (8), Kerry (5), Kildare (3), Kilkenny (6), Laois (2), Limerick (9), Longford (2), Louth (1), Mayo (4), Roscommon (4), Sligo (3), Tipperary (9), Waterford (2), Westmeath (4) and Wexford (3). The majority of the participating farms required a Nitrates Derogation (DAFM, 2020) for each of the evaluation years, permitting application of between 170 and 250 kg organic N/ha/year across all farm paddocks in addition to 250 kg of inorganic N/ha/year.
Data capture and storage – PastureBase Ireland
PastureBase Ireland is comprehensively described in Hanrahan et al. (Reference Hanrahan, Geoghegan, O'Donovan, Griffith, Ruelle, Wallace and Shalloo2017). Briefly, it is a web-based grassland database which has a dual function of providing real-time decision support for farmers while acting as a national grassland database, capturing information for benchmarking and research purposes. The system operates with the individual farm paddock as the basic unit of measurement; all measurements on PastureBase Ireland are calculated and presented on a per hectare basis for individual paddocks.
The PastureBase Ireland system is operated by the farmer entering grassland information through a web front end; the accuracy of the information collected, therefore, is dependent on the accuracy of the information inputted by the farmer. Nonetheless, data recorded in PastureBase Ireland must satisfy predefined verification rules programmed into the system. Such verification checks include restrictions on grass DM production estimates (0–3500 kg DM/ha), silage DM production estimates (0– 10 000 kg DM/ha) and residual sward heights (2.5–9.0 cm). All participating farmers were provided with grassland management training for the duration of the study and all farmers were part of discussion groups, which met monthly during the main grass growing season. This helped ensure that data were recorded correctly and that grassland management standards were adhered to (Teagasc, 2011).
Farmer inputs
All grassland information was recorded by the farmers in the PastureBase Ireland application through either web-based or smartphone enabled interfaces. The operator builds a profile for each paddock, entering background information such as size, altitude, aspect, drainage status, reseed date and method, sown varieties and soil fertility records. Grass cover estimates were entered on a weekly or bi-weekly basis. Estimates were taken by using either a plate meter (O'Donovan et al., Reference O'Donovan, Dillon, Rath and Stakelum2002b; Jenquip, 2019) or by visual assessment (O'Donovan et al., Reference O'Donovan, Connolly, Dillon, Rath and Stakelum2002a) prior to grazing or silage harvesting. Total and seasonal DM production was calculated from farmer-inputted grass cover estimates throughout the year; seasons were defined as spring (1 February to 10 April), mid-season (11 April to 6 August) and autumn (7 August onwards) (McEvoy et al., Reference McEvoy, O'Donovan and Shalloo2011a). The farmer was also required to enter information including the current status of each paddock (silage, grass, reseed, under grazing, other) along with defoliation event date and type (grazed or silage cut) as appropriate (Hanrahan et al., Reference Hanrahan, Geoghegan, O'Donovan, Griffith, Ruelle, Wallace and Shalloo2017).
Meteorological data
Meteorological data generated from four inland weather stations operated by Met-Éireann (2021) were recorded; these sites were located in the south-west (Moorepark, 52°16′N, 8°26′W), south-east (Johnstown Castle, 52°16′N, 6°30′W), north-east (Ballyhaise, 54°51′N, 7°31′W) and north-west (Athenry, 53°17′N, 8°47′W) of Ireland. Annual data from these stations was taken from the Irish national meteorological database (Met-Éireann, 2020) where records for rainfall, minimum and maximum air and soil temperatures (10 cm depth) were accessed.
Ground score
Perennial ryegrass sward ground score (GS) was established by visually scoring swards annually over the winter period (December–January). Swards were scored on a scale of 0–9 (where 0 = 0.0–0.10 perennial ryegrass and 9 = 0.91–1.00 perennial ryegrass) (Cashman et al., Reference Cashman, McEvoy, Gilliland and O'Donovan2016). This protocol is similar to that undertaken in VCU cultivar evaluation at the plot level (Grogan and Gilliland, Reference Grogan and Gilliland2011).
Variety establishment
Grass varieties were sown following guidelines to ensure successful sward establishment (Teagasc, 2014). These guidelines include treating paddocks with glyphosate, cultivating ground to form a fine, firm seedbed and sowing varieties at a standard rate of 34.5 kg/ha. The cultivation methods were limited to plough-till-sow, discing, one-pass and direct drilling, where air seeders were generally used to distribute the seed evenly into the seedbed. Each of these is proven to be an equally effective method of sward establishment in Ireland (Creighton et al., Reference Creighton, Kennedy, Hennessy and O'Donovan2016) and farmers were encouraged to choose the practice best suited to their farm at the time of sowing. Fertilizer, including lime, was applied as appropriate (according to soil test results) at sowing and post-emergent herbicide was applied within the first 6 weeks after sowing.
Perennial ryegrass varieties were selected from the Irish RL for grass and white clover varieties in each of the years 2011–2018 (DAFM, 2021). Diploid (D) and tetraploid (T) varieties with heading dates ranging from 29 May to 9 June were selected for use. AberGain (late heading T) was sown in at least one paddock across all 98 farms over the course of the measurement period and each farm was allocated a subset of the other varieties, both tetraploid and diploid, from the evaluation set; varieties were sown between April and August from 2011–2018. Variety allocation was dependent on a number of factors such as the farmer's reseeding programmes, previously sown varieties and, to a lesser extent, seed availability. The varieties sown (along with the associated ploidy and heading date in parenthesis) were: AberChoice (D; 9 June), AberGain (T; 4 June), Astonenergy (T; 2 June), Drumbo (D; 7 June), Dunluce (T; 29 May), Glenveagh (D; 1 June), Kintyre (T; 6 June), Majestic (D; 1 June), Twymax (T; 7 June) and Tyrella (D; 4 June).
Data analyses
Only farms with a minimum of thirty completed farm grass measurements per annum (equating to one grass growing year, between January and December) were retained for that year. Newly reseeded swards were excluded from the analysis; swards were required to have been through one winter (fully established) before they were included in the analysis. The sample size of all varieties is outlined in Table 1.
On-farm sample size (number of paddocks) per variety and year

a (T) denotes tetraploid varieties, all other varieties are diploid.
The association between variety and each agronomic parameter was estimated using linear mixed models in SAS using PROC MIXED (SAS Inst., Cary, NC, USA). Paddock, nested within a farm, was included as a repeated measure in all analyses with a first-order autoregressive covariance structure assumed among repeated records (chosen based on the Akaikie information criterion). Two-way interaction between farm and year was included as a random effect in all models to account for any possible changes in farm management practices or conditions (e.g. weather) over the trial period. The production dependent variables assessed were total, spring, mid-season and autumn DM production, grazing DM production and silage DM production (kg DM/ha); GS and number of grazing and silage events were also considered as dependent variables. In all models, the fixed effects were variety, year, sward age and a two-way interaction between variety and year. Sward age was defined as measurement year minus sowing year with sward ages ⩾7 coded as 7-years-old. The model used to assess variety DM production and GS as they aged was similar to that used above for annual performance except the interaction between variety and sward age was included as a fixed effect in the model instead of the interaction between variety and year.
Results
Meteorological data
Meteorological data for the study period (2013–2019) from the four inland weather stations located across the country indicated some inter-annual and inter-location differences existed in summer rainfall. There was a severe moisture deficit in Ireland in the summer of 2018 with all locations recording between 0.55 and 0.71 of their respective seasonal mean for the 7-year period. Drought conditions prevailed across Ireland for approximately 12–16 weeks in the summer of 2018 causing daily grass growth rates to fall below 30 kg DM/ha/day when the 7-year average was 60 kg DM/ha/day for the same 4 week period (Fig. 1). There was a similar, but shorter, dry period in the summer of 2013 which affected the South-East of Ireland more severely than other regions; Johnstown Castle, which is located in the South-East, recorded 0.67 of its mean summer rainfall for the 7-year period. Little variation in temperature parameters existed for each location across seasons and years. Over the course of the current study, the minimum soil temperature reached was 0.4°C while the maximum air temperature peaked at 30.2°C, both occurring in 2018 at Athenry in the North-West of the country.
National herbage growth (kg DM/ha/day) for 2013–2019 inclusive (M. O'Leary 2020, personal communication).

Variety phenotypic performance
Variety was associated with total, spring and mid-season DM production, grazing DM production and a number of grazing events; variety was not associated with silage DM production (P = 0.48). Only the associations between variety and autumn DM production and between variety and GS differed by year. The year was associated with total, spring and mid-season DM production, grazing DM production and a number of grazing events (Table 2).
Significance levels (P values) of the main phenotypic effects and their interactions across production and management data

NS, not significant.
Total dry matter production
AberGain had the highest DM production (15 434, SE = 205 kg DM/ha), growing 1342 kg DM/ha/year more than the mean DM produced by all other varieties. The second-highest producing variety, Drumbo, produced 996 kg DM/ha/year less than AberGain (Table 3) over the study period. The poorest growing year was 2018 in which a summer drought occurred; 2018 DM production fell to 0.82 of mean DM production of all other years. The best year for DM production was 2017 when the average DM production was 1.1 of the mean DM production of all other years (Table 4).
Total (grazing plus silage), grazing and silage DM production (kg DM/ha) (LS means with standard errors in parentheses) and number of defoliation events achieved1,2

1abcde Means within a column with different superscripts differ significantly (P < 0.05).
2 All DM production totals are subject to rounding in the PastureBase Ireland system, hence silage and grazing totals may not always sum up exactly to total DM production figures.
3 (T) denotes tetraploid varieties, all other varieties are diploid.
Total DM production (kg DM/ha) (LS means with standard errors in parentheses) per variety, and mean of all varieties, across the 2013–2019 production years
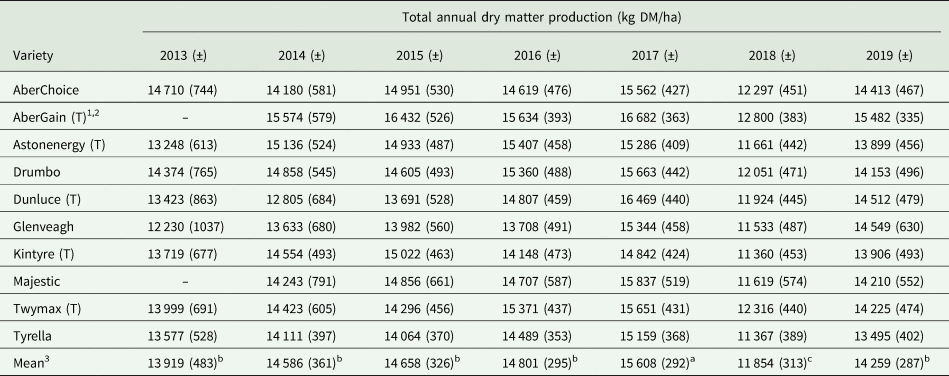
1 (T) denotes tetraploid varieties, all other varieties are diploid.
2 Data missing for Majestic and AberGain as those varieties did not meet the threshold of paddocks sown in 2013.
3abc Means within a row with different superscripts differ significantly (P < 0.05).
Seasonal dry matter production
The interaction between variety and year for autumn DM production is most clearly illustrated by Dunluce which was the highest producing variety in autumn 2015 but lowest producing variety in autumn 2017, a range of 1594 kg DM/ha within a 3-year period (data not shown). AberGain, Astonenergy and Majestic had the highest autumn DM production across the trial period (Table 5). AberGain had the highest spring and mid-season DM production, producing 184 and 787 kg DM/ha/year more than the mean of all other varieties, respectively. The most productive year across all varieties for both spring and mid-season growth was 2017 with averages of 1536 (SE = 86) and 8845 (SE = 338) kg DM/ha, respectively. Spring and mid-season DM production reduced to their lowest in 2018, reducing by 827 and 2496 kg DM/ha, respectively, compared to 2017 (data not shown).
Seasonal DM production (kg DM/ha) (LS means with standard errors in parentheses)1,2

1 All DM production totals are subject to rounding in the PastureBase Ireland system, hence seasonal totals may not always sum up exactly to total DM production figures.
2abcde Means within a column with different superscripts differ significantly (P < 0.05).
3 (T) denotes tetraploid varieties, all other varieties are diploid.
Grazing DM production and defoliation events
AberGain had the highest grazing DM production, producing significantly more than all other varieties except AberChoice, Astonenergy and Drumbo (Table 3). Across all varieties, the highest and lowest mean grazing DM production figures of 13 301 and 10 069 kg DM/ha were recorded in 2017 and 2018, respectively (data not shown). The most grazing events were for Astonenergy and AberGain (8.0) which were greater than those achieved by Dunluce (7.2), Glenveagh (7.3) or Tyrella (7.5) (Table 3). The most grazing events (i.e. 8.2) were in 2016, which was 1.3 events more than recorded in 2018, the year with the fewest grazing events (data not shown).
Ground score
The association between GS and variety was influenced by year. This is most clearly illustrated by Glenveagh which recorded the highest GS value of the varieties measured in 2013 and the lowest GS value in 2018 (Fig. 2). Similarly, Majestic showed changes in GS values over the years while the GS of Drumbo was stable across 7 years of the study with a range of 0.4 GS units. Glenveagh had the highest mean GS over the trial period while Astonenergy had the lowest.
Annual ground score of each variety (error bars represent the standard error) and the mean of varieties over 7 years1,2. 1(T) denotes tetraploid varieties, all other varieties are diploid. 2Data missing for AberGain and Majestic as those varieties did not meet the threshold of paddocks sown in 2013.

Variety sward age
Variety age and dry matter production
Variety was also associated with total DM production (P < 0.001) when the model included the interaction between variety and sward age. Swards of Dunluce increased DM production by 1029 kg DM/ha, while the DM production of Astonenergy decreased by 713 kg DM/ha between the first and seventh production years. Total DM production increased for four of the ten varieties as they aged while DM production of all other varieties reduced with age (Fig. 3). Sward age tended to have an association (P = 0.05) with total DM production, swards were most productive in their first full production year – January to December. The total DM production of 4, 5, 6 and 7-year-old swards was similar to that of 1-year-old swards.
Total DM production (kg DM/ha) of each variety (error bars represent the standard error) and mean DM production of all varieties, per sward age1,2. 1(T) denotes tetraploid varieties, all other varieties are diploid. 2Data missing for AberGain, Glenveagh and Majestic as those varieties were not represented by any swards older than 6 years in the current analysis.

Variety age and ground score
Variety (P < 0.05) and age (P < 0.01) were associated with GS. One-year-old swards had the highest average GS of 4.1 (SE = 0.19) while 3-year-old swards had, on average, the lowest GS of 3.6 (SE = 0.21) across all varieties. AberChoice and Drumbo increased GS between ages one and seven while all other varieties decreased in GS in the same period of maturity.
Discussion
The focus of grassland farms is to achieve high performance from the whole farm system by optimizing the interaction between pasture, supplementary feeding and grazing animals (Chapman et al., Reference Chapman, Jacobs, Ward, O'Brien, Kenny, Beca and Mckenzie2006; Shalloo and Hanrahan, Reference Shalloo and Hanrahan2018). Changes will be required in grazing systems to embrace more environmentally sustainable approaches and benchmarks (Herrero et al., Reference Herrero, Havlík, Valin, Notenbaert, Rufino, Thornton, Blümmel, Weiss, Grace and Obersteiner2013; Lüscher et al., Reference Lüscher, Mueller-Harvey, Soussana, Rees and Peyraud2014), necessitated by a range of environmental directives including the EU Nitrates Directive and the EU Farm to Fork strategy (Smith et al., Reference Smith, Powlson, Smith, Falloon and Coleman2000; Velthof et al., Reference Velthof, Lesschen, Webb, Pietrzak, Miatkowski, Pinto, Kros and Oenema2014; EU, 2020). Grazing systems must adopt technologies, including pasture measurement, fertilization and reseeding, within the farm system to achieve a balance between maximizing grass growth and utilization, and continuing to achieve high animal performance. The amount of pasture grown and utilized on-farm is known to be a major limiting factor to increased animal production (O'Donovan et al., Reference O'Donovan, Lewis and O'Kiely2011; Smith et al., Reference Smith, Ludemann, Lewis, Malcolm, Banks, Jacobs, Fennessy and Spangenberg2014).
The current study focussed on identifying new avenues for evaluating the performance of PRG varieties, including establishing long-term (i.e. 7 years) DM production, on commercial grassland farms. Given resource constraints (Gilliland et al., Reference Gilliland, Barrett, Mann, Agnew and Fearon2002), such a long term study is not generally part of established research protocols. Providing grassland farmers with timely feedback regarding the performance of grass varieties on-farm is crucial to improving grassland decision making (Chapman et al., Reference Chapman, Cosgrove, Kuhn-Sherlock, Stevens, Lee and Rossi2019). On-farm variety evaluations also have the potential to stimulate interest in pasture reseeding with superior PRG varieties on farms, via the influence of peer to peer learning (O'Dwyer and Macken-Walsh, Reference O'Dwyer and Macken-Walsh2018), where farmers adopt practices that are known to work on other commercial farms (Mulkerrins et al., Reference Mulkerrins, Gottstein and Lynch2018). The introduction of PastureBase Ireland (Hanrahan et al., Reference Hanrahan, Geoghegan, O'Donovan, Griffith, Ruelle, Wallace and Shalloo2017) and the use of routine grass measurement on farm delivers innovative tools (Garvey et al., Reference Garvey, Ramsbottom and Lynch2018) empowering producers and the wider agricultural industry to embrace results emanating from grassland research. The current work represents a demonstration of what can be achieved when data from PastureBase Ireland are utilized to evaluate grass variety performance.
Grass production
Ultimately, the superior phenotypic varieties are those excelling in DM production in a growing season, particularly during colder periods of the year (i.e. spring and autumn) when growth is naturally limited for PRG (Brereton and McGilloway, Reference Brereton and McGilloway1999). AberGain had consistently higher total and seasonal DM production compared to all other varieties. In a previous 3-year on-farm variety evaluation study, Byrne et al. (Reference Byrne, Gilliland, Mchugh, Delaby, Geoghegan and O'Donovan2017) reported annual changes in differences of DM production between PRG varieties. The current, longer-term analysis indicates that inter-variety differences in total DM production are consistent between years. Given the consistency of the DM production advantage of varieties across years, large differences between the highest and lowest producing varieties become clear. In the current study, the difference between AberGain and Glenveagh was large, equating to almost 10 t DM/ha over a 6-year period. It has been shown in previous research that each tonne of grass DM utilized/ha on a commercial dairy farm in Ireland is worth €173 net profit/ha (Hanrahan et al., Reference Hanrahan, Mchugh, Hennessy, Moran, Kearney, Wallace and Shalloo2018), a figure that can contribute substantially to farm income.
Variety total DM production in the RL simulated grazing trials (DAFM, 2021) was positively correlated (r = 0.56) with total DM production in the current study; such a figure indicates that there is a similarity in the ranking of varieties between the datasets. It is also clear that data generated from commercial farms can provide an alternative perspective on variety performance with some re-ranking of varieties occurring, particularly amongst mid-ranking varieties. Some differences between these datasets can be expected given that the origin of the data sources differs. On-farm variety evaluation provides data on variety performance and persistence under grazing and long-term DM production that are not available under current evaluation protocols. Current plot-based evaluation protocols screen a large number of varieties and have proven an effective tool for the identification of elite PRG varieties in recent decades (Grogan and Gilliland, Reference Grogan and Gilliland2011; McDonagh et al., Reference Mcdonagh, O'Donovan, McEvoy and Gilliland2016). Utilizing data from on-farm variety evaluation in future PPI calculations, to complement the plot-based evaluation data currently used for such calculations, could make a positive contribution towards increasing the accuracy of the index which can enhance farm planning and decision making.
Improved seasonal DM production is cited as one of the major reasons why grassland farmers undertake the expensive process of pasture reseeding (Creighton et al., Reference Creighton, Kennedy, Shalloo, Boland and O'Donovan2011) and has become a leading objective for PRG breeders in recent years (Lee et al., Reference Lee, Matthew, Thom and Chapman2012; O'Donovan et al., Reference O'Donovan, Mchugh, Mcevoy, Grogan and Shalloo2017). From the current research, it is clear that significant exploitable inter-varietal differences exist to enable breeders to make gains in both seasonal and total herbage production. The varieties that had the higher total DM production tended to be more productive throughout the entire growing season. All of the varieties evaluated in the present study had heading dates within ten days of each other, meaning that the influence of heading date on seasonal production between PRG varieties was minimal (Laidlaw, Reference Laidlaw2005). Similar to previous studies on grass ploidy (O'Donovan and Delaby, Reference O'Donovan and Delaby2005; McClearn et al., Reference Mcclearn, Gilliland, Guy, Dineen, Coughlan and Mccarthy2020), no clear DM production advantage for either diploid or tetraploid varieties was detected in the present study. Results from the present study also agree with Byrne et al. (Reference Byrne, Gilliland, Mchugh, Delaby, Geoghegan and O'Donovan2017) who reported changes in differences between varieties for autumn DM production across years. When tested on-farm, paddocks (varieties) can be managed individually whereas herbage from all varieties is removed at the same time in mechanically defoliated plots (Grogan and Gilliland, Reference Grogan and Gilliland2011). This tailored management may have contributed to the fluctuating DM production of individual varieties, relative to each other, in autumn as farmers reacted to the prevailing weather. On-farm measurement may be a closer representation of how varieties perform on commercial farms than the plot evaluation system in isolation.
The current study accounts for the impact of factors such as soil type and geographical location within Ireland via the random effect of a farm within the model used for analysis; previous work has shown that the impact of farm management on herbage DM production is greater than that of farm location in Ireland (O'Donovan and Delaby, Reference O'Donovan and Delaby2016). Future work which includes greater sample sizes for varieties and farm locations may provide more information around the possible interactions of variety and location within Ireland.
Grazing
Under climatically and topographically favourable conditions, the area of European grasslands has been relatively stable during the last four decades (1970–2007; Huyghe et al., Reference Huyghe, Vliegher and Goliński2014). More recently, some European countries have identified grassland as an important source of delivery of ecosystem services such as biodiversity, protection of soils against erosion, sequestering carbon and preserving the value of rural landscapes for wider society (Bernués et al., Reference Bernués, Ruiz, Olaizola, Villalba and Casasús2011; Isselstein and Kayser, Reference Isselstein and Kayser2014). Within Europe, Ireland has a unique focus on grazing (O'Donovan et al., Reference O'Donovan, Hennessy and Creighton2021), which is not the case in other European countries, where grazing is under threat (Schils et al., Reference Schils, Philipsen, Holshof, Zom, Hoving, van Reenen, van der Werf, Galama, Sebek and Klootwijk2018; van den Pol-van Dasselaar et al., Reference van den Pol-van Dasselaar, Hennessy and Isselstein2020). The management of grasslands in a rotational grazing management system can contribute to ruminant feed resources, conservation of biodiversity and carbon sequestration (Conant et al., Reference Conant, Cerri, Osborne and Paustian2017; Enri et al., Reference Enri, Probo, Farruggia, Lanore, Blanchetete and Dumont2017; Klumpp and Fornara, Reference Klumpp and Fornara2018).
The level of DM which is grazed directly by animals, as opposed to being conserved for silage, is a measure of a variety's success on-farm, as grazing is the most efficient method of feeding ruminants and converting grass into milk or meat (Horan and Roche, Reference Horan and Roche2020). Byrne et al. (Reference Byrne, Gilliland, Mchugh, Delaby, Geoghegan and O'Donovan2017) found on-farm grazing DM production to be a reliable indicator of the DM production advantage of individual grass varieties due to a strong correlation between total and grazing DM production of varieties. In recent analyses of PRG grazing traits, it was documented that tetraploid varieties were more suitable to grazing than diploids as they tend to have advantageous nutritive and morphological characteristics, including higher values for dry matter digestibility and increased levels of leaf in the sward, which lead to greater herbage utilisation (Byrne et al., Reference Byrne, Gilliland, Delaby, Cummins and O'donovan2018; Tubritt et al., Reference Tubritt, Delaby, Gilliland and O'Donovan2020a). Variety grazing event differences do not appear to be explained by ploidy differences in the current work. Further on-farm measurements, particularly around post-grazing sward height and sward nutrient content, would provide information which could add to the current knowledge of grazing efficiency.
In agreement with Byrne et al. (Reference Byrne, Gilliland, Mchugh, Delaby, Geoghegan and O'Donovan2017), a recent report of grazing management on grassland farms in Ireland found a clear relationship (R 2 = 0.73) between grazed grass DM produced and the number of grazing events achieved (Maher et al., Reference Maher, O'Donovan, O'Leary, Dillon, Dunphy and Douglas2021). In Ireland, the main selection criteria for grass varieties for commercial pasture reseeding are taken from the PPI, in which there is a major focus on grazing characteristics (McEvoy et al., Reference McEvoy, O'Donovan and Shalloo2011a; Tubritt et al., Reference Tubritt, Delaby, Gilliland and O'Donovan2020b). The relative emphasis on grazing in the current PPI is 0.54 of the total index, consisting of 0.30 for seasonal DM production, 0.20 for grass nutritional quality and 0.04 for grazing utilization (Tubritt, Reference Tubritt2020). The PPI was introduced into Ireland in 2015 and it has influenced grass varieties recommended to date; in future it will be important to quantify improvements in grazing efficiency of varieties on-farm.
Variety persistence
Chapman et al. (Reference Chapman, Muir and Faville2015) found that PRG varieties that produced the most DM in the first 3 years post-sowing also produced the most DM 7–8 years post-sowing. There was a similar trend in the current study where the average sward produced a similar level of DM in years one, five, six and seven. Of varieties with 7-year-old swards in the current analysis, the largest reduction in DM production by any variety represented a loss of just 0.05 (Astonenergy) of its year-one DM production in year seven. The change in DM production across the years varied by variety. It is often assumed that swards reach peak DM production within the first year post sowing (Shalloo et al., Reference Shalloo, Creighton and O'Donovan2011), which is partly due to soil N mineralization during soil tilling (Hopkins et al., Reference Hopkins, Gilbey, Dibb, Bowling and Murray1990). While this is true for the mean DM production of all varieties in the current study, DM production of some varieties increased with age, often beyond the DM production of newly established swards.
The change in GS per variety over years is interesting as, for example, after the drought period, varieties compensated and improved ground cover. Tetraploid varieties are known to form swards of lower density but have larger individual tillers which can compensate in terms of overall DM production (Smith et al., Reference Smith, Simpson, Culvenor, Humphreys, Prud'homme and Oram2001; Byrne et al., Reference Byrne, Gilliland, Delaby, Cummins and O'donovan2018). Previous research has stated that PRG can increase tiller mass when competition for space and light is reduced (Davies and Thomas, Reference Davies and Thomas1983). Tozer et al. (Reference Tozer, Chapman, Bell, Crush, King, Rennie, Wilson, Mapp, Rossi and Aalders2014) stated that tetraploids with lower tiller density may have limited ability to recover from periods of moisture stress. While the current study experienced only one major drought period (2018), the majority of varieties did recover from this period to record acceptable DM production in subsequent seasons with no apparent differences between tetraploid and diploid varieties. The relative difference in GS among varieties as the swards age appears to be small. Generally, as swards age, GS decreases, with just two varieties increasing in GS up to 7 years of age. There has been some debate about which traits to use in order to measure variety persistence over time in plot evaluation systems, with annual GS, GS change and tiller density all providing a level of indication of sward PRG content (Wilkins and Humphreys, Reference Wilkins and Humphreys2003; Lee et al., Reference Lee, Thom, Wynn, Waugh, Rossi and Chapman2017). Ground score change, as currently used in the PPI persistency sub-index assessment, is probably the most appropriate metric to document sward PRG content change over time (O'Donovan et al., Reference O'Donovan, Mchugh, Mcevoy, Grogan and Shalloo2017). In agreement with the current study, the PPI generally indicates little variation in persistence between varieties with the majority expected to maintain consistent DM production for longer than 12 years post sowing. Sward DM production over time, on-farm, is the best metric by which variety DM production persistence can be accurately measured; other metrics of DM production persistency make long term assumptions based on short term data sets with little validation available (McEvoy et al., Reference McEvoy, O'Donovan and Shalloo2011a). The approach used in the current study can deliver in the longer term for the Irish grassland industry.
Conclusion
While total DM production was associated with variety, year and sward age, the lack of interaction between variety and year or between variety and age indicates that varieties that perform well on-farm, relative to other varieties, continue to do so despite the effects of age or annual agronomic changes. These effects require ongoing monitoring and DM production of varieties as they mature beyond 10 years will be of major interest. The current study has shown that there is a mechanism available to evaluate the performance of grass varieties on commercial farms, including over and above a period of 4 years which is often the protocol in plot evaluation systems. The current study provides novel insight to the long term performance of grass varieties on grazing-focussed grassland farms in Ireland and challenges the norms of both classical and component type research to further the grassland industry with new knowledge. Increased integration of the on-farm phenotypic performance of grass varieties within the Irish PRG evaluation index will be important for the continued development of the PPI.
Financial support
The authors would like to thank the Teagasc Walsh Scholarship scheme, VistaMilk (16/RC/3835) and UCD for providing the financial support which facilitated the current study.
Conflict of interest
The authors declare there are no conflicts of interest.
Ethical standards
Not applicable.


 Open access