

1. Introduction
Cattle, as a perishable and bulky livestock, are costly to transport, thus easily leading to segmented regional cattle markets. Under the assumption of a competitive market structure with a homogenous commodity and no trade barriers, price differences between any two regions that trade with each other will just equal transfer costs. This principle is usually referred to as the law of one price (LOP) in a spatial dimension. Geographic price relationships can be analyzed using spatial price equilibrium models (Tomek and Kaiser, Reference Tomek and Kaiser2014). A set of prices can be obtained from the optimum that is determined by the model, given the supply and demand conditions within each region. The LOP has been the basis for numerous tests of market efficiency and market integration (e.g., Barrett and Li, Reference Barrett and Li2002; Goodwin and Schroeder, Reference Goodwin and Schroeder1991; Negassa and Myers, Reference Negassa and Myers2007; Ravallion, Reference Ravallion1986). Markets that are not integrated could reflect inadequate market information, poor marketing decisions, or potential trade barriers. The functioning of cattle markets is important as cattle are typically the highest total-value agricultural commodity produced in the United States, running slightly ahead of corn. Cointegration tests can provide a suitable framework in which to consider long-run price relationships among regional cattle markets, while some argue the relationship between the statistical concept of cointegration and the economic concept of market integration is at best a complex one. For example, if transport costs between regions are nonstationary, cointegration is unlikely even when the regions trade (McNew and Fackler, Reference McNew and Fackler1997). An implicit assumption of the present analysis is that transport and other costs of arbitrage are stationary.
Several researchers have investigated market integration in the U.S. cattle market. Bailey and Brorsen (Reference Bailey and Brorsen1985) investigated the dynamics of weekly slaughter steer prices from January 1978 through June 1983 in four cattle feeding regions using a multivariate autoregressive framework. Cattle prices in the Texas Panhandle market led cattle prices in Utah/eastern Nevada/southern Idaho, Colorado/Kansas, and Omaha/Nebraska, but Omaha prices fed back to Texas. Schroeder and Goodwin (Reference Schroeder and Goodwin1990) examined 11 direct and terminal trade cattle markets from 1976 through 1987. They found cattle markets with larger volumes fully reacted to price changes at the other major cattle markets, usually within 1 or 2 weeks. However, small-volume markets, located on the fringe of major feeding regions, took 2 to 3 weeks to fully respond. The empirical applications by Goodwin and Schroeder (Reference Goodwin and Schroeder1991) suggested that cointegration was somewhat limited, with about half of the tests indicating integrated markets. Schroeder (Reference Schroeder1997) found that the degree of cointegration is affected by distances between cattle markets, procurement methods, and size and ownership of packing plants. Pendell and Schroeder (Reference Pendell and Schroeder2006) found that regional cattle markets have been, and remain, highly integrated after implementation of mandatory price reporting. More recently, Han, Chung, and Surathkal (Reference Han, Chung and Surathkal2017) found the surge of corn ethanol production after the Energy Policy Act led to lower integration among the five major regional cattle markets in the United States using threshold-type models. Our analysis extends the work of earlier studies in evaluating cattle price cointegration by using a smooth transition autoregression (STAR) model. Compared with threshold-type nonlinear models (such as autoregressive and error correction models) that separate the observations clearly into several sets or groups based on the value of the threshold variable with sharp borders or thresholds, which in practice may not always be feasible, a STAR-type model generalizes the threshold model by allowing for continually changing model specification over time and can be adapted to cointegration modeling to study the extent to which spatially distinct markets are efficiently linked over time and how those linkages change over time in response to variation in an outside economic indicator.
Time-varying smooth transition autoregressions (TV-STARs) have been suggested to address nonlinearities induced by unobservable transaction costs. Goodwin, Holt, and Prestemon (Reference Goodwin, Holt and Prestemon2011) found markets with nonlinearities and structural changes, and results also suggest the existence of price parity relationships. Hood and Dorfman (Reference Hood and Dorfman2015) constructed an economic indicator–controlled smooth transition autoregressive (ECON-STAR) model to capture the relationship between housing starts and southern U.S. regional pine sawtimber stumpage prices. This model was new, with the novelty being that an economic indicator was included in the model to control the transitions between unlinked and integrated regional markets. Because Bekkerman, Goodwin, and Piggott (Reference Bekkerman, Goodwin and Piggott2013) show that generalizing beyond simple cointegration models is important for accurate modeling of price dynamics in spatially linked markets, applying an ECON-STAR model to regional U.S. cattle markets seems very appropriate.
In this article, we are interested in whether excess cattle supplies, which are measured by adjusted inventory (see detailed definition in Section 4), encourage efficient trading. The underlying motivation is that the excess inventory of feeder cattle leads to increasing costs (storage cost, forage cost, operation cost, etc.) of feedlots. In addition, risks associated with livestock disease may also increase with herd size. The increasing cost and risk because of excess inventory are direct incentives for sellers to seek more distant buyers even at higher than usual transaction costs. Thus, as the volume of cattle inventories changes, we are curious about the changes in the market linkages of the numerous, regional markets. To develop this topic, we tested whether the level of inventory has an impact on the cointegration of cattle prices in U.S. cattle markets by applying and modifying the work of Hood and Dorfman (Reference Hood and Dorfman2015), which introduced the generalized STAR model with an outside economic indicator. Market integration occurs when price shocks in one location are largely transmitted to different locations. Empirically, a stationary price differential between two markets is the measure of market integration. The ECON-STAR model splits the evolution of price differences in two locations into two parts: an autoregressive process (no market integration) and a mean-reverting process (market integration). The advantage of this model is that it allows for the possibility of gradual adjustments in the relative importance of the two parts, thus testing price linkages and allowing us to see how market dynamics change over time in response to variation in the embedded exogeneous economic indicator.
This article makes three key contributions. First, by using adjusted inventory as the transition variable, the empirical results show how important excess regional supply in the market is for maintaining market integration. The analysis provides economists and policy makers with information regarding one of the potential driving forces of cattle market linkages. Second, although the cattle industry and cattle markets have undergone considerable structural change, there are a limited number of published and updated works testing spatial cattle price cointegration. Our analysis provides a more current assessment of spatial cattle market integration than the literature to date and covers a longer time span of cattle market data from 1950 to 2010. Third, the transition function in the ECON-STAR model is modified to bring more flexibility. We leverage the cumulative distribution function (CDF) of the standard normal distribution in the model, which eliminates the “minimum value” problem in the previous literature. In the original ECON-STAR model, the transition variable was guaranteed to reach zero at least once when the exogenous indicator’s level reached its minimum value, thus making a pair of regions unlink at least once even if they never did in fact. The natural features of the CDF of the standard normal distribution such as positivity, monotonicity, and continuity give the model higher flexibility and a better description of how markets link and unlink over time.
This final contribution is important for expanding the usefulness of the ECON-STAR model. Hood and Dorfman (Reference Hood and Dorfman2015) wanted a model for sawtimber where the vast swings in demand caused by the boom and bust cycles of home building caused markets to link and unlink. However, few products experience such large swings in demand. Rather, particularly in agricultural and natural resource markets, demand tends to be relatively constant while supply shocks are a much more common source of disequilibrium. Thus, the application here, which uses a supply-side variable to control the transition, if successful, would be applicable to a much wider array of commodity markets.
2. Data description
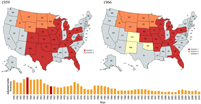
The annual price received for at least 500-pound (greater than or equal to [GE] 500-lb.) feeder cattle and levels of inventories (measured in head) including calves were assembled for 29 states (Arizona, Arkansas, California, Colorado, Florida, Georgia, Idaho, Illinois, Iowa, Kansas, Kentucky, Louisiana, Michigan, Minnesota, Missouri, Montana, Nebraska, New Mexico, North Dakota, Ohio, Oklahoma, Oregon, Pennsylvania, South Dakota, Tennessee, Texas, Virginia, Wisconsin, and Wyoming) over the period from 1950 through 2010, yielding a total of 61 observations per state. Figure 1 shows the data coverage of our study where dark areas indicate that data are not available for that state. The data source is from the National Agricultural Statistics Service (NASS) of U.S. Department of Agriculture (USDA).Footnote 1 According to NASS, the concept used to estimate pricesFootnote 2 received by producers is a price that if multiplied by the total quantity of a commodity sold would give the total amount received by all producers for that commodity. The estimated price should reflect prices received by producers for all classes and grades of the commodity being sold. Specifically, in this study, the estimated annual prices received ($/cwt.) for GE 500-lb. feeder cattle is a volume-weighted average calculated by dividing the total amount ($) received by all producers by the total weight (cwt.) sold in a certain state and in a certain year for GE 500-lb. feeder cattle.
Data coverage map.

The number of slaughtered cattle in the United States was chosen as the indicator for cattle demand because slaughtered cattle constitute more than 90% of the total disappearance of cattle apart from deaths and exports. The data were also collected from USDA-NASS.Footnote 3
There are certain limitations regarding the data as the annual prices received for feeder cattle 500 lb. or greater are highly aggregated. As discussed previously, the heterogeneity over time, space, and cattle classes cannot be accounted for in the aggregated price series. Monthly cattle prices by state for a specific weight range would be more ideal. We use annual data because USDA releases cattle inventories by state only on an annual basis, and all the series applied in the model must have the same frequency. Moreover, the adequate number of annual observations, 61 observations for each state, provides essential variations to explore the dynamics in the market linkage pattern over time. Although cattle prices vary with weight range, which can be affected by factors such as drought conditions, forage prices, and grain feeding prices in different locations, the prices for cattle with an aggregated weight range of 500 lb. or greater are considered acceptable because we compare prices between two contiguous states with assumed similar characteristics. By doing this, the abovementioned factors should be controlled to an acceptable degree.
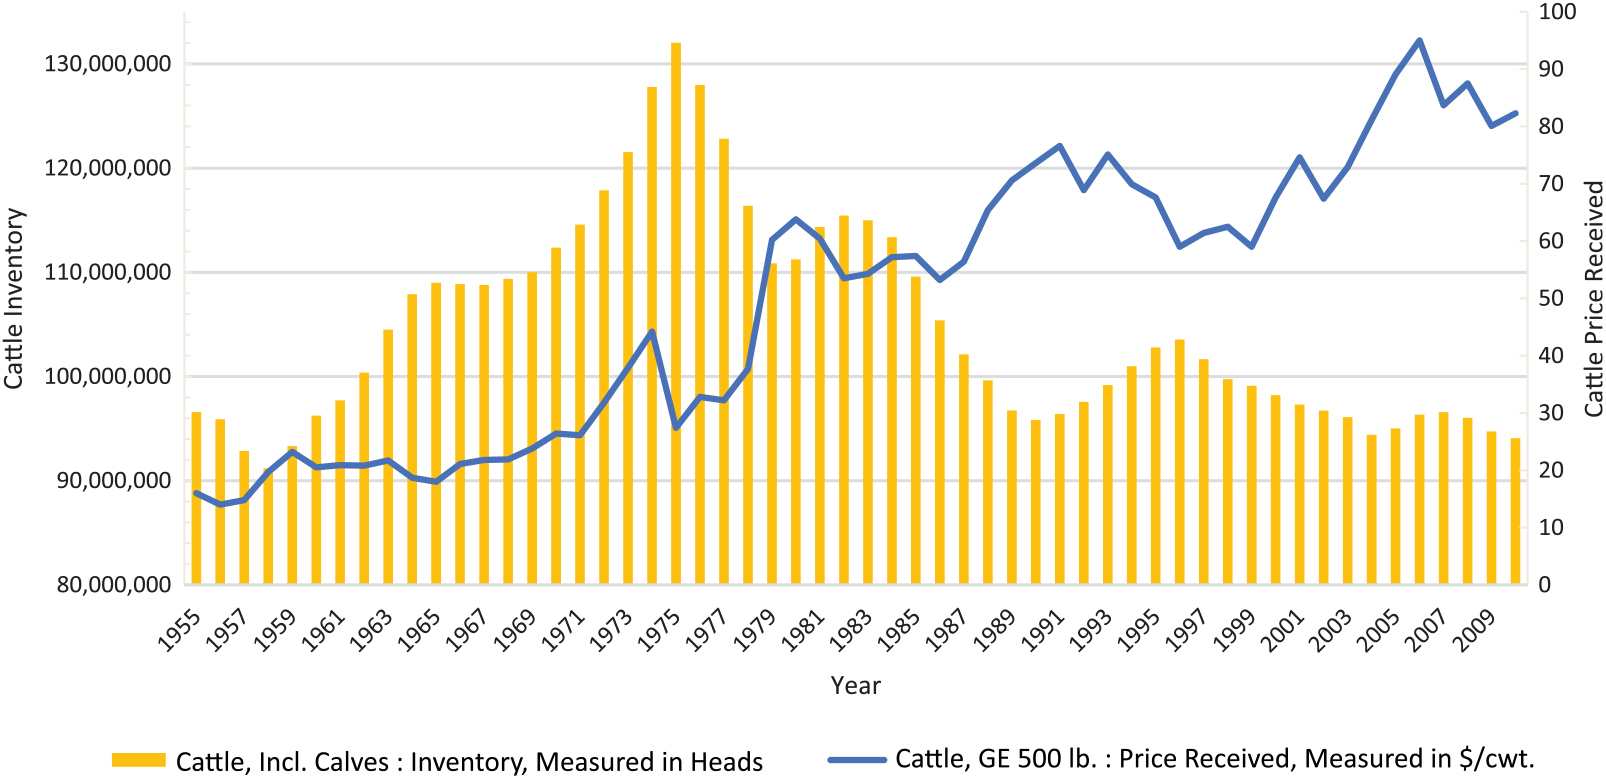
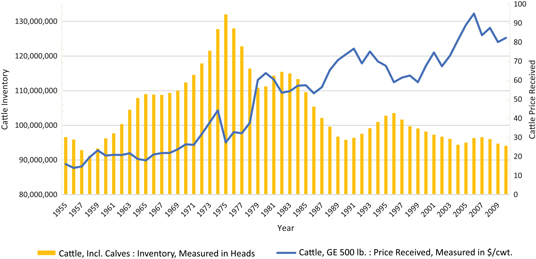
Figure 2 illustrates the U.S. annual prices of cattle more than 500 lb. in $/cwt. and the U.S. annual level of inventories of cattle (including calves) from 1955 to 2010, showing the overall long-term history of the U.S. cattle market. As cattle prices climb over time, the level of cattle inventories expanded steadily beginning in the 1950s, reached its peak in 1975, and underwent a noticeable decline afterward. We want to capitalize on the relationship between the level of cattle inventories, which is used as the economic indicator to study market linkages in this article, and prices of cattle.
Annual cattle prices ($/cwt.) versus cattle inventories, 1950–2010.
We standardized the series of national cattle inventory and national cattle disappearance by subtracting the mean and dividing the difference by the standard deviation to make these two series comparable. Figure 3 shows the standardized annual number of the U.S. slaughtered cattle and the standardized annual level of the U.S. inventories of cattle (including calves) from 1955 to 2010. As an indicator of the demand for live cattle, the number of slaughtered cattle exhibits nearly the same trend as cattle inventories, which can be considered as the supply of live cattle.
Standardized U.S. annual cattle inventories versus standardized U.S. annual cattle disappearance, 1955–2010.

3. Econometric methodology
3.1. The basic model
Let ${y_t} = \ln ({p_{it}}/{p_{jt}})$
for some market i and j. We specify a linear qth-order autoregressive model for the price pair as
${y_t} = \ln ({p_{it}}/{p_{jt}})$
for some market i and j. We specify a linear qth-order autoregressive model for the price pair as
 $${\rm{\Delta }}{y_t} = {\rm{}}{\phi _0} + \phi ^\prime{{\bf{x}}_{\bf{t}}} + \theta {y_{t - 1}} + {\varepsilon _t},$$
where ${\bf{\phi}} = {\left( {{\phi _1}, \ldots ,{\phi _{q - 1}}} \right)^\prime }$
,
${\bf{\phi}} = {\left( {{\phi _1}, \ldots ,{\phi _{q - 1}}} \right)^\prime }$
, ${{\bf{x}}_{\bf{t}}} = \left( {{\rm{\Delta }}{y_{t - 1}}, \ldots ,{\rm{\Delta }}{y_{t - q + 1}}} \right)^\prime$
, and εt is a mean-zero i.i.d. (independent and identically distributed) error term with finite variance. The lag length q will be chosen by using a model selection criterion such as the Akaike information criterion (AIC).
${{\bf{x}}_{\bf{t}}} = \left( {{\rm{\Delta }}{y_{t - 1}}, \ldots ,{\rm{\Delta }}{y_{t - q + 1}}} \right)^\prime$
, and εt is a mean-zero i.i.d. (independent and identically distributed) error term with finite variance. The lag length q will be chosen by using a model selection criterion such as the Akaike information criterion (AIC).
3.2. The smooth transition autoregressive model
In the basic STAR modelling framework used to investigate the LOP, the linear autoregression in the previous equation is typically modified as follows:
 $$\Delta {y_t} = {\tilde \Phi '_1}{{\bf{\tilde x}_t}}\left[ {1 - G\left( {{s_t};\gamma ,c} \right)} \right] + {\tilde \Phi '_2}{{\bf{\tilde x}_t}}G\left( {{s_t};\gamma ,c} \right) + {\varepsilon _t},$$
where ${{\bf\tilde x}_t} = {\left( {1,{x_t},{y_{t - 1}}} \right)^\prime },{\tilde \Phi _1}{\mkern 1mu} {\mkern 1mu} = {\left( {0,{\phi _{11}},0} \right)^\prime },{\tilde \Phi _2}{\mkern 1mu} {\mkern 1mu} = {\left( {{\phi _{20}},{\phi _{21}},{\theta _{22}}} \right)^\prime }$
, and θ 22 <0 is required; c can either be a scalar or a vector; st is the transition variable; and G(st; γ, c) is the transition function that varies smoothly between 0 and 1, in response to changes in st. The parameter γ, which is required to be positive, controls the speed of adjustment and determines how responsive G is to changes in s, and c is the location parameter(s). The values of γ and c determine the properties of transition function. As for the transition variable, st, it can be a function of nearly any observed variable. For example, Kilian and Taylor (Reference Kilian and Taylor2003), in their investigation of the behavior of real exchange rates based on fundamentals of purchasing power parity, suggest using
${{\bf\tilde x}_t} = {\left( {1,{x_t},{y_{t - 1}}} \right)^\prime },{\tilde \Phi _1}{\mkern 1mu} {\mkern 1mu} = {\left( {0,{\phi _{11}},0} \right)^\prime },{\tilde \Phi _2}{\mkern 1mu} {\mkern 1mu} = {\left( {{\phi _{20}},{\phi _{21}},{\theta _{22}}} \right)^\prime }$
, and θ 22 <0 is required; c can either be a scalar or a vector; st is the transition variable; and G(st; γ, c) is the transition function that varies smoothly between 0 and 1, in response to changes in st. The parameter γ, which is required to be positive, controls the speed of adjustment and determines how responsive G is to changes in s, and c is the location parameter(s). The values of γ and c determine the properties of transition function. As for the transition variable, st, it can be a function of nearly any observed variable. For example, Kilian and Taylor (Reference Kilian and Taylor2003), in their investigation of the behavior of real exchange rates based on fundamentals of purchasing power parity, suggest using
 $${s_t} = \left( {{1}\over{D_{\rm max}}} \right)\mathop \sum \limits_{d = 1}^{{D_{{\rm{max}}}}} {y_{t - d}},$$
where D max is a prespecified lag limit. The specification in equation (3) is also consistent with the notion that when the relative prices deviate far enough from some moving average, profit opportunities will occur.
In addition to the specification in equation (3), a number of candidates have been proposed for the transition function G(•) (Goodwin, Holt, and Prestemon, Reference Goodwin, Holt and Prestemon2011). The most commonly used specification of G(•) in market integration analysis is the exponential, or ESTAR, model (see, e.g., Fan and Wei, Reference Fan and Wei2006; Kilian and Taylor, Reference Kilian and Taylor2003; Paya and Peel, Reference Paya and Peel2004; Taylor, Peel, and Sarno, Reference Taylor, Peel and Sarno2001). The ESTAR model expresses the transition function as
 $$G\left( {{s_t};{\rm{}}\gamma ,{\rm{}}c} \right) = 1 - \exp \left[ { - \gamma {{\left( {{s_t} - c} \right)}^2}} \right],$$
where c is the location parameter and γ is the speed-of-adjustment parameter, and γ > 0 is required. This form of transition function is the basis for the ECON-STAR model we will employ. The ECON-STAR model proposed by Hood and Dorfman (Reference Hood and Dorfman2015) uses a transition function given by
 $$G\left( {{s_t};\gamma ,c} \right) = 1 - \exp \left\{ { - {\rm{\gamma }}\left[ {\left( {\frac{{{s_t} - c}}{{{\sigma _s}}}} \right)\left( {\frac{{{v_t} - d}}{{{\sigma _v}}}} \right)} \right]} \right\},$$
where st and vt are transition variables for two neighboring markets, st – c > 0 and vt − c > 0 are required, c and d are the minimum values of st and vt.
The ECON-STAR model we propose here takes the form of equation (2) with a transition function similar to, but slightly modified from, equation (5):
 $$\Delta {y_t} = {\Psi '_1}{{\bf{\tilde x}_t}}\left[ {1 - G\left( {{s_t};\gamma ,c} \right)} \right] + {\Psi '_2}{{\bf{\tilde x}_t}}G\left( {{s_t};\gamma ,c} \right) + {\varepsilon _t},$$
where ${{\bf{\tilde x}_t}} = {\left( {1,{x_t},{y_{t - {\bf{1}}}}} \right)^\prime },\Psi _1^\prime = \left( {0,{\phi _{11}},0} \right),\Psi _2^\prime = \left( {{\phi _{20}},{\phi _{21}},{\theta _{22}}} \right)$
, and where θ 22 < 0 is required. Thus, when the transition function G = 1,
ψ
2
are the controlling coefficients and markets will be integrated. We propose and use a modified transition function to accommodate transition variables that represent the level of cattle inventories, replacing the demand-side variable of Hood and Dorfman (Reference Hood and Dorfman2015) with a supply-side-controlled transition.
${{\bf{\tilde x}_t}} = {\left( {1,{x_t},{y_{t - {\bf{1}}}}} \right)^\prime },\Psi _1^\prime = \left( {0,{\phi _{11}},0} \right),\Psi _2^\prime = \left( {{\phi _{20}},{\phi _{21}},{\theta _{22}}} \right)$
, and where θ 22 < 0 is required. Thus, when the transition function G = 1,
ψ
2
are the controlling coefficients and markets will be integrated. We propose and use a modified transition function to accommodate transition variables that represent the level of cattle inventories, replacing the demand-side variable of Hood and Dorfman (Reference Hood and Dorfman2015) with a supply-side-controlled transition.
In our model, we use the adjusted level of cattle inventory defined as the annual level of cattle inventories over the corresponding annual level of the disappearance of cattle, which is treated as the indicator of demand for live cattle. This variable thus measures supply relative to demand in each of the observed time periods and can be regarded as an indicator for the degree of excess supply. Define the transition variable st as
 $${s_{it}} = \frac{{{I_{it}}}}{{{D_t}}}, \quad \quad {s_{jt}} = \frac{{{I_{jt}}}}{{{D_t}}}$$
Here, Iit and Ijt denote the total cattle (including calves) inventories in state i and state j, respectively, at time t, and Dt is the number of slaughtered cattle in the United StatesFootnote 4 (annual disappearance). The resulting transition function is given by:
 $$G\left( {{s_{it}},{s_{jt}};\gamma ,} \right ) = 1 - \exp \left[ { - \gamma {\rm{*}}\Phi \left( {{{{s_{it}} - {\mu _i}} \over {{\sigma _i}}}} \right)\Phi \left( {{{{s_{jt}} - {\mu _j}} \over {{\sigma _j}}}} \right)} \right].$$
In equation (8), μi and μj are the mean values of the respective transition variables, sit and sjt; st − μ is normalized by σ to make the speed-of-adjustment parameter, γ unit free; and ϕ(·) is the cumulative density function of the standard normal distribution. Compared with the linear term ${{{s_t} - c}}\over{{{\sigma _s}}}$
(and
${{{s_t} - c}}\over{{{\sigma _s}}}$
(and ${{{v_t} - d}}\over{{{\sigma _v}}}$
) in equation (5), embedding them in the CDF of a standard normal gives nice properties for our purposes: it has flatter tails when the value of st goes to extremes, has almost linear movement when value of st is within two standard deviations about zero, and satisfies the positivity requirement that keeps the transition function bounded between 0 and 1. Moreover, this specification is robust to outliers of st. This property gives the model higher flexibility and a better ability to track how markets link and unlink over time. In the original ECON-STAR model of Hood and Dorfman (Reference Hood and Dorfman2015), the transition variable must go to zero at least once when its value reaches the minimum value, thus making a pair of states unlink at least once. However, by inserting the transition variable into a CDF, this problem is avoided because a CDF always returns a positive value.
${{{v_t} - d}}\over{{{\sigma _v}}}$
) in equation (5), embedding them in the CDF of a standard normal gives nice properties for our purposes: it has flatter tails when the value of st goes to extremes, has almost linear movement when value of st is within two standard deviations about zero, and satisfies the positivity requirement that keeps the transition function bounded between 0 and 1. Moreover, this specification is robust to outliers of st. This property gives the model higher flexibility and a better ability to track how markets link and unlink over time. In the original ECON-STAR model of Hood and Dorfman (Reference Hood and Dorfman2015), the transition variable must go to zero at least once when its value reaches the minimum value, thus making a pair of states unlink at least once. However, by inserting the transition variable into a CDF, this problem is avoided because a CDF always returns a positive value.
The natural economic interpretation of the transition function is the same as in other variants of STAR models applied to market integration testing: values equal to 1 indicate linked markets, and values equal to 0 indicate unlinked markets. Interpretation of values between the two extremes is more subjective, especially for intermediate values within this range. However, although interpretation of intermediate values is somewhat subjective, one could think of STAR models as switching regime models with infinite states. The transition function, G(st; γ, c), is strictly increasing with st, the ratio of state-level supply to national-level disappearance, which indicates the degree of local excess supply. Therefore, 1 − G(st; γ, c) is strictly decreasing with st. We assign 1 − G(st; γ, c) to the “unlinked” component, ${\bf{\Psi }}_{\bf{1}}^\prime {{\bf{\tilde x}_t}}$
, where the parameters are restricted to
${\bf{\Psi }}_{\bf{1}}^\prime {{\bf{\tilde x}_t}}$
, where the parameters are restricted to ${\bf{\Psi }}_{\bf1}^\prime = \left( {0,{\phi _{11}},0} \right)$
, because when the supply cannot meet a higher demand in general, it is more likely cattle are traded within rather than between regions. Thus, prices at different regions would be less likely to be cointegrated. On the other hand, cattle are more actively traded between regions when excess supply exists. Therefore, G(st; γ, c) is assigned to the “linked” component. The model is able to describe the reality that there is always trade between regions because G(st; γ, c) never reaches zero, but whether prices in different regions are cointegrated depends on the trading volume.
${\bf{\Psi }}_{\bf1}^\prime = \left( {0,{\phi _{11}},0} \right)$
, because when the supply cannot meet a higher demand in general, it is more likely cattle are traded within rather than between regions. Thus, prices at different regions would be less likely to be cointegrated. On the other hand, cattle are more actively traded between regions when excess supply exists. Therefore, G(st; γ, c) is assigned to the “linked” component. The model is able to describe the reality that there is always trade between regions because G(st; γ, c) never reaches zero, but whether prices in different regions are cointegrated depends on the trading volume.
Finally, it is important to note that although a STAR model explicitly accounts for structural change in terms of market linkages, it does not account for all possible types of structural change. Thus, like all models, further generalization would be possible.
4. Estimation and results
4.1. Final model results
We evaluated 55 state pairs using the model described previously. Price pairs were selected to include all states that are contiguous to each other. The sample size is large enough to draw inference about market linkages among all regions evaluated. Results indicate that strong growth in the level of cattle inventory can cause numerous states to link together and function as one unified market.
The lag length was set to p = 3 for all models based on both the AIC and Bayesian information criterion. The speed-of-adjustment parameter, γ, which enters the equation nonlinearly, is estimated to maximize the predictive strength of the final model. To estimate this parameter, we scanned over a range of γ values. For each fixed value of γ, the remaining parameters were estimated by maximum likelihood. The γ value that resulted in the highest likelihood function value was chosen as the estimate. This is equivalent to joint maximum likelihood of all the parameters.Footnote 5
A maximum and minimum value constraint is imposed to restrict the speed-of adjustment parameter from going to zero or ∞. The minimum value of γ is set to 0.05, and the maximum value is set to 300. The smaller the parameter value, the slower the two regional cattle markets link and unlink, and the larger the parameter value, the quicker the two regions adjust between linked and unlinked.
4.2. Market linkages
We highlight four time periods (Figures 4 and 5) to show how cattle market linkages changed throughout the sample period: 1959, 1966, 1986, and 2005.Footnote 6 We used G(st) ≥ 0.9 as the value required to signify market linkage, which sets the bar fairly high. Results indicate that in 1959, when the adjusted level of inventories reached a historic high, there are two distinct markets: (1) MT, ID, WY, ND, SD, and MN; and (2) CO, NM, NE, KS, OK, TX, IA, MO, AR, WI, IL, MI, OH, KY, TN, GA, FL, PA, and VA. In 1966, three regional markets are observed: (1) MT, ID, WY, ND, SD, and MN; (2) NE, KS, TX, IA, MO, AR, WI, IL, MI, OH, KY, TN, GA, FL, and PA; and (3) CO, NM, and OK. With the decrease in available supply, we notice that Colorado, New Mexico and Oklahoma have separated from their earlier, larger regional market. As Figure 4 shows, the size of the big central market is smaller in 1966 compared with the pattern in 1959, and a new regional market has emerged.
Regional linkage in 1959 and 1966.

Regional linkage in 1986 and 2005.

As the adjusted level of inventory dropped significantly in the 1980s, the cattle market became even more geographically segmented. In 1986, there are five distinct markets: (1) MT, ND, and MN; (2) NE, KS, TX, IA, MO, WI, IL, MI, OH, KY, and PA; (3) ID and WY; (4) NM, OK, TX, AR, TN, and VA; and (5) GA and FL. Compared with the linkage pattern of 1959, Colorado and South Dakota have become isolated markets unlinked with any state. Moreover, Arkansas and Tennessee have separated from their previous market and formed a new distinct market with Virginia, New Mexico, Oklahoma, and Texas, while Georgia and Florida unlinked from other markets and formed a small regional market by themselves. For the entire time highlighted, 1986 marks the period of maximum market fragmentation.
More recently, in 2005 when the adjusted level of inventory reached its peak for the decade of the 2000s, there are two distinct regional markets: (1) MT, ID, WY, ND, SD, and MN; and (2) CO, NM, NE, KS, OK, TX, IA, MO, AR, WI, IL, MI, OH, KY, TN, PA, and VA. That is, the more northern and southern midwestern previously separate markets linked into one superregional market together with Colorado, while the northwestern regional markets reunited as one regional market. However, Georgia and Florida were no longer linked with any state.
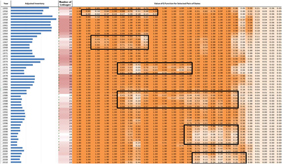
Figure 6 presents a visualized table for the value of transition variables. This table is composed of three parts from left to right: a bar chart of adjusted national cattle inventory, the number of linkages in each year, and values of the transition function for selected price pairs. Given the difficulty to read small-sized values in cells, we use scaled color for the numbers of market linkages and for the values of the transition function. The larger the value, the darker the color is. We find that lower values of the transition function G, which means markets are not linked, always coincide with a low level of cattle inventory. The highlighted areas are the most obvious to observe this correlation.
Color-scaled values of the transition function.

4.3. Transition function results
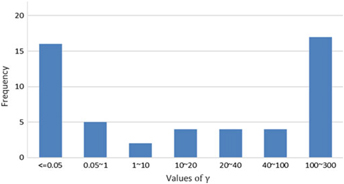
For the speed-of-adjustment parameter γ, which ranges from 0.05 to 300, the lower the value of γ, the more slowly the transition function adjusts between linked and unlinked. Transition function values are bounded between 0 (unlinked) and 1 (linked). Figure 7 shows selected results for G(sit,sjt; γ, μ). For γ < 5, the transition function adjusts slowly and generally leads to G staying below 0.9, which indicates the state markets are unlinked. For 5 ≤ γ < 20, the transition function adjusts at a moderate rate between 0 and 1, with the integration pattern between two states swinging between linked and unlinked. For γ ≥ 20, the transition function adjusts more quickly, and there are extended periods of time in which the two markets are completely linked. The distribution of these estimated parameters is heavily weighted at the two tails; the integration between states tends to transition either slowly or fast, but moderate speed adjustments are only infrequently observed (Figure 8).
G(sit, sjt; γ, μ) function graphs of select price pairs.

Histogram of γ values for all price pairs.

5. Conclusions
This research employed a more flexible transition function that uses a supply-side measure of market activity to help us better understand linkages between regional cattle markets in the United States. By using cattle inventories divided by annual disappearance as the variable that controls the transitions from integrated to separated markets, we show that excess supply can cause numerous regions and states to link together and function as a single, unified market. Plausibly, when supplies are more available, sellers in the market are more motivated to seek profits to avoid consequent operational costs and risks associated with increasing herd size, thus leading to increased trade among multiple markets. We find that in the 1950s—the peak of cattle inventory relative to disappearance in U.S. history—apart from two small regional markets, the entire southwestern, midwestern, and southern markets are linked into a single geographically enormous market. In contrast, in the mid-1980s, with inventories at their lowest levels, the cattle market became quite segmented, leaving most states as members of one of five regional cattle markets, while some of the states exhibited no integrating relationships. After 2003, relative cattle supply rebounded a little, which led numerous states to link together and function as one unified market again. The empirical results show how important sufficient supply and profit-seeking behavior are to ensure spatially separated markets are linked.
Apart from the low level of inventory, an alternative reason for the recently more segmented cattle market is the increased heterogeneity of beef quality. The empirical results of Lusk and Norwood (Reference Lusk and Norwood2005) indicate that supply and demand shifts have the potential to alter the average quality of beef on the market. When the assumption of homogeneous products is violated, we should see more segmented markets. For this reason, when two states are not linked, it does not imply no trade of cattle is taking place between these two states. The markets may be unlinked because the states are producing and trading quality-differentiated cattle so that markets are not integrated because there are two (or more) different products in the marketplace, rather than a single, homogenous one. Finally, if prices in unlinked regions follow similar trends, perhaps because of shared, supraregional driving economic forces, cointegration tests could give misleading results that suggest markets are linked (McNew and Fackler, Reference McNew and Fackler1997).
This article makes a key contribution to understanding the degree of spatial market integration in U.S. cattle markets by introducing a supply-side indicator into a time-varying model of regional market integration and by mapping when different regional markets have been linked economically. Moreover, the article contributes to the theoretical literature by modifying an ECON-STAR model so the transition functions better deal with economic indicators at or near their minimum values. Further, our research demonstrated that the ECON-STAR model can be successfully extended to transitions controlled by supply-side variables, which makes the model applicable to many more commodity markets.
Acknowledgments
The authors thank anonymous reviewers and editor Michael Reed for helpful comments.
Financial support
This research received no specific grant from any funding agency, commercial, or not-for-profit sectors.
Conflicts of interest
The authors have no conflicts of interest to declare.


 Open access