


1. Key Definitions and Interpretations
This paper will rely on the definitions as outlined below, with certain other terms being clarified as they occur where appropriate. Technical machine learning (ML) concepts and definitions are not widely used in this paper, with an actuarial and business perspective being favoured.
1.1. Artificial Intelligence (AI)
This paper relies mostly on the Organisation for Economic Co-operation and Development (OECD) (2019) definition of Artificial Intelligence (AI):
“‘Artificial intelligence system’ (AI system) means a machine-based system that is designed to operate with varying levels of autonomy and that can, for explicit or implicit objectives, generate output such as predictions, recommendations, or decisions influencing physical or virtual environments”.
We focus our discussion on the statistical learning, ML, deep learning, and, at a high level, large language models (LLMs) as defined below.
Statistical learning: statistical learning involves using statistical methods (including Bayesian and optimisation methods) to perform ML. It typically covers regression tasks rather than the more comprehensive field of ML, which may include areas like computer vision (cf. Hastie et al., Reference Hastie, Tibshirani and Friedman2017). Whilst statistical learning also encompasses linear models (e.g. Generalised Linear Model (GLMs)) under this definition, they could potentially be placed in a lower-risk class based on their transparency, and many of the traditional risk management strategies can be applied.
ML: this paper takes ML to refer to the process of passing data through an algorithm that seeks to minimise the difference between its output and a target in order to learn (also referred to as supervised learning). The algorithm in question typically has a randomised form initially, but as it sees more and more data, the training algorithm learns parameters which enable the model to perform increasingly better. ML also includes unsupervised learning, where an algorithm seeks to cluster the data, and reinforcement learning, where an algorithm seeks to optimise a specific future goal over time based on user environment feedback. Algorithms such as support vector machines, decision trees, ensemble models like random forests, and boosting algorithms like gradient boosting machines are included but not limited under this definition of ML (see also Brown, Reference Brown2021).
Deep learning: deep learning refers to training neural networks with at least two hidden layers to produce outputs based on training data. Deep learning is a subset of ML in our context (LeCun et al., Reference LeCun, Bengio and Hinton2015).
LLMsFootnote 1 : LLMs are a class of AI models trained on large amounts of text data to “learn” a topic and its language structure to mimic human text. They are usually transformer models comprising billions of parameters, making them a black box, and are often built on an existing, foundational model (Goyal et al., Reference Goyal, Vasrshney and Rozsa2023). They are a class of generative models, meaning they can produce an entirely new output based on input. They have been successfully used to develop sophisticated chatbots, such as OpenAI’s ChatGPT and Google’s Bard (Bowman, Reference Bowman2023).
Similar to the OECD definition and our interpretation above, the European Union’s AI Act (European Council, 2021) offers more specificity in their definition of AI that lists specific approaches included under AI. The Institute and Faculty of Actuaries (IFoA) has taken a broad approach to defining AI, with the IFoA (2023a) defining AI as “an umbrella term for a range of technologies and approaches that includes the use of data science and machine learning models to solve complex tasks”.
The Financial Reporting Council (FRC) (2023b) also takes a broad definition of AI but offers more specificity than the IFoA definition:
“Techniques that allow computers to learn from data without being explicitly programmed or reprogrammed. It involves algorithms that can adapt and improve over time, learning from experiences (in the form of data inputs) to predict outcomes or make decisions. AI/ML algorithms identify patterns and relationships within data, which can then be used to predict future data or inform decision making processes”.
Note that the AI landscape is continually changing, and what is considered AI may evolve.
1.2. Other Definitions and Interpretations
Discrimination: In this paper, discrimination is defined as the unfair or prejudiced treatment of persons belonging to a specific group, particularly concerning protected personal characteristics, for example, race and gender (see section 1.1 for further discussion) (Equality Act, 2010).
Big data: This paper considers big data to be growing amounts of voluminous, diverse sets of data, encompassing the volume of information, the scope of the data being collected, and the speed at which it is collected or created (Thouvenin et al., Reference Thouvenin, Suter, George and Weber2019; Segal, Reference Segal2022).
Regulation: We note that UK’s approach to AI regulation is pro-innovation and principles-based, with additional industry-specific regulations being under development. Additionally, there are efforts underway to develop global AI standards, for example, through the Digital Regulation Cooperation Forum (DRCF) (see DRCF, 2022) and the International Organisation for Standardisation (see Levene, Reference Levene2023).
This paper is also shared with regulatory and industry bodies for discussion, and comments from initial discussions with the Centre for Data Ethics and Innovation (CDEI), FRC, and the Prudential Regulation Authority (PRA) in the UK have been considered.
2. Introduction
The current AI landscape is changing at a rapid pace, as shown by the recent boom in AI releases for public use (e.g. self-driving e-hailing services, ChatGPT, and Microsoft Copilot) and as seen in the application of actuarial work (Richman, Reference Richman2018; Kessler, Reference Kessler2020; Cheung et al., Reference Cheung, Kang and Goldfarb2022; Shaw, Reference Shaw2023; see also Chamberlain & Vander Linden (Reference Chamberlain and Vander Linden2023) for potential future use cases).
During the technology boom and the age of social media, there has been a growing concern regarding data usage and protection, with recent regulation (e.g. the EU General Data Protection Regulation (GDPR)) aiming to address the issue, and recent news coverage is increasing public awareness regarding AI, for example, “‘Godfather of AI’ Issues New Warning Over Potential Risks to Society” (AFP, 2023), with the IFoA releasing a risk alert on the use of AI by actuaries in September 2023 (IFoA, 2023a) and a data science thematic review (IFoA, 2023a). Additionally, the rapid release of various AI tools has made more consumers aware of AI and its potential uses. However, due to the rapid boom of AI, regulation is still, in some respects, playing catch-up. The UK government has taken a principles-based pro-innovation approach to AI regulation (Department for Science, Innovation and Technology, 2023),Footnote 2 and they are embracing initiatives such as the AI safety summit to help promote the responsible adoption of AI. Footnote 3
Regulators and professional bodies are still in the process of developing and releasing regulation and guidance per industry (see also Roberts et al. (Reference Roberts, Ziosi, Osborne, Saouma, Belias, Buchser, Casovan, Kerry, Meltzer, Mohit, Ouimette, Renda, Stix, Teather, Woolhouse and Zeng2023) for a comparative framework of regulatory AI policy). Currently, there appears to be minimal specific regulation on how to appropriately apply AI safely in an actuarial context. However, the UK’s Science, Innovation, and Technology Committee (2023a) has also released an interim reportFootnote 4 on the governance of AI which may help guide the development of regulation.
In the context of these trends, we explore some of the risks related to AI from an actuarial perspective based on research from a transregional industry focus group. The group considered potential issues and challenges of using AI, primarily as it relates to the use of AI for modelling and analytics, in the context of the following themesFootnote 5 :
-
Bias, fairness, and discrimination
-
Individualisation of risk assessment
-
Public interest
-
Interpretability and explainability
-
Transparency, reproducibility, and replicability
-
Validation and governance
-
Lack of relevant skills
Even though the majority of these themes are familiar to actuaries, the use of AI in the context of actuarial work and increased societal awareness of AI is increasing the complexity and magnitude of these themes. The focus is on the ethical and professional challenges regarding the development and use of AI within an actuarial context, but given the rapid development and topical nature of AI in general, certain wider uses and types of AI have been included to a smaller extent.
Whilst some regulation and actuarial guidance on dealing with these topics exist, it can be difficult to consolidate the guidance available and even more challenging to implement it practically in the context of AI. In some cases, there may also be different interpretations depending on the jurisdiction or industry the actuary is working in.
As such, this paper, based on the group’s research, identifies the critical issues faced within actuarial work, evidence example problematic elements of each theme within the context of AI, and presents references to specific regulations, guidance, best practices, and example practical recommendations on how to navigate the use of AI as actuaries. We include example considerations for the appropriate use of AI within traditional and, in some cases, non-traditional actuarial fields.
However, we recognise that further regulation and guidance are required, given the pace of change and the complexity of some of the issues we raise. With the current rate of change, it may be challenging for guidelines and regulation to keep up with technological advancements and new techniques, which could necessitate dynamic guidelines. We acknowledge that there may be regulation or guidance currently in development or in existence that might not be included here that could potentially address some of the challenges outlined here.
Our research aimed to focus on key themes and findings observed by group members during our research (February–June 2023, with additional high-level LLM-focussed research in November and December 2023 as per Appendix B) and is not intended to form an exhaustive list. We recognise that new developments and regulations may also need to be considered. The paper incorporates transregional themes, but in the context of regulation and professional standards, the focus centres mainly around UK (and in some cases European) regulation. Other themes or regulations may be relevant, dependent on the jurisdiction of concern. The examples shown should be viewed as indicative and are not exhaustive.
2.1. Modelling
Utilising synthetic driver telematics data from So et al. (Reference So, Boucher and Valdez2021), we consider and analyse a motor insurance problem using ML which are further discussed in the following sections of the paper:
-
Section 3.1: Proxy discrimination, for example, by identifying whether a subset of features can indirectly be a proxy for a protected feature.
-
Section 3.1: Fairness, for example, by using the fairlearn library (Bird et al., Reference Bird, Dudik, Horn, Lutz, Milan, Sameki, Wallach and Walker2020) to assess the fairness of model predictions.
-
Section 3.2: Individualisation of risk premiums, for example, by evaluating risk premiums across various levels of aggregation.
-
Section 4.1: Explainability techniques, for example, by demonstrating global and local explainability metrics and demonstrating how the output could be explained.
The examples and results are discussed at a high level in relevant sections. A detailed breakdown of the modelling is available on request at info@actuartech.com.
Note that these examples are for illustrative purposes only and the results should not be construed as insurance advice and should not be used for decision-making purposes.
3. Ethical Themes
3.1. Bias, Fairness, and Discrimination
In this paper, we consider the broader notion of bias which is partiality that may result in unethical discrimination against customers with specific protected characteristics, especially when pricing insurance products.
An example of bias includes racial bias, where a system (either the design, input, interpretation, outcomes, etc.) is inherently skewed along racial lines (Casualty Actuarial Society (CAS), 2021a, 2021b; see Fannin (Reference Fannin2022) for a discussion on race in insurance). Introducing fairness criteria and their validation has been seen as a mitigating step, but this requires defining fairness and quantifying discrimination. This also includes identifying where discrimination materialises within the pricing context: data, modelling, interpretation, application, or a combination of aspects.
Discrimination can be considered direct or indirect, with the former being the use of a prohibited characteristic as a rating factor. The latter, in the case of insurance, can be seen as the conflux of (i) the implicit ability to infer protected characteristics from other (legitimately used) policyholder features, that is, proxy discrimination and (ii) a systematic disadvantage resulting in a group that is protected by a non-discrimination provision (Tobler, Reference Tobler2008).
Although insurance practices have not drastically changed and most biases are not new, evolving social contexts and advanced modelling techniques have impacted the conception and execution of insurance fairness and require practitioners to keep up with what is socially, ethically, and legally acceptable. What is perceived as insurance fairness is therefore a dynamic concept dependent on cultural, historical, technical, and technological contexts.
Additionally, the Bank of England (2022) and the UK’s Equality and Human Rights Commission (EHRC) (2023) have raised concerns regarding discriminatory decisions associated with the use of AI, particularly within the context of consumer protection (see Regulation later in this section). The EHRC (2023) notes that government should ensure that regulators are able to address equality adequately within new policies regarding AI.
3.1.1. What empirical evidence is there that this may be an issue?
In addition to those listed above, there have been traditional actuarial examples (see Lindholm et al., Reference Lindholm, Richman, Tsanakas and Wüthrich2022a) where the correlation between smoking and gender was intentionally exploited in the pricing of a health insurance product. The direct discrimination could be reduced through, for example, the removal of sensitive attributes from data. However, residual effects from variables that may have been removed are still cause for concern, such as smoking status. ML models may pick up on proxy features and effectively recreate a feature from other provided features, resulting in proxy discrimination, for example, when certain features such as height are used as a proxy for gender, that could result in unfair discrimination and cause a disparate impact (see Prince & Schwarcz (Reference Prince and Schwarcz2020) for a discussion on proxy discrimination in the age of AI and big data).
Another example of discrimination includes using postcodes as a proxy for ethnicity (CAS, 2021a, 2021b; Lindholm et al., Reference Lindholm, Richman, Tsanakas and Wüthrich2022a, Reference Lindholm, Richman, Tsanakas and Wüthrich2022b; Rakow & Mitchell, Reference Rakow and Mitchell2022; see also Citizens Advice’s (2023) report on discriminatory pricing and the so-called ethnicity penalty). The problem is magnified in advanced ML and AI techniques such as deep neural networks, which might have hundreds of inputs and thousands or even millions of model weights (parameters), which could cause unintentional proxy discrimination.
Whilst there could be a technically sound way of dealing with the issue of bias and discrimination through Discrimination-free Insurance Pricing (Lindholm et al., Reference Lindholm, Richman, Tsanakas and Wüthrich2022a; cf. Lindholm et al., Reference Lindholm, Richman, Tsanakas and Wüthrich2023), the challenge of appropriately defining what is fair or unfair remains.
Furthermore, some actuarial and insurance bodies abroad have released reports and guidance on the challenges related to bias and fairness for AI in insurance, for example, the report on AI and big data in Canada (Insurance Institute, 2021), and the Australian guidance on issues in AI, which notes the need to tackle bias and fairness (Actuaries Institute and Australian Human Rights Commission, 2022).
3.1.1.1. Modelled example 1
To test the notion of proxy discrimination, we trained an XGBoost model, a popular implementation of a gradient boosting model, whereby classification or regression decision tree models (Breiman et al., Reference Breiman, Friedman, Olshen and Stone1984) are iteratively trained to improve on the performance of its predecessor (Chen & Guestrin, Reference Chen and Guestrin2016), in the context of motor insurance, to try to classify gender based on traditional policyholder characteristics (e.g. age, marital status, car use, credit score, years without a claim) and telematics data (brake intensity, acceleration, turn intensity, times the vehicle is driven).
Hypothesis: if we can train an accurate classifier for the protected feature, it may imply that other features are acting as proxies for the protected feature. However, to determine if proxies exist and to mitigate the effects of proxies, or ensure fairness towards a protected class, the protected feature is still required in order to test where the proxy in respect of a particular feature exists (Lindholm et al., Reference Lindholm, Richman, Tsanakas and Wüthrich2022b).Footnote 6
After training our model, we use the permutation feature importance technique to determine which features are more likely to predict a policyholder’s gender (see Figure 1). Permutation feature importance is a model-agnostic measure of the relative importance of features in a model that is comparable across different families of models (Breiman, Reference Breiman2001; Fisher et al., Reference Fisher, Rudin and Dominici2018).
Permutation feature importance of driver characteristics when predicting gender (higher values indicate greater predictive power).

For reference, in this example, on unseen data, the model achieves an area under curve (AUC) of 92%, which can be interpreted as a measure of excellent accuracy of the model prediction. The above results indicate that certain driving habits may be linked to gender (marital status, age of insured, claim-free years, credit score, brake intensity, actual mileage for the year, time spent in PM rush hour, percentage of time spent driving throughout the year, time spent in AM rush hour, and the average number of days spent driving per week). More traditional insurance characteristics like marital status, age, credit score, and years without a claim also serve as potential proxies.
As with traditional approaches, results may also be linked to sample bias, which is not investigated further here.
We constructed partial dependence plots (PDPs) (Friedman, Reference Friedman2001) to observe the interaction between the most important identified features and gender classification. A PDP aims to find a particular feature’s average marginal effect on predictions. The individual marginal effect is commonly referred to as individual conditional expectation (ICE) (Goldstein et al., Reference Goldstein, Kapelner, Bleich and Pitkin2015).
In Figure 2, a higher predicted probability indicates the feature is a stronger predictor for females as an indicator of one implies a gender of female, based on our modelling. This tells us that lower claim-free years (<30) could be indicative of the female gender, whereas more claim-free years are more indicative of males, in this example. Note however that sparse data points at larger claim-free years may be a contributing factor to this as a proxy.
PDP of claim-free years.

When considering the most important telematics feature, we note from Figure 3 that brake intensity could be linked to gender, where more intense braking may suggest a female, thereby acting as a proxy for gender. In summary, this indicates that, with a protected feature excluded from the model, a ML model may still have sufficient information in the form of proxies to inadvertently characterise policyholders based on protected features.
PDP with 75 ICE samples showing brake intensity over a 6-mile period, as a percentile (0% indicates the lowest percentile and 100% indicates the highest percentile of brake intensity).

3.1.1.2. Modelled example 2
We will demonstrate fairness in a technical sense by comparing outcomes across protected classes. To do this, we start with a fairness-unaware (i.e. trained to maximise accuracy without any allowance fairness measures – “typical” modelling) Gradient Boosted Machine, using Microsoft’s open source LightGBM (Ke et al., Reference Ke, Meng, Finley, Wang, Chen, Ma, Ye and Liu2017) implementation, which aims to predict whether a claim occurs. We aim to achieve equalised odds, that is, equal true and false predictions within an accuracy threshold, and see whether it performs equally well across classes, particularly those related to protected features (Hardt et al., Reference Hardt, Price and Srebro2016). We apply two mitigation techniques to improve fairness,Footnote 7 namely, threshold optimisation and grid search.Footnote 8 Note that we deliberately exclude a policyholder’s gender as a factor in our model. Also note that the reason we can adjust how our model is trained to avoid additional discrimination is because it can broadly be viewed as a calibration issue, that is, our model needs to be recalibrated, or calibrated in a certain way, to produce a desired outcome. This however means providing it with some knowledge of protected classes to learn to avoid discriminating between members of the class.
First, we analyse the false positive and false negative rates on the fairness-unaware model.
Table 1 above suggests the fairness-unaware model produces a higher false negative rate for males than females on the testing set (meaning the model is more likely to misclassify a male as having claimed than a female when exposed to unseen data). It also produces a higher false positive rate for females than males (implying the model tends to misclassify females as having not claimed more than males).
Model Performance for the Fairness-Unaware Model

Since predicting claim occurrence (true negatives) contribute to the policyholder’s risk premium, false negatives could adversely impact their risk premium if they are unfairly attributed as likely to claim. From the perspective of treating policyholders fairly, we aim to minimise disparity in false negatives across protected classes. It should be noted that, in this example, random chance and noise may contribute to the reported equalised odds.
Further, using the fairlearn libraryFootnote 9 (Bird et al., Reference Bird, Dudik, Horn, Lutz, Milan, Sameki, Wallach and Walker2020), we apply post-processing based on the threshold optimisation approach (Hardt et al., Reference Hardt, Price and Srebro2016). This algorithm finds a suitable threshold for the scores (class probabilities) produced by the fairness-unaware model by optimising the accuracy rate under the constraint that the false negative rate difference (on training data) is zero. Since our goal is to optimise balanced accuracy (the average of the sensitivity and specificity of the model (Kuhn et al., Reference Kuhn, Vaughan and Hvitfeldt2023)), we resample the training data to have the same number of positive and negative examples.
There are however limitations to this approach:
-
There may be a substantial accuracy trade-off compared to the fairness-unaware model.
-
Access to the sensitive feature is required to train the “fairness-unaware” model in the first instance.
An alternative to threshold optimisation is to perform a grid search, where multiple models are trained using different trade-off points between performance and fairness. In our example, performance is measured using the balanced accuracy, and fairness is measured using the equalised odds difference. The grid search technique can provide the practitioner with a choice of models that suits their accuracy and fairness thresholds. In our example, all models trained are LightGBM with differing hyperparameters (i.e. the parameters controlling the depth, number of leaves, etc. of the LightGBM model).
Figure 4 below shows the trade-off between balanced accuracy and equalised odds difference. The fairness-unaware model performed best but had a relatively high equalised odds difference (i.e. could be perceived as relatively unfair). However, by performing a grid search, we identified a marginally less accurate model but one that is algorithmically fairer (see Dolata et al. (Reference Dolata, Feuerriegel and Schwabe2021) for a discussion on algorithmic fairness). In comparison, the model identified when applying the threshold optimisation technique was the fairest but at the expense of its accuracy.
Trade-off between relative balanced accuracy (higher accuracy indicates better model performance) and relative equalised odds difference (lower values indicate less discrepancy in results between male and females).

In summary, the threshold-optimised model significantly reduced the disparity in model performance between males and females. However, the overall error rate and AUC for the threshold-optimised model were worse than the fairness-unaware model. With the grid search algorithm, we trained multiple LightGBM models that balance the trade-off between the balanced accuracy and the equalised odds fairness metric. The identified model appears algorithmically fairer with minimal impact on accuracy.
Further actions could involve engaging with relevant stakeholders, to conclude as to which model balances the performance–fairness trade-off as required by stakeholders, noting the potential trade-offs between accuracy and fairness.
3.1.2. What regulation and professional guidance may be relevant?
Below we have included some regulation and professional guidance that could be relevant in the context of this issue.
3.1.2.1. Regulation and legislation
Table 2 below outlines some regulation regarding bias, fairness, and discrimination which may be relevant. Note that further regulation may apply within certain jurisdictions regarding the treatment of policyholders, such as the Insurance Act (2015) in the UK or Colorado’s (2021) SB21–169, in the US, which restricts the insurers’ use of external consumer data concerning protecting consumers from unfair discrimination.
Available Regulation and Legislation Regarding Bias, Fairness, and Discrimination

In addition, global standards currently under development such as ISO/IEC FDIS 42001Footnote 10 (ISO and IEC, Reference Levene2023) may apply, which focusses on how to manage AI systems, including governance and trust. Key themes in ISO/IEC 42001 includes fairness, transparency, explainability, accountability, reliability, privacy, and security (Levene, Reference Levene2023).
3.1.2.2. Actuarial professional guidance
Although there is regulation that aims to prevent direct discrimination based on protected factors, there appears to be less specific regulation on indirect discrimination, for example, proxy discrimination, and how to address this issue within the context of AI. Additionally, it might be challenging to introduce specific regulation or principles, especially for proxy modelling. It is often hard to distinguish between real and causal risk, for example, where smoking status is used as a “proxy” for gender in health insurance. Smoking might per se increase the risk of a claim and could be relevant and appropriate. However, when also used as a proxy to differentiate implicitly for gender, one could argue that it is not fairly applied. Table 3 below summarises some of the professional guidelines available.
Available Actuarial Professional Guidance Regarding Bias, Fairness, and Discrimination

Analysing outcomes and assessing the fairness of outcomes could be a valuable starting point, but it is useful to continuously operate with some conception of ethics and fairness, with attention being paid to the fairness of the process and the specific use case. Particular attention may need to be paid to the ethical use of data, including whether the use of behavioural data, especially that linked to individual choice, is appropriate and ethical to use.
Appendix A provides further best practice examples.
3.1.3. Exploring how to navigate the topic: recommendations and best practice examples
There are various techniques established in the academic community and in industry that can help guide practitioners on how to address bias and discrimination in the context of AI in insurance. Techniques discussed include:
-
Discrimination free insurance pricing (Lindholm et al., Reference Lindholm, Richman, Tsanakas and Wüthrich2022a)
-
Treatment of proxy discrimination (Prince & Schwarcz, Reference Prince and Schwarcz2020; Lindholm et al., Reference Lindholm, Richman, Tsanakas and Wüthrich2022a; Lindholm et al., Reference Lindholm, Richman, Tsanakas and Wüthrich2022b)
-
Designing fair classifiers using specific fairness notions (Bird et al., Reference Bird, Dudik, Horn, Lutz, Milan, Sameki, Wallach and Walker2020; Hossain et al., Reference Hossain, Mladenovic and Shah2020; Lindholm et al., Reference Lindholm, Richman, Tsanakas and Wüthrich2023)
-
Developing and implementing fairness criteria and post-processing (Bird et al., Reference Bird, Dudik, Horn, Lutz, Milan, Sameki, Wallach and Walker2020; Xin & Huang, Reference Xin and Huang2021; Lindholm et al., Reference Lindholm, Richman, Tsanakas and Wüthrich2023)
In addition, the OECD (Reference Kachra, Hilliard, Gulley and Wilson2023) offers a catalogue of tools and metrics for trustworthy AI, with fairness as one of the key objectives. Proprietary tools are being made available within AI suites to help address the issue (e.g. DataRobot’s bias and fairness tool), but open source tools seem to be more popular due to the ability to tailor it to infrastructure or use case where needed.
Based on established techniques in the literature, recommendations for managing bias, fairness, and discrimination include:
-
Following a well-defined and documented process and frequent validations to avoid bias in data and results (see the report by Society of Actuaries for foundational principles and an example model development framework (Smith et al., Reference Smith, Pirchalski and Golbin2022):
-
1. Define and document what factors are relevant for anti-discrimination (e.g. gender, social status, and origin).
-
2. Derive analytical methods that could be used to identify possible bias in data and the modelling in the context of stakeholder requirements.
-
3. Implement and document the agreed methods and explain, and demonstrate how bias could be measured, reduced, and monitored during this process.
-
4. Define and perform frequent checks, to ensure limitation of bias over time.
-
-
Taking an “Ethics by Design” approach where ethical principles are included and addressed throughout the developmental process (Brey & Dainow, Reference Brey and Dainow2020; European Commission, 2021)
-
Developing a fairness assessment methodology, for example, a fairness tree (MAS et al., 2022; Smith et al., Reference Smith, Pirchalski and Golbin2022)
-
Using counterfactuals to test how the model performs if input differs marginally, for example, by only changing the status of a protected class, and ensuring the model’s output does not vary if the status of a protected class changes, all else remaining equal (Mothilal et al., Reference Mothilal, Sharma and Tan2020; Molnar Reference Molnar2022)
Note that whilst we only consider one notion of bias as defined earlier in this section, other notions of bias, for example, statistical bias and related statistical phenomena such as Simpson’s Paradox, need to be taken into account and appropriately addressed to mitigate out-of-sample error and to limit the potential of models picking up incorrect patterns from training data but which do not translate to unseen data (Chen et al., Reference Chen, Bengtsson and Ho2009; Stanley & Mickel, Reference Stanley and Mickel2014).
Open questions include:
-
Whose responsibility is it to define fairness – the actuary, the profession, society, or policy makers?
-
○ If it is the actuary’s responsibility to define fairness, how does the actuary assess fairness in the modelling process, for example, considering the target market, what is the level of cross-subsidy, level of aggregation, etc.?
-
-
When the actuary presents results, is there a potential risk of misrepresentation of results if the uncertainties and potential unfairness of the process and results are not emphasised, and to what extent does the actuary need to emphasise potential uncertainties and impacts?
3.2. Individualisation of Risk Assessment
Traditionally insurers rely on risk pooling to calculate risk and hence premiums and reserves, but there are examples where AI (ML in particular) produces more granular or individualised risk assessment. Still, the insurer may achieve diversification if they secure a large enough portfolio of risks. Hence, even having individualised the estimation of the expected claims cost on a very granular level does not jeopardise the diversification effect of randomness.
Actuaries have a unique role in their areas and have critical responsibilities for the management and understanding of the risk both the company is exposed to and that it continues as a sustainable entity. Traditional insurance and risk pooling allow for the transfer of risk from individuals to insurers to reinsurers, protecting the individual and the public in times of need. On average, everybody benefits. Through AI and data science with large datasets, individual risk assessment might become possible which could result in a trade-off between pricing on an individual basis and maximising commercial interests.
Actuaries need to consider different impacts on the calculation of premiums, which AI can support, but also keep in mind that sometimes a cohort of the public that can least afford insurance are the ones that are in the most need of insurance, and individualised risk ratings could result in more expensive insurance, rather than the purpose of pooling risk and making it affordable for those that need it most. Actuaries can be crucial here to ensure stakeholder needs and commercial profitability are balanced ethically, calculating premiums fairly and ensuring that the premiums will not lead to insolvency. Whilst the actuary may not have the ability to dictate if their organisation chooses to individualise or not, there are vital considerations and practices the actuary could employ if their company chooses to individualise more (see Modelled example 3).
The potential for the individualisation of risk assessment introduces two key challenges:
-
The breakdown of risk pooling, that is, potentially losing certainty as to how a portfolio will perform or requiring a new approach to assessing a portfolio (not included in the discussion below).
-
Potential of exclusion through individualisation: do actuaries really want to differentiate and potentially “discriminate” socially disadvantaged groups of people, and if actuaries are no longer transferring risk but charging for the specific/actual risk of insuring an individual, is it fair (see section 3.1 and the discussion below)?
3.2.1. What empirical evidence is there that this may be an issue?
Granular behavioural data may be used to produce an individualised risk assessment, leading to potentially highly differentiated rates that can make insurance unaffordable for those classified as high risk. This concern has been raised by the Bank of England (2022), and customer concerns regarding this pricing model have been reported in a survey by the Pew Research Center (2016) with the majority of concerns relating to how long the data will be retained. In addition, if a customer is denied insurance, will it change their behaviour, and if not, is it in the public’s interest for the insurer to still provide cover and absorb the risk (see section 3.3)?
3.2.1.1. Modelled example 3
To illustrate how risk premiums could vary as risk pools get smaller and approach an individual level, we divided the data into the following risk pools (note, gender is excluded). N indicates the number of risk pools:
-
A. Traditional insurance rating factors such as age of the policyholder, age of vehicle insured, years without claims, marital status, and the use of the car (N = 207)
-
B. Factors included in A as well as credit score, estimated annual miles driven, and region (N = 2,085)
-
C. Factors included in B as well as telematics data such as percentage of time spent driving throughout the year, brake intensity, accelerations, actual total miles driven, percentage of time spent driving on particular days of the week, percentage of time spent driving in AM or PM rush hour, percentage of time spent driving continuously over different stretches (in hours), and right- and left-turn intensity (N = 100,000, data is at an individual level)
Using each group, we model claim frequency and claim severity separately and multiply the results to calculate the risk premium. We utilise the duration (measured in days) as an exposure metric and use it to standardise the claim frequency. For example, if a policyholder has their policy for half a year and incurs one claim, it will be recorded as two claims when standardised and viewed over a full year of exposure. In Risk Pool C, after benchmarking a Poisson GLM (see De Jong & Heller, Reference De Jong and Heller2013), decision tree, random forest (Breiman, Reference Breiman2001), LightGBM, XGBoost, and a multi-layer perception (MLP, a vanilla feed-forward neural network (Hastie et al., Reference Hastie, Tibshirani and Friedman2017), we deduced that the MLP better balanced accuracy and avoided overfitting relative to other models benchmarked. The MLP had the following architecture for the separate claim severity and claim frequency models:
-
Claim severity
-
○ All groups: three hidden layers (32, 16, number of features in Group X)
-
○ ReLu (rectified linear unit, i.e. outputs are strictly positive) activation function between layers and as output layer
-
○ Mini-batch gradient descent with the Adam solver – see Kingma and Ba (Reference Kingma and Ba2015)
-
○ Constant learning rate of 0.01
-
○ Early stopping enabled
-
-
Claim frequency
-
○ Group A: two hidden layers (24, number of features in Group A)
-
○ Group B: three hidden layers (32, 16, number of features in Group B)
-
○ Group C: two hidden layers (30, number of features in Group C)
-
○ ReLu activation function between layers and as output layer
-
○ Mini-batch gradient descent with the Adam solver
-
○ Constant learning rate of 0.01
-
○ Early stopping enabled
-
We observed that whilst the tree-based models proved to be highly accurate, they were very sensitive to feature adjustments (i.e. policyholder to policyholder). This may lead to potentially volatile risk premiums (see Figures 7 and 8 in section 4.1). In contrast, additive models, including feed-forward neural networks, present a smoother transition.
The results across each group for the final MLP models that best balanced accuracy and smoothness in results are presented in Table 4.
Individual Risk Assessment Models Across Different Levels of Granularity Based on MLP Model (Note that CU Refers to Currency Units)

Table 4 indicates that the model improved in accuracy as the risk pools moved from broader categorisations to individual levels of risk assessments (i.e. from A to C), but in more granular risk assessments, the resulting risk premiums were higher for certain individuals. In the broader risk groupings such as A, the individual’s experience is absorbed by the group’s experience, resulting in lower-average-risk premiums. However, very granular assessment improves the prediction but increases the risk premiums.
When analysing risk premiums predicted at some of the extremes at each of the three groups, the movement in predicted claim amounts as groups become more granular, as shown in Table 5. The significant features per group mentioned here were identified post modelling using one of the explainability techniques discussed in section 4.1: Shapley Additive exPlanations (SHAP) (Lundberg & Lee, Reference Lundberg and Lee2017).
Predicted Risk Premiums on a Policyholder Level Across Groups A, B, and C

The more individual the risk assessments, and the smaller the risk pools became, the more accurate the model appeared to be, but it also resulted in increasingly volatile and potentially expensive risk premiums. This is particularly evident when additional features are added (such as credit score), which serve as strong predictors for risk premium on average, and telematics information like acceleration and brake intensity leading to individuals’ risk premiums adjusting substantially from their risk groups where telematics are not used.
3.2.2. What regulation and professional guidance may be relevant?
Below, we have included some regulation and professional guidance that could be relevant in the context of this issue.
3.2.2.1. Regulation and legislation
In Table 6, we have highlighed some regulation and legislation that may be applicable. Further regulation may apply within certain jurisdictions regarding the pricing of risk, such as the Insurance Act in the UK.
Available Regulation and Legislation Regarding Individualisation of Risk Assessment

3.2.2.2. Actuarial professional guidance
There appears to be little guidance as to the extent that insurers may price on an individual basis (barring bias and discrimination based on sensitive features discussed in section 3.1) and to what extent individual (especially social) risk should be considered. However, some legislations ensure all lives/risks are accepted, for example, medical aid in South Africa (Republic of South Africa, Department of National Treasury, 2012), medical insurance in the USA (Patient Protection and Affordable Care Act, 2010), and group insurance policies. Table 7 outlines some available professional guidance on the topic.
Available Actuarial Professional Guidance Regarding Individualisation of Risk Assessment

It is unclear to what extent insurers can individualise premiums versus relying on more traditional methods of risk pooling. Whilst the conflict between the individual and the majority is not new and it is generally agreed that some equilibrium must be found, where this balancing point lies is debatable. Here, public interest (which we delve into later) comes into play as, depending on what society deems (un)acceptable, the insurer may decide on behalf of society how much collective benefit society (or then the majority of their policyholders) could concede to individuals. Furthermore, high risks may be excluded from insurance due to a high cost or may be denied cover, and premiums may become more volatile (Keller, Reference Keller2018). However, if the market moves towards individualised risk assessments, it may necessitate widespread adoption of this practice to avoid retaining expensive risks at too low a price point. If this is the case, further regulation may be required to manage this practice within the context of consumer protection.
However, risk mitigation techniques can be applied, such as offering specific types of insurance to high-risk individuals. This notion could be applied to providing specialised cover to those identified as very high risk when conducting an individual risk assessment. An example of targeted insurance is diabetes insurance where premium rates are revised annually based on average blood sugar levels over the past 3 months and cannot increase past the premium rate at inception (see, e.g. Royal London, 2023).
3.2.3. Exploring how to navigate the topic: recommendations and best practice examples
Assessing or pricing risk on an individual basis raises various ethical and practical concerns, particularly as it relates to the underlying ideas of insurance, including that of transferring risk. Where voluminous, granular data or modelling techniques are available that can be used to price risk on a more granular level, consider how consumers would be affected if pricing methodology changed.
When considering risk pooling and grouping customers, practitioners could explore where a fair and sensible premium cap would be that could be introduced into the modelling process. Baselining a risk premium using larger risk pools (e.g. under Group A in Modelled example 3) and adjusting based on more granular data (e.g. introducing driver telematics such as in Group C in Modelled example 3) can also prove to be a suitable strategy. To help ensure that there is no model risk leading to an “unfair” outcome from an individualised risk perspective, check that extreme model outcomes could be assessed.
In addition, where big data is concerned, there are examples where insurance companies are advised to ensure they obtain consent from their customers before making individualised offers based on big data analytics using those customers’ data (Thouvenin et al., Reference Thouvenin, Suter, George and Weber2019).Footnote 12
Open questions include:
-
In an example where more data points are available for a certain individual (e.g. results from voluntary genetic testing) or if explainability techniques (e.g. SHAP) show granular results per individual, could their premium be highly individualised, or should risk pooling become more granular? In the case of the latter, when does more granular risk pooling simply become a type of individualisation?
-
Is individualisation unfair in principle – is it not more fair to price based on individual choice of behaviour so that everyone only pays for their own risk, or does individualisation undermine the public interest? Might individualisation even be needed in some cases to provide incentives to help mitigate risks, for example, when pricing for flood risks for certain highly exposed areas, cover will become more expensive so that the space could no longer be used for building unless certain risk mitigating measures are in place?
-
Who is responsible for addressing the issue – the actuary, the profession, society, or policy makers?
3.3. Public Interest
Public interest is defined as the general welfare and interest (stake) of the public. In respect of the insurance industry, what is considered “the public” comprises various groupings, for example, (prospective) policyholders, employees, and shareholders, each with its own interests, with some more influential than others. There are some regulation and guidance on navigating certain issues as they pertain to the public (e.g. data privacy and genetic testing) and acting ethically and with integrity, but this concern is primarily up to the organisation to manage, particularly within their environmental, social, and governance framework.
Whilst the IFoA’s charter notes that “the objects [of the IFoA] shall be, in the public interest”, what this comprises is not explicitly stated (IFoA, 2010). Additionally, this does underpin the sentiment of the Actuaries’ Code (IFoA, 2019) which notes that members should act with integrity and speak up if they believe any action is unethical. In addition, regulation around bias and discrimination (see section 3.1) promotes the public interest, for example, the Equality Act (2010).
Furthermore, big data is sometimes seen as a potential threat to the public interest and various data regulations try to ensure the privacy of the public. The principles of data minimisation and purpose specification as identified in the OECD Fair Information Practices of 1980 (which underlies most Western privacy regulations) are often difficult to account for in big data analyses: at the time of data collection, it might not be clear which data is useful for which purposes, making it hard to strike a balance between minimising data collection and providing room for innovation.
The key question that arises regarding public interest (other than how to define who constitutes the public) is if it is the duty of insurers/actuaries to ensure that everyone can get affordable insurance, and if so, how does the actuary ensure this?
In Tables 8 and 9, we have included some regulation and professional guidance that could be relevant in the context of this issue.
Available Regulation and Legislation Regarding Public Interest

Available Actuarial Professional Guidance Regarding Public Interest

The insurance industry also needs to consider its own interest as a business, navigating through a market economy and recognising the necessity for regulation to safeguard the public interest. Whilst there is some guidance available to actuaries, these are often in the form of non-mandatory guidelines or not specific enough to help actuaries in practice.
Appendix A provides further best practice examples.
3.3.1. Exploring how to navigate the topic: recommendations and best practice examples
Regulation on the use of AI should be driven by public (national) interest, with care taken as to how to define public interest (with due consideration to target markets, stakeholders, the commercial and economic environment, and society). Here, AI auditing may be required. Additionally, whilst there is no single agreed international model for data protection law at this stage, organisations should still strive to comply with relevant regulations.
Open questions include:
-
To what extent is it (solely) the actuary’s responsibility to care?
-
How much should actuaries care?
-
What are examples of caring in the public’s best interest whilst still playing a role in a commercial institution?
4. Professional Challenges
4.1. Explainability
In the context of traditional actuarial work, models developed have typically been interpretable by design. Traditionally, the models produced are parametric, for example, GLMs, or semi-parametric, for example, Generalised Additive Models. Based on the parametric design, familiarity, and wide use of these models, they are typically considered to be auditable.
More generally, explainability and interpretability are relatively broad concepts that have received various definitions, and several attempts of a comprehensive taxonomy have been launched (Linardatos et al., Reference Linardatos, Papastefanopoulos and Kotsiantis2020; Schwalbe & Finzel, Reference Schwalbe and Finzel2023).
A general distinction is made between three types of models:
-
Intrinsically or inherently interpretable models – also often called white or glass boxes, which are either statistical models (linear discriminant analysis, naïve Bayes, etc. (Hastie et al., Reference Hastie, Tibshirani and Friedman2017)), linear models (linear regression, logistic regression (De Jong & Heller, Reference De Jong and Heller2013)), or additive models (Lasso, ridge, Elastic Net, Bayesian inference models, etc. (Hastie et al., Reference Hastie, Tibshirani and Friedman2017)). These models are sometimes referred to as explainable.
-
Ex-post interpretable models – black boxes that benefit from various explainable techniques, most often with local interpretation. Techniques include SHAP (see discussion in section 4.1.3), local interpretable model-agnostic explanations (LIME) (Ribeiro et al., Reference Ribeiro, Singh and Guestin2016; see also discussion in section 4.1.3), PDPs, ICE, and attention maps.
-
Explainable models – black-box algorithms (XGBoost, neural networks) that are trained to produce an inherently interpretable model, for example, XGBoost-based Explainable Boosting Machine (Lou et al., Reference Lou, Caruana, Gehrke and Hooker2013; see also Caruana, Reference Caruana2020; Microsoft Developer, 2020), neural network-based generalised additive model with structuted interactions (GAMI-Net) (Yang et al., Reference Yang, Zhang and Sudjianto2021), or localGLMnet that produces a GLM (Richman & Wüthrich, Reference Richman and Wüthrich2021).
Interpretability refers to the degree by which a model or system can be easily understood and explained by human users and the degree to which a human can consistently predict the model’s results (Miller, Reference Miller2019). It implies a person can scrutinise the decision-making process without technical background into the model’s inner workings.
Similarly, explainability refers to the degree by which a model or system can be easily understood and explain its decisions, predictions, or actions. These explanations are usually in terms of the input features and their importance in the outcome: both at a global level and locally (Molnar, Reference Molnar2022).
Interpretability is a property of the model or system that makes it understandable, and explainability is the degree to which the decisions, predictions, and actions can be explained. Not all explainable models are necessarily interpretable, as external algorithms can be applied to determine feature importance.
According to Phillips et al. (Reference Phillips, Hahn, Fontana, Yates, Greene, Broniatowski and Przybock2021), where AI systems or models are required to be explainable, such as in various types of traditional actuarial work, they should adhere to four principles:
-
Explanation: a system delivers or contains accompanying evidence or reason(s) for outputs and/or processes.
-
Meaningful: a system provides the intended consumer(s) understandable explanations.
-
Explanation accuracy: an explanation correctly reflects the reason for generating the output and/or accurately reflects the system’s process.
-
Knowledge limits: a system only operates under conditions for which it was designed and when it reaches sufficient confidence in its output.
As computing power increases and, with the availability of big data, interactions become more complex for traditional methods to capture, ML techniques and algorithms are becoming go-to techniques due to their ability to process large amounts of data and features in order to produce an outcome. In contrast to the techniques generally applied to traditional actuarial work, these are not interpretable – although external techniques exist.
When producing explanations for non-interpretable models, the main aspects to consider are:
-
Feature importance to justify outcomes and the inclusion or exclusion of the feature in the model
-
Interactions between features in the model, given any correlations present
-
Fairness and treatment of disparate treatment present
-
Modeller’s judgement on whether the observed relationship between inputs and the model’s outputs is reasonable
Correlations in the feature set produce additional complexities that may lead to incorrect inference of explainability techniques.
It is essential to consider interpretations, explanations, and outcomes in the context of making business sense (do the explanations make actuarial sense or is the model overfitting noise?), compliance with regulation and laws (is the model suggesting outcomes that follow regulation and consumer protection?), and stakeholders impacted by the use of the model (can a particular decision taken be explained to stakeholders, and is it fair?).
4.1.1. What empirical evidence is there that this may be an issue?
In the US, the National Association of Insurance Commissioners (NAIC) CAS Task Force (2020; see also NAIC’s bulletin on the use of AI by insurers, updated on December 2023 (NAIC, 2023a)) notes the following are required for the review and governance of predictive models:
-
Individual feature significance (p-values and confidence intervals)
-
Relations between features and their outputs with explanations
-
Impact of variable interaction on results
Whilst the above criteria are properties of GLMs (particularly p-values), they are not properties of more complex non-linear models, therefore requiring the use of explainability techniques to be used to meet the guidelines above. In addition, regulators may not be willing or legally empowered to broaden the validation approaches (see section 4.3). This presents an issue as measures such as p-value are inferential statistics but do not necessarily indicate the predictive performance of a model (Lo et al., Reference Lo, Chernoff, Zheng and Lo2015).
There are a distrust and a perception of greater model risk when using non-interpretable models, likely owing to the unfamiliarity of the models themselves, inability to reconcile their decision-making process, policies requiring that models be of a particular form, and a limited understanding of the tools and techniques to generate explanations (Baeder et al., Reference Baeder, Brinkmann and Xu2021).
4.1.1.1. Modelled example 4
Below we demonstrate global and local methods for explaining model outcomes from Modelled example 3. Global methods look at the overall model and identify features of influence. The approaches used below are model agnostic, meaning the same technique can be used on different models.Footnote 13
4.1.1.1.1. Global explainability
Figure 5 is an example of a permutation feature importance plot (Breiman, Reference Breiman2001; Fisher et al., Reference Fisher, Rudin and Dominici2018) produced from the MLP (neural network) model fitted to Group C in Modelled example 3.
An example of a permutation feature importance, indicating the top ten features identified by order of relevance when predicting claim frequency.

Features with the most influence on model outcomes are assigned a higher relative importance value. Figure 5 also denotes results in an absolute sense, meaning it is not obvious from the feature importance whether total miles driven has a positive or negative effect on the outcome, only that it is an important feature. This is similar to comparing the absolute values of coefficients produced by a GLM (provided features are scaled and therefore comparable).
Feature importance may be misleading if correlation is not accounted for, and different families of models are compared. Therefore, permutation feature importance is a preferred metric for global model explainability.
In conjunction with a feature importance plot, a PDP can be produced which showcases the relative influence a particular feature has on the outcome. These are also model agnostic and explain the average effect features have on the outcome.
Like a feature importance plot, PDPs can be used to sense check results against the practitioner’s business sense.
The PDP shown in Figure 6 can be interpreted as new cars adding approximately CU 220 to the risk premium, whereas older cars add approximately CU 120, all else remaining equal. The net effect is CU 100. PDPs are sometimes visualised centred at zero, depending on context.
An example of a partial dependence plot for a binary feature, showcasing the impact on risk premium of insuring a new car versus an older car.

Similarly, for continuous functions, PDPs may look as follows.
Figure 7 indicates the impact different percentiles of acceleration have on predicted risk premium. The black bars in the x axis indicate where the data most strongly supports the outcome, with results taken outside considered extrapolation as there are fewer data points over its range. At zero acceleration, the higher-risk premium requires further investigation as it does not adhere to the general (and expected) positive relation between risk premium and acceleration.
An example of a partial dependence plot for a continuous feature, indicating the relative effect of acceleration on risk premiums, across its range. All else being equal, it shows the average impact on risk premium of a being in a higher percentile of acceleration.

When assessing model performance based on PDPs, “spikiness” should be avoided. Figure 7 suggests an increase of around CU 80 when moving from the 18th percentile to the 19th percentile in acceleration, before dropping by CU 40 when moving to the 20th percentile. Models producing erratic predictions based on minor adjustments to input parameters are unfavourable and may suggest overfitting on the training set. This is particularly prevalent when fitting tree-based models. Figure 8 below shows preferred behaviour.
A partial dependence plot from a non-tree-based model, indicating a smoother increase in risk premiums as acceleration intensity increases.

4.1.1.1.2. Local explainability
Explainability can also be performed locally, meaning a model’s individual effect can be observed. This means that, for instance, a high-predicted-risk premium can be investigated to determine what features led to the model’s decision. Results can be validated by taking a random sample of results to sense-check results and whether extreme values are sensible and can be explained. Local interpretation is based on the outputs from the model fitted and constitutes a local approximation. Care must be taken when interpreting local feature importance as model error and sampling may create noisy local interpretations.
A popular model-agnostic technique for local model interpretation is SHAP. SHAP produces an account of the impact features have on an individual output by considering the impact of their inclusion (applying techniques found in game theory). Figure 9 below is an example of SHAP output from a policyholder in Group A, as defined in Modelled example 3.
An example of SHAP values at a per-policy level. Positive values correspond to a higher-predicted-risk premium for the individual, ordered by absolute magnitude.

In addition, SHAP values can be used to produce a localised feature importance plot, such as in Figure 10.
An example of a localised feature importance plot, using the absolute magnitudes of Figure 9.

As an alternative to SHAP, LIME fits a simpler, glass-box model as a surrogate that is easier to interpret (see Ribeiro et al., Reference Ribeiro, Singh and Guestin2016). This produces coefficients that indicate what impact features have on a prediction (Ribeiro et al., Reference Ribeiro, Singh and Guestin2016). In this instance, LIME provided a localised linear regression model where fitted coefficients explain model output. Alternative formulations of LIME exist, such as local decision trees and local ridge regression models. The two examples below show the impact observed values have on a localised prediction.
We use a ridge regression LIME with an intercept to produce the following local explanations for a policyholder with a low-predicted-risk premium. The output is based on 10,000 data points sampled.
Per Figure 11, the majority of the top ten features lead to a decrease in risk premiums. The observed values (such as “Insured.age_0–24 ≤0” which is interpreted as being at least 25 years old) result in a low overall predicted risk premium. From the above, a linear formula can be constructed.
An example of LIME outputs. The x axis indicates the coefficient of each feature. Positive values indicate that a particular feature increases predicted risk premium for the individual.

Similarly, the LIME output in Figure 12 below indicates the impact features have when the model predicts a high-risk premium.
An example of LIME outputs when the model predicts a high-risk premium.

The limitation of LIME is that it produces an estimate of a local model based on the original model provided, so explanations must be considered in the context of the original’s accuracy. LIME however produces a more intuitive output than SHAP (for those familiar with linear models), although SHAP is observed to be more popular in practice.
Both SHAP and LIME can be used to explain tabular data (as indicated) as well as image and text recognition models.
4.1.2. What regulation and professional guidance may be relevant?
Below we have included some regulation and professional guidance that could be relevant in the context of this issue.
4.1.2.1. Regulation and legislation
Table 10 below highlisghts some key regulation and legislation in the context. Further regulation and standards may apply within certain jurisdictions, as well as global standards currently under development such as ISO/IEC FDIS 42001 (ISO and IEC, Reference Levene2023), which focusses on how to manage AI systems, including governance and trust. Key themes in ISO/IEC 42001 includes fairness, transparency, explainability, accountability, reliability, privacy, and security (Levene, Reference Levene2023).
Available Regulation and Legislation on Interpretability and Explainability

4.1.2.2. Actuarial professional guidance
Guidelines often just note that actuaries should be able to understand models and disclose considerations, conditions, and limitations for how to proceed with model explainability (see ASSA’s (2021) APN 901: General Actuarial Practice, section 2 on Model Governance). Table 11 provides some professional guidelines that may apply.
Available Actuarial Professional Guidance on Interpretability and Explainability

Most suggested risk classes of algorithms and/or applications only superficially touch this problem. Through an AI risk tiering approach, there is a potential innovation slowdown for cases where the governance requirements are not gradually but abruptly stricter for just slightly more complex applications (e.g. EU AI Act’s classification of AI risk (European Council, 2021),Footnote 14 where the focus is on items classed as high risk and Canada’s AI and Data Act (Innovation, Science and Economic Development Canada, 2023)).
There is a lack of specific and detailed guidance for actuaries on approaching explainability as an actuary navigating complex models. There is also a lack of consensus on the best interpretability techniques for actuarial ML models to ensure that they balance business and societal aims. The actuarial standards set forth by industry bodies do not appear to offer comprehensive guidelines and methodologies for explaining models nor offer detailed criteria or practical recommendations. Without proper techniques to understand these models and guidance on what is required in terms of explainability, it will remain a serious issue with potentially negative impacts.
Whilst best practice is not yet clearly defined by industry bodies, we have observed organisations utilising various techniques, including SHAP and LIME as discussed. These are often being incorporated into other modelling tools, for example, AWS’ SageMaker Clarify and IBM’s Watson, AI Explainability 360. In addition, we have observed the use of surrogate modelling, whereby a highly interpretable glass-box model is trained to approximate a complex black-box model. For example, a neural network may be used to predict risk premiums, whose predictions are then approximated by a GLM. The GLM is then used by the organisation as their pricing model. This example can be taken further by training an ensemble of models and averaging over their results to form a distilled model, which can then be approximated by a smaller, simplified model (Buciluă et al., Reference Buciluă, Caruana and Niculescu-Mizil2006; Hinton et al., Reference Hinton, Vinyals and Dean2015).
However, if explainability techniques are not well understood by those employing them or well defined for stakeholders, incorrect inferences could be made that can impact business decisions. Techniques may be misleading if not used for correct purposes, for example, using feature importance as a guideline for causal inference (and what-if scenarios). This incorrect use could result in conclusions based on features and target being correlated but not causally related. The isolated use of an explainability techniques could also potentially mis-specify correlations between features, leading to incorrect interpretations.
In addition, there appears to be a lack of educational support for actuaries to underpin the continual advancements made in AI (refer to section 5.1 on the lack of skills).
4.1.3. Exploring how to navigate the topic: recommendations and best practice examples
To ensure that the model fitted is explainable, some model-agnostic tools and techniques can be used. Examples of tools that can be used to assist the developer in explaining the model results include PDPs (Friedman, Reference Friedman2001), SHAP (Lundberg & Lee, Reference Lundberg and Lee2017) values, and LIME (Ribeiro et al., Reference Ribeiro, Singh and Guestin2016). The OECD (Reference Kachra, Hilliard, Gulley and Wilson2023) offers a useful catalogue of tools and metrics for trustworthy AI, with explainability as one of the key objectives.
Open questions include:
-
When considering explainability techniques, consider:
-
○ How understandable are they for the intended audience?
-
○ Do they present a risk of misinterpretation?
-
○ Can they lead to misguidance or a false sense of comfort?
-
-
What is an acceptable trade-off between accuracy and explainability? What is the balance, and who defines it?
-
Should there be a preference for solutions with interpretable algorithms when undertaking ML exercises, for example, linear regression, logistic regression, decision trees, Naïve Bayes classifier, and k-nearest neighbour?
-
How could we utilise new techniques to try and tackle traditional challenges; for example, could SHAP be used to explain Monte Carlo Simulations?
4.2. Transparency
Transparency refers to the disclosure of information to stakeholders to understand the process a system or model followed, with relation to how the model uses data, sources of external data, the workings of the model, and in what context the outcomes will be used. When considering transparency from a model-only perspective, transparency can be considered at three levels, namely, that of the entire model (simulatability), individual components (decomposability), and the training algorithm (algorithmic transparency) (Lipton, Reference Lipton2016).
Due to the competitiveness of insurance markets, customers and the general public have remained largely uninformed about the details of actuarial modelling. Still, there may be a shift in how much detail an insurer discloses due to the requirements of GDPR and other legislation. From a stakeholder perspective, they should be able trust that the process, systems, and models were audited sufficiently and with proper due diligence – whether AI was used or not. Documentation could assist in improving the overall trust in the system.
Additionally, when training a ML model, there are elements of randomness in the process, for example, randomness influencing how to split the data. In addition, the modellers’ choice of hyperparameters, and influence on feature selection (as part of the training process), may lead to scenarios where the underlying training methodology becomes non-transparent.
The EU AI Act’s (European Council, 2021) view of transparency includes:
-
Instructions for use and complete, correct, and clear information which should be accessible to users
-
The identity and contact details of the provider and/or representative
-
The capabilities, characteristics, and limitations of the AI system which contains:
-
○ The intended purpose of the AI system
-
○ The level of accuracy, robustness, and cybersecurity, including:
-
How the system has been tested and validated
-
Any known or foreseeable circumstances which could impact the level of accuracy, robustness, or cybersecurity
-
-
○ Any known or foreseeable potential misuse
-
○ The system’s performance as it relates to the intended groups or persons on which the system will be used
-
○ Appropriate input data specifications and other relevant information regarding the training, validation, and testing datasets
-
-
Human oversight measures
-
Any predetermined changes to the AI system and its performance
-
The expected lifetime of the system and any maintenance and care measures (including software updates)
In this view, transparency enables users to use an AI system appropriately and to interpret an AI system’s output.
Additionally, reproducibility and replicability need to be considered. Reproducibility is important for transparency because it means that an independent reviewer can re-run the model and achieve the same results. This help validates the accuracy and legitimacy of a model, thereby reducing model risk. In a ML context, this can be achieved by setting seeds when generating random samples, aggregating results over many samples, and providing details of the model’s architecture and the system on which the analysis and training were performed. Conversely, replicability means the model and results can broadly be applied to a different set of data and leads to the same conclusions. This can be achieved by documenting the process sufficiently and stating assumptions.
4.2.1. What empirical evidence is there that this may be an issue?
In many use cases, it is not feasible to train an AI from scratch. Instead, practitioners often need to rely on vendor solutions that contain pre-built models (either to be used as is or which can be customised) or on models that are built by other technical resources. There remains however a lack of guidance in how best to validate these AI models and what criteria need to be met before it can be used in actuarial work. Transparency becomes difficult to achieve when off-the-shelf models are closed source and data sources used to train and evaluate the model are difficult to verify.
There are however cases where non-transparency is preferred, such as anomaly detection in the context of fraud detection (cf. Baesens et al., Reference Baesens, Van Vlasselaer and Verbeke2015).
4.2.2. What regulation and professional guidance may be relevant?
Below we have included some regulation and professional guidance that could be relevant in the context of this issue.
4.2.2.1. Regulation and legislation
Table 12 highlights some key regulation that may be applicable. Further regulation and standards may apply within certain jurisdictions, as well as global standards currently under development such as ISO/IEC FDIS 42001 (ISO and IEC, Reference Levene2023) which focusses on how to manage AI systems, including governance and trust. Key themes in ISO/IEC 42001 include fairness, transparency, explainability, accountability, reliability, privacy, and security (Levene, Reference Levene2023).
Available Regulation and Legislation on Transparency

4.2.2.2. Actuarial professional guidance
Table 13 highlights the transparency principles available in some professional guidelines.
Available Actuarial Professional Guidance on Transparency

There seems to be fewer checks and transparency expected for humans – more may be expected from AI (models) than from humans, which is likely to be based on trusting the years of training, experience, and judgement of industry experts. Accordingly, is it then sufficient for AI to “explain” itself, or to use AI to explain other AI, or is human intervention required for trustworthiness and buy-in? In the case of the former, sentience (and therefore trust in AI) becomes a potential issue.
Richman et al. (Reference Richman, Von Rummell and Wüthrich2019) provide a detailed account of model risk and note that the majority of risk controls related to models require the actuary to “step through the calculations required by a model to produce its predictions (simulatability) or to investigate particular aspects of one part of the model in isolation, say a particular model coefficient (decomposability)”. However, even GLMs that fit on a high number of parameters (50+) lose transparency and become intractable, and deep learning models exacerbate this issue.
4.2.3. Exploring how to navigate the topic: recommendations and best practice examples
It is essential to maintain proper technical documentation which outlines the purpose, development, data, and limitations of AI systems as this not only assists in regulatory compliance but also helps to uphold ethical and professional standards and can also assist in replicability and reproducibility which is often considered key criteria for validation (see section 2.3).
Open questions include:
-
What level of transparency is required for different purposes, for example, is the same level required for commercial versus exploratory purposes?
-
○ If not, how do actuaries determine the appropriate level for different purposes?
-
4.3. Validation and Governance
Validation refers to the processes by which actuaries gain assurance that the inputs, assumptions, judgements, methodology, and approach taken in deriving the AI-based solution to the challenge posed are fit-for-purpose, stable, well-controlled, and unbiased. This encompasses a range of areas including data validation, model training, model selection and evaluation, and output validation. Current validation techniques include:
-
Statistical quality of estimates (p-values)
-
Robustness of parameters and data used to calibrate models
-
Robustness of results when using different models
Often, traditional modelling includes hand-picking data and setting appropriate assumptions (often with real-world analogues), with “actual versus expected” analyses used to configure suitable inputs and assumptions. However, this approach may be unfeasible when using ML and large datasets. In those cases, feature and data selection may become automated, and practitioners need to instead focus their attention on adjusting parameters in models and communicating their decisions.
Governance refers to the framework in place for decision-making and oversight within an organisation. Traditional governance mainly utilises senior actuaries that review and approve results. Following this, sign-off could be conducted via a committee of senior managers and/or board members. However, where AI/ML is concerned, having the most senior actuary provide sign-off may not be sufficient as they may have the least amount of experience with these new techniques. This could be further exacerbated when sign-off is required by less technical parties.
Governance considerations could include responsibilities, accountabilities, the risks involved, and how these are managed and mitigated.
4.3.1. What empirical evidence is there that this may be an issue?
The increased use of AI raised several areas of considerations, each with emerging risks that need to be navigated:
-
Use of external databases: this obscures the provenance of the data and increases dependency on other organisations in respect to accuracy, completeness, and dependability of the data (European Union Agency for Fundamental Rights, 2019; Financial Conduct Authority (FCA), 2023).
-
Working with other professions not used to the same level of professional standards: this can be a limitation if the actuary depends on other professionals when delivering the AI solution, where others are not bound by certain standards or conduct codes. It is required by the actuary to meet certain standards as part of their delivery, but other professions may not have that requirement placed on them, for example, only company policy.
-
Greater data protection considerations: use of a greater range of personal data that can be potentially discriminatory or illegal (e.g. Meta being fined for violating EU’s data privacy rules (Satariano, Reference Satariano2023)). Organisations could place more significant resources to ensure that the data architecture is suitable to protect it and that there is a legitimate purpose for using the data and consent obtained (see also FCA, 2023).
-
Increased awareness of potentially misleading results: as models grow in complexity, it becomes challenging to sense-check results without proper due diligence, including possessing the right tools and expertise to assess and monitor performance. Over time, models in production may be subject to drift and produce misleading results even if the models were approved in the training phase. Organisations could systematically monitor and govern models both in the testing phase and once in production to mitigate the risk of misleading results. In addition, sufficient “guardrails” should be placed to prevent adverse actions or human error that could produce misleading results (see, e.g. Singapore’s approach to AI governance (Personal Data Protection Commission, 2020).
When validating model performance, organisations could consider the financial and reputational impact of model error (see Kachra et al. (Reference Kachra, Hilliard, Gulley and Wilson2023), e.g. of lawsuits in the US related to AI misuse). For instance, misclassifying an individual as highly likely to lapse (false negative) may result in further communication to retain them as a policyholder but could result in unwarranted market communication (spamming), whereas misclassifying an individual as unlikely to lapse (false positive) could result in lost business. The former may lead to possible upselling, whereas the latter could burden the organisation financially if policyholders are repeatedly misidentified. Organisations could weigh up various metricsFootnote 16 (including fairness) when assessing model performance to mitigate finance and reputational risk.
4.3.2. What regulation and professional guidance may be relevant?
Below we have included some regulation and professional guidance that could be relevant in the context of this issue.
4.3.2.1. Regulation and legislation
Further regulation and standards may apply within certain jurisdictions and environments, such as the PRA’s (2023) regulation on model risk management for banks (SS1/23; effective date 17 May 2024). Global standards currently under development may also apply such as ISO/IEC FDIS 42001 (ISO and IEC, Reference Levene2023) which focusses on how to manage AI systems, including governance and trust. Key themes in ISO/IEC 42001 include fairness, transparency, explainability, accountability, reliability, privacy, and security (Levene, Reference Levene2023). Table 14 sets out key regulatory requirements of the EU AI Act applicable to validation and governance.
Available Regulation and Legislation on Validation and Governance

4.3.2.2. Actuarial professional guidance
Given the topic nature of AI and how the world of work is evolving, various sectors, industries, and organisations are regularly releasing guidelines on how to use AI effectively and responsibly. Examples of non-insurance-specific guidelines have been included in Table 15 below, and broadening the scope may help actuaries find useful guidance. However, care should be taken to evaluate the suitability of the guidelines proposed for an insurance use case if a broader perspective is taken.
Available Actuarial Professional Guidance on Validation and Governance

4.3.3. Exploring how to navigate the topic: recommendations and best practice examples
Model evaluation techniques and considerations such as confusion matrices, AUC, overfitting, and underfitting can be helpful in the validation processes (Rossouw, Reference Rossouw2019). Additionally, surrogate models, cross-validation, and the explainability and interpretability techniques discussed in section 4.1 can improve confidence in a model’s results (see Rossouw (Reference Rossouw2019) and the guide on Practical Data Science for Actuarial Tasks by Perkins et al. (Reference Perkins, Davis and Du Preez2020) in Table 15).
Past assumptions of non-AI legacy models can be validated through the use of explainability and interpretability techniques by reverse engineering the solution. For example, if we have a legacy system that takes in user input on a set of scenarios and produces cash flow projections, validation techniques can be used to determine whether loadings are reasonable, assist in explaining the process, and offer suggestions as to where it may improve.
Applying AI to large datasets allows for new approaches and improved solutions to problems that once were daunting, but the use of AI is not always required or justified. Design authorities and ML governance groups (including information technology (IT), actuarial, and data scientists) seem like a plausible solution to help guide when and where AI is required, but best practice is still not specified enough, and the issues discussed here will not be solved overnight. The core principles of AI governance frameworksFootnote 19 we have observed are:
-
Safety, security, and privacy
-
Accountability, transparency, and traceability
-
Explainability and interpretability
-
Robustness
-
Fairness
-
Human-centricity in oversight and communication
These principles are generally underpinned by appropriate team structures and infrastructure, along with an approach in which AI systems are built, measured, and evaluated iteratively and continuously.
There are also some novel approaches to AI governance that can be considered, such as Peters and Van Den Brink (Reference Peters and Van den Brink2023)’s approach in which ethics is trained into the system so that the AI cannot be unethical, that is, is self-governed.
With regard to final sign-off of AI/ML models, AI literacy upskilling could help ensure that those involved in oversight and sign-off are able to provide the right level of governance. Due to the professional standards actuaries are held to, and their understanding of how to interpret analyses to add value to the business, actuaries are often central figures in governance frameworks and can continue to play a pivotal role in the governance framework if they equip themselves with the necessary skillsets. In addition, they can help shape regulation and assist in its enforcement.
Whilst AI can offer enhanced insights and analytics, it is not always necessary to utilise and dedicate resources to it. For example, emerging risk categories bring greater fallibility than stable risk categories, and as AI systems can struggle to make informed selections about things they have not yet seen, care must be taken regarding the application of (the correct) AI techniques.
In addition, one could potentially use an AI ID-card system, where each model or system has a specific ID number with a corresponding set of details, including the data used, licensing, and owner/accountable person (see also the PRA’s (2023) regulation on model risk management (SS1/23) on examples of appropriate model information to include, as well as how to implement a tiering system for model governance using materiality and complexity as key measures). Code and models built could also be subject to code reviews and out-of-sample testing.
Lastly, when it relates to the interpretation of regulation, some countries are adopting an approach whereby regulation is to be taken verbatim for items that directly impact the consumer (e.g. pricing) but allows for more leeway in other areas (e.g. exploratory analysis).
Open questions include:
-
How do actuaries validate and govern if there is no sufficient transparency?
-
To what extent, and for what use cases (if any), can actuaries use a model that is not transparent given current actuarial guidelines? Will further validation and governance permit the use of such models under specific circumstances?
5. Lack of Relevant Skills Available
The increasing prevalence of AI in various industries, including actuarial work, necessitates a discussion on the potential risks and challenges associated with its implementation. This section of the paper focusses on actuaries’ potential lack of relevant AI skillsFootnote 20 and the potential implications of this skills gap on both traditional and non-traditional actuarial work.
Actuaries are well versed in applying statistical techniques to solve real-world business problems whilst ensuring quality, fairness, ethics, and professionalism. However, the rapid advancement of AI and ML technologies could outpace traditional actuarial training and education, resulting in a skills gap in specifically the data science and computer science domain as applied to AI.Footnote 21 This gap may need to be addressed for actuaries to remain at the forefront of risk management and decision-making.
Historically, actuarial education has focussed primarily on mathematics, statistics, risk, and business knowledge and application, with less emphasis on computer science concepts and tools. As a result, many actuaries may lack expertise in areas such as programming, massive data manipulation, and the design and implementation of AI algorithms. This limited exposure to computer science in actuarial education contributes to the skills gap and may create challenges for actuaries seeking to fully adapt to the AI-driven future.
It is also noteworthy that the majority of statistical concepts taught in the actuarial syllabus have not caught up with ML and AI. This is particularly relevant when contrasting how one fits a GLM compared to an ensemble model. In particular, less attention is given to selecting features that are included in the model (e.g. using correlation as a filter), but rather the ensemble model decides on what features are given the most attention. This is further highlighted in deep learning, where layers in the neural network handle aspects of feature engineering.
The development of AI skills among actuaries can also drive faster innovation within the actuarial profession, for example, in the creation of new tools, methods, and applications that were previously unimaginable. This innovation can help actuaries stay relevant in a rapidly evolving technological landscape and ensure that the actuarial profession continues to thrive in the face of competition from other data-driven professions.
Whilst the impact of the skills gap on traditional actuarial work may be less than on non-traditional fields, it would be short-sighted to ignore the need for developing additional skills and knowledge related to AI. Actuaries who can effectively deploy advanced AI techniques and technologies (or provide knowledgeable oversight of them) will be better positioned to add value to their organisations and continue to drive impactful results. In traditional actuarial work, AI can be utilised for tasks such as automation, predictive modelling, risk assessment, and optimisation of pricing and reserving strategies.
Incorporating AI into traditional actuarial tasks has the potential to enhance the accuracy and efficiency of models and methods. For example, advanced ML techniques can be used to refine loss reserving estimates or improve the predictive power of underwriting models. By embracing AI technologies, actuaries can also better anticipate and respond to market trends, regulatory changes, and emerging risks.
AI can also streamline various actuarial processes, such as massive data preparation, model validation, and reporting. By automating repetitive tasks and reducing manual intervention, actuaries can focus on higher-value activities, such as strategic planning, oversight, and risk management. Furthermore, AI-powered tools and technology stacks can help actuaries make more informed decisions by providing real-time insights and predictive analytics.
As industries (where actuaries have traditionally played a role) embrace the use of AI and advanced data science techniques, should actuaries be considered the specialists in this area, or should they be users and interpreters of output from these tools, produced by other specialists? The Actuaries’ Code (IFoA, 2019), Principle 2, under Competence and Care, notes that “[m]embers must consider whether input from other professionals or specialists is necessary to assure the relevance and quality of work and, where necessary, either seek it themselves or advise the user to do so, as appropriate”. Should actuaries produce, interpret, use, and risk manage these systems, or should they only perform a subset of these duties?
Actuaries have a multi-faceted role in the domains they reside. This is far broader than just the calculation of numbers and involves consideration of different stakeholders, balancing the needs of policyholders, public interest, and the ongoing sustainability of the company they work for. In this respect, actuaries play a significant role in the oversight and interpretation of results from AI models. For actuaries to execute their duty with competence and care in today’s technological climate, actuaries may require an understanding of statistical learning, AI, and data science techniques, especially their respective weaknesses and limitations, and the appropriate and fair application.
This could create opportunities for actuaries to support the use of AI and data science in interpreting results in terms of their impacts on society. It is essential that actuaries at all stages of their careers continue to advance their knowledge, and especially if working in any areas that involve the use of data analytics, to remain up to date, and to understand the strengths, weaknesses, and risks of AI and how to apply the results appropriately, considering any wider implications and bias that could appear.
The lack of relevant AI skills is of even greater concern in non-traditional actuarial fields, where technology and interest in AI may have progressed faster than in traditional actuarial fields. In these emerging areas, actuaries may be called upon to apply AI and ML techniques for wider tasks such as fraud detection, customer segmentation, personalised marketing, climate risk modelling, cyber risk assessment, and behavioural analytics. To play a pivotal role in shaping the future of these emerging fields and addressing critical issues facing society, and in successfully competing with data scientists and AI specialists in non-traditional fields, actuaries must expand their skillset to include a strong foundation in data science and computer science as applied to AI.
5.1. What Regulation and Professional Guidance May Be Relevant?
Below we have included some regulation and professional guidance that could be relevant in the context of this issue.
5.1.1. Regulation and legislation
The second principle in the FCA’s (2022) Principles for Businesses states: “A firm must conduct its business with due skill, care and diligence”.
5.1.2. Actuarial professional guidance
The Actuaries’ Code (IFoA, 2019) has a principle which notes that members must carry out their work with competence and care.
The lack of relevant AI skills in actuaries has substantial implications for both traditional and non-traditional actuarial fields. Actuaries must proactively expand their knowledge and skillset in AI techniques and technologies to remain competitive and drive value in an increasingly AI-powered future. By pursuing structured education, collaborating with AI professionals, and engaging in continuing professional development (CPD) focussed on AI topics, actuaries can bridge the skills gap and ensure their continued relevance and success in the evolving actuarial landscape.
Moreover, one of the most significant challenges in AI is the current absence of a professional body overseeing professionalism and guidance for practitioners in the field. The actuarial profession has a unique opportunity to potentially play a role here with other industry bodies, given the focus on professional standards, ethical guidelines, and best practices. By seizing this opportunity, actuaries can play a pivotal role in shaping the future of AI applications and risk management whilst strengthening the profession’s reputation for integrity and expertise.
In summary, embracing AI, adapting to its challenges, focussing on building the additional skillsets required, and assuming responsibility for the guidance and professionalism of AI practitioners will enable actuaries to continue making meaningful contributions to both traditional and emerging actuarial fields. Ultimately, this proactive approach will shape the future of actuarial risk management and decision-making, ensuring that the actuarial profession remains a vital and trusted force in an increasingly complex and data-driven world.
5.1.3. Exploring how to navigate the topic: recommendations and best practice examples
Whilst the extent of skills required hinges on the actuary’s role (e.g. model building using ML versus making business decisions versus oversight), some form of upskilling is required to grow the value-add actuaries can offer organisations. To address the potential lack of deep AI skills and the understanding of the ethical considerations and actions required, actuaries could consider the following recommendations:
-
Pursue structured and comprehensive education in AI – actuaries could undertake a structured and comprehensive course of study in computer science as applied to AI, potentially extending up to Fellowship level. Short courses or ad-hoc certificates may not provide the depth of understanding required to effectively deploy AI and advanced ML techniques in actuarial work.
-
Collaborate with AI professionals – fostering collaboration between actuaries and AI professionals through joint training programmes, workshops, and conferences can help actuaries gain insights into the latest AI techniques and tools whilst sharing their expertise in statistics and business knowledge. This collaboration can lead to the development of more robust and effective AI solutions for risk management in traditional and non-traditional actuarial fields. This might be especially useful for actuaries typically involved in more oversight-type roles.
-
Develop and share best practices – as actuaries gain experience and expertise in AI, it is essential to develop and share best practices within the profession. This can be achieved through the publication of research papers, case studies, and industry guidelines that address AI applications in actuarial work, as well as ethical considerations and potential risks. Additionally, as mentioned above, collaboration with AI professionals may be beneficial as they are also able to contribute to the development of best practice and may already have best practices that actuaries can employ.
-
Engage in CPD in AI – actuaries could engage in CPD focussing on both technical and ethical aspects of AI and ML. This will enable them to stay current with the latest advancements in AI technologies and their applications in the actuarial profession.
-
Encourage actuarial organisations to update curricula – actuaries could advocate for the inclusion of more robust and structured AI and computer science topics in actuarial curricula as full subjects and actuarial education tracks. By incorporating these subjects into the core of actuarial education, future generations of actuaries will be better equipped to tackle the challenges and opportunities presented by AI and ensure actuarial work is implemented in a fair, interpretable, and explainable manner.
6. Wider Themes
6.1. Organisational Strategy and Sustainability
As per the Bank of England’s (2022) Discussion Paper on AI and ML, there is an amplified prudential risk in light of AI which could be considered and may necessitate changes in strategy and regulation. Additionally, a key pillar of AI regulation and risk management is the notion of trustworthiness and accountability, both of which need to be considered and may have a customer impact. This could necessitate additional disclosures on the use of AI and decision-making within the organisation (e.g. is a human making the decision or is the AI making the decision?), and additional staff could be required to monitor AI-assisted decisions and outcomes.
AI has the potential to help solve various challenges faced, including improving healthcare and insurance offerings, and help fight climate change by improving climate predictions and assist in decision-making for limiting carbon footprints. However, significant amounts of computational power are required to train certain AI models, and increasingly large datasets can take a long time to run, both leading to more energy being required. In contexts where energy is primarily generated by fossil fuels, this leads to increased greenhouse gas emissions (Ekin, Reference Ekin2019; Dhar, Reference Dhar2020; Li, Reference Li2023).
To combat this issue, AI’s climate impact needs to be quantified. Organisations could estimate the carbon footprint of their models (based on factors such as geographic region, hardware, and cloud provider) and consider how and where their data is stored (e.g. data centres that run on renewable energy) (see Google’s 4Ms by Patterson (Reference Patterson2022)).
Furthermore, where AI is used to assist environmental protection, care must be taken to avoid bias in all aspects of the solution to ensure that the model prioritises long-term sustainability and not short-term growth or economic gain.
6.2. Wider Risks Associated with LLMs Specifically
As more recently evident with LLMs (such as ChatGPT and Bard) and Generative Adversarial Networks, made available for public use AI models are not always transparent.Footnote 22 For instance, the underlying data used to train the model is often not fully disclosed, the algorithm used may be closed source, and the API provides all results in a non-transparent system (i.e. no/limited source for the output provided) (see Bommasani et al. (Reference Bommasani, Klyman, Zhang and Liang2023) for a discussion on the transparency of foundation models). In addition, the output generated is no longer deterministic (i.e. the same input can result in different outputs).
Whilst we have not yet seen many use cases for actuaries to get involved in LLMs (NAIC, 2023b), the FRC (2023b) reports that there is an increase in the use of LLMs, generally to help programmers write, explain, or summarise code into something suitable for non-technical audiences (FRC, 2023b). The public availability and benefits of LLMs may lead to more people utilising LLMs in the workplace, including fine-tuning their own LLMs for other purposes including processing transcripts, calling on internal policies, and summarising documents for technical reports or identifying emerging risks (see FRC, 2023b; Balona, Reference Balona2023).
Not only may the increased adoption of LLMs call for changes in skillsets (e.g. prompt engineering to get the best possible result from the model),Footnote 23 other changes in governance and security may be required. When considering using these non-transparent models within the context of actuarial work, including modelling and reporting, the risk management process becomes increasingly complex. For example, could sensitive information have been used to train such as model, what biases were present in the training set, or could sensitive information provided through a prompt be leaked?
Additionally, there is concern regarding the validation frameworks of these models and how to address the issue of so-called hallucinations (Lee et al., Reference Lee, Firat, Agarwal, Fannjiang and Sussillo2018; Xu et al., Reference Xu, Agrawal, Braikou, Martindale and Carpuat2023).
With the recent release of various AI and concerns raised in the media, there are changes in the political environment regarding AI. In certain cases, there are significant political risks for companies introducing technology that is, or could be perceived as, AI given the current fast-moving and sometimes divisive political environment, which calls for a moratorium on AI whilst promoting technological innovation.Footnote 24
Appendix B includes some additional considerations on LLMs from an actuarial perspective.
6.3. Recommended Approach to Applying AI
Where AI is being applied, any person or organisation, including actuaries, utilising or overseeing the solution in any manner could take an “Ethics by Design” approach which aims to incorporate ethical principles into the developmental process to allow for any ethical issues to be addressed as soon as possible. This will help manage bias and fairness and enables the inclusion of principles such as transparency and explainability, as these allow for the ethical nature of the AI system to be examined. Utilising the resources presented in this paper, an appropriate governance and validation framework can be developed, and suitable techniques can be identified to ensure that AI is developed and utilised in a safe, transparent, ethical, and trustworthy manner.
6.4. Considerations for the Profession
It is critical that actuaries learn how to navigate as it is rapidly changing the world of work by identifying the opportunities, upskilling accordingly, and keeping sight of the risks.
AI offers a wealth of opportunities within the commercial and business environment and can help the actuary enhance their current work to or to take on different roles. The actuary is uniquely placed based on their technical background and business knowledge to address business problems, but they need to embrace new technologies to keep adding value. Upskilling to understand, apply, validate, and govern solutions is critical in order for the actuary to take on roles in the new world of work. Actuaries could leverage the work done in industry, academia, and regulation internationally to help them navigate the challenges and opportunities AI presents.
There is a risk for the profession of potential actuarial job loss due to automation, advances in data analytics, and other focussed professions taking up parts of the actuary’s role. At the same time, the nature of actuarial work may change, for example, if the impact of AI/ML means less actuaries are involved, it could mean that those left may not have the skills and experience to judge the output in the same way, and therefore, the output itself may suffer and could be less rigorous. Whilst navigating the risks of applying AI may require development of further regulation and practical guidance, current professional standards and regulation do offer the actuary a starting point for managing the application of AI and ML – the actuary should continue to build on their skillset and professional standards to embrace and manage AI.
Acknowledgements
Our thanks go to other contributors and reviewers for their valuable comments: Jim Baxter, Caesar Balona, Jan Blomerus, Christophe Dutang, Lawrence de Jesus, Ronald Richman, Anton Scharnick, and Fabian Transchel.
Appendix A. Additional Best Practice Guidelines and Industry Approaches
Below we outline further best practice guidelines and key considerations regarding bias and discrimination and public interest as a supplement to sections 3.1.2 and 3.3, respectively.
A.1. Bias and Discrimination
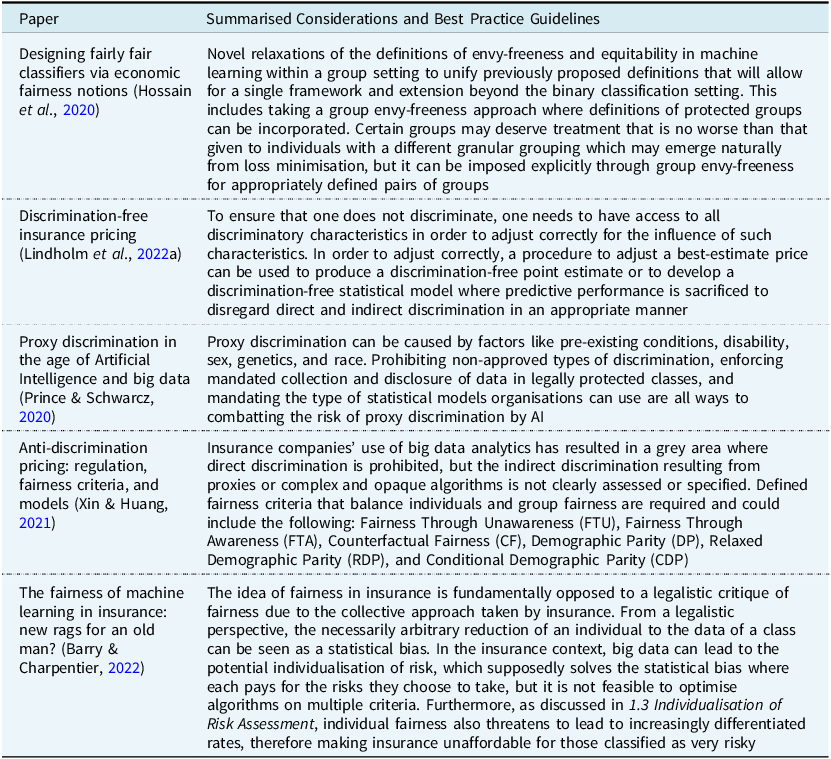
A.2. Public Interest

Appendix B. Some Additional Considerations for Large Language Models
B.1. Introduction
Given the rise in popularity of Large Language Models (LLMs) and technological improvements which led to major releases of LLMs, as well as the increased use of LLMs for actuarial work (see FRC, 2023b), a brief discussion on LLM-specific considerations is required.
As defined in section 1.1 of the paper, LLMs are a class of AI models trained on large amounts of text data to “learn” a topic and its language structure to mimic human text. They are usually transformer models comprising billions of parameters, making them black box. Large-scale LLMs are sometimes referred to as foundational models, and these can be used to build models that address specific use cases, for example, OpenAI’s ChatGPT and Google’s Bard (see Goyal et al., Reference Goyal, Vasrshney and Rozsa2023). They are a class of generative models, meaning they can produce an entirely new output based on a given input.Footnote 25
Notable foundational LLMs include OpenAI’s GPT, Google’s BERT, Meta’s LLaMA, the Technology Innovation Institute’s Falcon 40B (Gao & Gao, 2023). Most recently, Google has released Gemini, multi-modal LLM. Multi-modality means the model can parse a combination of text, audio, and/or image data. Gemini differs slightly from the aforementioned models in that it was trained multi-modal from inception. These models require a large amount of data and computing resources to train and fine-tune; hence, it is largely unfeasible to build an LLM from first principles. Foundational models are typically presented to developers as off-the-shelf and come in different variants (grouped according to size, complexity, usage rights, etc.) depending on the needs of the developers. Such models have been successfully used to develop sophisticated chatbots, such as OpenAI’s ChatGPT and Google’s Bard (Bowman, Reference Bowman2023). These tools are fine-tuned and calibrated to serve a specific task. Users can fine-tune foundational LLMs specific to their data using tools such as LangChain.Footnote 26
Smaller, domain-specific LLMs can be created from first principles (as demonstrated by Microsoft and their phi family of models, which was trained on textbooks (Li et al., Reference Li2023)). However, actuaries are likely to interface with LLMs as end-users. They may also serve to advise on domain-specific LLMs built from foundational models, for example, if the LLM is targeting an actuarial use case.
B.2. Example Use Cases Relevant to Actuarial Work
LLMs have various uses cases within the insurance industry and beyond, with LLMs likely having an impact on various sectors of the economy. According to the FRC report on the use of AI/ML for actuarial work, 70% of respondents reported that their organisations were using LLMs in some manner (FRC, 2023b).
Active use cases for LLMs in actuarial work included the use of LLMs to assist with programming, summarise large volumes of text, and summarise code bases for non-technical audiences (FRC, 2023b). Other specific use cases included using an LLM to assist with a demographic analysis for specific population groups and estimating future emergent mortality trends (FRC, 2023b). Some respondents also indicated testing LLMs to help with the processing of customer complaints data, which seemed likely to result in improved efficiency (FRC, 2023b). Speculatively, some respondents commented that LLMs may be able to parse open-ended questionnaires, provide bespoke financial advice, assist in drafting reports, and help identify emerging risks utilising, for example, web scraping of news reports (FRC, 2023b; Balona, Reference Balona2023). With the advent of multi-modal LLMs, it opens up possibilities of image recognition task (e.g. a claimant may take a photo of their vehicle and submit it to the insurer which uses an LLM to extract initial information).
Whilst many FRC (2023b) respondents indicated using a third-party LLM (mainly ChatGPT), it may be plausible to develop an LLM internally. Internal LLMs may be able to call on internal records and policies. A foundation model (Goyal et al., Reference Goyal, Vasrshney and Rozsa2023) is required to develop an internal LLM, with fine-tuning of a knowledge base leading to a more bespoke LLM. Cloud vendors have already made such functionality available in a secure environment via services such as AWS Bedrock or Azure Open AI.
In order to adopt such sophisticated use cases, appropriate safeguards and a detailed understanding of the potential risks involved are required. For example, LLMs even when trained on internal data and fine-tuned may have the same biases as the foundational model it used. Unless foundational models are built from scratch (which may not be feasible), then any biases built in from the foundational model on which it is trained will still be present in the final LLM. The behaviour of the models is impacted by those training the models and how it has developed the model to work out an answer. It is unclear how foundational models has been trained and how the developers decided what would be a good outcome. In addition, the answer generated by an LLM is heavily dependent on how it is prompted.
There may be a further version control risk involved if the foundational model used to develop the internal LLM from is updated.
Further guidance and regulation on the use of LLMs may help guide potential risk-controlled adoption.
As some of the aforementioned use cases show, LLMs have various indirect applications where actuarial work is concerned (e.g. assistance with coding). Indirect applications refer to the use of LLMs to assist a practitioner with their work, whereas direct applications refer to LLMs that serve a distinct role in a process (Balona, Reference Balona2023). Directly, LLMs have the capacity to automate manual, administrative work, such as claim categorisation based on a claim report completed by the claimant. This was traditionally difficult to automate since text data is unstructured and may be ambiguous. Through a combination of process automation to handle inputs and responses (e.g. inputs are transcribed, added to a database, processed by the LLM, and handed to the next part of the process) and specific tuning against the organisation’s internal policies, it may be possible for an LLM to greatly improve efficiency in the claim processing phase. This is one such example, but the efficiency of performing certain tasks may be improved upon by having LLMs available to process unstructured text.
Other examples presented by Balona (Reference Balona2023) include education, since users can receive real-time feedback and adjust the complexity level of the responses. This use case may influence how actuarial students interface with their actuarial learning material during the pre-qualification process. Furthermore, LLMs could have applications elsewhere in the insurance value chain where actuaries may not be as involved, for example, customer interactions.
There have been other innovative examples of using LLMs as an interface for users to interact with models. Tools such as HuggingGPT allows for an LLM to act as a central console that can select the right tool or model based on the prompt. For example, if a user asks for assistance on a calculation, HuggingGPT could theoretically call a pre-defined script and use it to calculate results on the user’s behalf. This may result in better outcomes across a wide domain of tasks and improve adoption rates, since developers can have qualitative tasks handled by pre-defined code or pre-trained models, have a set of agents to solve specific problems, and ultimately minimise the risk of hallucinations.
B.3. Risks
At the time of writing, the main concern regarding the use of LLMs centres around the accuracy and reliability of the information it produces, with many also being concerned about data privacy where publicly available third-party tools such as ChatGPT are concerned (although efforts such as the recent launch of ChatGPT Enterprise and secure services such as AWS Bedrock have significantly reduced the privacy risks). Some countries, for example, Italy, have banned the use of ChatGPT initially due to privacy concerns, and various governments are developing their own legislation, regulation, and policies regarding the development, release, and use of AI (Browne, Reference Browne2023). The use of LLMs requires a specific focus on validating the results produced by the LLM to avoid hallucinations (seemingly plausible but inaccurate responses).
The risks associated with using LLMs largely depend on what LLM is being used and what it is being used for. For example, using an open-source, internally enhanced LLM to summarise information may be less risky than using a commercial LLM via an API to analyse information. Reported risks, as per Bodanis (Reference Bodanis2023), include a potentially lack of authenticity, implications to liability insurance, reduction in critical thinking, and a lack of output tailored to the specific audience. Some respondents in the FRC (2023b) report indicated that they trialled LLMs but soon abandoned them due to the difficulties explaining inaccuracies. Although respondents experienced high accuracy in some cases, especially when processing reports, the risk was too great to proceed with LLMs as the inaccuracies experienced could have led to catastrophic consequences.
Due to the nature of LLMs, transparency is also a key concern. Even where self-built or internally enhanced LLMs are being utilised, the solution is still reliant on a pre-built foundation model which is often sourced from an external party. Whilst these foundation models may have to comply with specific regulation and perform conformity assessments, transparency may still be limited, especially in cases where the foundation model has not been made available as open source.
Whilst optimising an LLM for internal use may mitigate some of these risks and make the solution more transparent versus a commercial tool accessed via an API, there is an increased risk of bias being introduced into the system. There is therefore a responsibility to test that no new bias has been inadvertently introduced; however, there is still a risk that any bias in the foundational model may still be present. Furthermore, maintaining an LLM internally may introduce further cyber, operational, and infrastructure risk due to their new, complex nature and rapid pace of development in the field, which requires constant monitoring in the space.
In addition, there is a risk of lack of control of how the model is trained and developed. LLMs develop a personality based on their instruction and training set. This can mean it can hold certain views that some may find controversial. For example, it may censor its output on certain topics. This is likely not a major issue for most insurance applications, but it can lead to risk.
In response to this, some open source models are trying to be completely open and uncensored. This, of course, exposes arguably more risk in terms of biases found on the internet.
So not only are there risks with sending important information into third-party LLMs, there is also a risk of the company’s personality (in terms of how the LLM handles tasks) being influenced by the third-party LLM personality. These two will likely not always align.
Another risk is jailbreaking (Chao et al., Reference Chao, Robey, Dobriban, Hassani, Pappas and Wong2023) of these models, for example, injecting instructions to influence its behaviour.
Additionally, training advanced models require large amounts of computational power and infrastructure. Whilst technological improvements are likely to reduce the resources required in the future, the resources required to build and train foundational models may likely remain prohibitively expensive to most (see Future of Life Institute, 2023). Additionally, the utilisation of such amounts of computing resources could also have a detrimental impact on environmental and sustainability goals due to the large amounts of energy and water required.
B.4. Regulation
In Europe, generative AI is subject to specific obligations under the Parliament Proposal of the EU AI Act. Those developing and providing generative AI systems (e.g. LLMs) will have to train, design, and develop the system in such a way that the content it generates does not breach EU laws, fully document and provide a detailed summary of the use of any copyrighted training data, and comply with strict transparency obligations. Examples of obligations include clearly notifying the user that they are interacting with an AI system or explicitly stating that the content was generated using AI. These obligations aim to protect against the infringement of intellectual property rights and copyright infringement and to ensure AI generated or manipulated content is clearly stipulated. Further reading is available from Hacker et al. (Reference Hacker, Engel and Mauer2023).
In the UK, for example, no LLM-specific regulation exists at the time of writing.
Additionally, providers of foundation models, which LLMs are built on, must also meet their own set of specific obligations.
Where LLMs are used for reporting purposes, the Technical Actuarial Standards (TASs) reporting principles must be complied with, and any use of an LLM for actuarial work must comply with all TASs, including validation standards.Footnote 27 Whilst AI regulation is in development and becoming more readily available, many feel that AI regulation in reporting may be “too slow to materialise” (Bodanis, Reference Bodanis2023). Given the principles-based pro-innovation approach in the UK, some feel that specific guidance on the use of LLMs, particularly for reporting, is required, even if regulation may not be feasible (Bodanis, Reference Bodanis2023).
B.5. Factors Influencing the Adoption of LLMs
Balona (Reference Balona2023) provides a useful schematic for evaluating whether an LLM is technically useable for a given actuarial use case. Broadly, if the task involves text data and generating of new output and the resource availability and risk appetite are justifiable, an LLM may be useful for the task. LLMs however struggle against numerical data, meaning other approaches, including traditional techniques or symbolic AI systems, are preferable in activities like calculating reserves and premiums.
A major challenge to adoption is the resources required to adapt an LLM to meet specific business needs. This is from the perspective of both computing resources and skillset to securely facilitate the process and maintain it over time. As demonstrated in Balona (Reference Balona2023), the most useful responses came from LLMs that were calibrated and had access to domain-specific data (such as regulatory text). ChatGPT, in the examples provided, could not provide specific enough responses and required careful prompt engineering to improve the quality.
Another challenge is the development of an adequate culture towards AI in general and generative AI in particular, within the actuarial function and the insurance undertaking.
In addition, a risk assessment is crucial before proceeding to use LLMs as part of actuarial work. This assessment may include:
-
What inherent bias is present in the LLMs and/or data inputs, for example, an LLM chosen with limited training data from languages found in certain regions where business is conducted may result in biased responses
-
Ethical considerations pertaining to the use case the LLM is in, for example, considering what risk there is of harm to the customers caused by an LLM in this role?
-
Challenges related to interpretability and level of explainability required, for example, can output be monitored and reasoned?
-
Exposure to unintended data leakages, for example, does an LLM accessible over the internet suffice, or is internal hosting required?
-
Acceptable variation in outputs, for example, how reproduceable should outputs be and what tolerance is there?
-
Exposure to model errors and anticipated cost thereof
For items highlighted in the risk assessment, mitigation measures can be discussed to limit exposure; however, unavoidable risks (such as the risk of catastrophic model error being too severe) may restrict the adoption of LLMs for particular use cases.
The impact of the adoption of LLMs can be viewed through different lenses, including monetary, operational, and client experience, and considering these three lenses may help guide the potential adoption of LLMs.
B.6. Governance
AI governance should entail a systematic approach to designing, developing, deploying, and utilising AI within an organisation to ensure the responsible and safe adoption thereof. It is important that measures are identified to monitor and manage the AI system and the associated risks as this will contribute to transparent and trustworthy AI. These considerations, along with those discussed in section 4.3 of the paper, should be considered when utilising LLMs.
However, there are risks associated with the use of LLMs specifically that require special governance considerations, including privacy concerns. For example, any information used in the training of the LLM becomes part of how it learns and reacts in generating output. If confidential information has been used, it will be part of the system.
Particularly, governance of LLMs should address privacy concerns (especially where a publicly available third-party LLM is being used), the handling of personal identifiable information or other sensitive information, and the validation of output. Given the lack of control over the output generated by the LLM, safeguards should be put in place to validate responses and to exclude any unethical discriminatory or hateful output.
As part of the governance process, some may choose to build in universal prompts to help mitigate some of these concerns. This should include the LLM including a valid reference in its response which the user can access, or limiting certain types of language, it is unclear where this is possible. The governance process should also take care to focus on the data the LLM will have access to. Whilst sensitive information may be required for the LLM to generate useful and accurate responses, anonymising or masking the information could contribute to a safer solution.
Monitoring solutions could also be set up to monitor the prompting and the responses, with any concerning prompts or responses being flagged and treated appropriately.
By defining and communicating specific usage policies, organisations could limit potentially harmful uses of the LLM. This could also be used to then inform real-time monitoring and oversight of the LLM. Real-time monitoring means that problematic uses or responses from the LLM are flagged and handled appropriately, and it can inform preventative training of employees. Using sentiment analysis of the recorded prompts and outputs could also identify discriminatory or hateful speech, contributing to a more ethical system.
B.7. Concluding Remarks
LLMs could offer new opportunities for practitioners, but the nature of LLMs mean there are additional risks that need to be accounted for. Further research is required to truly understand the impact this will have on the actuarial profession and whether it could be used successfully and ethically within actuarial work.
Through our research, we have not come across any best practice examples of comprehensive governance frameworks in the context of LLMs.
Final food for thought, “LLMs Produce Text That Sounds Right but Cannot Guarantee That It Is Right” (Dataiku, 2023).


 Open access