


Impact statements
Mental health issues, including assessment, diagnosis and treatment, are lagging in many African countries due to limited culturally validated scales. That is, most of these scales are validated in different cultural settings (which may be different from these African countries) and so lack validity in many African countries and specifically Ghana. This study intends to rectify this by validating eight selected mental health measures that can be used to assess depression, anxiety, somatic symptoms, obsessive–compulsive symptoms, insomnia, smartphone application-based addiction, internet addiction and life satisfaction among Ghanaian youth. The findings revealed that the psychometric properties of all the measures are acceptable. This also suggests that the Generalised Anxiety Disorder (GAD) scale, Patient Health Questionnaire-9 (PHQ-9), Somatic Symptom Scale-8 (SSS-8), Florida Obsessive–Compulsive Inventory (FOCI), Insomnia Severity Index (ISI), Smartphone Application-Based Addiction Scale (SABAS), Internet Addiction Test-6 (IAT-6), and Brief Multidimensional Students’ Life Satisfaction Scale (BMSLSS) are culturally appropriate measures that could be used to assess youths’ mental health challenges. Importantly, healthcare professionals (e.g. clinical psychologists, counsellors) and researchers may use these scales for clinical (e.g. counselling and therapeutic purposes) and research purposes, respectively, for assessing mental health variables among Ghanaian youth. Also, these tools may serve as the basis for health policymakers to allocate more resources to mental health services and be proactive with policy initiatives that aim at early identification of mental health challenges among youths in Ghana.
Introduction
Mental health conditions are increasing rapidly among youths, which has a significant impact on their general health, academics and other important areas of functioning (Ahorsu et al., Reference Ahorsu, Adjaottor, Yeboah and Opoku2021; McGorry et al., Reference McGorry, Gunasiri, Mei, Rice and Gao2025). The peak age of onset of mental disorders (e.g. anxiety, obsessive–compulsive, schizophrenia-spectrum disorders and mood disorders) is about 14.5 years (Solmi et al., Reference Solmi, Radua, Olivola, Croce, Soardo, Salazar de Pablo, Il Shin, Kirkbride, Jones, Kim, Kim, Carvalho, Seeman, Correll and Fusar-Poli2022), with 62.5% representing the proportion of individuals suffering from the onset of any mental disorders before the age of 25 years (Solmi et al., Reference Solmi, Radua, Olivola, Croce, Soardo, Salazar de Pablo, Il Shin, Kirkbride, Jones, Kim, Kim, Carvalho, Seeman, Correll and Fusar-Poli2022). This peak age and onset age suggest that the majority of mental health conditions occur during the youthful period which signifies the importance of having measurement scales to objectively assess these mental health conditions so as to assist with preventive and intervention programmes. The causes of these mental health conditions have been attributed to several factors such as biological predisposition (e.g. genetics), environmental factors (e.g. life experiences, social stress and trauma) and social factors (e.g. social isolation and loneliness, discrimination and stigma) (Kirkbride et al., Reference Kirkbride, Anglin, Colman, Dykxhoorn, Jones, Patalay, Pitman, Soneson, Steare, Wright and Griffiths2024). The combination of these factors enables an integrated approach to understanding how biological, psychological and social factors interact to influence overall mental health and well-being. The biopsychosocial model offers the most comprehensive explanation of the interconnections (or combination) between these factors (Tripathi et al., Reference Tripathi, Das and Kar2019) and, consequently, the needed selection of the measures for this study.
Mental health conditions such as insomnia, obsessive–compulsive disorder (OCD), depression, anxiety, and somatic symptoms are found to be linked together either via the insomnia–obsessive–compulsive–anxiety network or as emotional disorders (Jurado-González et al., Reference Jurado-González, García-Torres, Contreras, Muñoz-Navarro, González-Blanch, Medrano, Ruiz-Rodríguez, Cano-Vindel and Moriana2024; Yuan et al., Reference Yuan, Wang, Shi, Zhao, Tao, Wu, Tan and Ouyang2025). The close association of these symptoms (i.e. insomnia, OCD, depression, anxiety, and somatic symptoms) creates comorbidity (Kaczkurkin et al., Reference Kaczkurkin, Tyler, Turk-Karan, Belli and Asnaani2021; Palagini et al., Reference Palagini, Miniati, Caruso, Alfi, Geoffroy, Domschke, Riemann, Gemignani and Pini2024; Cheng et al., Reference Cheng, Chen, Wu, Li, Shen, Qiu, Tang, Feng, Wang, Lv, Yuan and Liu2025; Yuan et al., Reference Yuan, Wang, Shi, Zhao, Tao, Wu, Tan and Ouyang2025), which worsens the health of youths (Riddle et al., Reference Riddle, Guzick, Minhajuddin, Smárason, Armstrong, Slater, Mayes, Goodman, Baughn, Martin, Wakefield, Blader, Brown, Goodman, Trivedi and Storch2023). Therefore, there is a need for valid non-invasive measurement scales to help clinicians assess these interrelated mental health conditions. The measures, Generalised Anxiety Disorder (GAD) scale, Patient Health Questionnaire-9 (PHQ-9), Somatic Symptom Scale-8 (SSS-8), Florida Obsessive–Compulsive Inventory (FOCI), and Insomnia Severity Index (ISI), as used for anxiety, depression, somatic symptoms, obsessive–compulsive disorder symptoms and insomnia severity, were validated in this study. Apart from these scales being reliable and well-known (Hybelius et al., Reference Hybelius, Kosic, Salomonsson, Wachtler, Wallert, Nordin and Axelsson2024), they are appropriate presently, as these conditions are significantly related and prevalent among youths (Riddle et al., Reference Riddle, Guzick, Minhajuddin, Smárason, Armstrong, Slater, Mayes, Goodman, Baughn, Martin, Wakefield, Blader, Brown, Goodman, Trivedi and Storch2023) nowadays.
Furthermore, the advent of technology exacerbates the situation, as the majority of youths rely on digital devices and the internet to stay informed about current events and social issues (Odgers and Jensen, Reference Odgers and Jensen2020). The main issues lie not in the use, but in the problematic use of digital devices and the internet. Youths have been reported to have problematic use of digital devices and the internet which includes fear of missing out, smartphone application-based addiction, internet gaming addiction, social media addiction, online shopping addiction, online gambling addiction, and cybersex/pornography addiction (Reddy, Reference Reddy2021; Oppong et al., Reference Oppong, Adjaottor, Addo, Nyaledzigbor, Ofori-Amanfo, H-P and Ahorsu2022; Phetphum et al., Reference Phetphum, Keeratisiroj and Prajongjeep2023; Ahorsu, Reference Ahorsu2024; Huang et al., Reference Huang, Geusens, Tu, Fung and Chen2024a,Reference Huang, Ahorsu, Adjaottor, Addo, Griffiths, Pakpour and Linb; Siaw et al., Reference Siaw, Chua, Ruckwongpatr, Tung, Gan, Poon, Nadhiroh, Nurmala, Üztemur, Chen, Griffiths and Lin2025; Wolgast et al., Reference Wolgast, Adler and Nurali Wolgast2025). Additionally, the majority of these problematic behaviours are significantly associated with each other and other mental health conditions (Oppong et al., Reference Oppong, Adjaottor, Addo, Nyaledzigbor, Ofori-Amanfo, H-P and Ahorsu2022; Huang et al., Reference Huang, Ahorsu, Adjaottor, Addo, Griffiths, Pakpour and Lin2024b; Shiferaw et al., Reference Shiferaw, Tang, Wang, Wang, Wang, Mackay, Luo, Yan, Shen, Zhou, Zhu, Cai, Wang, Yan, Gao, Pan and Wang2025). Validating scales on smartphone application-based addiction (Smartphone Application-Based Addiction Scale; SABAS) and internet addiction (Internet Addiction Test-6; IAT-6) may help break the chain to problematic use of these devices, thereby limiting their effects on the mental health of youths (Li et al., Reference Li, Shi and Cai2022). The appropriate and constructive use of these devices enhances social support (i.e. connections with peers and family), learning and information access, creativity and career opportunities, ultimately improving life satisfaction (Canadian Paediatric Society, Digital Health Task Force, Ottawa, Ontario, 2019; Haddock et al., Reference Haddock, Ward, Yu and O’Dea2022; Ayllón et al., Reference Ayllón, Brugarolas, Lado, Holmarsdottir, Seland and Roth2024; Jiang et al., Reference Jiang, Xie and Shao2024).
In Ghana, the situation is not significantly different. The prevalence of depression (39.2–49%), anxiety (62.1%), somatic symptoms (59.5%), smartphone application-based addiction (29.1%), internet addiction (13.1–36.3%), and sleep problems (48.5%) reported among Ghanaian youth are still high (Oppong Asante et al., Reference Oppong Asante, Meyer-Weitz and Petersen2015; Oppong Asante and Andoh-Arthur, Reference Oppong Asante and Andoh-Arthur2015; Glozah and Pevalin, Reference Glozah and Pevalin2017; Nyundo et al., Reference Nyundo, Manu, Regan, Ismail, Chukwu, Dessie, Njau, Kaaya and Smith Fawzi2020; Addy et al., Reference Addy, Agbozo, Runge-Ranzinger and Grys2021; Essel et al., Reference Essel, Vlachopoulos, Nyadu-Addo, Tachie-Menson, Baah and Owusu-Antwi2022; Ahorsu, Reference Ahorsu2024; Mahama et al., Reference Mahama, Edoh-Torgah, Miezah, Ammah and Amponsah2024). These high prevalence rates indicate the need for health professionals (e.g. counsellors and clinical psychologists) to focus more on thoroughly examining the main issues that are key to their mental health conditions. Moreover, there are significant associations between these mental health conditions, which suggests that one condition may trigger other conditions (Ahorsu et al., Reference Ahorsu, Adjaottor, Yeboah and Opoku2021; Ahorsu, Reference Ahorsu2024) which ultimately affects the life satisfaction of youths (Nyundo et al., Reference Nyundo, Manu, Regan, Ismail, Chukwu, Dessie, Njau, Kaaya and Smith Fawzi2020; Essel et al., Reference Essel, Vlachopoulos, Nyadu-Addo, Tachie-Menson, Baah and Owusu-Antwi2022). The key to identifying and thoroughly examining mental health conditions and guiding effective intervention strategies lies in the use of culturally validated scales. Additionally, other equally important mental health conditions such as OCD symptoms are prevalent among youths, though there is no known prevalence data among Ghanaians (Solmi et al., Reference Solmi, Radua, Olivola, Croce, Soardo, Salazar de Pablo, Il Shin, Kirkbride, Jones, Kim, Kim, Carvalho, Seeman, Correll and Fusar-Poli2022). Therefore, examining the psychometric properties of GAD, PHQ-9, SSS-8, FOCI, ISI, IAT-6 and satisfaction with life (Brief Multidimensional Students’ Life Satisfaction Scale, BMSLSS) will boost the resources available for Ghanaian health professionals to help the youths.
Some previous Ghanaian studies have provided the reliability indices of some of the scales (e.g. SABAS, SSS-8) (Glozah and Pevalin, Reference Glozah and Pevalin2017; Amissah et al., Reference Amissah, Christopher and Amponsah2022; Oppong et al., Reference Oppong, Adjaottor, Addo, Nyaledzigbor, Ofori-Amanfo, H-P and Ahorsu2022) and some (e.g. PHQ-9, GAD, SABAS) have even provided the validation indices (Adjorlolo, Reference Adjorlolo2019; Anum et al., Reference Anum, Adjorlolo and Kugbey2019; Huang et al., Reference Huang, Ahorsu, Adjaottor, Addo, Griffiths, Pakpour and Lin2024b). However, there are several limitations to the previous studies which included a limited sample category (i.e. either high school or undergraduate students) and mostly, a single-scale validation. Therefore, this study is necessary as (1) scales such as FOCI, ISI, AIT and BMSLSS have no reported psychometric properties among Ghanaian youth; (2) other scales such as PHQ-9 and SABAS used limited age group (i.e. ~15–18 years and ~18–24 years respectively) (Anum et al., Reference Anum, Adjorlolo and Kugbey2019; Huang et al., Reference Huang, Ahorsu, Adjaottor, Addo, Griffiths, Pakpour and Lin2024b) contrary to this study (i.e. youths – 10–29 years) and (3) some of the scales (i.e. GAD, FOCI and PHQ-9) used in this study have been adapted by the American Psychiatric Association (Reference Association2013) to reflect their respective criteria as in DSM-5, especially as there are no empirical studies on them among Ghanaians. Moreover, examining the psychometric properties of a group of mental health scales based on the biopsychosocial model (Tripathi et al., Reference Tripathi, Das and Kar2019) will help get a holistic picture of these scales with respect to other mental health conditions and life satisfaction. That is, simultaneous evaluation and comparison across multiple demographics (e.g. sex and educational level), and the inclusion of life satisfaction and fatigue as extensions, provide a holistic picture of how health professionals would see mental health conditions among youths. Additionally, validation across different age groups is necessary and important as it helps with knowing and navigating how age limits the usage (i.e. as scales can be used among youths, age 10–29 years) of these validated scales. This will help researchers and health professionals to examine mental health conditions that Ghanaian youth face thoroughly, knowing their direct relationships to their life satisfaction. Therefore, this study intends to examine the psychometric properties of the scales (i.e. GAD, PHQ-9, SSS-8, FOCI, ISI, SABAS, IAT-6, and BMSLSS) among Ghanaian youth. Specifically, the objectives of the study include examining: (1) the psychometric properties (reliability and validity) of the scales, (2) measurement invariance across sex and educational levels and (3) the relationships between these scales.
Methods
Participants and procedure
The present cross-sectional survey design study recruited 708 participants from the junior and senior high schools as well as a university (i.e. undergraduates) in Ghana to complete the questionnaire between May and July 2025. All the participants completed the questionnaire, which was presented on printed paper. Specifically, the research team approached four junior high schools and three senior high schools. However, only two junior high schools and one senior high school agreed to allow the researchers to conduct this study in their schools. For the junior high schools, when the headteacher permitted the study to be conducted in their schools, a date was set for the data collection. On the agreed date, a teacher was appointed to introduce the team to the students and to also serve as the guardian for these students. After introducing the research team, the team proceeded with introducing the study to the students. The teacher then left the classrooms during the distribution of the consent form and questionnaire. Only those students who were interested in the study were given the consent form and questionnaire. Sufficient space and time were given to each participant to complete the questionnaire, though they were informed that they could seek clarification of any item if they did not understand it. All the items were in the English language as it is the official language and medium of instruction in Ghanaian schools. A similar approach was used for recruiting senior high school students. In both the junior and senior high schools, the class teachers or house teachers served as the guardians to the students and signed the informed consents for the students. About 35 and 30 minutes were used for the entire data collection per class at the junior and senior high schools respectively.
For the university students, the research team approached individual lecturers for permission to use their classes for data collection. Three lecturers who teach core courses were approached and all of them agreed. Dates were set and on each agreed date, the lecturer introduced the research team at the start of the class. After the introduction, the lecturer left the class to provide privacy. The team informed the students about the nature of the study and those who were willing to be part of the study were given the consent form and then the questionnaire. About 25 minutes were used for the whole data collection.
Ethical approval for the study was obtained from the Human Research Ethics Committee of Central University (CUIRB/34/01/25). Consent forms were obtained from all participants before data collection. Class teachers or house teachers served as guardians for the minors. Also, the study complied with all other ethical principles, including confidentiality, data integrity and voluntary participation.
Measures
Severity measure for Generalised Anxiety Disorder (GAD)
The Severity Measure for Generalised Anxiety Disorder (GAD) is a 10-item scale, originally developed by Craske et al. (Reference Craske, Wittchen, Bogels, Stein, Andrews and Lebeu2013). It is used to assess the severity of generalised anxiety disorder based on DSM-5 criteria (American Psychiatric Association, Reference Association2013). This scale was chosen because of its adaptation to reflect APA’s DSM-5 criteria compared to the older versions. Each item is rated on a 5-point Likert scale, ranging from 0 (never) to 4 (all of the time). An example item from the scale is ‘felt moments of sudden terror, fear, or fright’. The total score, summation of the responses to the items, can range from 0 to 40, with higher scores indicating greater severity of generalized anxiety disorder.
Patient Health Questionnaire-9 (PHQ-9)
The Patient Health Questionnaire-9 (PHQ-9) is a 9-item scale, originally developed by Kroenke et al. (Reference Kroenke, Spitzer and Williams2001) and Johnson et al. (Reference Johnson, Harris, Spitzer and Williams2002), used to assess the severity of depression and has been adapted based on DSM-5 criteria (American Psychiatric Association, Reference Association2013). This scale was chosen because of its adaptation to reflect APA’s DSM-5 criteria compared to the old versions. Each item is rated on a 4-point Likert scale (0 = not at all; 1 = several days; 2 = more than half the days and 3 = nearly every day). An example item from the scale is ‘Poor appetite or overeating’. The total score (i.e. summation of the responses to the items) can range from 0 to 27 with higher scores indicating greater severity of depression.
Somatic Symptom Scale-8 (SSS-8)
The Somatic Symptom Scale-8 (SSS-8; Gierk et al., Reference Gierk, Kohlmann, Kroenke, Spangenberg, Zenger, Brähler and Löwe2014) is an 8-item scale used to assess somatic symptoms of participants. Each item is rated on a 5-point Likert scale, ranging from 0 (not at all) to 4 (very much). An example item from the scale is ‘Back pain’. The total score (i.e. summation of the responses to the items) can range from 0 to 32, with higher scores indicating greater severity of somatic symptoms. This scale was added to this study so as to get its full psychometric properties, especially as previous studies reported only the reliability indices (Glozah and Pevalin, Reference Glozah and Pevalin2017; Amissah et al., Reference Amissah, Christopher and Amponsah2022).
Florida Obsessive–Compulsive Inventory (FOCI)
The Florida Obsessive–Compulsive Inventory (FOCI) is a 5-item scale, originally developed by Storch et al. (Reference Storch, Bagner, Merlo, Shapira, Geffken, Murphy and Goodman2007), that is used to assess repetitive thoughts and behaviours (usually of OCD) based on DSM-5 criteria (American Psychiatric Association, Reference Association2013). This scale was chosen because of its adaptation to reflect APA’s DSM-5 criteria compared to the older versions. Each item is rated on a 5-point Likert scale ranging from 0 (none) to 4 (extreme). An example item from the scale is ‘How hard is it for you to control these thoughts or behaviours?’ The total score (i.e. summation of the responses to the items) can range from 0 to 20, with higher scores indicating greater severity of repetitive thoughts and behaviours.
Insomnia Severity Index (ISI)
The Insomnia Severity Index (ISI; Bastien et al., Reference Bastien, Vallières and Morin2001) is a 7-item scale used to assess insomnia severity. Each item is rated on a 5-point Likert-type scale, ranging from 0 (not at all) to 4 (very much). An example item from the scale is ‘How WORRIED/distressed are you about your current sleep problem?’ The total score (i.e. summation of the responses to the items) can range from 0 to 28, with higher scores indicating greater severity of insomnia. This scale was chosen as there is no known psychometric property data on it among Ghanaian youth.
Smartphone Application-Based Addiction Scale (SABAS)
The Smartphone Application-Based Addiction Scale (SABAS; Csibi et al., Reference Csibi, Griffiths, Cook, Demetrovics and Szabo2018) is a 6-item scale used to assess the problematic use (also called addiction) of smartphone applications. Each item is rated on a 6-point Likert-type scale, ranging from 1 (strongly disagree) to 6 (strongly agree). An example item from the scale is ‘My smartphone is the most important thing in my life’. The total score (i.e. summation of the responses to the items) can range from 6 to 36, with higher scores indicating greater smartphone addiction risk. This scale was added to this study so as to get the full psychometric properties, especially as a previous study reported only the psychometric properties of university students (Oppong et al., Reference Oppong, Adjaottor, Addo, Nyaledzigbor, Ofori-Amanfo, H-P and Ahorsu2022; Huang et al., Reference Huang, Ahorsu, Adjaottor, Addo, Griffiths, Pakpour and Lin2024b).
Internet Addiction Test-6 (IAT-6)
The Internet Addiction Test-6 (IAT-6; Ali et al., Reference Ali, Hendawy, Almarwani, Alzahrani, Ibrahim, Alkhamees and Kunugi2021) is a 6-item scale used to assess an individual’s internet addiction status. Each item is rated on a 6-point Likert-type scale, ranging from 0 (not applicable) to 5 (very often). An example item from the scale is ‘Do you find yourself saying “Just a few more minutes” when online?’ Scores for all items are summed to obtain a total score, which ranges from 0 to 30. Higher scores indicate a greater risk of internet addiction. This scale was chosen as there is no known psychometric property data on it among Ghanaian youth.
Brief Multidimensional Students’ Life Satisfaction Scale (BMSLSS)
The Brief Multidimensional Students’ Life Satisfaction Scale (BMSLSS; Seligson et al., Reference Seligson, Huebner and Valois2003) is a 5-item scale used to assess students’ life satisfaction. Each item is rated on a 7-point Likert-type scale, ranging from 1 (terrible) to 7 (delighted). An example item from the scale is ‘I would describe my satisfaction with my school experiences as, …’. The total life satisfaction score (i.e. summation of the responses to the items) can range from 5 to 35. Higher scores reflect greater overall life satisfaction. This scale was added so as to get full psychometric properties among Ghanaian youth as well as to examine their relationships with other mental health conditions.
Stress from Depression Anxiety Stress Scale for Youth (DASS-Y)
The 7-item stress subscale of the Depression Anxiety Stress Scale for Youth (DASS-Y; Szabo and Lovibond, Reference Szabo and Lovibond2022) is used to assess the stress severity of participants. This scale was added to help extend the validity of the other mental health scales used in this study. Each item is rated on a 4-point Likert-type scale ranging from 0 (not true) to 3 (very true), with a sample item being ‘I got upset about little things’. The total stress score (i.e. summation of the responses to the items) can range from 0 to 21, with higher scores reflecting a more severe stress. The Cronbach’s α and McDonald’s ω of this scale are 0.812 and 0.814, respectively.
PedsQL Multidimensional Fatigue Scale (PedsQL-MFS)
The 6-item cognitive fatigue subscale of the PedsQL Multidimensional Fatigue Scale (PedsQL-MFS; Varni and Limbers, Reference Varni and Limbers2008) is used to assess the severity of cognitive fatigue of participants. This scale was added to help extend the validity of the other mental health scales used in this study. A sample item being ‘It is hard for me to keep my attention on things’. Each item is rated on a 5-point Likert scale from 0 (never a problem) to 4 (almost always a problem), but reverse-scored and rescaled to 0–100, such that the ‘0’ and ‘4’ in the Likert scale were now transformed into scores of 100 and 0 (i.e. 100, 75, 50, 25 and 0) respectively. Therefore, a total score (i.e. the mean of all reversed and transformed item scores) can range from 0 to 100, with higher scores reflecting a less severe cognitive fatigue. The α and ω of this scale are 0.843 and 0.844, respectively.
Data analysis
Descriptive statistics (including mean and percentage) were first used to analyse the participants’ demographic characteristics and item properties. Subsequently, each measure was evaluated for its scale properties using confirmatory factor analysis (CFA) and internal consistency. More specifically, all measures were evaluated to see if they fit well with a one-factor structure in the CFA using weighted least squares with mean and variance adjusted (WLSMV) estimator. The WLSMV estimator was used because all measures were scored on a Likert-type scale; that is, an ordinal scale (Li, Reference Li2016). Moreover, considering that some measures have been reported to have factor structures other than a one-factor structure, their alternative factor structures were evaluated and competed with the one-factor structure. Specifically, the PHQ-9 has another 2 two-factor structures (Boothroyd et al., Reference Boothroyd, Dagnan and Muncer2019; Blake et al., Reference Blake, Munyombwe, Fischer, Quinn, Van der Feltz-Cornelis, De Man-van Ginkel, Santos, Jeon, Köhler, Schram, Wang, Levin-Aspenson, Whooley, Hobfoll, Patten, Simning, Gracey and Broomfield2025); the SSS-8 has a three-factor structure and a four-factor structure (Li et al., Reference Li, Wei, Fritzsche, Toussaint, Zhang, Zhang, Chen, Wu, Ma, Li, Ren, Lu and Leonhart2022; Hybelius et al., Reference Hybelius, Kosic, Salomonsson, Wachtler, Wallert, Nordin and Axelsson2025), and the ISI has another 2 two-factor structures (Otte et al., Reference Otte, Bakoyannis, Rand, Ensrud, Guthrie, Joffe, McCurry, Newton and Carpenter2019; Liang et al., Reference Liang, Labarda and Chan2023; Lenderking et al., Reference Lenderking, Savva, Atkinson, Campbell, Chabot, Moline, Meier and Morin2024). Regarding the evaluation of fit in these one-factor structures and alternative factor structures, comparative fit index (CFI), Tucker–Lewis index (TLI), root mean square error of approximation (RMSEA), and standardized root mean square residual (SRMR) were used. When CFI with TLI >0.9 and RMSEA with SRMR <0.08, one can conclude the fit of that evaluated one-factor structure is acceptable (Hoyle and Panter, Reference Hoyle, Panter and Hoyle1995). However, when the competing models share good fit indices, those with the best fit indices were then used to conduct measurement invariance across educational level (junior high vs. senior high vs. university) and sex (female vs. male). In measurement invariance tests, three nested models were constructed for each measure via multi-group CFA (Steinmetz et al., Reference Steinmetz, Schmidt, Tina-Booh, Siegrid and Schwartz2009): a configural model (no constraints were applied), a metric invariance model (all factor loadings were constrained to be equal across the sub-groups), and a scalar invariance model (all factor loadings and item intercepts were constrained to be equal across the sub-groups). The nested models were compared using the changes in CFI (i.e. ΔCFI), RMSEA (i.e. ΔRMSEA), and SRMR (i.e. ΔSRMR). When ΔCFI >−0.01 together with ΔRMSEA <0.015 and ΔSRMR <0.03/0.01 (metric invariance/scalar invariance), the invariance is supported for that tested measure (Chen, Reference Chen2007).
Rasch analysis were also performed to examine the unidimensionality of all measures using the rating scale model. In Rasch analysis, information-weighted mean square (infit MnSq) and outlier-sensitivity mean square (outfit MnSq) were used to evaluate if all items fit well within each measure’s construct. Infit and outfit MnSq values between 0.5 and 1.5 indicate good fit (Linacre, Reference Linacre2002). Moreover, person separation reliability was calculated for the entire measure, and a value >0.7 indicates good separation reliability (Souza et al., Reference Souza, Coster, Mancini, Dutra, Kramer and Sampaio2017). In terms of internal consistency, Cronbach’s α and McDonald’s ω were calculated for each measure. When both α and ω are > 0.7 for a measure, that measure is considered to have acceptable internal consistency (Taber, Reference Taber2018). In addition, factor loadings derived from CFA and corrected item-to-total correlations (CITC) were calculated for each item in every measure to evaluate if each item contributes substantially to the scale it belongs; factor loadings and CITC >0.3 indicate acceptable (Mokkink et al., Reference Mokkink, Terwee, Patrick, Alonso, Stratford, Knol, Bouter and De Vet2010; Tavakol and Dennick, Reference Tavakol and Dennick2011; Boateng et al., Reference Boateng, Neilands, Frongillo, Melgar-Quiñonez and Young2018). Finally, Pearson’s correlations with heatmap were used to understand the inter-measure correlations among all tested measures. All analyses were conducted using the JASP version 0.19.3.0 (JASP Team; Amsterdam, The Netherlands) and jamovi version 2.3.21 (jamovi tam; Sydney, Australia).
Results
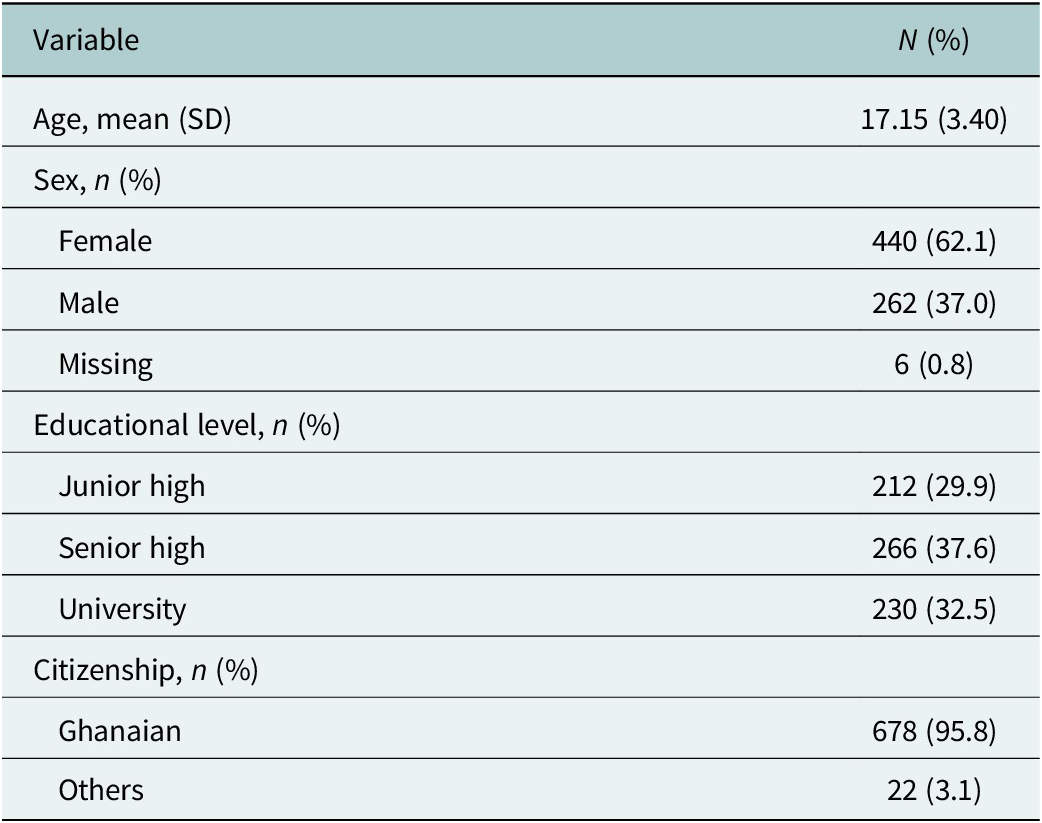
Table 1 shows the demographic characteristics of the youths used in the study. A total of 708 youths responded to the questionnaire with a mean age of 17.15 years (SD = 3.40), with the majority of the participants being females (n = 440, 62.1%), senior high school students (n = 266, 37.6%) and Ghanaians (n = 678, 95.8%). Table 1 has further details.
Demographics (n = 708)

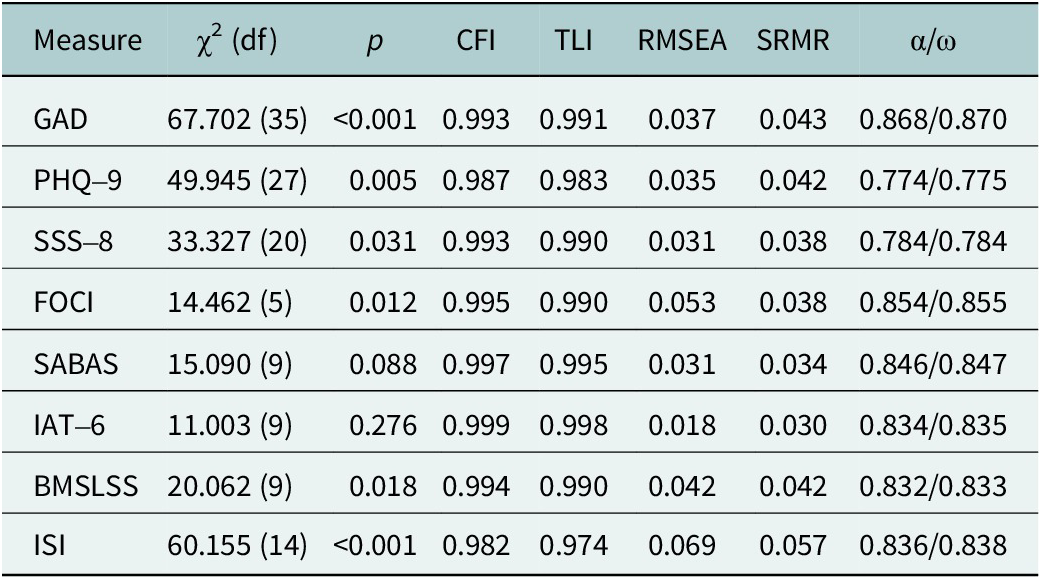
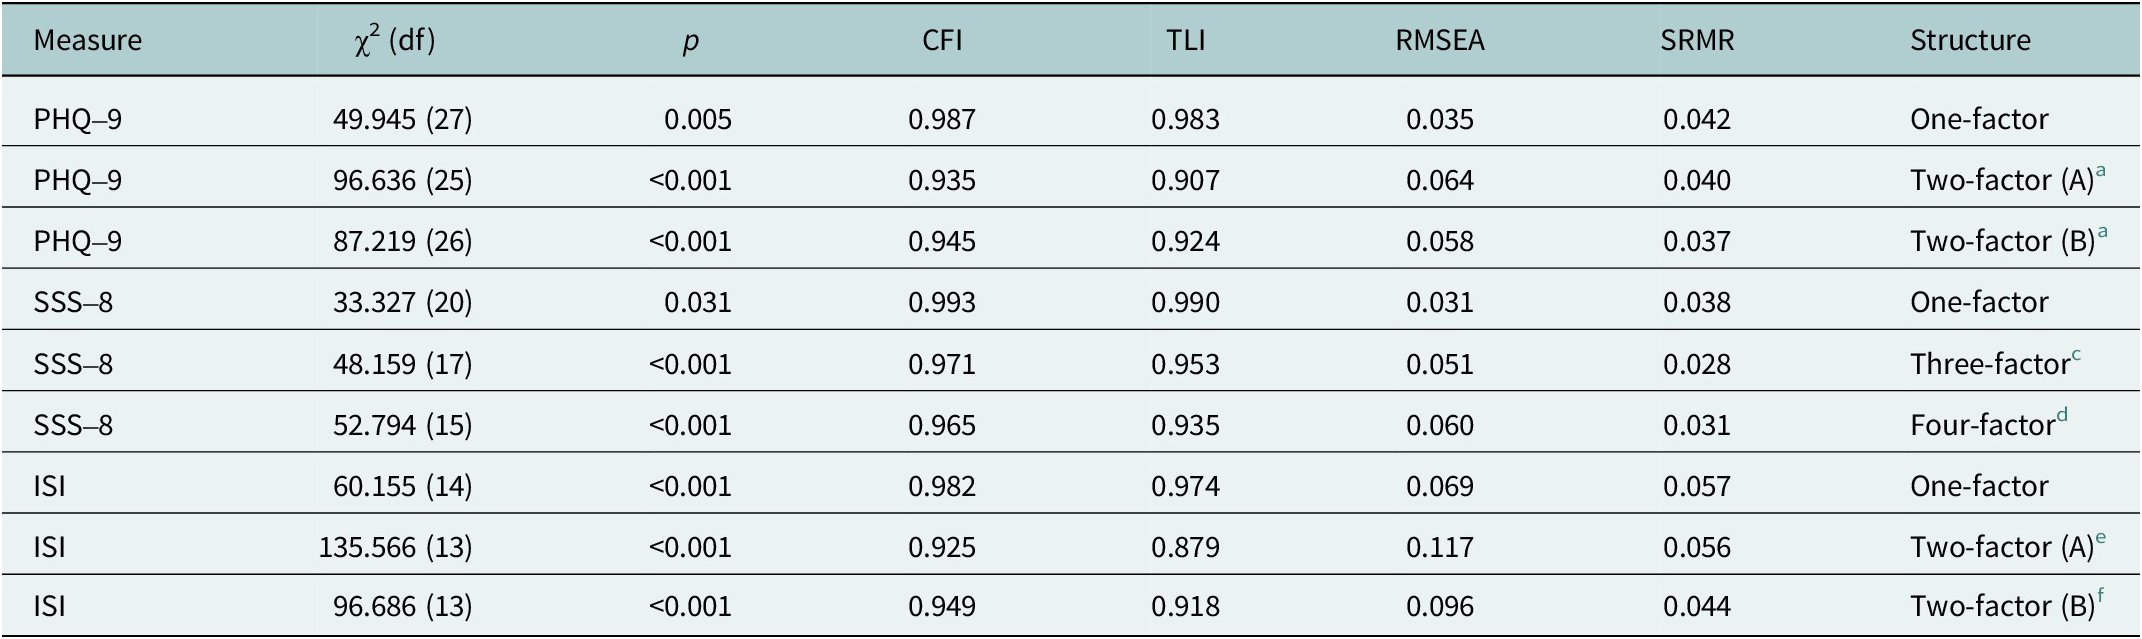
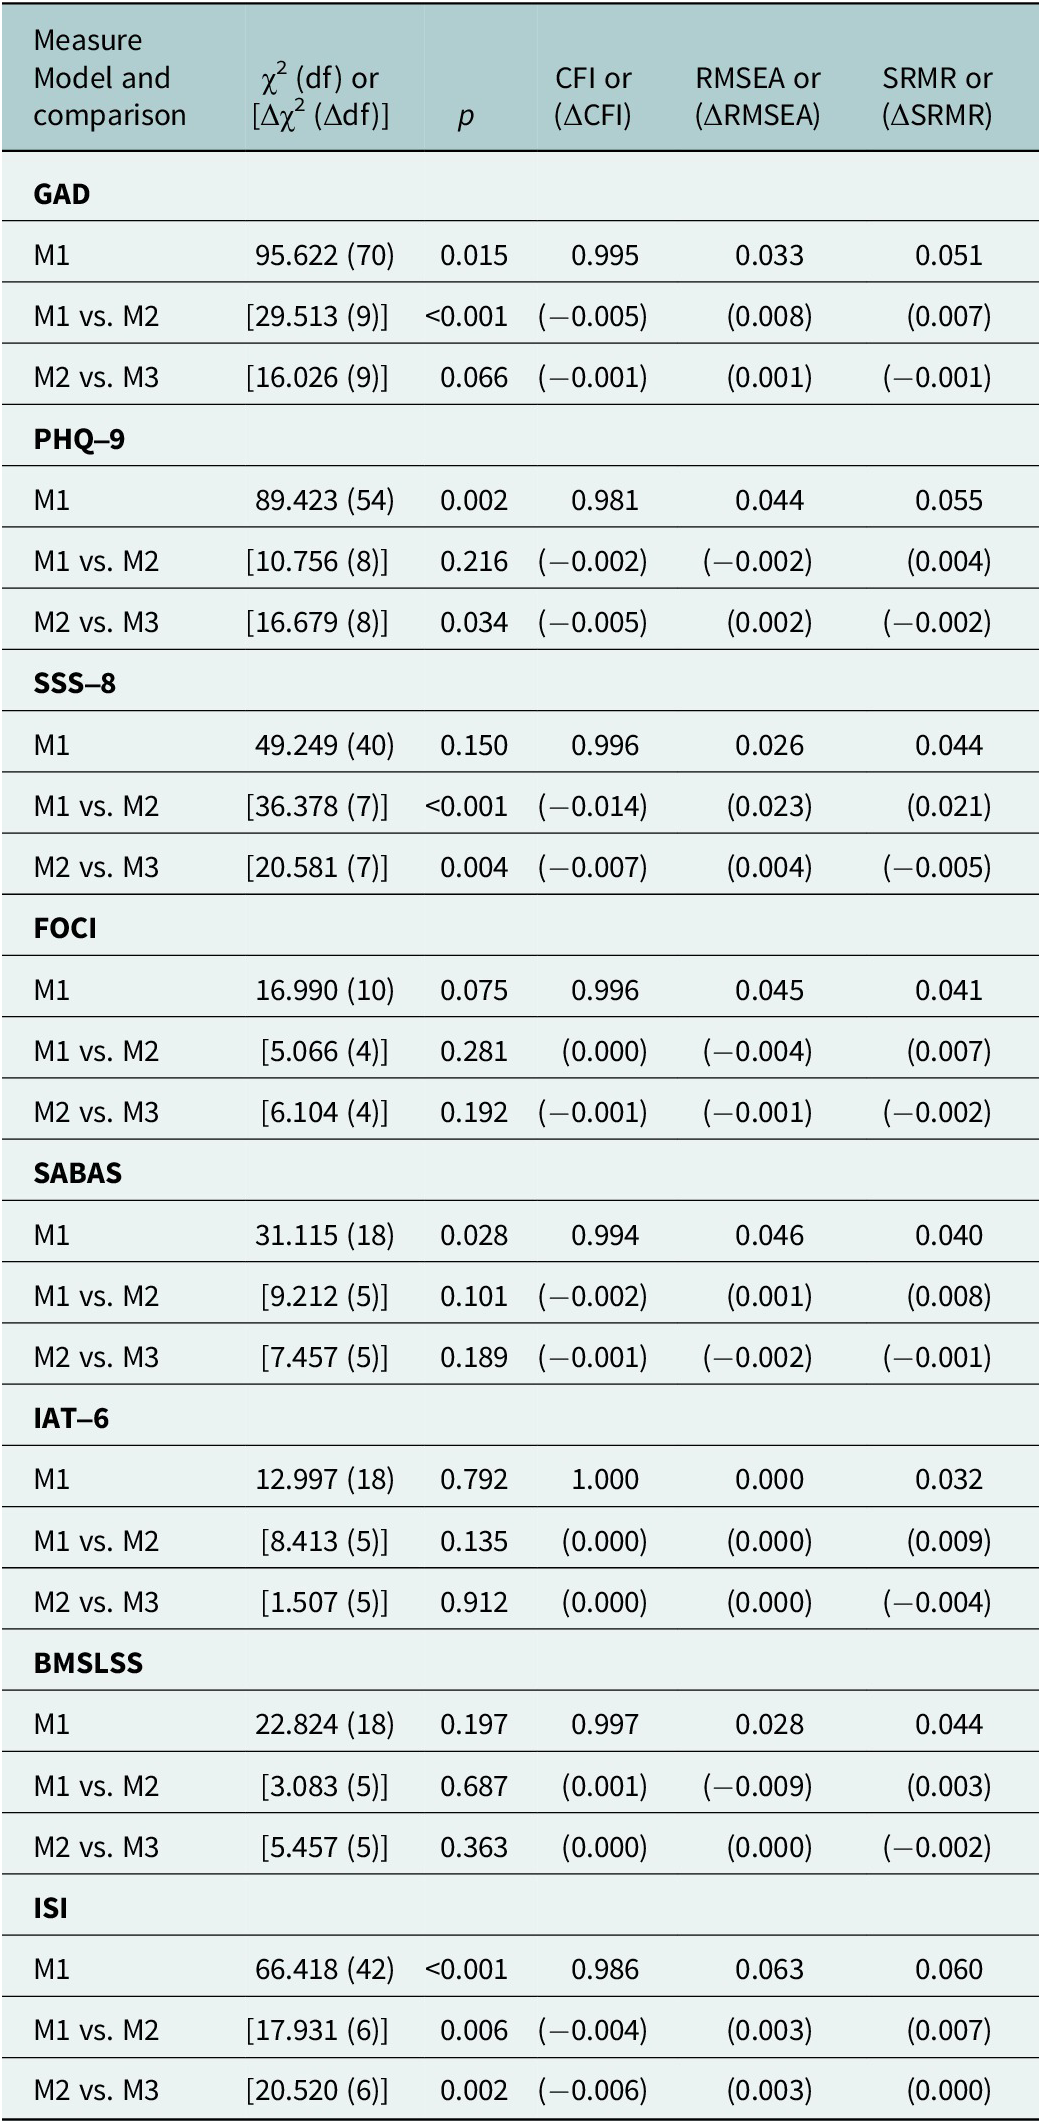
Table 2 shows the CFA fit indices of eight psychological measures (i.e. GAD, PHQ-9, SSS-8, FOCI, SABAS, IAT-6, BMSLSS, and ISI). All the CFA fit indices of the psychological measures were acceptable (CFI >0.9, TLI >0.9, RMSEA <0.08, and SRMR <0.08). Specifically, the CFA fit indices for GAD (CFI = 0.993, TLI = 0.991, RMSEA = 0.037, and SRMR = 0.043), PHQ-9 (CFI = 0.987, TLI = 0.983, RMSEA = 0.035, and SRMR = 0.042), SSS-8 (CFI = 0.993, TLI = 0.990, RMSEA = 0.031, and SRMR = 0.038), FOCI (CFI = 0.995, TLI = 0.990, RMSEA = 0.053, and SRMR = 0.038), SABAS (CFI = 0.997, TLI = 0.995, RMSEA = 0.031, and SRMR = 0.034), IAT-6 (CFI = 0.999, TLI = 0.998, RMSEA = 0.018, and SRMR = 0.030), BMSLSS (CFI = 0.994, TLI = 0.990, RMSEA = 0.042, and SRMR = 0.042) and ISI (CFI = 0.982, TLI = 0.974, RMSEA = 0.069, and SRMR = 0.057) were all within the acceptable limits. See Table 2 for further details. Moreover, for the measures with alternative models (i.e. PHQ-9, SSS-8, and ISI), the one-factor structure performed the best (Table 3). In this regard, the one-factor structure of all measures was used to test for measurement invariance. Tables 4 and 5 show the measurement invariance findings. In terms of invariance across educational level, SABAS, IAT-6 and BMSLSS were invariant, while the other measures (GAD, PHQ-9, SSS-8, FOCI, and ISI) were not (Table 4). In terms of invariance across sex, only SSS-8 was not invariant; all other measures were invariant (Table 5).
Confirmatory factor analysis (CFA) fit indices and internal consistency of the measures

Note: GAD, Severity Measure For Generalised Anxiety Disorder; PHQ-9, Patient Health Questionnaire-9; SSS-8, Somatic Symptom Scale-8; FOCI, Florida Obsessive–Compulsive Inventory; SABAS, Smartphone Application-Based Addiction Scale; IAT-6, Internet Addiction Test-6; BMSLSS, Brief Multidimensional Students’ Life Satisfaction Scale; ISI, Insomnia Severity Index; CFI, Comparative Fit Index; TLI, Tucker–Lewis Index; RMSEA, root mean square error of approximation; SRMR, standardized root mean square residual.
Confirmatory factor analysis (CFA) fit indices for competing models of measures with different factor structure

Note: PHQ-9, Patient Health Questionnaire-9; SSS-8, Somatic Symptom Scale-8; ISI, Insomnia Severity Index; CFI, Comparative Fit Index; TLI, Tucker–Lewis Index; RMSEA, root mean square error of approximation; SRMR, standardized root mean square residual.
a The first factor with items 1, 2, 6 and 9; the second factor with items 3, 4, 5, 7 and 8.
b The first factor with items 1, 2, 5, 7, 8 and 9; the second factor with items 3, 4 and 5.
c The first factor with items 1, 7 and 8; the second factor with items 2 and 3; the third factor with items 4–6.
d The first factor with items 1; the second factor with items 2–4; the third factor with items 5 and 6; the fourth factor with items 7 and 8.
e The first factor with items 1–4; the second factor with items 5–7.
f The first factor with items 1–3; the second factor with items 4–7.
Measurement invariance findings across educational level

Note: GAD, Severity Measure for Generalised Anxiety Disorder; PHQ-9, Patient Health Questionnaire-9; SSS-8, Somatic Symptom Scale-8; FOCI, Florida Obsessive–Compulsive Inventory; SABAS, Smartphone Application-Based Addiction Scale; IAT-6, Internet Addiction Test-6; BMSLSS, Brief Multidimensional Students’ Life Satisfaction Scale; ISI, Insomnia Severity Index; M1, configural model; M2, metric invariance model; M3, scalar invariance model.
Measurement invariance findings across sex

Note: GAD, Severity Measure for Generalised Anxiety Disorder; PHQ-9, Patient Health Questionnaire-9; SSS-8, Somatic Symptom Scale-8; FOCI, Florida Obsessive–Compulsive Inventory; SABAS, Smartphone Application-Based Addiction Scale; IAT-6, Internet Addiction Test-6; BMSLSS, Brief Multidimensional Students’ Life Satisfaction Scale; ISI, Insomnia Severity Index; M1, configural model; M2, metric invariance model; M3, scalar invariance model.
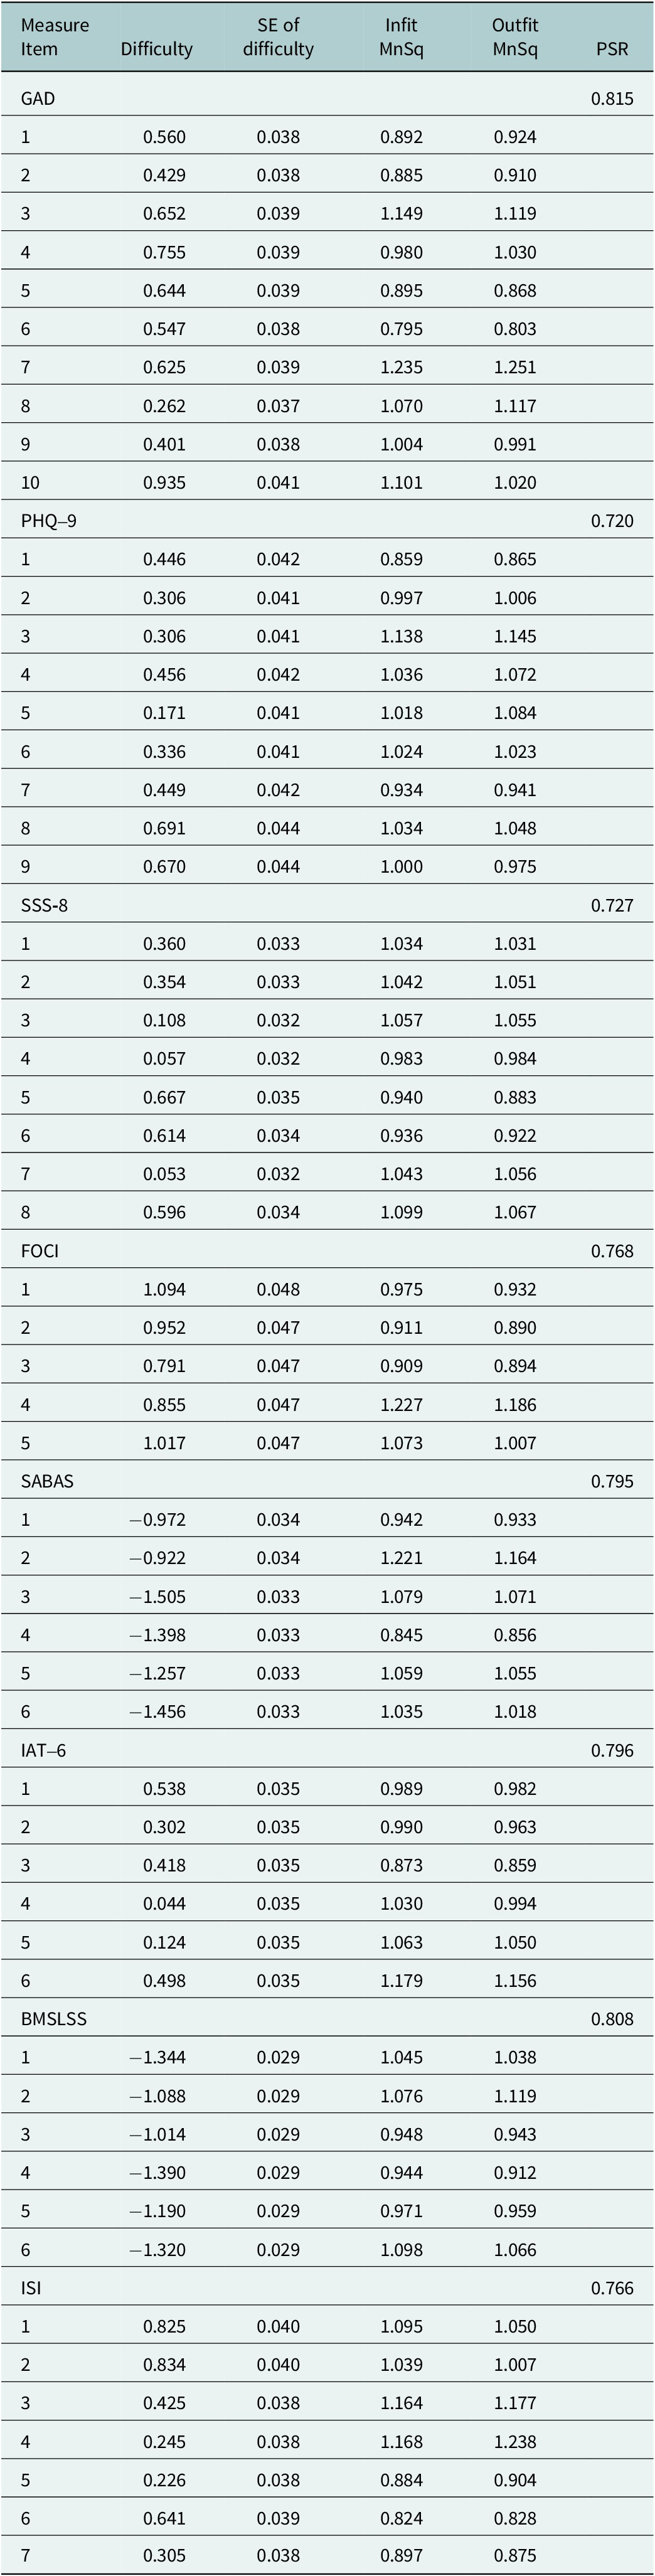
Rasch analyses additionally support the unidimensionality of all the measures with infit and outfit MnSq between 0.5 and 1.5 together with person separation reliability all larger than 0.7 (Table 6). Also, the internal reliability coefficients (i.e. Cronbach’s α and McDonald’s ω) were generally acceptable (α = 0.774–0.868 and ω = 0.775–0.870). More specifically, GAD had good reliability coefficients (α = 0.868 and ω = 0.870), PHQ-9 (α = 0.774 and ω = 0.775) and SSS-8 (α = 0.784 and ω = 0.784) had acceptable reliability coefficients, FOCI (α = 0.854 and ω = 0.855), SABAS (α = 0.846 and ω = 0.847), IAT-6 (α = 0.834 and ω = 0.835), BMSLSS (α = 0.832 and ω = 0.833), and ISI (α = 0.836 and ω = 0.838) had good reliability coefficients (see Table 7).
Rasch model results for the measures

Note: GAD, Severity Measure for Generalised Anxiety Disorder; PHQ-9, Patient Health Questionnaire-9; SSS-8, Somatic Symptom Scale-8; FOCI, Florida Obsessive–Compulsive Inventory; SABAS, Smartphone Application-Based Addiction Scale; IAT-6, Internet Addiction Test-6; BMSLSS, Brief Multidimensional Students’ Life Satisfaction Scale; ISI, Insomnia Severity Index; Infit MnSq, information-weighted mean square; Outfit MnSq, outlier-sensitivity mean square; PSR, person separation reliability.
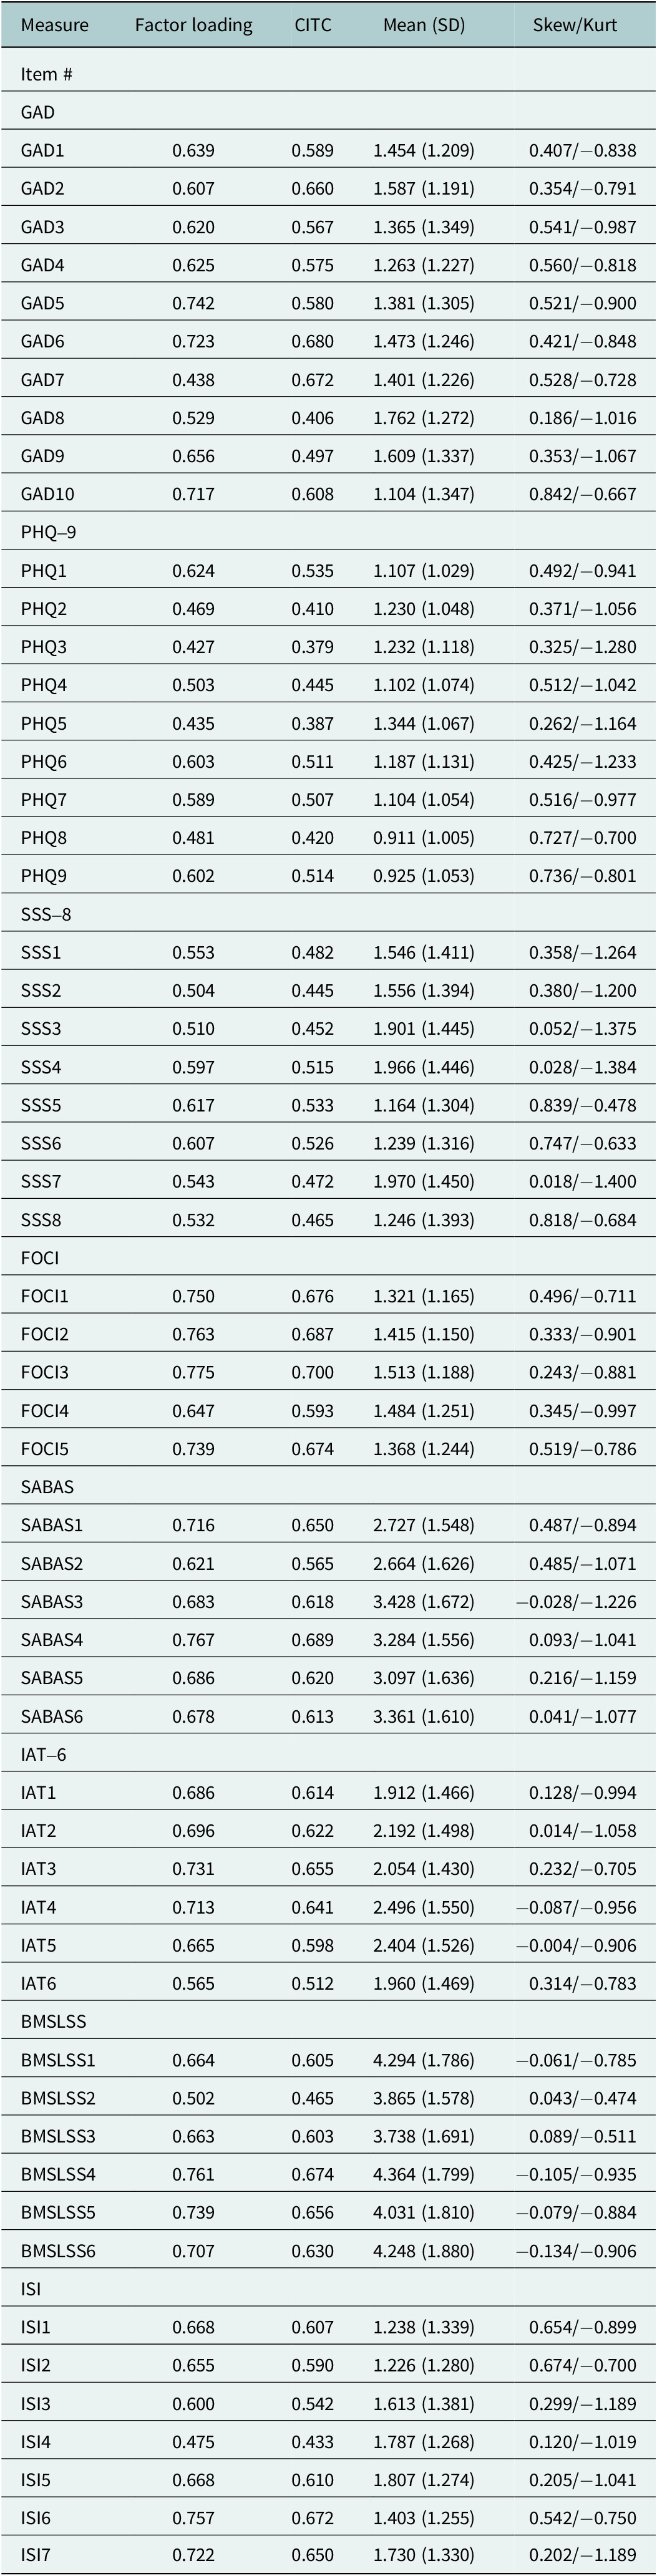
Factor loadings, corrected item-to-total correlations (CITCs) and item means for measures

Note: GAD, Severity Measure for Generalised Anxiety Disorder; PHQ-9, Patient Health Questionnaire-9; SSS-8, Somatic Symptom Scale-8; FOCI, Florida Obsessive–Compulsive Inventory; SABAS, Smartphone Application-Based Addiction Scale; IAT-6, Internet Addiction Test-6; BMSLSS, Brief Multidimensional Students’ Life Satisfaction Scale; ISI, Insomnia Severity Index; Skew/Kurt, skewness/kurtosis.
Table 7 shows the factor loadings, CITC and item means for each of the psychological measures. All the items for each of the measures were acceptable (i.e. >0.30) with corrected item-to-total correlations between 0.379 and 0.700. Specifically, GAD had factor loadings between 0.438 and 0.742 and CITC between 0.406 and 0.680, PHQ-9 factor loadings between 0.427 and 0.624 and CITC between 0.379 and 0.535, SSS-8 factor loadings between 0.504 and 0.617 and CITC between 0.445 and 0.533, FOCI factor loadings between 0.647 and 0.775 and CITC between 0.593 and 0.700, SABAS factor loadings between 0.621 and 0.767 and CITC between 0.565 and 0.689, IAT-6 factor loadings between 0.565 and 0.731 and CITC between 0.512 and 0.655, BMSLSS factor loadings between 0.502 and 0.761 and CITC between 0.465 and 0.674, and ISI factor loadings between 0.475 and 0.757 and CITC between 0.433 and 0.672.
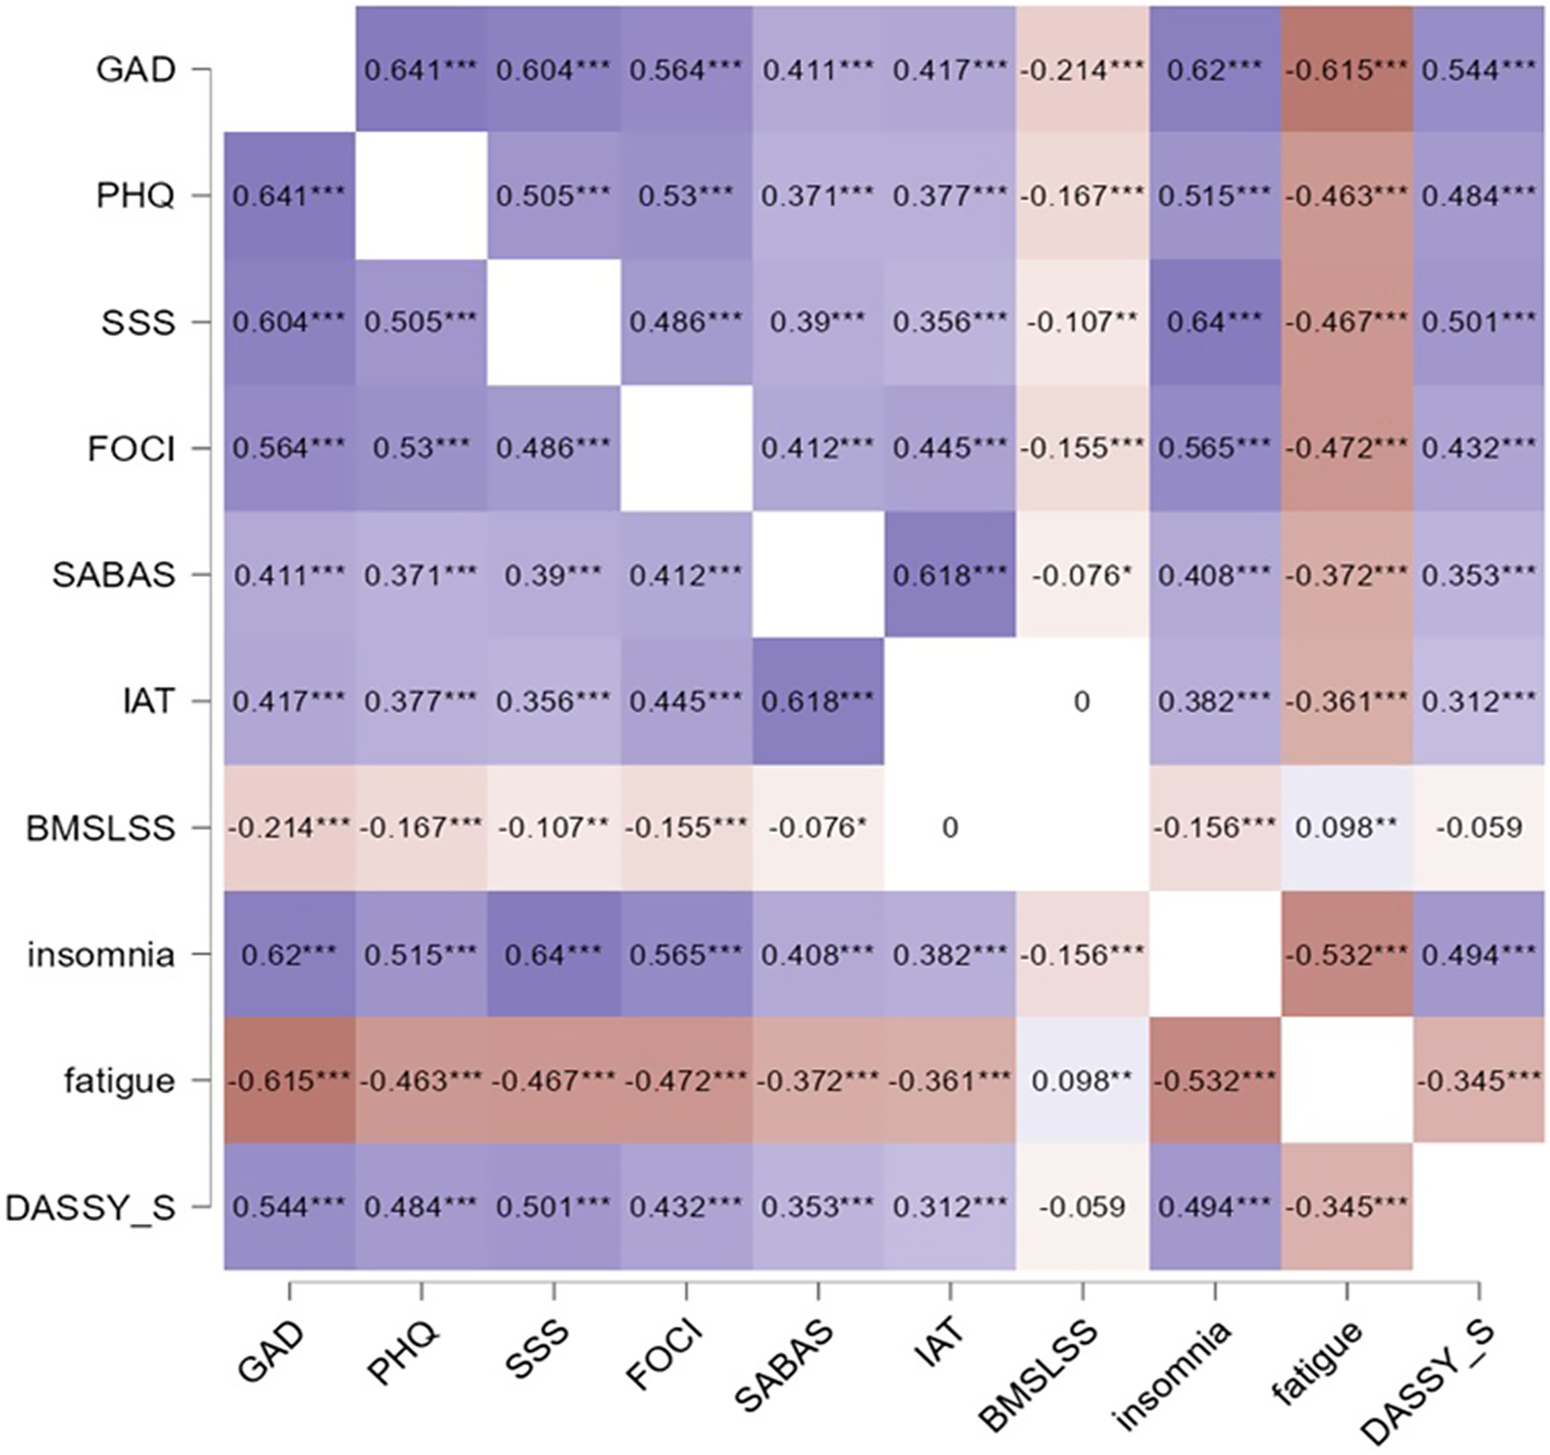
Figure 1 shows the correlations between all the eight psychological measures. There were significant correlations between all the eight psychological measures except for BMSLSS and IAT-6 (absolute r < 0.001, p > 0.05) and DASS-S and BMSLSS (r = –0.059, p > 0.05).
Correlations between the measures and two external criterion measures (PedsQL fatigue scale and DASS-Y stress scale). Note: *p < 0.05; **p < 0.01; ***p < 0.001. GAD, Severity Measure for Generalised Anxiety Disorder; PHQ-9, Patient Health Questionnaire-9; SSS-8, Somatic Symptom Scale-8; FOCI, Florida Obsessive–Compulsive Inventory; SABAS, Smartphone Application-Based Addiction Scale; IAT-6, Internet Addiction Test-6; BMSLSS, Brief Multidimensional Students’ Life Satisfaction Scale; ISI, Insomnia Severity Index; Fatigue, PedsQL fatigue subscale; DASSY_S, stress subscale of depression, anxiety, stress scale for youth.

Discussion
This study examined the psychometric properties of eight scales (i.e. GAD, PHQ-9, SSS-8, FOCI, ISI, SABAS, IAT-6, and BMSLSS) among Ghanaian youth. The findings for the psychometric properties (i.e. reliability and validity) revealed that, in general, all the scales had acceptable reliability (i.e. Cronbach’s α and McDonald’s ω) and validity (i.e. factorial and construct) indices. There are significant relationships between the validated scales, stress and fatigue, which also support the construct – convergent validity of the scales.
The CFA fit indices for all eight scales measuring anxiety, depression, somatic symptoms, obsessive–compulsive disorder symptoms, insomnia severity, smartphone application-based addiction, internet addiction and life satisfaction indicate that all the scales had a unidimensional or one-factor structure (Hoyle and Panter, Reference Hoyle, Panter and Hoyle1995). That is, the DSM-5 adapted version of GAD was found to have a stable unidimensional factor structure which is similar to previous studies (Adjorlolo, Reference Adjorlolo2019; Moreno-Montero et al., Reference Moreno-Montero, Moreta-Herrera, Rodas, Oriol-Granado, Puerta-Cortés, Ferrufino-Borja, Diaz, Rivera, Samaniego-Pinho, Buenahora-Bernal, Rojas-Jara and Vega-Arce2025). This indicates that GAD assesses a single latent construct – generalised anxiety. Also, the adapted version of PHQ-9 was found to have a stable one-factor structure similar to previous studies (Anum et al., Reference Anum, Adjorlolo and Kugbey2019; Arias de la Torre et al., Reference Arias de la Torre, Vilagut, Ronaldson, Valderas, Bakolis, Dregan, Molina, Navarro-Mateu, Pérez, Bartoll-Roca, Elices, Pérez-Sola, Serrano-Blanco, Martín and Alonso2023). This indicates that PHQ-9 assesses a single latent construct being depression. Similarly, the adapted FOCI was found to have a single-factor structure which confirms previous studies (Storch et al., Reference Storch, Khanna, Merlo, Loew, Franklin, Reid, Goodman and Murphy2009; Sandoval-Lentisco et al., Reference Sandoval-Lentisco, López-Nicolás, López-López and Sánchez-Meca2023). The SSS-8 also had a stable one-factor structure similar to previous studies indicating that all the items belong to one construct (i.e. somatic symptoms) (Glozah and Pevalin, Reference Glozah and Pevalin2017; Hybelius et al., Reference Hybelius, Kosic, Salomonsson, Wachtler, Wallert, Nordin and Axelsson2024). Furthermore, the acceptable CFA fit for ISI indicates that it has a single latent construct on insomnia which confirms previous studies (Dieperink et al., Reference Dieperink, Elnegaard, Winther, Lohman, Zerlang, Möller and Zangger2020). However, previous studies suggest that the ISI can also have two or three latent factor structures, but one-factor structure has more (69%) common variance (Chen et al., Reference Chen, C-M and Morin2015; Dieperink et al., Reference Dieperink, Elnegaard, Winther, Lohman, Zerlang, Möller and Zangger2020; Wang et al., Reference Wang, Shen, Guo, Liu, Chen, Ma and Jian2025). Previous studies have reported SABAS to have a single factor structure similar to this study’s findings (Chen et al., Reference Chen, Ahorsu, Pakpour, Griffiths, C-Y and Chen2020; Huang et al., Reference Huang, Ahorsu, Adjaottor, Addo, Griffiths, Pakpour and Lin2024b). The IAT-6 is a relatively new scale of internet addiction. A previous study revealed that it had a one-face structure which is similar to the findings of this study (Ali et al., Reference Ali, Hendawy, Almarwani, Alzahrani, Ibrahim, Alkhamees and Kunugi2021). The present BMSLSS also had a unidimensional structure similar to previous studies (Abubakar et al., Reference Abubakar, Fons van de, Alonso-Arbiol, He, Adams, Aldhafri, Aydinli-Karakulak, Arasa, Boer, Celenk, Dimitrova, Maria, Fischer, Fomba, Frías, Fresno, Gillath, Harb, Handani, Hapunda, Kamble, Kosic, Joseph, Mazrui, Rafael, Murugami, Mason-Li, Weny, Perdomo, Schachner, Sim, Spencer, Suryani and Tair2016; Pittman et al., Reference Pittman, Valois and Farrell2022).
Also, measurement invariance across sex and educational levels indicated that there can be comparisons of scores between the sexes on GAD, PHQ-9, FOCI, ISI, SABAS, IAT-6 and BMSLSS and across educational levels for SABAS, IAT-6, and BMSLSS. However, readers and researchers should be cautious when comparing the sexes on SSS-8 due to differences in factor loadings (lack of metric invariance). Some previous studies have reported measurement invariance across sexes (Patel et al., Reference Patel, Oh, Rand, Wu, Cyders, Kroenke and Stewart2019; Chen et al., Reference Chen, Ahorsu, Pakpour, Griffiths, C-Y and Chen2020; Astudillo-García et al., Reference Astudillo-García, Austria-Corrales, Rivera-Rivera, Reynales-Shigematsu, Gómez-García, Séris-Martinez, Jiménez-Tapia, Robles, Morales-Chainé, López-Montoya, Cuevas-Renaud and Toledano-Toledano2022; Fonseca-Pedrero et al., Reference Fonseca-Pedrero, Díez-Gómez, Pérez-Albéniz, Al-Halabí, Lucas-Molina and Debbané2023; Schlechter et al., Reference Schlechter, Hillmann and Neufeld2024), though the novel part of this study is different versions of the scales (e.g. GAD-10, IAT-6, FOCI). Across educational levels, readers and researchers should be cautious during comparisons for GAD, PHQ-9, SSS-8, FOCI, and ISI due to differences in their factor loadings (lack of metric invariance). Furthermore, researchers and clinicians may supplement the score of these scales with qualitative data (e.g. interview) to enrich the data and understanding of the specific mental health conditions. Majority of the findings are similar previous studies (Patel et al., Reference Patel, Oh, Rand, Wu, Cyders, Kroenke and Stewart2019; Chen et al., Reference Chen, Ahorsu, Pakpour, Griffiths, C-Y and Chen2020; Astudillo-García et al., Reference Astudillo-García, Austria-Corrales, Rivera-Rivera, Reynales-Shigematsu, Gómez-García, Séris-Martinez, Jiménez-Tapia, Robles, Morales-Chainé, López-Montoya, Cuevas-Renaud and Toledano-Toledano2022), though the present used different versions of the earlier studies (e.g. GAD-10, IAT-6, FOCI).
Additionally, unidimensionality, infit and outfit MnSq and person separation reliability (i.e. Rasch analyses), the factor loading and CITC of all the scales were all above acceptable thresholds, which indicates that each item contributes substantially to the measure it belongs (Mokkink et al., Reference Mokkink, Terwee, Patrick, Alonso, Stratford, Knol, Bouter and De Vet2010; Tavakol and Dennick, Reference Tavakol and Dennick2011). This indicates that all eight scales have a stable factor structure and are valid for use among Ghanaian youth, as have been used elsewhere in other countries (Huang et al., Reference Huang, Ahorsu, Adjaottor, Addo, Griffiths, Pakpour and Lin2024b; Hybelius et al., Reference Hybelius, Kosic, Salomonsson, Wachtler, Wallert, Nordin and Axelsson2024). Furthermore, the internal reliability coefficients were all acceptable (Taber, Reference Taber2018), indicating how closely related a set of items are as a group within a scale. This further strengthens the psychometric properties of all eight scales. The novel part of this study involves getting the psychometric properties of a group of mental health scales for use among youths in a study, though some studies have examined different versions of some of the scales (Glozah and Pevalin, Reference Glozah and Pevalin2017; Adjorlolo, Reference Adjorlolo2019; Anum et al., Reference Anum, Adjorlolo and Kugbey2019; Amissah et al., Reference Amissah, Christopher and Amponsah2022; Oppong et al., Reference Oppong, Adjaottor, Addo, Nyaledzigbor, Ofori-Amanfo, H-P and Ahorsu2022).
There were significant relationships between all the measures used in this study, except for BMSLSS and IAT-6; and stress of DASS-Y and BMSLSS. The significant positive relationships between GAD, PHQ-9, SSS-8, FOCI, ISI, SABAS, IAT-6, and stress of DASS-Y indicate that when any of these measures increases in severity, the other measures will also increase. These findings are in line with previous studies which examined relationships between stress and GAD (Lee and Kim, Reference Lee and Kim2019; Luo et al., Reference Luo, Xian, Yao, Jin, Zhao, Song and Gong2025), PHQ-9 (Lee and Kim, Reference Lee and Kim2019; Luo et al., Reference Luo, Xian, Yao, Jin, Zhao, Song and Gong2025), SSS-8 (Pallati et al., Reference Pallati, Singh, Ranjan, Rawat, Sarkar, Kaloiya, Baitha, Upadhyay, Prakash and Jadon2024), FOCI (Zhang et al., Reference Zhang, McGuire, Qiu, Jin, Li, Cepeda, Goodman and Storch2017), ISI (Younes et al., Reference Younes, Halawi, Jabbour, El Osta, Karam, Hajj and Rabbaa Khabbaz2016) and SABAS (Chen et al., Reference Chen, Ahorsu, Pakpour, Griffiths, C-Y and Chen2020), though DASS-21 was commonly used instead of DASS-Y. However, it should be noted that there are moderate to high relationships between DASS-21 instead of DASS-Y (Cao et al., Reference Cao, Liao, Gamble, Li, Jiang, Li, Griffiths, I-H and Lin2023). Additionally, the significant positive relationship between BMSLSS and cognitive fatigue of the PedsQL-MFS suggests that the lower the severity levels of cognitive fatigue symptoms, the better an individual’s life satisfaction. This is similar to a previous study (Kim et al., Reference Kim, Chung, Amtmann, Salem, Park and Askew2014).
On the other hand, significant negative relationships exist between GAD, PHQ-9, SSS-8, FOCI, ISI, SABAS, IAT-6, and cognitive fatigue of the PedsQL-MFS, which indicates that an increase in any of these measures may likely increase cognitive fatigue symptoms (i.e. a lower score indicates more cognitive fatigue symptoms). These findings are in line with a previous study which examined relationships between cognitive fatigue and GAD and PHQ-9 (Tangkittiwet et al., Reference Tangkittiwet, Charuvanij, Manaboriboon, Chantaratin, Pattaragarn and Piyaphanee2025). Furthermore, these significant relationships between the validated measures, stress and cognitive fatigue strengthen the convergent validity of the measures used in this study. These findings help ascertain how the measures associate with each other and, more importantly, extend the construct – convergent validity of the scales. This is in line with some previous studies (Adjorlolo, Reference Adjorlolo2019; Anum et al., Reference Anum, Adjorlolo and Kugbey2019; Huang et al., Reference Huang, Ahorsu, Adjaottor, Addo, Griffiths, Pakpour and Lin2024b). However, an individual’s level of internet addiction or stress was not related to that individual’s life satisfaction. This means the life satisfaction of Ghanaian youths may not be influenced by the level of internet addiction or stress. Possible reasons for these non-significant relationships can be ascribed to diversified sources of satisfaction and other complex moderating or intervening (i.e. cultural and contextual) factors (Ma et al., Reference Ma, Li and Lee2025). Nonetheless, these findings are not entirely novel (Mohamad Ashari et al., Reference Mohamad Ashari, Solihah Hassan, Zainudin and Jumaat2022), though other studies have contrary reports (Ooi et al., Reference Ooi, Khor, Tan and Ong2022; Szabo and Lovibond, Reference Szabo and Lovibond2022; Ma et al., Reference Ma, Li and Lee2025).
Practical implications
This study has several practical implications in the areas of health, education and research. For instance, the scales can be used by healthcare professionals to help with screening and diagnostic purposes among youths. That is, all eight scales had acceptable psychometric properties (i.e. validity and reliability). Therefore, healthcare professionals (e.g. counsellors, health psychologists, clinical psychologists) can use all the scales GAD, PHQ-9, SSS-8, FOCI, ISI, SABAS, IAT-6, and BMSLSS to assess anxiety, depression, somatic symptoms, obsessive–compulsive disorder symptoms, insomnia severity, smartphone application-based addiction, internet addiction and life satisfaction, respectively, so as to improve youths’ mental health. Also, they can help with monitoring treatment outcomes over time. In addition, scales on smartphone application-based addiction and internet addiction can be integrated into app-based interventions or digital wellness platforms so as to monitor and alert users of problematic use of digital devices and the internet. Furthermore, schools and universities can use these scales to assess students’ well-being, thereby informing support services and mental health initiatives. Validating these scales among Ghanaian youth ensures cultural sensitivity and contextual accuracy.
Limitations
This study is without limitations. The first has to do with using self-reported measures, which are influenced by self-report bias, such as social desirability, and recall bias. Although some of the scales were according to APA’s mental health conditions, scales are not enough to capture the full complexity of a disorder. Therefore, healthcare professionals should complement it with their experience and expertise. The study was a cross-sectional design and, therefore, may not reflect the fluctuating symptoms or longitudinal changes in youths. Longitudinal research may be conducted to fill in these gaps. Additionally, researchers and healthcare professionals should be cautious in administering these scales to uneducated youths or those in rural communities, as the participants used in this study were recruited from academic institutions (i.e. schools and a university). This also limits the extent of generalisation (i.e. all Ghanaian youths). Furthermore, there may be the possibility of maturation bias and boredom, taking into consideration the age range and the number of measures used. Clinicians and researchers should put in place mitigating measures (e.g. breaks, attention checks, control group, statistical control) to control these biases. Finally, this study did not assess the test–retest reliability coefficients of the scales, which may have also established the stability of the scales over time.
Conclusion
This study, which examined the psychometric properties of eight scales (i.e. GAD, PHQ-9, SSS-8, FOCI, ISI, SABAS, IAT-6, and BMSLSS) among Ghanaian youth, revealed that all the scales had acceptable reliability (i.e. Cronbach’s α and McDonald’s ω) and validity (i.e. factorial and construct – convergent validity) indices. There are significant relationships between almost all of the measures (i.e. anxiety, depression, somatic symptoms, obsessive–compulsive disorder symptoms, insomnia severity, smartphone application-based addiction, internet addiction, life satisfaction, stress and cognitive fatigue) used in this study, which emphasize the interdependence of all the measures. Healthcare professionals (e.g. counsellors, health psychologists, clinical psychologists) may use any of the eight validated scales to assess their respective mental health variables among Ghanaian youth.
Open peer review
To view the open peer review materials for this article, please visit http://doi.org/10.1017/gmh.2026.10128.
Data availability statement
The data that support the findings of this study are available from the corresponding author, [DKA], upon reasonable request.
Author contribution
DKA: conceptualization, data curation, investigation, methodology, project administration, resources, software, supervision, validation, visualization, writing – original draft and writing – review and editing. DO: conceptualization, data curation, investigation, methodology, project administration, resources, software, supervision, validation, visualization, writing – review and editing. C-YL: conceptualization, formal analysis, investigation, methodology, resources, software, supervision, validation, visualization, writing – review and editing.
Financial support
This research received no specific grant from any funding agency, commercial or not-for-profit sectors
Competing interests
The authors declare none.
Ethics statements (if appropriate)
Ethical approval for the study was obtained from the Human Research Ethics Committee of Central University (CUIRB/34/01/25).


 Open access
Comments
No accompanying comment.