


Introduction
The Bransfield Strait is a rifted back-arc basin that separates the South Shetland Islands from the Antarctic Peninsula (Fig. 1a,b). Regional-scale geophysical and geological datasets collected in recent decades (e.g. Grácia et al. Reference Gràcia, Canals, Farràn, Prieto, Sorribas and Team1996, Lawyer et al. Reference Lawyer, Sloan, Barker, Ghidella, Von Herzen and Keller1996, Keller et al. Reference Keller, Fisk, Smellie, Strelin and Lawver2002, Christeson et al. Reference Christeson, Barker, Austin and Dalziel2003, Dziak et al. Reference Dziak, Park, Lee, Matsumoto, Bohnenstiehl and Haxel2010) have improved our understanding of the complex dynamics of this region. The shape of the basin and seafloor morphology are largely controlled by the relative movements of the South American, Phoenix, Scotia and Antarctic plates (Dziak et al. Reference Dziak, Park, Lee, Matsumoto, Bohnenstiehl and Haxel2010). Volcanism associated with subduction of the Phoenix Plate beneath the Antarctic Plate formed the South Shetland Islands (Smellie et al. Reference Smellie, Pankhurst, Thomson and Davies1984). The subduction has slowed dramatically over the last 4 Ma, producing an extensional environment in the Bransfield region through the process of slab roll-back (Robertson Maurice et al. Reference Robertson Maurice, Wiens, Shore, Vera and Dorman2003, Dziak et al. Reference Dziak, Park, Lee, Matsumoto, Bohnenstiehl and Haxel2010). The extensional setting is also affected by the left-lateral shear motions between the Scotia and Antarctic plates (Lawyer et al. Reference Lawyer, Sloan, Barker, Ghidella, Von Herzen and Keller1996, Gonzalez-Casado et al. Reference González-Casado, Robles and López-Martínez2000). The oblique orientation of the Phoenix spreading centre relative to the South Shetland subduction zone results in an age gradient, whereby the south-western portion of the trench is subducting much younger oceanic crust than the north-eastern end (Larter & Barker Reference Larter and Barker1991). This along-strike asymmetry can be seen in the progressive widening of the basin and increasing extension rates from south-west to north-east (Li et al. Reference Li, Yuan, Heit, Schmidt-Aursch, Almendros, Geissler and Chen2021). While King George Island is moving north-westwards, perpendicular to the Bransfield Rift, at ~7–9 mm/year (Taylor et al. Reference Taylor, Bevis, Dalziel, Smalley, Frohlich and Kendrick2008), the islands to the south-west move at a much slower rate.
Location of the study area. a. Map of the Scotia region between the southern tip of South America and the Antarctic Peninsula, showing the major tectonic boundaries. HFZ = Hero Fracture Zone; PAR = Phoenix Antarctic Ridge; SFZ = Shackleton Fracture Zone; WER = West Scotia Ridge. b. Bransfield Strait area (red box in a.) showing the position of the primary volcanic structures that comprise the neovolcanic zone (red colour). HR = Hook Ridge; HV = Humpback Volcano; OV = Orca Volcano; TSV = Three Sisters Volcano. c. Bathymetry of Orca Volcano and surroundings from multibeam data interpolated to 25 m. Black lines show the navigation lines for the marine geophysical cruise. Multi-channel seismic (MCS) imaging was collected along ridge-crossing profiles (1–21) and one ridge-parallel profile along the ridge axis (16ew). Additional airgun shots were performed for a tomographic study (not presented in this survey) along the ridge-parallel profiles shown. Gravity and magnetic data were continuously collected along all survey lines. Thick black lines indicate the profiles used to build 2D gravity-magnetic models (Fig. 5). Black dots show the epicentres of the 2020–2021 seismic swarm north-east of Orca Volcano (Cesca et al. Reference Cesca, Sugan, Rudzinski, Vajedian, Niems and Plank2022). The red dots mark the locations of the dredge samples 52411–52428 collected by R. Keller in 1993 on the RV Nathaniel B. Palmer (Table S2). SG indicates the location of seafloor gouges. The black rectangle shows Bravoseis Seamount. d. Zoomed-in image showing the detailed topography of the Orca caldera.

The central part of the Bransfield Strait extending from Deception Island to Hook Ridge (Fig. 1a) is the Central Bransfield Basin (CBB). Prior studies have observed rift segmentation from along-axis changes in depth and morphology of the rift (Gràcia et al. Reference Gràcia, Canals, Farràn, Prieto, Sorribas and Team1996) and in seismic velocity (Christeson et al. Reference Christeson, Barker, Austin and Dalziel2003), but these are not well-correlated. Indeed, based on a regional analysis of gravity and magnetic data and the results of prior seismic studies, Catalán et al. (Reference Catalán, Galindo-Zaldivar, Davila, Martos, Maldonado, Gambôa and Schreider2013) argue that the CBB is either in the very latest stages of rifting or possibly the very earliest stages of oceanic spreading. The CBB is the most evolved portion of the ridge, with a wider zone extension in the map view (Fig. 1) and direct evidence of high-temperature hydrothermal venting at Hook Ridge and Three Sisters (Bohrmann et al. Reference Bohrmann, Chin, Petersen, Sahling, Schwarz-Schampera and Greinert1998, Klinkhammer et al. Reference Klinkhammer, Chin, Keller, Dählmann, Sahling and Sarthou2001).
Bathymetry and multi-channel seismic (MCS) imaging (Barker & Austin Reference Barker and Austin1998, Galindo-Zaldívar et al. Reference Galindo-Zaldívar, Gamboa, Maldonado, Nakao and Bochu2004) show that the CBB has undergone north-west to south-east asymmetric extension with the axial rift closer to the South Shetland block. Although evidence has been cited for seafloor spreading about the most evolved portion of the ridge (Grácia et al. Reference Gràcia, Canals, Farràn, Prieto, Sorribas and Team1996), none of the resulting seafloor is considered normal ocean crust (Lawyer et al. Reference Lawyer, Sloan, Barker, Ghidella, Von Herzen and Keller1996, Catalán et al. Reference Catalán, Galindo-Zaldivar, Davila, Martos, Maldonado, Gambôa and Schreider2013). In fact, the crust underlying most of the Bransfield Basin is much thicker than typical oceanic crust (Grad et al. Reference Grad, Shiobara, Janik, Guterch and Shimamura1997, Christeson et al. Reference Christeson, Barker, Austin and Dalziel2003). Moho depth estimates are diverse, ranging from 10 to 35 km (Christeson et al. Reference Christeson, Barker, Austin and Dalziel2003, Li et al. Reference Li, Yuan, Heit, Schmidt-Aursch, Almendros, Geissler and Chen2021, Parera-Portell et al. Reference Parera-Portell, Mancilla, Morales, Almendros and Jiménez-Morales2021). There is general agreement that the Moho shoals near the Bransfield rift axis - the north-west to south-east-trending volcanic ridge that connects the subaerial and seafloor volcanoes between Bridgeman Island in the north-east and Deception Island in the south-west, where the rift is less evolved (Grácia et al. Reference Gràcia, Canals, Farràn, Prieto, Sorribas and Team1996, Baker & Austin 1998). Wide-angle seismic modelling shows a crustal thickness of ~10–15 km at the rift axis (Christeson et al. Reference Christeson, Barker, Austin and Dalziel2003). Along the rift axis, the crust thickens from north-east to south-west (Christeson et al. Reference Christeson, Barker, Austin and Dalziel2003, Catalán et al. Reference Catalán, Galindo-Zaldivar, Davila, Martos, Maldonado, Gambôa and Schreider2013).
The central part of the CBB is a neovolcanic zone (Grácia et al. Reference Gràcia, Canals, Farràn, Prieto, Sorribas and Team1996, Lawyer et al. Reference Lawyer, Sloan, Barker, Ghidella, Von Herzen and Keller1996) composed of vesicular basalts (Keller et al. Reference Keller, Fisk, Smellie, Strelin and Lawver2002), and it is the site of multiple active seafloor volcanic edifices. These include Orca Volcano, located in the Bransfield Rift at ~20 km south of King George Island (Fig. 1). Rock dredges have recovered fresh lavas from several sites along the Bransfield rift (Keller et al. Reference Keller, Fisk, Smellie, Strelin and Lawver2002). Lava chemistries range from very similar to the nearby arc volcanism to mid-ocean ridge basalt (MORB)-like. High upper crustal velocities, with values reaching 6 km/s at ~2 km of depth beneath Orca Volcano (Christeson et al. Reference Christeson, Barker, Austin and Dalziel2003), suggest the presence of predominant shallow igneous dikes. More recently, Rodrigo et al. (Reference Rodrigo, Blamey, Huhn and Provost2018) measured a temperature anomaly at Orca caldera and identified thermophilic microorganisms, suggesting that there is a hydrothermal flux. This region also coincides with a shallow zone of anomalously high magnetization (Catalán et al. Reference Catalán, Galindo-Zaldivar, Davila, Martos, Maldonado, Gambôa and Schreider2013).
Orca Volcano is a striking seamount rising ~900 m above the seafloor, with a summit caldera. The volcano is produced by active rifting associated with the expansion of a back-arc basin through the continental crust of the Antarctic Peninsula (e.g. Almendros et al. Reference Almendros, Wilcock, Soule, Teixidó, Vizcaíno and Ardanaz2020 and references therein). The long-term volcanic activity that formed the Orca edifice can be related to the presence of a tear in the subducting slab that alters the mantle circulation (Parera-Portell et al. Reference Parera-Portell, Mancilla, Morales, Almendros and Jiménez-Morales2021). Significant seismic activity has been observed in the vicinity of Orca Volcano and has been attributed to both volcanic activity and extensional tectonics. Kaminuma (Reference Kaminuma, Kim and Khim2001) first identified Orca as the probable site of several volcanic swarms observed on records from a single broadband seismometer on King George Island. Robertson Maurice et al. (Reference Robertson Maurice, Wiens, Shore, Vera and Dorman2003) deployed a network of land and Ocean Bottom Seismometer (OBS) stations during 1997–1999 and compiled a catalogue of ~150 earthquakes related to the subduction zone. Four earthquakes were located near the flank of Orca Volcano and were interpreted as a consequence of magmatic activity. Dziak et al. (Reference Dziak, Park, Lee, Matsumoto, Bohnenstiehl and Haxel2010) deployed moored hydrophones in the CBB from 2005 to 2007 and located > 3000 earthquakes within the basin using T-phases. Most of the earthquakes (~90%) are located near the volcanic rift of the CBB, and their distribution shows that it is seismically active along its full length. More recently, an 85000-event seismic swarm occurred between August 2020 and February 2021 (Loureiro-Olivet et al. Reference Loureiro-Olivet, Sanchez-Bettucci, Castro-Artola, Castro, Rodriguez and Latorres2021, Poli et al. Reference Li, Yuan, Heit, Schmidt-Aursch, Almendros, Geissler and Chen2021, Cesca et al. Reference Cesca, Sugan, Rudzinski, Vajedian, Niems and Plank2022). These earthquakes (see Fig. S7 and fig. 3 in Cesca et al. Reference Cesca, Sugan, Rudzinski, Vajedian, Niems and Plank2022) were located north-east of Orca Volcano and appeared to extend from below the Moho to the top of the crystalline basement (Li et al. Reference Li, Yuan, Heit, Schmidt-Aursch, Almendros, Geissler and Chen2021, Cesca et al. Reference Cesca, Sugan, Rudzinski, Vajedian, Niems and Plank2022). The estimated cumulative seismic moment release was ~3.88 × 10¹⁸ Nm, equivalent to MW 6.4 (Cesca et al. Reference Cesca, Sugan, Rudzinski, Vajedian, Niems and Plank2022).
In January–February 2019, we surveyed Orca Volcano and collected new high-resolution multibeam bathymetry (MBES), gravity, magnetics and MCS data as part of an international collaborative experiment (BRAnsfield VOlcanoes SEISmology; BRAVOSEIS) to understand rifting and volcanic processes in the Bransfield Strait (Almendros et al. Reference Almendros, Wilcock, Soule, Teixidó, Vizcaíno and Ardanaz2020). In this paper, we use integrated high-resolution geophysical data combined with new petrological analysis of basalt dredge samples collected by Keller et al. (Reference Keller, Fisk, Smellie, Strelin and Lawver2002) to characterize Orca Volcano and its surroundings to gain insights into the neovolcanic crustal structure, composition and related magmatic processes.
Data and methods
This study is a combined analysis of the multibeam bathymetry, gravity and magnetics and 2D MCS reflection data collected aboard the Spanish RV Sarmiento de Gamboa during the BRAVOSEIS 2019 cruise (Almendros et al. Reference Almendros, Wilcock, Soule, Teixidó, Vizcaíno and Ardanaz2020). In the area of Orca Volcano, we collected gravity and magnetics along rift-perpendicular lines with ~500 m spacing and along rift-parallel lines with spacing of 500 m–1 km (Fig. 1c). Additionally, MCS data were collected along the rift-perpendicular lines and along one rift-parallel line. Multibeam and potential field data were processed using standard calculations detailed in Almendros et al. (Reference Almendros, Wilcock, Soule, Teixidó, Vizcaíno and Ardanaz2020) to produce a digital bathymetric model of 25 m of cell size (Fig. 1c,d) and potential field maps of Free Air (FA) anomaly, Complete Bouguer Anomaly (CBA), Reduced-to-Pole (RTP) magnetic anomaly and tilt derivative (TDR) of the RTP anomaly with a 500 m cell size (Fig. 2). CBA was calculated using a correction density of 1.67 g/cm3 to represent the water-rock contrast and included removal of the regional field expected from the Moho topography. The velocity contrast at the Moho in Bransfield Strait is characterized by a transition from crustal velocities of ~7.1 km/s at the base of the crust to upper mantle velocities of 7.45 ± 0.2 km/s. This indicates a velocity increase of ~0.35 km/s at the Moho (Christeson et al. Reference Christeson, Barker, Austin and Dalziel2003). We modelled this assuming a 0.16 g/cm3 mantle-crust density contrast (Table S1).
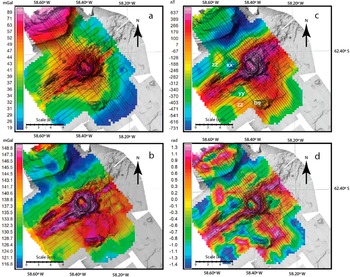
Potential field anomaly maps. Black lines show the acquisition lines. a. Free Air anomaly (mGal). b. Complete Bouguer Anomaly (mGal). c. Reduce-to-Pole magnetic anomaly (nT) at Inc. = 55.85° and Dec. = 10.84°. Local maxima and minima are labelled (see description in the text). d. Tilt derivative of the Reduce-to-Pole magnetic anomaly (rad).

MCS data were processed in two-way time using a workflow that included muting of the direct and refracted waves, amplitude recovery, trace balance, band-pass filtering, SRME multiple attenuation, predictive deconvolution in the tau-p domain, velocity analysis, parabolic radon transform, pre-stack time migration and stack and FX deconvolution (Almendros et al. Reference Almendros, Wilcock, Soule, Teixidó, Vizcaíno and Ardanaz2020). Finally, the MCS data in two-way time were converted to depth with the root mean squared (RMS) velocity functions derived from the velocity analysis.
Two-dimensional gravity-magnetic forward modelling was built over the FA and RTP anomalies. Forward 2D models are created iteratively to identify and understand trade-offs between geometry and the composition of the crust in the Orca Volcano area. Calculations of the gravity and magnetic model responses were conducted using OASIS Montaj GM-SYS-2D™ (2021.2.1) based on the methods of Talwani et al. (Reference Talwani, Worzel and Landisman1959) and Talwani & Heirtzler (Reference Talwani, Heirtzler and Parks1964) and the algorithms described in Won & Bevis (Reference Won and Bevis1987). Geometrical constraints are based on average values from previous regional geophysical work (Christeson et al. Reference Christeson, Barker, Austin and Dalziel2003, Catalán et al. Reference Catalán, Galindo-Zaldivar, Davila, Martos, Maldonado, Gambôa and Schreider2013, Parera-Portell et al. Reference Parera-Portell, Mancilla, Morales, Almendros and Jiménez-Morales2021) and new MBES and MCS data collected during the BRAVOSEIS 2019 cruise (Almendros et al. Reference Almendros, Wilcock, Soule, Teixidó, Vizcaíno and Ardanaz2020). The depth to the seafloor and seafloor morphology are determined using MBES gridded to 25 m. MCS data interpretation provides the depth of the basement top and the architecture of sedimentary packages and the faults. The Moho geometry (Figs. 3g & S2) was derived from a starting surface created from the 2D seismic wide-angle models (Christeson et al. Reference Christeson, Barker, Austin and Dalziel2003) near Orca Volcano that we refined by inverting our observed gravity data at 10 km wavelength in 3D using OASIS Montaj. Our starting model divides mantle material (ρ = 3.16 g/cm3, S = 0) from lower crust (LC: ρ = 3.0 g/cm3, S = 0) based on a model fit using the constraints of the directly observed bathymetry, the seismically determined depth to Moho and sediment thickness and prior modelling in this region (Catalán et al. Reference Catalán, Galindo-Zaldivar, Davila, Martos, Maldonado, Gambôa and Schreider2013). Similarly, wide-angle data also provide complementary constraints on the sediment thickness where there are no MCS data. Densities were obtained from a P-wave velocity model of Christeson et al. (Reference Christeson, Barker, Austin and Dalziel2003) using semi-empirical relationships (Table S1; Barton Reference Barton1986, Christenson & Mooney Reference Christenson and Mooney1995, Brocher Reference Brocher2005). In addition, petrological and magnetic susceptibility data were measured ad hoc for this study according to the Polar Rock Repository (Fig. 1c,d & Table S1) of dredged extrusive lavas collected in 1993 on flanks and in the caldera of Orca Volcano (Keller et al. Reference Keller, Fisk, Smellie, Strelin and Lawver2002). Magnetic susceptibilities of the samples range from 0.000202 to 0.000991 cgs (centimetre-gram-second; Table S2).
Profile Orca 12 across the centre portion of the Orca caldera (see Fig. 1 for location). a. Multibeam bathymetry. b. Free Air (FA) gravity anomaly. c. Complete Bouguer Anomaly (CBA). d. Reduce-to-Pole (RTP) magnetic anomaly. e. Tilt derivative (TDR) of the RTP magnetic anomaly. f. Multichannel seismic reflection data showing the interpretation of the main seismic units and structures and the locations of phase-reversed amplitude anomalies (PRA). Bold solid lines indicate the top basement interface. Dashed lines indicate the first seafloor multiple (M1). g. Moho depth (green line) derived from regional tomography (Christeson et al. Reference Christeson, Barker, Austin and Dalziel2003) and derived from an inversion of the pre-existing tomography and this study’s newly collected gravity profiles (black line).

To better understand the underlying crustal structure of Orca Volcano and to explore the variability of the crustal structure, we develop 2D models using ship data from rift-perpendicular profiles Orca 1, 12 and 21 and the rift-parallel profile Orca 16 (Fig. 1). Starting with a simple forward model with only a water layer, 2.6 g/cm3 crustal rocks and a 3.16 g/cm3 mantle at 12 km, we consider 1) geometrical information (bathymetry, sediment thickness, Moho depth, etc.) provided by the MBES data, MCS data and regional seismic tomography and 2) the ranges of the physical properties obtained from the scientific literature and from petrological analyses of basalts collected by Keller et al. (Reference Keller, Fisk, Smellie, Strelin and Lawver2002).
Results
Mapping results
The bathymetry reveals that Orca Volcano and the axial rift occupy an elevated area in the CBB (Fig. 1c). This elevated area predominantly follows the north-east to south-west rift orientation but also forms a bathymetric plateau that extends up to 10 km south-east from the caldera towards the CBB interior and north-west to connect with the South Shetland insular margin. The morphology and the dredge samples (Fig. 1c,d) show that the seafloor of this elevated zone mostly consists of lava flows, igneous ridges and small isolated volcanic edifices, but locally there are also plains where the acoustic response suggests thin sediment beds. Orca Volcano has a caldera crater with a diameter of ~4 km and is slightly elongated in the north-west to south-east direction (Fig. 1c,d), consistent with north-west to south-east extension along the axial rift (e.g. Taylor et al. Reference Taylor, Bevis, Dalziel, Smalley, Frohlich and Kendrick2008). The volcanic edifice is ~7.5 km in diameter at the base and occupies an area of ~45 km2. The caldera rim reaches a minimum water depth of 610 m on the south side, while the surrounding seafloor has average depths of 1500 m. The seafloor in the crater interior is ~315 m deeper than the caldera rim, and it is characterized by a smooth morphology with a horseshoe moat in the northern sector and small volcanic cones in the southern region. On the flanks there are big north-east to south-west-trending ridges (i.e. orthogonal to the north-west to south-east direction of the back-arc extension) related to the rift structure and minor ridges radiating from the volcano. South of Orca Volcano there is a secondary bathymetric high rising 250 m above the surrounding seafloor (Fig. 1c) and orientated approximately west to east. This high lies on the edge of the bathymetric plateau 10 km south-south-west of Orca volcano, is disconnected from the axial rift and is referred to here as ‘Bravoseis Seamount’ (see Fig. 1c). In the north-west of the survey area, the insular margin is characterized by a sloping platform that is striated by east to west-trending seafloor gouges (Fig. 1c) consistent with dragging iceberg marks and by a steep continuous slope showing local evidence of landslides.
Potential field mapping
Potential field anomalies show a clear relationship with the axial rift and volcanic structures. FA anomalies (Fig. 2a) range from ~10 to 100 mGal in a pattern that broadly follows the seafloor topography, with higher values over the island margin, the volcano edifice and along the axial rift and lower values in the deeper seafloor plains of the CBB to the south of the volcano. To the north-west of Orca Volcano, the insular margin shows FA values of 90–100 mGal, while to the south-east FA values of ~20 mGal are seen within the CBB. The Orca edifice is marked by local FA anomaly maxima with magnitudes ranging between 50 and 55 mGal, and the axial rift is marked by local maxima with magnitudes ranging between 30 and 55 mGal.
CBAs (Fig. 2b) range from 112 to 160 mGal and have lower values on the South Shetland Islands margin and in the interior of the CBB. Higher values are observed at the caldera rim, the north-east to south-west-trending ridge axis and in a broad bathymetric plateau to the south-south-east of the caldera, including on Bravoseis Seamount (Fig. 1). Note the juxtaposition of a local low CBA anomaly value of ~147 mGal inside the caldera and local high values of ~130 mGal on the crater rims.
RTP magnetic anomalies (Fig. 2c) range from approximately −730 to 1150 nT, showing larger positive values along the axial rift, the Orca edifice and the bathymetric plateau, while larger negative values are found on the insular margin and the CBB plains. The positive maxima are along the axial rift and the Orca Volcano, with the highest values offset from the centre of the caldera and coincident with the high topography on the south and east sides of the caldera rim. There are several local anomalies that deserve mention. Bravoseis Seamount has a negative anomaly as low as −200 nT (labelled ‘bs’ in Fig. 2c). Two local negative anomalies at the base of Orca Volcano coincide with a radial bathymetric ridge and small volcanic cones to the west and with a smooth seafloor to the south-west (labelled ‘xx’ and ‘yy’, respectively, in Fig. 2c). There are also relative local maxima on smooth seafloor areas suggesting buried volcanic structures or basement highs (labelled ‘zz’ in Fig. 2c).
The TDR of the magnetic anomaly (Fig. 2d) highlights maxima and minima in the RTP anomaly map (Fig. 2c) and better reveals the extent and edges of the causative anomaly sources. It clearly resolves the local anomaly minima in the interior of the caldera and on Bravoseis Seamount. We observe a narrow TDR maximum along the axis of the rift and on the caldera rim. To the north-east of the volcano, the potential field data shows that the rift is offset to the north-west by a segment boundary and is somewhat broader. This rift maximum is orientated north-east to south-west and it is offset 2–3 km by Orca Volcano, suggesting a left-lateral offset of the rift axis. Other diffuse TDR maxima coincide with the radial ridges, small volcanic cones and possibly volcanic features buried by sediments. Large areas of low TDR anomaly are related to the insular slope and the CBB interior.
Integrated profile descriptions
To better understand the local features of the Orca Volcano area and to obtain constraints for the 2D gravity and magnetic modelling, we analyse in detail MBES, potential fields, MCS data and Moho geometry along the representative rift-perpendicular profile Orca 12 (Figs. 1c & 3).
Figure 3 shows a 30 km-long north-west to south-east ridge-crossing profile that bisects the caldera perpendicular to the axial rift (Orca 12 in Fig. 1c). The bathymetry along this profile (Fig. 3a) ranges from 400 m in the sloping platform to 1749 m in the CBB. The borders of the caldera are bathymetric highs, with the southern rim of the caldera at 689 m depth, ~200 m higher in elevation than the northern rim (Fig. 3a). FA anomalies increase along this profile north-west towards the insular margin (Fig. 3b). Values range from 16 mGal at the south-east end of the profile in the CBB and rise to a local maximum of 64 mGal in the caldera centre and an overall maximum as the profile approaches the sloping platform at the island margin. CBAs (Fig. 3c) range from 122 mGal at the island margin to 150 mGal in the bathymetric plateau. The CBA profile is strongly asymmetric with respect to the rift axis. Low values occur on the sloping platform in the upper part of the island margin. From here a long-wavelength high of CBA extends to the south-west towards the interior of the CBB and to the south-east along the rift axis. The highest CBA is on the south-western side of the caldera interior and is flanked by two strong local minima on the caldera rims. Gravity data consistently show higher anomaly values over the southern bathymetric plateau and a local flat maximum centred on the middle of the caldera between the troughs over the rims (Fig. 3c). RTP magnetic anomalies (Fig. 3d) range between −786 nT at the island margin and 1100 nT at the southern caldera rim. Positive anomalies are restricted to the volcanic edifice and the southwards-elevated plateau, and negative values are located towards the CBB interior and insular margin. Over the caldera there are two maxima located approximately on the crater rims and a local minimum in the caldera interior. The TDR anomaly (Fig. 3e) is strongly correlated with bathymetry, shows significant values in the region of the Orca caldera and a broader minimum on the north-west flank of the edifice.
a. Enlarged view of the multi-channel seismic (MCS) profile Orca 12 around the Orca caldera showing the detection of phase-reversed amplitude anomalies (PRAs). b. Zoomed-in image of the central part of the profile (inset in a.). Normal polarity is shown at the seafloor interface. The polarity reversal is observed at ~1.6 km depth. c. Map view of the caldera as in Fig. 1d, indicating the extent of the region where phase changes have been detected in the MCS records (Figs 3f & S1).

MCS data records on and surrounding the volcanic edifice suggest a medium that is strongly heterogeneous (Figs. 3f & S2), as might be expected given the irregular seafloor bathymetry and the complex geological setting with scarce sediments and plenty of volcanic rocks outcropping at the seafloor. This results in low lateral seismic coherency and many diffractions (e.g. in the caldera flanks) that signal processing minimizes but does not suppress. Figure 3f shows thin to no sedimentation in and on the caldera and its flanks. Near the caldera, where sediments are present the seismic signals still show low coherence, suggesting the terrestrially sourced sediments alternate with heterogeneous materials such as coarse-grained volcanic debris and lava flows. Farther from the caldera towards the CBB interior and the insular slope, the seismic record shows much higher lateral coherence, imaging a significant stratified sediment accumulation. Locally beneath the sloping platform on the insular margin, sediment thickness reaches 1500 m and contains both divergent reflectors, indicating a syn-rift sequence, mostly controlled by a large buried normal fault beneath the base of the insular slope, and prograding seaward reflectors of the post-rift high sediment influx from King George Island. In the CBB interior, horizontal post-rift sediments reach ~350 m, and beneath the sediment layers the seismic facies are mostly chaotic, suggesting igneous materials (i.e. basement). MCS records (Fig. S1) along and across the axial rift show many diffractions due to the rough seafloor bathymetry dominated by igneous ridges and no significant sediment accumulation.
Beneath the caldera, the MCS data show high-amplitude phase-reversed amplitude anomalies (PRA; Figs. 3f & 4) and other diffraction hyperbolas related to the complex tectonic setting and rough seafloor morphology of the caldera. These features are detected under the caldera on several seismic lines crossing the Orca caldera, in a region of ~3 km in horizontal extent, and at depths ranging from ~600 to ~2000 m below the seafloor based on averaged stacking velocities (Figs. 4c & S1). A PRA occurs when a seismic wave encounters a reduction in seismic impedance caused by a change in the density and/or elastic properties of the medium. The MCS data crossing the caldera region show that the PRAs appear over an area of 3.2 × 1.9 km2, which is enlarged along a south-west to north-east orientation, coincident with the rift direction (Fig. 4c). We do not detect PRAs along the neovolcanic axial ridge away from the caldera nor in the caldera surroundings.
The gravity-modelled Moho shoals south-east over 25 km, from 22 km deep beneath the sloping platform to 13–14 km beneath Orca Volcano and to 10 km deep beneath the bathymetric plateau (black line in Fig. 3g). This significant variation has been imaged by wide-angle modelling and ambient noise tomography. The Moho geometry and depth are consistent with the long-wavelength trend of the CBA, showing more positive anomalies over the shallower Moho and vice versa. The area where Orca Volcano is expected to have significant magmatic activity, as indicated by the recent volcanic edifice and the PRA, is in a region with intermediate Moho depths, not where the Moho is shallow.
Model descriptions
The results of the 2D gravity-magnetic modelling are displayed in Fig. 5. The location and orientation of the four representative models illustrate the across- and along-strike structure of Orca Volcano and the axial rift. Geometrical constraints on the seafloor come from MBES data and those for the top of the basement come from MCS records. The rest of the model’s geometry and physical properties have been varied to reduce residuals between the observed and calculated gravity and magnetic data. The residuals in the preferred models are below 4% and 8% for the gravity and magnetic data, respectively. Both accumulated residuals are reasonable because of our regional-scale constraints and modelling. In general, features with long wavelengths and high amplitudes are well fitted, and the misfit comes mainly from the local maxima and minima of high-frequency signals that result from shallow sources. Along- and across-strike models match at their intersection points.
Gravity and magnetic models for profiles a. Orca 16ew, b. Orca 01, c. Orca 12 and d. Orca 21 (see locations in Fig. 1c). For each model, panel 1 shows observed (black dots) and modelled (black line) Reduce-to-Pole (RTP) magnetic anomalies. The difference between the observed and modelled RTP anomalies is shown as a red line, varying about the horizontal blue line representing a difference of zero. Total error is reported as the root mean squared (RMS) of the red line relative to the horizontal blue line. Panel 2 shows the magnetic model. Colour fills indicate modelled magnetic susceptibility (x) in cgs units (centimetre-gram-second), and locations for crossing lines for intersecting profiles are indicated by vertical green lines above the seafloor. Line 16ew crosses line 21, line 12 and line 01 from left to right in panel a. Each of the other lines cross line 16ew near the ridge axis. Panel 3 shows observed (black dots) and modelled (black line) Free Air (FA) anomalies. The difference between the observed and modelled FA anomalies is shown as a red line, varying about horizontal the blue line representing a difference of zero. Total error is reported as the RMS of the red line relative to the horizontal blue line. Panel 4 shows the gravity model. Colour fills indicate modelled densities in g/cm3.

The range of density varies from 3.0 to 1.9 g/cm3 and the magnetic susceptibility ranges from 0.06 to 0.00 cgs. The lower part of the models is characterized by a non-magnetic LC unit with a density of 3.0 g/cm3 and with its top located at 5–6 km depth (Figs. S3–S6). This crustal unit is assumed to be beneath the Curie depth and is assigned zero magnetic susceptibility. Above the LC, the upper crust is composed of magnetic igneous units with susceptibilities varying from 0.001 to 0.06 cgs and densities varying from 2.9 to 2.6 g/cm3. There is an across-strike pattern showing that mafic materials (i.e. denser and higher-susceptibility basalts and/or gabbros) dominate in the axial rift and beneath the caldera, and felsic-intermediate materials of continental affinity (i.e. lower density and lower susceptibility) dominate towards the insular margin and the CBB interior (Fig. 5a–c). There is also an apparent along-strike pattern showing higher magnetic susceptibility to the south-west of Orca Volcano and decreasing towards the north-east (Fig. 5d); this is caused by the location of the profile, which is on the axial rift in the south-west of Orca Volcano but on the south-east flank to the north-east. The insular margin is characterized by non-magnetic sedimentary cover of 1–2 km thickness with densities from 2.3 to 2.1 g/cm3. As observed from the MCS data, this sedimentary unit was initially controlled by buried large rift faults forming syn-rift sequences and recently by significant sediment influx because of the proximity of the islands, forming post-rift slope deposits (Fig. 3f). Towards the south-east in the CBB interior the models also show a non-magnetic sedimentary cover that is interpreted in the MCS data as being 0.3–0.5 km thick. In general, the sedimentary units are underlain by a basement formed from igneous units of the upper crust. On the flanks and interior of Orca Volcano there are low-density materials averaging 1.9–2.0 g/cm3 with low magnetic susceptibilities ranging from 0.001 to 0.005 cgs. These units are less than 0.5 km thick and have characteristics consistent with alternating lava flows and volcaniclastics and possibly hydrothermally altered materials. This is consistent with dredge samples (Table S2) and also with observations from MCS data showing sediment-free areas of the caldera (Fig. 3f).
Models of Orca Volcano (Fig. 5c,d) show a high-density and high-susceptibility unit underlain by a non-magnetic unit with a density of 2.7 g/cm3 at upper crustal levels beneath the centre of the caldera. This non-magnetic unit is interpreted as being hot material in the magma accumulation zone (MAZ), the top of which is imaged in the MCS data as a PRA of ~600 m beneath the seafloor (Figs. 3f & S1). We interpret this as a complex region of magma bodies centred beneath the caldera with lower densities (2.7 g/cm3) than the overlying formation (2.9 g/cm3) due to the presence of partially molten material. The MAZ exceeds the Curie temperature and is modelled with zero magnetic susceptibility, and it extends ~3.5 km along the rift axis and ~2 km across the rift, coincident with the area of the PRA (Fig. 4c). Our data do not constrain the base of the MAZ because the density contrast is too small to be resolved, and the non-magnetic signature precludes a depth estimation as non-magnetic materials will persist beneath the base of the MAZ, where temperatures are also elevated. The lateral extent and variable depths of the PRA as shown in other record sections (Fig. S2) support the probability of there being a substantial MAZ.
Although the models only constrain the top and sides of the MAZ, we estimate a minimum volume of 24 km3. Magnetic modelling shows high-susceptibility material in the centre of Orca Volcano that rapidly disappears at between 2 and 3 km depth. Away from the Orca edifice, the magnetic signature decreases in intensity and is consistent with a deeper source of up to 5 km. This observed change in the magnetic signature is asymmetric and more pronounced in the across-rift orientation than along the axis (Fig. 5). This pattern could be attributed to the geothermal gradient as well as the Curie depth being higher within the Orca edifice rift axis. The along-strike model (Fig. 5a) shows that the shallow region of the axial rift is mainly composed of mafic igneous materials with densities of 2.3–2.6 g/cm3. The relatively low densities along the axial rift could be related to minor local sediment accumulations and weathered igneous materials with high porosity. Beneath the centre of the caldera, the along-strike models show a high-density and high-susceptibility unit (dark green colour in Fig. 5) underlain by a non-magnetic unit with a density of 2.7 g/cm3. This non-magnetic unit extends to 6 km in depth and is considerably narrower (~1 km) in this along-strike orientation than in the across-strike models (e.g. Fig. 5b–d).
Discussion
This study provides new insights from distinct geophysical approaches into the nature and crustal structure of the Orca Volcano edifice and its surroundings, including the island slope, the axial rift and local basins. Our results provide new insights into the CBB crustal structure and composition that was previously only constrained by regional seismic studies (e.g. Christeson et al. Reference Christeson, Barker, Austin and Dalziel2003, Catalán et al. Reference Catalán, Galindo-Zaldivar, Davila, Martos, Maldonado, Gambôa and Schreider2013, Espinosa Celi et al. Reference Espinoza-Celi, Cahuana-Yánez, Martillo-Bustamante and González-Bonilla2023). We provide evidence for along- and across-strike variations in crustal structure and a previously unreported shallow MAZ beneath Orca Volcano. The top of this shallow MAZ is imaged as PRAs in the MCS data; gravity and magnetic data suggest that it is underlain by relatively low-density and low-susceptibility crust.
Asymmetry in the across-strike profile
In the caldera interior, the high CBA and intermediate RTP anomalies relative to the crater rim/flanks suggest the that crater is occupied by dense crystalline rocks with intermediate to high magnetic susceptibilities (Fig. 2). In general, high-amplitude RTP magnetic anomaly values indicate strong magnetic sources and low-amplitude values indicate non-magnetic and/or diamagnetic material or, in some cases, magnetic sources with reverse polarity. The strip of high positive anomaly along the rift axis forms a central anomaly magnetic high (CAMH; Klitgord et al. Reference Klitgord, Huestis, Mudie and Parker1975, from Tivey & Johnson 1985), similar to what has been observed along the axes of many mid-ocean ridges worldwide. Additionally, the rift to the south-west of the volcano, in the direction of Deception Island, shows the same narrow zone of low-density, high-susceptibility crust, consistent with a focused rift axis.
Our high-resolution magnetic data do not show a pattern of symmetrical stripes flanking the axial rift over 15–20 km of distance, as would be expected for a mature spreading centre forming oceanic crust. The Brunhes epoch started at 0.8 Ma, and near Orca Volcano the CAMH is 2–3 km wide on the south-west rift. Based on the RTP and magnetic gradient patterns observed (Fig. 2c,d) and given that lava flows will flow off the axis of accretion at a spreading rate of 0.9 cm/year (Tivey & Johnson 1985), this would give a maximum age of 0.2–0.3 Ma. To the north-east, the CAMH high-intensity zone is wider and includes several bathymetric ridges. If spreading had occurred during the entire Brunhes epoch, we might expect a CAMH of up to 7 km wide. As the lack of high intensity under the ridge to the north of the south-west rift (‘xx’ in Fig. 2c) suggests formation before the current Brunhes high intensity, we conclude that spreading has only recently begun. The RTP positive maximum anomaly along the axis of the rift and at the volcano rim suggests a consistent age and composition.
The lateral changes in CBA are modelled as density changes (2.9–2.6 g/cm3) over 15–20 km on either side of the ridge axis. Although there is probably smoother variation in bulk density than we model, our interpretation is that these changes reflect transient basement units (continental, intermediate composition and mafic affinities) associated with the rifting of the Antarctic Plate. Given that MORB composition basalts (Keller et al. Reference Keller, Fisk, Smellie, Strelin and Lawver2002) appear to be sourced from partial melting of enriched mantle at shallow depths (Keller et al. Reference Keller, Fisk, Smellie, Strelin and Lawver2002, Fretzdorff et al. Reference Fretzdorff, Worthington, Haase, Hékinian, Franz, Keller and Stoffers2004, Haase & Beier 2021), we suggest that the observed pattern is indicative of a process by which the material in the rift zone has become progressively more mafic as successive episodes of injection occur. Therefore, the original continental crust from the Antarctic Plate appears to have been modified by successive basic intrusions related to the rifting but without yet resulting in true oceanic crust.
An asymmetric pattern of decreasing density and susceptibility of igneous rocks across the rift is consistent with a pattern of extension that has only recently evolved into a narrow rift and the MORB-like compositions seen in dredge samples. This interpretation is also supported by the geometry of the Moho, of which the shallowest portions are not located beneath the axial rift and whose depths lack the consistency that would be expected of a normal spreading centre where new ocean crust is forming. These results are consistent with rifting that is rapidly transitioning to seafloor spreading.
Bathymetric plateau
The bathymetric plateau to the south-east of Orca Volcano corresponds to a broad and diffuse zone of high CBA and positive RTP anomalies (Fig. 2b,c). The calculated gravity and magnetic anomalies reflect local accumulation of volcanics related to Orca Volcano. Both high anomalies could suggest a prevalence of dense mafic rocks in this area related to the volcanic activity of the Orca edifice and/or a shallow Moho. The vertical stacking of volcanic materials interlayered with sediments (Fig. 3f) covering the bathymetric plateau seafloor contribute to elevating the bathymetry of the region and can also contribute to higher CBA and positive RTP anomalies.
In addition, high-gravity anomalies in the bathymetric plateau coincide with a shoaling of Moho (Fig. 3g). The shallowest modelled Moho at 10 km depth is located 10 km south-east from the Orca edifice and beneath the bathymetric plateau. The gravity signal from the Moho has been removed in the calculated CBA; therefore, the higher CBA in this area is not caused by the shallower (high-density) mantle. Moho depth is also shallow towards the north-east and south-west, following the rift orientation (Christeson et al. Reference Christeson, Barker, Austin and Dalziel2003), and there is no such bathymetric elevation (plateau) or high CBA and RTP anomalies (Catalán et al. Reference Catalán, Galindo-Zaldivar, Davila, Martos, Maldonado, Gambôa and Schreider2013, Espinosa Celi et al. Reference Espinoza-Celi, Cahuana-Yánez, Martillo-Bustamante and González-Bonilla2023). This could be related to the strong asymmetrical development of the rifting in the CBB, where the axial rift is much closer to the South Shetland Islands than it is to the Antarctic Peninsula. These observations partially agree with an asymmetrical continental rifting mechanism whereby an extensional basin is developed through the activity of a supra-detachment (e.g. Friedmann & Burbank Reference Friedmann and Burbank1995). This low-angle crustal-scale structure obliquely connects the shallowest Moho region with the upper crust, where the extension is focused along the axial rift (c.f. seismic activity; Cesca et al. Reference Cesca, Sugan, Rudzinski, Vajedian, Niems and Plank2022). The occurrence of the elevated bathymetric plateau agrees with the region of shallow Moho in a supra-detachment setting (i.e. isostatic balance). However, in this model the extension area in the upper crust experiences subsidence, and this is not the case for the Orca-axial rift. As the rift is not located over the shallowest Moho, it is possible that the observed volcanic activity is controlled by deep-rooted processes related to slab dip and/or slab tears (Parera-Portell et al. Reference Parera-Portell, Mancilla, Morales, Almendros and Jiménez-Morales2021).
Bravoseis Seamount at the southern edge of the bathymetric plateau is an enigmatic feature located where the Moho is shallowest. This seamount is 9 km away from Orca Volcano and its axial rift, where the recent magmatic activity is focused (e.g. Cesca et al. Reference Cesca, Sugan, Rudzinski, Vajedian, Niems and Plank2022). This feature is characterized by high positive CBA and intermediate negative RTP anomalies (Fig. 2b,c). Gravity anomalies strongly suggest dense rocks, but low-amplitude magnetic anomalies could suggest felsic composition, or possibly mafic composition but with inverted magnetic remanence. The first hypothesis could suggest that this seamount is a relict block of the existing felsic continental crust from before rifting. The modelled high-density material at shallow depths is in contrast with low-density vesicular material seen at the surface of Orca Volcano, and this supports a non-volcanic origin. Another hypothesis regarding this seamount’s origin is that high temperatures in this area would reduce the magnetic susceptibility. We reject this hypothesis because a high-temperature anomaly should be expected to affect a broader region and be mostly related to neovolcanic activity along the axial rift, whereas the observed negative magnetic anomaly is very local and far from the axial rift. Finally, the most plausible hypothesis could be that this seamount consists of a mafic dense body emplaced c. 1 Ma south of the axial rift, when there was an inverted geomagnetic field (0.78–0.90 My inverted polarity). Then, the remnant inverted magnetic signal could explain the observed RTP negative anomaly. This rift spreading rate of 7–9 mm/year would allow emplacement closer to the rift axis c. 1 Ma, and now the seamount is located 10 km off the axial rift.
Comparison to other volcanoes
The bathymetry at Orca Volcano has some similarities to other seafloor volcanoes in back-arc rifting environments. Seafloor topography has been well mapped by swath bathymetry methods along the same lines as gravity and magnetic data, and the influence of topography on the observed potential fields is well accounted for. When compared with Deception and Bridgeman islands, Orca Volcano is smaller in total relief but consists of very similar pillow/vesicular lavas and volcaniclastic sediments. The seafloor on the flanks of the volcano is similar to the flanks of many other volcanoes found at the zero aged crust at mid-ocean ridges and composed of a rugged collage of MORB-like basalts (Table S2) and thin sediments. Morphologically, Orca Volcano’s caldera rim is slightly elongated along the north-west to south-east axis (Fig. 1c,d). Similarly to other volcanoes found in extensional environments (Martí et al. Reference Martí, Vila and Rey1996, Maestrelli et al. Reference Maestrelli, Facincani, Sani, Bonini, Montanari, Del Ventisette and Corti2023), the shape of the caldera is interpreted to be a response to the north-west to south-east-orientated extensional stresses associated with the rifting of the basin (Nakamura Reference Nakamura1977, Acocella et al. Reference Acocella, Korme, Salvini and Funiciello2003). Caldera rims in back-arc environments have been observed to consist of lower-than-typical densities that are not strongly magnetic due to their high degree of hydrothermal alteration (Caratori Tontini et al. Reference Caratori Tontini, Cocchi, Muccini, Carmisciano, Marani and Bonatti2010). Similarly, the rim and flanks of Orca Volcano are formed by lava flows and volcaniclastics that produce overall lower relative densities and magnetic susceptibilities (Fig. 2 & Table S2).
It is notable that we do not detect PRAs along the axial ridge away from the caldera, which suggests a localized shallow plumbing system where the magma is beneath the caldera. The location of the PRA reflectors at different depths (between ~600 and ~2000 m beneath the seafloor) could be related to distinct levels of magma accumulation/stagnation (i.e. MAZ) controlled by the crustal structure.
Unlike Axial Volcano (Arnulf et al. 2018), we only observe the MAZ beneath the central caldera. The MAZ at Orca Volcano is relatively small (> 24 vs 250 km3 for Axial Seamount), shallow (~1.0 vs ~1.5 km) and has a complex geometry. By comparison, the Marsili magma zone is much deeper (~3 km beneath the seafloor (Caratori Tontini et al. Reference Caratori Tontini, Cocchi, Muccini, Carmisciano, Marani and Bonatti2010, Iezzi et al. Reference Iezzi, Caso, Ventura, Vallefuoco, Cavallo and Behrens2014) vs ~1 km beneath the seafloor) and was modelled using a much lower density (2.3 vs 2.7 g/cm3) in the magma chamber that Caratori Tontini et al. (Reference Caratori Tontini, Cocchi, Muccini, Carmisciano, Marani and Bonatti2010) justified through the inclusion of a high volatile content and a silica-rich magma (Wallace Reference Wallace2005, Caratori Tontini et al. Reference Caratori Tontini, Cocchi, Muccini, Carmisciano, Marani and Bonatti2010).
2020–2021 seismic crisis
A recent seismic swarm that occurred in the vicinity of Orca Volcano during 2020–2021 has been investigated in several studies (Loureiro-Olivet et al. Reference Loureiro-Olivet, Sanchez-Bettucci, Castro-Artola, Castro, Rodriguez and Latorres2021, Cesca et al. Reference Cesca, Sugan, Rudzinski, Vajedian, Niems and Plank2022, Poli et al. Reference Poli, Cabrera, Flores, Baez, Ammirati, Vasquez and Ruiz2022), with some differences arising in their interpretations. The combined study of seismicity and deformation suggests that the seismic swarm was related to a deep magmatic intrusion through a dyke located ~10 km north-east of Orca Volcano, slightly oblique to the axial rift, and whose south-west termination reaches the Orca edifice (Cesca et al. Reference Cesca, Sugan, Rudzinski, Vajedian, Niems and Plank2022). The intersection occurs on the north side of the Orca crater (Fig. 1c). In this area, the caldera rim is lowest, suggesting a possible dyke collapse, and there is evidence of radial ridges and a high concentration of small volcanic cones (Almendros et al. Reference Almendros, Wilcock, Soule, Teixidó, Vizcaíno and Ardanaz2020). However, the north-north-east orientation of the dyke does not coincide with our potential field results (Fig. 2). The eastwards continuation of the Bransfield rift seems to keep the same east-north-east orientation it has west of Orca Volcano. We can observe a jump in the rift that shifts northwards by ~4 km at the Orca edifice, but the direction appears to be approximately the same, suggesting the beginnings of segmentation associated with the nascent rift.
Cesca et al. (Reference Cesca, Sugan, Rudzinski, Vajedian, Niems and Plank2022) report two earthquake mechanisms: strike-slip and normal faults. In both cases they also have significant volumetric components, implying not only shear failures but also tensile opening. This is one of the pieces of evidence they use to justify the magmatic origin of the seismic swarm. The strike-slip earthquakes are generally deeper than the normal fault earthquakes. They interpret the strike-slip earthquakes as being directly related to dyke opening and propagation, while normal faults occur above the opening dyke. These mechanisms can be explained by the stress distribution in the CBB, dominated by a combination of rift-perpendicular extension due to slab rollback and trans-tensional motion between the South Shetland and Scotia plates.
Even considering the uncertainties associated with the 2020–2021 earthquakes’ locations, which are significant due to the poor seismic station coverage in the Bransfield Strait area, these results suggest that the seismic swarm was offset from Orca Volcano. Because of the spatial coincidence, there is no evidence of a direct link between the shallow magma reservoir that we image below the Orca edifice (Fig. 4) and the magmatic intrusion that drove the seismic swarm. The MAZ and the seismic swarm of 2020–2021 are two distinct magmatic processes, but they could be related by the active underplating driven by mantle flow through the slab tear suggested by Parera-Portell et al. (Reference Parera-Portell, Mancilla, Morales, Almendros and Jiménez-Morales2021).
Conclusions
We have characterized Orca Volcano, and our results depict a central volcano that seems to be active and dynamic. Orca Volcano is surrounded by lava flows and small volcanic cones, and there is evidence of hydrothermal alteration, seismic activity, raised Moho and deep magma motions. Additionally, magmatic intrusions have been recently reported at Orca Volcano and at nearby volcanoes. Most importantly, however, our analyses have imaged a MAZ at shallow levels under Orca Volcano, containing batches of magma that might be eruptible or might eventually be refilled with eruptible magma from lower levels. We do not detect PRAs along the axial ridge away from the caldera, which suggests a localized shallow plumbing system where the magma is beneath the caldera. The location of the PRA reflectors at different depths could be related to distinct levels of magma accumulation/stagnation (i.e. MAZ) controlled by crustal structure. This study presents conclusive evidence for the detection of the active magmatic processes in the Bransfield Strait and suggests that, locally, magmatic activity is concentrated beneath the caldera at Orca Volcano.
Regarding the Bransfield Basin around Orca Volcano, we analyse a combination of high-resolution data for geophysical interpretation and modelling. The rift is strongly asymmetrical, with more extension towards the south-east. In the Orca region, the area affected by the magmatic processes is wide, which might reveal an interplay between the extensional process and the irregularities of subduction. Our results suggest that rifting at present is restricted to a narrow strip, which is rapidly evolving. Mafic materials extend along and across the ridge axis at crustal depths, with density and susceptibility decreasing with distance from the rift axis on both sides. The original continental crust from the Antarctic Plate appears to have been modified by successive basic intrusions related to the rifting but without yet resulting in true oceanic crust.
Supplementary material
To view supplementary material for this article, please visit http://doi.org/10.1017/S095410202610073X.
Acknowledgements
We acknowledge the work carried out by participants in the BRAVOSEIS surveys of 2018, 2019 and 2020, including the Marine Technology Unit - CSIC, the captain and crew of RV Sarmiento de Gamboa and the RV Hesperides and all technicians and scientists involved in the cruises. We would also like to thank Josh Sellars (Project Geoscientist at Seequent, Vancouver, British Columbia) for all of his help and support with using the OASIS Montaj software package. Additionally, our reviewers made many great suggestions and helped us to improve our work. This work uses new analyses of samples collected by Keller et al. (Reference Keller, Fisk, Smellie, Strelin and Lawver2002) conducted by the Polar Rock Repository with support from the National Science Foundation, under Cooperative Agreement OPP-2137467. Data regarding the BRAVOSEIS 2019 cruise can be obtained from the UTM-CSIC repository (https://doi.org/10.20351/29SG20181230).
Author contributions
Dax C. Soule: writing - original draft, data curation, formal analysis, visualization, funding acquisition. José L. Granja-Bruña: writing - original draft, methodology, data curation, formal analysis, visualization. Kirsty J. Tinto: writing - original draft, methodology, formal analysis, visualization. Javier Almendros: writing - original draft, data curation, funding acquisition. Luis Vizcaino: data curation, formal analysis, visualization. William S.D. Wilcock: writing - editing and reviewing, data curation, formal analysis, visualization, funding acquisition.
Financial support
This work was funded by project BRAVOSEIS (CTM2016-77315-R) of the Spanish Ministry of Science (https://doi.org/10.13039/501100011033) and NSF awards ANT-17744651 and ANT-1744581.
Competing interests
The authors declare none.


 Open access