


Introduction
Transmission of severe acute respiratory syndrome coronavirus 2 (SARS-CoV-2) can be successfully suppressed by non-pharmaceutical interventions (NPIs) [Reference Flaxman1]. An active testing strategy is part of several NPIs against SARS-CoV-2 that can contribute to the control of COVID-19 [2]. Since June 2020, the Netherlands has chosen for a large-scale symptom-based testing and contact tracing programme. The merits of a mass testing (MT) programme, to actively offer frequent testing to all residents of a community, are not fully known as it has not been frequently used as an approach to control COVID-19 [Reference Johanna, Citrawijaya and Wangge3].
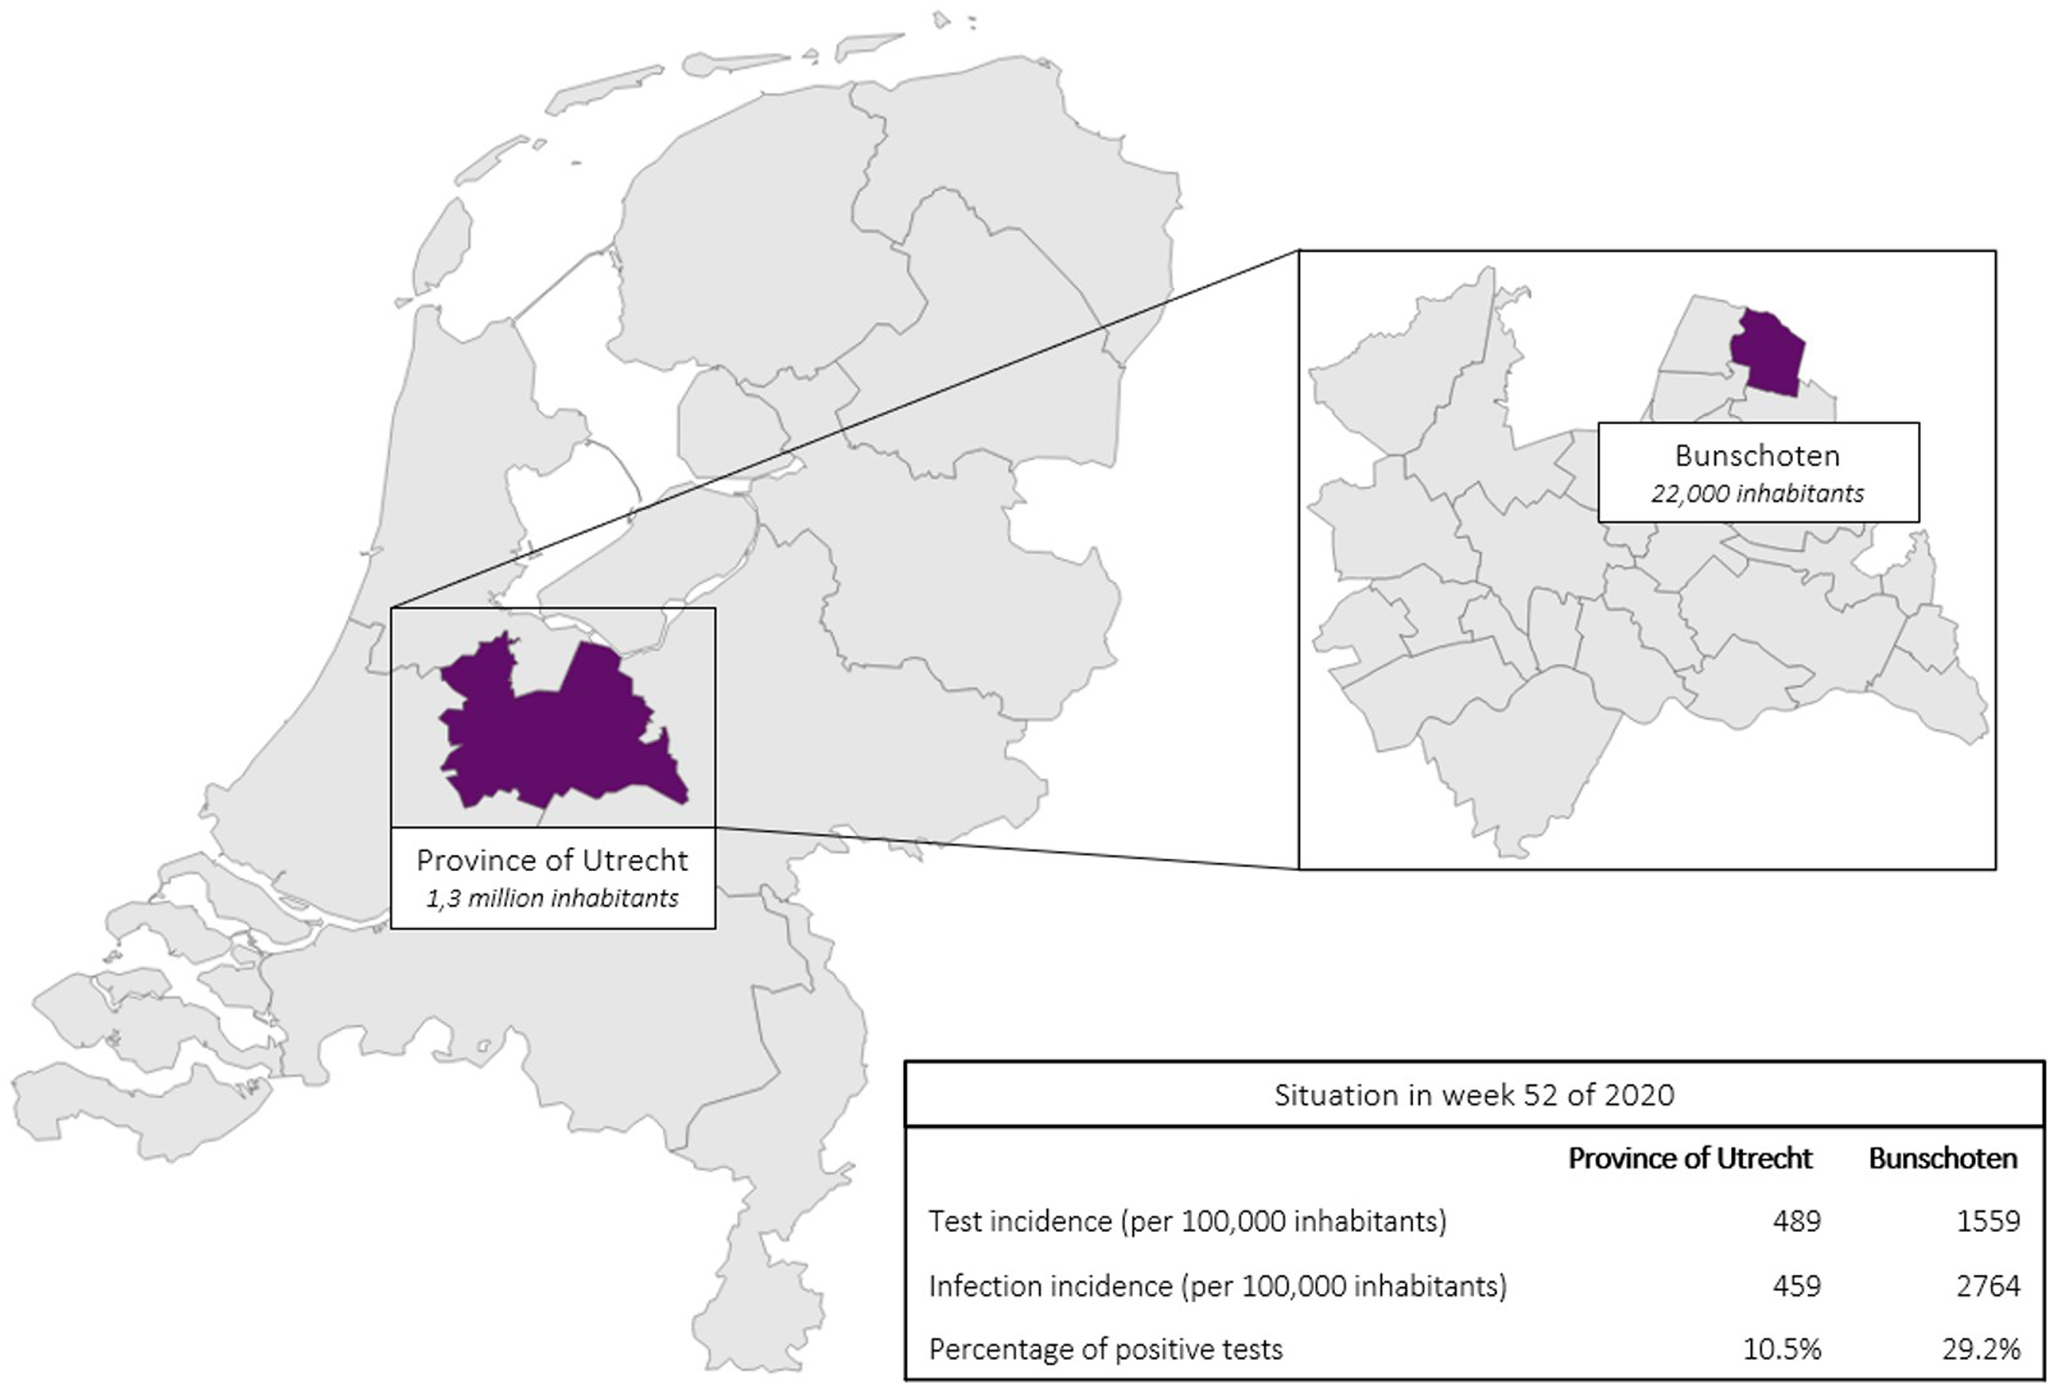
In December 2020, Bunschoten was one of the municipalities with the highest registered incidence of SARS-CoV-2 infections in the Netherlands [4]. In week 52 of 2020, the infection incidence and the percentage of positive tests (PPTs) in Bunschoten was much higher than that in the rest of the province of Utrecht in that same period, Figure 1. Bunschoten is a municipality in the middle of the ‘Dutch Bible belt’, in the province of Utrecht [Reference Ruijs5, 6]. This community is characterised by a high proportion of orthodox protestants with strong social relationships. Even though the municipal health service (MHS) Utrecht region performed source and contact tracing, a specific explanation for the high number of infections was not found. Due to the inexplicable high number of infections at the end of 2020 in Bunschoten, MHS Utrecht region implemented MT [7].
SARS-CoV-2 test incidence, infection incidence and PPTs in the province of Utrecht (excluding Bunschoten) as well as in Bunschoten, situation in week 52 of 2020.
The aim of this study was to investigate the epidemiological effects of the implementation of MT in Bunschoten. Two main objectives were composed: to study the effect of MT on (1) test incidence and (2) the detection and the spread of SARS-CoV-2. It was hypothesised that the test incidence would increase rapidly due to the changed eligibility criteria for testing during MT and easily accessible test facilities. Furthermore, with more tests being executed, a slight increase in SARS-CoV-2 infection incidence was expected.
Methods
Design
Timeframe and place
Test incidence as well as infection incidence in Bunschoten were analysed before, during and after MT in order to investigate the effect of MT. MT lasted 6 weeks, from 8 February to 19 March 2021. Also, to study the effects before and after MT, data of a period of 6 weeks before MT (pre-MT period), from 27 November 2020 to 7 February 2021, as well as 6 weeks after MT (after-MT period), from 22 March 2021 to 2 May 2021, were analysed. Figures show 12 weeks before MT in order to show the trend and the situation in the last weeks of 2020. The other municipalities in the province of Utrecht were chosen as a reference because of its wide variety of municipalities with different population groups. Before MT, at the end of 2020, there were restrictive non-pharmaceutical measures in place which were gradually lifted from April 2021 onwards [8]. Additionally, the number of detected infections increased nationally since February, caused by the emergence of the alpha variant (B.1.1.7) [9].
In the regular test policy of the Netherlands at the time, only symptomatic individuals and contacts of confirmed cases were tested by the MHS and SARS-CoV-2 home-testing kits were not available. During the 6 weeks of MT, all inhabitants of Bunschoten aged 6 years and older were invited to test for SARS-CoV-2 as often as they wished and regardless of the presence of symptoms or contact with a positive case. To facilitate MT, two additional permanent test facilities were set-up in addition to an already existing facility, evenly distributed throughout the municipality, to improve accessibility for all inhabitants. As a fourth testing facility, a mobile test unit alternated between two remote neighbourhoods. Aside from these MT test facilities with extended opening hours, inhabitants of Bunschoten could still test at other MHS test facilities across the Netherlands under similar conditions as for other civilians living outside of Bunschoten.
Test method
During MT, the collected nasopharyngeal swabs were analysed using real-time polymerase chain reaction (RT-PCR), which is the main test method used in the Netherlands for detection of SARS-CoV-2 [10]
Ethics
The Medical Research Ethics Committee of the University Medical Centre Utrecht assessed the study protocol and confirmed that the Medical Research Involving Human Subjects Act (WMO) did not apply. Therefore, this study was exempt from formal medical-ethical approval (reference number: MvdL/mb/21/500143).
Data collection
Effect of MT on test incidence
Data regarding test incidence were extracted from the Dutch national registration system for COVID-19 tests and vaccinations performed by the MHS Utrecht region. This system contains test dates, laboratory results and demographic data [Reference de Gier11]. Data of inhabitants of Bunschoten who tested during MT were compared to the data of inhabitants of the rest of the province of Utrecht who were tested within the regular test facilities during the same period.
Effect of MT on detection and spread of SARS-CoV-2
To investigate the effect of MT on detection of SARS-CoV-2, anonymised data were extracted from HPZone, the regular Dutch national registration system used for source and contact tracing by all MHS in the Netherlands [Reference de Gier11]. This database entailed the MHS medical file of all SARS-CoV-2-infected individuals in the province of Utrecht including important characteristics, such as the symptoms experienced during SARS-CoV-2 infection. Cases were contacted immediately after a positive test as part of routine source and contact investigation and 5 and 10 days later for follow-up. Again, data of infected inhabitants of Bunschoten were compared to the data of inhabitants of the rest of the province of Utrecht during the same period.
Data analysis
Outcome measures
Test incidence (number of performed tests per 100 000 inhabitants) and SARS-CoV-2 infection incidence (number of detected active infections per 100 000 inhabitants) in Bunschoten were the primary outcome measures, which were analysed over time and compared to the rest of the province of Utrecht. Incidences were calculated per 100 000 inhabitants and per week. The PPT was calculated by dividing the number of positive test results by the total number of tests performed with valid outcome. Besides, an alternative PPT calculation based on individuals instead of tests was performed. With this method, the number of inhabitants with an active infection was divided by the unique number of individual test facility visitors per week.
To study whether MT had motivated other population groups to get tested than in the pre-MT period, the distribution of gender and age regarding test incidence between Bunschoten and the other municipalities in the province of Utrecht was compared in the pre-MT period and during MT. To study whether infections were detected differentially across the population before and during MT, gender and age distributions were also compared. The distribution of age category was calculated as a percentage of the total population in that age category.
Positive test outcomes were classified in three types, distinguished based on symptoms: a symptomatic case, a pre-symptomatic case and an asymptomatic case. A symptomatic case is defined as a patient who develops symptoms, whether prior to the test appointment or after the test appointment. A pre-symptomatic case is defined as a patient who develops symptoms after the test appointment. An asymptomatic case is defined as a patient experiencing no symptoms at least 5 days after the positive test [Reference Savvides and Siegel12]. The number of detected pre-symptomatic and asymptomatic cases in Bunschoten during MT was described as a proportion of the total number of inhabitants with an active infection and compared to the pre-MT period. To assess whether infections were detected earlier due to MT, the difference in days between date of onset of symptoms and the moment of testing was calculated per week.
Since RT-PCR for detection of SARS-CoV-2 is very sensitive (estimated sensitivity of 89% [Reference Jamal13]), in some individuals viral RNA can be detected for more than 8 weeks after an infection, which can be a disadvantage in case of MT (indirectly encouraging people to test repetitively, regardless of previous test results) [14]. Detection of residual viral RNA could lead to unjustified isolation of persons with a positive RT-PCR test result, while the person is not contagious anymore [Reference Piralla15]. In order to specify the current status of the patient's infection, inhabitants with a positive RT-PCR result were strongly advised to return for a second test within 3 days after the first positive test. The viral load of the first positive test, determined by the number of replication cycles (Ct), was compared to the viral load of the second test result in order to distinguish (early) active infections from recent or late/old SARS-CoV-2 infections, according to Table 1 [Reference Sethuraman, Jeremiah and Ryo25].
Interpretation of number of Ct to determine the policy of someone that tested positive for SARS-CoV-2

Statistical analysis
All statistical analyses over time, as well as the comparison between Bunschoten and the other municipalities of the province of Utrecht, were performed using the 95% confidence interval (CI). Visualisations have been made using Microsoft PowerBI Desktop (version April 2021).
Results
Test incidence
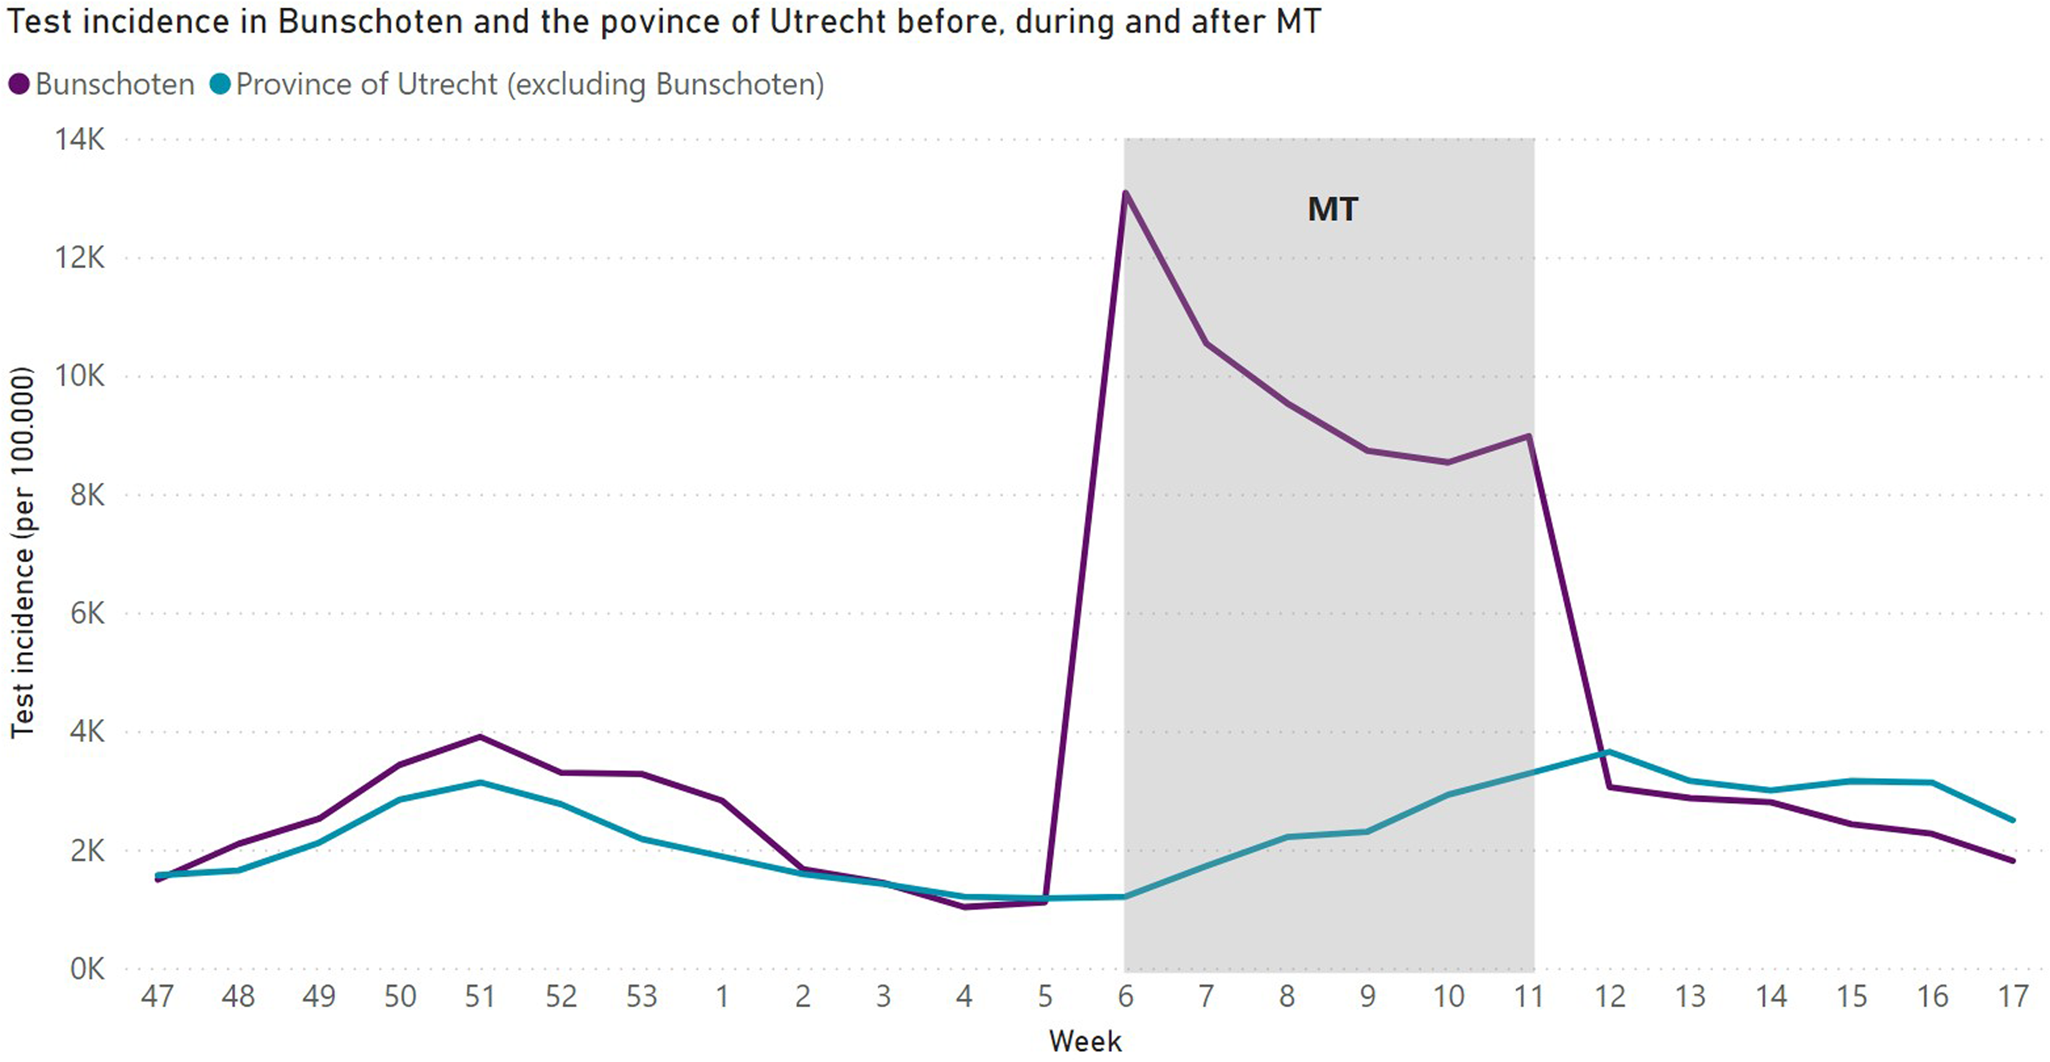
In total, 12 910 SARS-CoV-2 tests were executed in 8321 inhabitants of Bunschoten aged 6 years and older during MT. Of the total 21 189 inhabitants of Bunschoten, 39.2% got tested during MT. Among the tested individuals, 64% got tested once, 23.3% got tested twice and 12.1% got tested more than twice. In Figure 2, test incidence for Bunschoten as well as the province of Utrecht is displayed per 100 000 inhabitants per week. When MT started in week 6 of 2021, there was an almost 12-fold increase in test incidence compared to week 5 in Bunschoten. During MT, the test incidence in Bunschoten (9900 (95% CI 8525– 11 275)) was significantly higher compared to the province of Utrecht (2274 (95% CI 1665–2883) (Table 2). In the pre-MT period, there was no significant difference in test incidence between Bunschoten (1890 (95% CI 1140–2640)) and the province of Utrecht (1573 (95% CI 1257–1889)), the same accounts for the after-MT period (Bunschoten: 2537 (95% CI 2169–2906); province of Utrecht: 3097 (95% CI 2801–3393)). Also, no significant difference in test incidence in Bunschoten between pre-MT period (1890 (95% CI 1140–2640)) and after-MT period (2537 (95% CI 2169–2906)) was detected.
SARS-CoV-2 test incidence in Bunschoten and the province of Utrecht per week from week 47 in 2020 until week 17 in 2021 per 100 000 inhabitants.
Mean weekly SARS-CoV-2 test and infection incidence and mean PPTs, with 95% CI, in Bunschoten and the province of Utrecht (excluding Bunschoten), in the pre-MT period, during MT and in the after-MT period

Infection incidence
In total, 646 inhabitants with an active infection (as defined in Table 1) were found during MT. In Figure 3, the trend of the infection incidence for Bunschoten as well as the province of Utrecht is presented. In the pre-MT period, Bunschoten (486 (95% CI 209–764)) had a higher infection incidence compared to the province of Utrecht (182 (95% CI 132–233)), but this was not significant (Table 2). During MT, the infection incidence was significantly higher in Bunschoten (504 (95% CI 396–612)) than in the province of Utrecht (158 (125–190)). Moreover, there was a significant difference in infection incidence between Bunschoten (400 (95% CI 361–439)) and the province of Utrecht (254 (95% CI 234–274)) in the after-MT period. Furthermore, there was no significant difference in average detected infection incidence in Bunschoten between the pre-MT period (486 (95% CI 209–764)) and after-MT period (400 (95% CI 361–439)). Assuming that infection incidence during the study period (weeks 6–11) in Bunschoten would have stayed at the same level as before the intervention (week 5), MT caused a 3.3-fold increase in detected active infections. Second, assuming that the course of infection incidence in Bunschoten would have been the same as in the rest of the province of Utrecht during the intervention (weeks 6–11), MT caused a 3.2-fold increase in detected active infections.
SARS-CoV-2 infection incidence in Bunschoten and the province of Utrecht per week from week 47 in 2020 until week 17 in 2021 per 100 000 inhabitants.

Percentage of positive tests
In the pre-MT period, Bunschoten (18.5% (95% CI 14.1–22.9)) had a very high PPT which was significantly higher compared to the province of Utrecht (9.9% (95% CI 8.9–10.4)). In the first week of MT, the PPT in Bunschoten dropped to 4.0% (Fig. 4), mostly due to the high number of performed tests in that week. This effect diminished when MT progressed, to an average of 7.1% (95% CI 5.7–8.5) during MT. In the province of Utrecht, there was an average PPT of 7.0% (95% CI 5.7–8.1) during MT, which was approximately equal to the average of Bunschoten. In the after-MT period, the PPT in Bunschoten (15.1% (95% CI 12.8–17.3)) was again significantly higher compared to the province of Utrecht (7.5% (95% CI 6.4–8.5)). Bunschoten showed an increasing PTT pattern, while the PPT of the rest of the region stayed at the same level. When calculating PPT per individual instead of per test, the average PPT in Bunschoten was 5.5% (95% CI 4.2–6.8) and 7.3% (95% CI 6.3–8.3) in the province of Utrecht during MT, also not significantly different.
Percentage of positive SARS-CoV-2 tests (regular calculation) per week in Bunschoten and the province of Utrecht from week 47 in 2020 until week 17 in 2021.

Asymptomatic cases, pre-symptomatic cases and difference between onset of symptoms and test date
In total, 80 inhabitants of Bunschoten with an active infection were asymptomatic (as per the definition in the methods) during MT. This accounts for an average of 12.4% of the detected individuals with an active infection. In the pre-MT period, an average of 5.6% was asymptomatic, indicating a 6.8 percentage point (233%) increase during MT. Fourteen inhabitants of Bunschoten with an active infection were pre-symptomatic during MT, which is 2.1% of the detected individuals with an active infection, compared to 1.7% pre-symptomatic cases in the pre-MT period. Therefore, there was a 0.4 percentage point (124%) increase in pre-symptomatic cases during MT. Since 12.4% of the detected active infections were found in asymptomatic individuals and 2.1% of the individuals were pre-symptomatic, 85.5% of infections were found in symptomatic individuals. In the pre-MT period, the difference between the onset of symptoms and the date of testing was on average 2.1 days. During MT, the difference between onset of symptoms and date of testing was 1.6 days on average, which was 0.5 days less.
Population groups
To study whether MT had motivated other population groups to test and whether it led to differential distribution of positively tested persons, age and gender distribution was analysed for both (data not shown). There were no substantial differences in gender distribution regarding test and infection incidence between Bunschoten and the province of Utrecht in the pre-MT period and during MT. The distribution of age in test incidence between Bunschoten and the province of Utrecht was comparable in the pre-MT period. However, there was a relatively higher test incidence in the age groups older than 50 years in Bunschoten compared to the province of Utrecht during MT. The test incidence in Bunschoten shifted to the older population in the period of MT compared to the pre-MT period.
Discussion
In this study, we assessed the effects of MT on test incidence and the detection of SARS-CoV-2 in Bunschoten, a Dutch municipality in the province of Utrecht. It was shown that MT had a major effect on test incidence in Bunschoten, which was significantly higher compared to the province of Utrecht during MT. In the pre-MT and after-MT periods, the test incidence in Bunschoten was comparable to the province of Utrecht. Furthermore, there was an immediate increase in the number of detected active infections in Bunschoten during MT, in contrast to a stabilisation of the detected infection incidence in the province of Utrecht. Also, we showed that there was a shift in age distribution of test incidence to the older population during MT, a relative increase in asymptomatic cases, and in pre-symptomatic cases. Additionally, there was a decrease of 0.5 days between onset of symptoms and test date. This study has shown that MT increases test incidence and helps to get a more complete view of the presence of SARS-CoV-2 in a community.
Adequate surveillance and a thorough test, trace and isolate (TTI) policy are the cornerstones of an effective infection prevention strategy [Reference Grantz16]. It is hypothesised that MT offers a major contribution to both surveillance and TTI and could thereby have a great impact on the spread of SARS-CoV-2. Experimental evidence is, however, limited to a setting with low incidence of SARS-CoV-2 [Reference Zhou17]. An MT campaign in Slovakia showed a decrease in infection incidence, but their modelling suggested that the decrease did not exclusively result from MT and also required the impact of isolation and quarantine measures [Reference Pavelka18]. Furthermore, a Dutch modelling study has shown that a strategy based solely on MT would require unrealistically high test frequencies to effectively stop spread of SARS-CoV-2 when control measures, e.g. social distancing and usage of face masks, were to be relaxed [Reference Bosetti19, Reference Bootsma20]. The use of MT as an additional measure in a high-incidence community has to our knowledge not been studied before. The results of this study match the results of the Slovakian study, by showing a better representation of the number of active infections in the community. This improved detection also improves isolation and quarantine possibilities, the effect of which could be shown by studying various viral spread indicators (e.g. number of detected clusters and outbreaks, secondary attack rate). However, it turned out to be impossible to reliably document these indicators in our setting. So, while we were unable to support the effect on the spread of COVID-19 with reliable data in this setting, it is likely that timely isolating infected individuals and quarantining their households should also lower infection incidence over time.
Although we carefully claim some positive effects of MT in a setting of high COVID-19 incidence, there are several practical implications to take into consideration. First, the speed of implementation of MT is very important. Once MT was operational in Bunschoten, the infection incidence had already decreased to the average levels of the province of Utrecht and hence, MT seemed no longer as urgent as before in the view of the inhabitants. As a result, the willingness of the inhabitants of Bunschoten to get tested may have dropped in the aftermath of the December outbreak. Therefore, when considering implementing MT to control an outbreak, it is important to start MT as soon as an inexplicable rapid increase in infection incidence occurs. Clear communication regarding the goal and necessity of MT campaign adapted to target groups is helpful in increasing voluntary test willingness [Reference Raffle, Pollock and Harding-Edgar21, Reference Raffle and Taylor-Phillips22]. Furthermore, the protocol regarding late inactive infections with long lasting RNA shredding should be carefully developed in advance. Offering a re-test to every individual with a positive test result could prevent unnecessary quarantine and self-isolation of contacts, when including RT-PCR test in the MT test policy. Finally, implementation of MT is very expensive regarding costs and MHS capacity and could also be burdensome for the assigned population [23].
Limitations
Our study has limitations. First, in the results we made two assumptions regarding infection incidence on the effectiveness of MT, e.g. (1) infection incidence in Bunschoten would stay similar to what it was before the intervention started and (2) infection incidence in Bunschoten would be similar to the province of Utrecht during the intervention. These assumptions suggested that MT caused up to a 3.3-fold increase in detected active infections. It is not possible to validate these assumptions, but it does indicate a bandwidth of possible effectiveness of MT. Second, a regularly used measurement to indicate the infection rate in a population is the PPT. In these circumstances this measurement was less useful since part of the positive test results could be related to old infections, which could have led to an overrepresentation of the number of positive tests. At the same time, inhabitants could get tested more than once, which could lead to an underestimation of the PPT. Therefore, the PPT was not an effective measurement to express the infection pressure in this case. To overcome this, we showed an alternative PPT calculation, which was more reliable. However, since this calculation is not used in national SARS-CoV-2 surveillance, it is not possible to relate this outcome to national PPT calculations.
Third, viral spread indicators (secondary attack rate and registered cluster and outbreaks) were influenced by many factors, including the infection rate at a given moment, changes in general control measures and the capacity and quality of the source investigation, contact tracing process and quality of registered data. Consequently, it was impossible to distinguish the effect of MT in the spread of SARS-CoV-2 from other influencing factors. Further research should be performed to determine the effect of MT on viral spread. Fourth, a questionnaire was included in the study design for analysis of social demographic characteristics. Yet, results were not representative due to a small control group and overrepresentation of certain population groups. Future research should look further into the effect of MT on different population groups. Finally, during a pandemic, the epidemic phase and the implemented control measures vary constantly, which may have influenced the results [8]. For example, primary schools opened at the start of MT after being closed for more than 1 month, which could have led to higher infection incidence. Therefore, we compared our results with the province of Utrecht as a reference, as well as time periods before and after MT.
Conclusions
A strategy of MT is successful to detect a larger number of active COVID-19 cases and could be a useful tool in specific situations with a defined target group or goal to get a more complete view of the presence of SARS-CoV-2 in a community, including the early spread of a variant of concern in a population or an outbreak in a specific population. However, the effect on the spread of SARS-CoV-2 remains inconclusive. Furthermore, MT should be implemented with other control measurements, including isolation of infected individuals, personal hygiene and social distancing [Reference Mbwogge24]. Since the effect on viral spread remains inconclusive, MT has a large impact on MHS capacity and is costly; the question remains open whether the use of MT is proportionate to the overall gain.
Acknowledgements
The authors acknowledge the work of all mass testing organisers within the municipal health service Utrecht region, the municipality of Bunschoten and UMC Utrecht. Furthermore, the authors thank all inhabitants of Bunschoten who got tested during the MT.
Financial support
This work was funded by the Dutch Ministry of Health, Welfare and Sports.
Conflict of interest
All authors report no potential conflicts of interest.
Data availability statement
The datasets generated during this study are not publicly available because publicly sharing the data would not be in accordance with participant's consent obtained for this study. Data are available from the corresponding author on reasonable request.


 Open access