

1. Introduction
Scholars have long noted that government support and vote intentions can respond to unexpected ‘acts of God’ that lie outside politicians’ direct control and that these shocks can generate attribution errors when citizens mistakenly blame or credit incumbents (e.g., Achen and Bartels, Reference Achen and Bartels2004; Healy and Malhotra, Reference Healy and Malhotra2013; Catalinac and Muraoka, Reference Catalinac and Muraoka2023; Kondoh and Miyazaki, Reference Kondoh and Miyazaki2024). A large body of work links changes in support to natural hazards and disasters, including typhoons and storms (Malhotra and Kuo, Reference Malhotra and Kuo2008; Healy and Malhotra, Reference Healy and Malhotra2009), floods (Bechtel and Hainmueller, Reference Bechtel and Hainmueller2011; Visconti, Reference Visconti2022), droughts (Cooperman, Reference Cooperman2022), rainfall (Cole et al., Reference Cole, Healy and Werker2012; Gallego, Reference Gallego2018; Fukumoto and Kikuta, Reference Fukumoto and Kikuta2024), snowfall (Catalinac and Muraoka, Reference Catalinac and Muraoka2023), earthquakes (Masiero and Santarossa, Reference Masiero and Santarossa2021), and other large-scale crises (Gasper and Reeves, Reference Gasper and Reeves2011; Chang and Berdiev, Reference Chang and Berdiev2015; Kondoh and Miyazaki, Reference Kondoh and Miyazaki2024), as well as to infectious disease outbreaks. In many of these settings, increases in support appear where some groups receive targeted private goods, such as post-disaster reconstruction assistance (Healy and Malhotra, Reference Healy and Malhotra2009; Catalinac and Muraoka, Reference Catalinac and Muraoka2023; Fukumoto and Kikuta, Reference Fukumoto and Kikuta2024). More recent work has increasingly shown that even in the absence of such material benefits, politically irrelevant events can still alter political attitudes by inducing misattribution of responsibility.
Within this literature, particular attention has been paid to sporting events as examples of non-political shocks (Healy et al., Reference Healy, Malhotra and Mo2010; Fowler and Pablo Montagnes, Reference Fowler and Pablo Montagnes2015; Busby et al., Reference Busby, Druckman and Fredendall2017; Gassmann et al., Reference Gassmann, Haut and Emrich2020; Kerry et al., Reference Kerry, Murray, Harman and McCord2021; Rapeli and Söderlund, Reference Rapeli and Söderlund2022; Kikuta and Uesugi, Reference Kikuta and Uesugi2023; Müller and Kneafsey, Reference Müller and Kneafsey2023). Previous research examines the roles of American football (Healy et al., Reference Healy, Malhotra and Mo2010; Graham et al., Reference Graham, Huber, Malhotra and Mo2023), Ireland’s Gaelic football (Müller and Kneafsey, Reference Müller and Kneafsey2023), association football (soccer) (Gassmann et al., Reference Gassmann, Haut and Emrich2020; Kikuta and Uesugi, Reference Kikuta and Uesugi2023), and other nationalistic sporting events (Rapeli and Söderlund, Reference Rapeli and Söderlund2022). Several studies report that such contests can causally influence support for the government, although the overall evidence remains mixed. Fowler and Montagnes (Reference Fowler and Montagnes2023: 308) argue that ‘in the cases of … college football, the initially published results appear to have been false positives or significant overestimates’, and other scholars raise similar concerns about the robustness of sport-related effects (Busby and Druckman, Reference Busby and Druckman2018; Fowler and Pablo Montagnes, Reference Fowler and Pablo Montagnes2015; Rapeli and Söderlund, Reference Rapeli and Söderlund2022).
In this strand of research, sporting contests are typically treated as ‘politically irrelevant events’ in a broad sense, meaning shocks whose immediate outcomes are, for most voters, largely independent of the day-to-day decisions and competence of the national government (Achen and Bartels, Reference Achen and Bartels2004, Reference Achen and Bartels2016; Healy et al., Reference Healy, Malhotra and Mo2010; Fowler and Pablo Montagnes, Reference Fowler and Pablo Montagnes2015; Kikuta and Uesugi, Reference Kikuta and Uesugi2023).Footnote 1 Building on this definition, voter attribution error is understood as arising in cases where the specific result and timing of a match, such as which competitor wins a final on a given day, lie outside the cabinet’s direct control but are nonetheless interpreted by citizens as direct indicators of government performance, and previous studies have systematically examined whether such patterns can be observed.
A particularly important question is whether events that strongly evoke popular nationalism, yet remain politically irrelevant in the sense used here, can nonetheless trigger motivated reasoning (Kunda, Reference Kunda1990; Taber and Lodge, Reference Taber and Lodge2006) in favour of the government. Olympic medal victories provide a natural case for examining this possibility. The Olympics create conditions in which political support can be easily activated, and the celebratory atmosphere they generate may serve as a heuristic that voters use when forming political judgements (Healy et al., Reference Healy, Malhotra and Mo2010). Thus, it is natural to ask whether Olympic events, where a festive mood might offer such a shortcut, actually lead citizens to misattribute government responsibility and temporarily increase their support for the incumbent government.Footnote 2 Despite this strong theoretical foundation, there is still little design-based research examining the immediate responses and mechanisms by which Olympic results affect government support.
To address this gap, we conducted a combination of natural and survey experiments during the 2024 Paris Olympics, recruiting Japanese participants (total n = 1, 347). Our design relied on short time windows to capture immediate reactions and shifts in opinion. We invited respondents to complete our survey both before and after the Women’s Judo 48-kilogram final on July 28 (final sample n = 741) and the Men’s Judo 66-kilogram final on July 29 (final sample n = 606). The natural experiment uses a regression discontinuity design (RDD) (Calonico et al., Reference Calonico, Cattaneo and Titiunik2014) to estimate the sharp average treatment effect (SATE) of these events, supplemented with robustness checks guided by the unexpected-events-during-survey design (UESD) framework (Muñoz et al., Reference Muñoz, Falcó-Gimeno and Hernández2020). Importantly, our setup allows us to distinguish the effect of winning Japan’s first gold medal (Women’s Judo) from the effect of winning a subsequent gold medal (Men’s Judo). Although our analysis shares key features with UESD by focusing on short-term outcomes, it also benefits from advanced planning around these events, enabling us to implement many additional diagnostic checks recommended in the UESD literature.
The Japanese case provides a useful setting for examining whether sporting events can raise political support even when government approval is already extremely low and shows little prospect of improving. As of July 2024, just before the Olympics, approval ratings for Fumio Kishida’s cabinet had dropped to low levels (Jiji Press, July: 15.5%; Asahi Shimbun, June: 22%; NHK, July: 25%). Despite favourable economic conditions, such as the Nikkei Stock Average reaching a record high in July 2024, there were no clear signs of a rebound in support. In this politico-economic environment, any increase in respondents’ support after watching the Olympic opening ceremony or judo results would provide strong evidence that the excitement and patriotic sentiment generated by major sporting events can temporarily boost support for an unpopular government. Conversely, if no change is observed, it would suggest that the political climate is too entrenched for even large, positive shocks to influence public opinion. This, in turn, would imply that the effects of sports-related enthusiasm, patriotism, and mood formation on political support are limited and that attribution errors triggered by sporting events have only minimal impact.
Our main contribution is to show that, despite the nationalism and sense of societal cohesion generated by Japan’s first and second gold medals, their effects on political support and responsibility attributions are limited. Our findings indicate that, in this setting, voters do not strongly conflate the exogenous shock of sporting outcomes with government performance, and any misattribution that may occur appears modest at best. At a minimum, our results suggest that political reactions to major sporting events vary substantially across contexts.
In what follows, we first review prior research on attribution errors and outline the theoretical frameworks of studies that focus specifically on sports. We then develop hypotheses about the relationship between sporting events and misattribution and discuss why the Japanese case is well suited for examining these dynamics. Section 3 describes the data collection process, variable construction, and empirical strategy, while Section 4 presents the RDD results along with robustness checks informed by the UESD framework. Section 5 concludes with a discussion of implications and directions for future research.
2. Theoretical considerations: from simple wins to ritualistic enthusiasm in the Olympic Games
2.1. Attribution errors and their inconclusive findings: sports as politically irrelevant events
The ability of voters to correctly assign responsibility to the government for its political–economic performance is fundamental to electoral accountability (Ashworth, Reference Ashworth2012). A large body of research therefore examines how retrospective evaluations of government performance can become distorted when they respond to random external shocks that carry no substantively relevant political information (Healy and Malhotra, Reference Healy and Malhotra2013). The evidence on such attribution errors remains inconclusive (see Table A1 in Supplementary Information (SI) A).
A prominent example of such random external shocks is provided by sporting events (Healy et al., Reference Healy, Malhotra and Mo2010; Fowler and Pablo Montagnes, Reference Fowler and Pablo Montagnes2015; Busby et al., Reference Busby, Druckman and Fredendall2017; Busby and Druckman, Reference Busby and Druckman2018; Fowler and Hall, Reference Fowler and Hall2018; Kerry et al., Reference Kerry, Murray, Harman and McCord2021; Matti and Zhou, Reference Matti and Zhou2022; Rapeli and Söderlund, Reference Rapeli and Söderlund2022; Kikuta and Uesugi, Reference Kikuta and Uesugi2023; Müller and Kneafsey, Reference Müller and Kneafsey2023). The outcomes of sporting events are highly exogenous for most citizens, provide no direct economic benefits or material compensation to the general public, and relate to politics only indirectly. Nonetheless, they can still shape political attitudes and levels of political support.
Early research on sports and politics focused on voters’ cognitive processes, arguing that positive emotions, such as the euphoria or satisfaction produced by a favoured team’s or athlete’s victory, can (mistakenly) serve as cues in favour of the incumbent. Healy et al. (Reference Healy, Malhotra and Mo2010) argue that voters may substitute cognitively demanding evaluations of government performance with a simple ‘mood’ heuristic, and that this mood can be used, albeit incorrectly, as a signal of good incumbent performance on election day. They hypothesise that ‘voters’ decisions are affected by events separate from politics, because (i) they have been shown to significantly affect people’s well-being, either directly or via mood contagion in social networks, and (ii) they are unrelated to public affairs’ (12807). Their study was among the first to treat sporting events as random shocks for examining attribution errors.
Subsequent research has emphasised that sports do not merely provide a simple heuristic based on match outcomes but can shape political awareness and identity in more fundamental ways (Kikuta and Uesugi, Reference Kikuta and Uesugi2023). Existing studies suggest that, following sporting successes, ideological cohesion may increase (Matti and Zhou, Reference Matti and Zhou2022), and they point to possible mechanisms through which the positive mood generated by victories may spill over into the political domain (Busby et al., Reference Busby, Druckman and Fredendall2017; Busby and Druckman, Reference Busby and Druckman2018). Sporting wins also reinforce cohesion within the in-group, and this sense of unity can extend to broader social contexts (Kerry et al., Reference Kerry, Murray, Harman and McCord2021). At the same time, research on national pride suggests that macro-level increases in pride after sporting events are typically modest and short-lived (Liu and Hong, Reference Liu and Hong2010; Elling et al., Reference Elling, Van Hilvoorde and Remko2014; Gassmann et al., Reference Gassmann, Haut and Emrich2020; Shimokubo, Reference Shimokubo2023). Whether such pride translates into political influence depends on how leaders and the media frame the event afterward, as well as on how consequential the public perceives the success to be (Rhamey and Early, Reference Rhamey and Early2013).Footnote 3
These findings indicate that the mechanisms connecting sporting events, government performance, and citizens’ assignment of responsibility are highly multifaceted. They highlight the need for decisive empirical tests that can determine whether, and under what conditions, the outcomes of ordinary sporting events actually translate into increased support for the government.
2.2. Insights from the Olympics and hypothesis setting
Recent design-based research (including research with the UESD framework (Muñoz et al., Reference Muñoz, Falcó-Gimeno and Hernández2020)) has shown that the impact of various sporting events on incumbent support is quite limited (see the null results summarised in Table A1 in SI A). Fowler and Pablo Montagnes (Reference Fowler and Pablo Montagnes2015) re-examine the effects of college football outcomes originally reported by Healy et al. (Reference Healy, Malhotra and Mo2010) and conclude that the causal impact on incumbent support, if any, is small. Similarly, Müller and Kneafsey (Reference Müller and Kneafsey2023: 312) analyse the influences of Gaelic football and hurling on general and local election results in Ireland, concluding that ‘concerns about the rationality and competence of voters may be overstated and that the mechanisms of electoral accountability are too nuanced to infer that voters are insufficiently rational’.
Survey experiments by Busby et al. (Reference Busby, Druckman and Fredendall2017) and Busby and Druckman (Reference Busby and Druckman2018) also show that even when irrelevant-event effects do appear, they are tightly constrained. Busby et al. (Reference Busby, Druckman and Fredendall2017) replicate the approach of Healy et al. (Reference Healy, Malhotra and Mo2010) around a major college football championship by randomly assigning students to be surveyed before or after the game and find that the outcome can shift presidential approval and mood in the short run but that these effects dissipate quickly. They note that the political consequences of the game are ‘more akin to brief blips than enduring changes’ (Busby and Druckman, Reference Busby and Druckman2018: 3). Busby and Druckman (Reference Busby and Druckman2018) further show that sporting events can influence political attitudes, although these effects are confined to a limited set of outcomes, and conclude that ‘while the effects clearly can occur, their relevance to politics remains unclear’ (1).Footnote 4
These studies suggest that sporting events may sometimes produce short-lived, mood-driven fluctuations in political evaluations, but that such effects are small, fragile, and highly context-dependent. This, in turn, casts doubt on whether even highly ceremonial and emotionally salient sporting events can produce more than fleeting and marginal changes in political support.
Turning to the Olympics, the paradigmatic example of large-scale sporting events, Rapeli and Söderlund (Reference Rapeli and Söderlund2022) examine whether nationally significant athletic successes, such as winning an Olympic gold medal, generate collective emotional experiences and greater social cohesion in Finland. They argue that such a broadly shared positive mood could translate into politics, producing a ‘rally-around-the-flag’ effect in support for the government. They consider that the Olympics may influence perceptions of government responsibility through patriotism and the accompanying sense of ideological unity, rather than simply offering a heuristic based on match results. Nevertheless, Rapeli and Söderlund (Reference Rapeli and Söderlund2022) show that, even once the institutional context of a multiparty system is taken into account, the Olympics do not exert any substantive effect on support for either the governing party or the prime minister.Footnote 5
As Rapeli and Söderlund (Reference Rapeli and Söderlund2022: 3) explicitly highlight in motivating their case selection, ‘nationally important sports success, such as winning an Olympic gold medal, creates a collective emotional experience coupled with an increased sense of social cohesion’, which can plausibly spill over into higher government support in a manner akin to a rally-around-the-flag response. Building on this insight, the Olympics – paradigmatic examples of large-scale sporting events – provide an especially rich case for studying how such collective emotions and identity-based mechanisms translate into political attitudes. The nationalism and ideological cohesion fostered by the ceremonial and ritualistic character of the Olympic Games (Elling et al., Reference Elling, Van Hilvoorde and Remko2014; Rolf, Reference Rolf2023) create a favourable context for analysing how mood and collective identity (Allison and Monnington, Reference Allison and Monnington2002; Finlay and Xin, Reference Finlay and Xin2010; Liu and Hong, Reference Liu and Hong2010; Cheng et al., Reference Cheng, Rosner, Chao, Peng, Chen, Li, Kwong, Hong and Chiu2011; Rhamey and Early, Reference Rhamey and Early2013; Bezerra et al., Reference Bezerra, Cramer, Hauser, Miller and Volgy2015; Shimokubo, Reference Shimokubo2023) interact with voters’ perceptions of government responsibility.
Our theoretical claim is that, in the setting of the Olympic Games and similar international sports festivals, the symbolism, ritualism, and exuberance of these events primarily strengthen social cohesion (Allison and Monnington, Reference Allison and Monnington2002; Liu and Hong, Reference Liu and Hong2010; Shimokubo, Reference Shimokubo2023), generate politically salient enthusiasm, and reinforce solidarity within the domestic in-group (Liu and Hong, Reference Liu and Hong2010). At the same time, we see little reason to expect these dynamics to extend into broader or more universal forms of cohesion. In this sense, even when the outcomes of Olympic competitions and other major sporting events take their most intense and visible form, they are unlikely, by themselves, to serve as a decisive source of voters’ errors in assigning responsibility.
Building on this theoretical claim, the central premise of our analysis is that the emotional response to a nation’s athletes winning gold medals can influence political attitudes in the narrow sense described above and, in some cases, may distort them. Prior studies show that the enthusiasm generated by such victories can, under certain conditions, temporarily increase support for the incumbent government. At the same time, the literature reviewed above suggests that even when such effects occur, they tend to be small and short-lived and that they depend strongly on how elites frame the event and on how consequential citizens perceive the victory to be. If we fail to detect even short-term increases in support under a design that carefully brackets the moments just before and after gold medals are won, it is difficult to expect that the effects would persist over longer time horizons. In that case, our findings reinforce existing work that portrays the political impact of the Olympics on government support as, at most, limited.
To evaluate this theoretical claim and adjudicate among these competing expectations, we present new, tightly designed evidence from the 2024 Paris Olympics on whether highly salient Olympic victories generate detectable changes in political support. We focus specifically on the impact of Japan’s first and second gold medals during the Games. Rather than relying solely on pre-existing observational data, we collected carefully controlled survey data immediately before and after each event, which allows us to identify the short-term effects of these Olympic results.
We treat the Japanese judo finals as a particularly demanding test case for assessing whether even highly salient, nationally symbolic victories produce detectable changes in cabinet approval in the immediate aftermath of the events. We propose the following hypotheses:
H1: Winning a gold medal increases support for the incumbent government.
H2: Winning a gold medal generates more favourable emotions toward the current government.
2.3. Empirical context: why Japan’s judo case serves as an ideal case for testing hypotheses
Japanese judo provides a compelling test case for these hypotheses, given Japan’s particular political and cultural environment. Our focus on judo, a sport that originated in Japan and is deeply embedded in Japanese culture, offers a distinctive opportunity to study nationalistic responses. The women’s 48 kg judo final on July 28, in which Natsumi Tsunoda was widely expected to secure Japan’s first gold medal, and the men’s 66 kg final on July 29, in which Hifumi Abe was expected to win the second, were selected because they were likely to attract intense public attention, as illustrated in Figure 1.Footnote 6 Judo, whose rules and techniques are largely codified and expressed in Japanese, occupies a particularly symbolic place for many Japanese citizens, making these events natural candidates for generating national pride and, potentially, for influencing political support.
Volleyball and judo attract more interest among Japanese respondents.

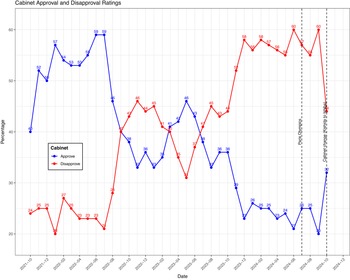
The Kishida administration, interestingly, faced the 2024 Paris Olympics with cabinet approval ratings at relatively low levels, making it an opportune moment to test whether sporting success could provide a much-needed boost (Figure 2). As of July 2024, just before the Olympics, Kishida’s cabinet approval ratings had plummeted. Despite a booming stock market and significant yen depreciation, these economic factors did not translate into increased political support. This politically stagnant environment provided a natural context for assessing whether the emotional highs of Olympic victories could reverse the trend.
Declining cabinet approval and rising disapproval under the Kishida administration.
Note: This figure shows cabinet approval and disapproval for the Fumio Kishida administration from its inception through the July 2024 Olympics, based on NHK polling. The blue line represents cabinet approval, the red line represents cabinet disapproval, and the labels report the corresponding percentages.

Our analysis tests the above hypotheses by examining the effects of Japan’s first and second gold medals on political support and favourable emotions toward the government. We focus specifically on these events, given their potential to generate a strong nationalistic response at a time when no other medals had yet been won by Japan.
3. Data collection, variables, measurement, and estimation strategy
3.1. Data collection
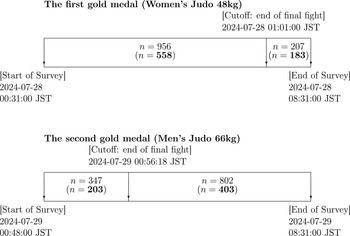
Data for this study were collected through two rounds of online surveys conducted immediately before and after key events during the 2024 Paris Olympics.Footnote 7 As shown in Figure 3, both surveys were designed to capture periods before and after Japanese athletes won gold medals.Footnote 8 The first online survey was conducted from 00:31 to 8:31 (JST) on July 28, just before the final match of the Women’s 48 kg judo competition. The second online survey was conducted from 00:48 to 8:31 (JST) on July 29, just before the final match of the Men’s 66 kg judo competition. In both surveys, we recruited respondents using PureSpectrum Inc.Footnote 9 The number of respondents in the first survey was 1,163, of whom 741 observations were used in the analysis, and the number of respondents in the second survey was 1,149, of whom 606 observations were used in the analysis.Footnote 10
Survey timelines and cutoff points for two judo events during the 2024 Paris Olympics.
Note: This figure presents the data collection timeline and cutoff points. n without parentheses represents the sample size collected during each period, while n in parentheses indicates the final sample sizes used for various analyses after excluding missing values for the relevant variables.

Through these two surveys, we measured not only interest in the Paris Olympics but also cabinet approval and evaluations of the government using a feeling thermometer. This design allows us to rigorously estimate the causal effect of winning a gold medal at the 2024 Paris Olympics on cabinet approval and evaluations of the government. At the same time, despite this pre-planned structure, the unpredictability of competition times and other external factors means that our data collection also shares characteristics with research designs that exploit unexpected events. As a result, maintaining the assumptions of ignorability and excludability required to estimate the SATE is challenging.Footnote 11
Strictly speaking, respondents interviewed shortly before each judo final might have updated their expectations in light of ongoing coverage. We cannot recover their precise expectations ex post, but the competitive record of elite Japanese judoka indicates that even heavily favoured athletes are far from certain winners. For example, in recent international tournaments, well-known competitors such as Haruka Funakubo in the women’s 57 kg category and Uta Abe in the women’s 52 kg category have occasionally been defeated despite strong pre-match expectations of victory.
These cases suggest that, for most viewers, Japan’s gold medals in the finals we study were unlikely to be treated as guaranteed outcomes before the contests began. For the second gold medal, most of the pre-treatment window in our data coincides with the bronze-medal contest, before the gold-medal bout had started, so respondents in this interval were unlikely to have received a stimulus equivalent to the actual victory. For these reasons, we treat respondents surveyed before the official start time of each final as untreated, while acknowledging that some limited anticipatory information may have been available.
3.2. Variables and measures
Our primary outcome variables are support for the Kishida cabinet and the feeling thermometer toward the Japanese government.Footnote 12 Cabinet support is a binary variable, coded as 1 for ‘support’ and 0 for ‘do not support’, with other responses treated as NA. The feeling thermometer is measured on a scale from 0 to 100, where 0 reflects the least favourable sentiment and 100 the most favourable.Footnote 13 The cutoff point was set at the moment when the outcome of each judo final was determined, that is, when the referee’s decision confirming Japan’s first (second) gold medal was announced. Respondents surveyed before this moment were assigned to the control group, while those surveyed after this decision were placed in the treatment group. Our running variable is the time difference between each respondent’s survey timestamp and the cutoff, normalized so that zero corresponds to the moment at which the gold medal was confirmed.
Due to differences in data collection methods, the first survey recorded time in minutes, while the second used seconds, reflecting improvements in precision. To address clustering issues caused by the time-based data collection, we slightly adjusted the time ID by randomly shifting it by 0.001.Footnote 14 Full details of all survey questions can be found in SI B.
3.3. Estimation strategy
We identify the SATE at the gold medal cutoff by using normalized survey time relative to the gold-medal cutoff as the running variable. Let Time i denote the time difference (in minutes) from the moment the gold medal is confirmed, normalised so that Time i = 0 at the cutoff. Our goal is to assess whether the outcome variables increase and whether a significant gap emerges exactly when Time i crosses zero. $\eqalign{{Y_i} & = {\beta _0} + {\beta _1}{\rm{Tim}}{{\rm{e}}_i} + {\beta _2}{\rm{Time}}_i^2 + {\beta _3}{D_i} \cr& + \;\sum\limits_{j = 1}^k {{\gamma _j}} {\rm{Covariat}}{{\rm{e}}_{ij}}{\rm{ }} \cr& + \;{\delta _1}({\rm{Tim}}{{\rm{e}}_i} \times {D_i}) + {\delta _2}({\rm{Time}}_i^2 \times {D_i}) + {\epsilon_i},}$
where Y i represents the outcome variable (e.g., cabinet approval), Time i is the running variable (time difference from the cutoff, with Time i = 0 at the moment the gold medal is confirmed), D i is a dummy variable indicating whether an observation is above the cutoff (D i = 1 if Time i ≥ 0, and D i = 0 otherwise), and Covariate ij represents individual-level control variables. The interaction terms δ 1(Time i × D i ) and δ 2(Time i 2 × D i ) allow the slope of the time trend to differ before and after the cutoff.
Given this specification, ${\beta _3}$
captures the covariate-adjusted discontinuity at
${\beta _3}$
captures the covariate-adjusted discontinuity at $Time_i=0$
. The sharp average treatment effect at the cutoff can be written as:
$Time_i=0$
. The sharp average treatment effect at the cutoff can be written as: ${\tau ^{{\rm{RD}}}} = \mathop {\lim }\limits_{{\rm{Time}} \downarrow 0} E[{Y_i}\mid {\rm{Tim}}{{\rm{e}}_i} = {\rm{Time}}] - \mathop {\lim }\limits_{{\rm{Time}} \uparrow 0} E[{Y_i}\mid {\rm{Tim}}{{\rm{e}}_i} = {\rm{Time}}]{\rm{ }} = {\beta _3}.$
In practice, we estimate τ RD using nonparametric kernel-based local polynomial regressions, applying bias-corrected bandwidth selection and computing robust 95% confidence intervals. As robustness checks, we vary kernel types, bandwidth selectors, polynomial orders, and the order of the local-polynomial bias correction.Footnote 15
In the RDD, the null results at the cutoff are further explored through OLS estimates, which were not explicitly included in the pre-analysis plan. To strengthen the validation of the null effect, we also perform subsample analyses and use equivalence tests to ensure the robustness of these findings. These steps collectively form the core of the analysis.
Following the main analysis, we conduct detailed robustness checks to address potential threats to two key assumptions necessary for estimating the SATE: (i) excludability, namely that survey timing affects the outcome only through the event of interest; and (ii) ignorability, namely that respondents interviewed just before and just after the cutoff are comparable in terms of potential outcomes and pre-treatment characteristics (Muñoz et al., Reference Muñoz, Falcó-Gimeno and Hernández2020). The study of unexpected events has become an essential approach for identifying exogenous shocks in political science, and Müller and Kneafsey (Reference Müller and Kneafsey2023) have begun applying UESD to measure average treatment effects in sporting events. Accordingly, we also adopt the UESD design in this study and scrutinise the robustness of the evidence regarding whether a treatment effect is present.
4. Empirical results
4.1. Results of RDD and equivalence tests
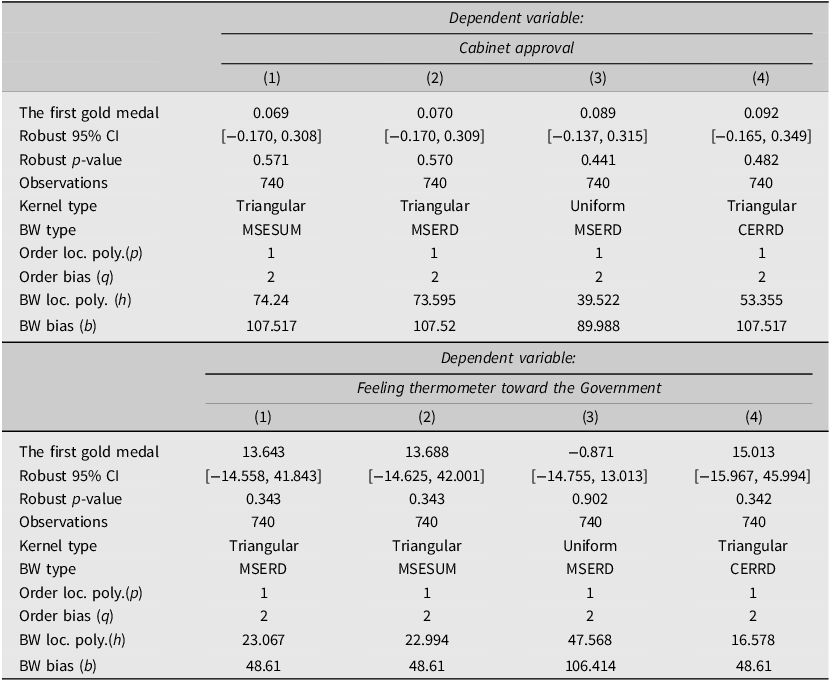
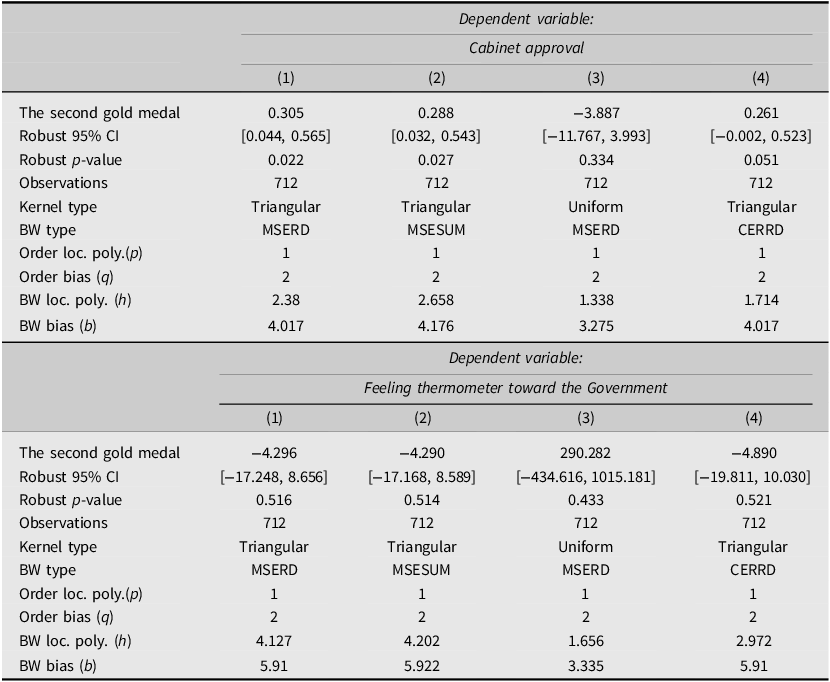
Table 1 presents the results of the RDD estimation using local polynomial regression, with the cutoff time set at the confirmation of the first gold medal. Table 2 provides the corresponding results for the second gold medal. The SATEs are reported under four specifications, with bandwidths determined by MSE- and CER-based rules. For the first gold medal, treatment effects on both cabinet approval and the feeling thermometer toward the government are not statistically significant across specifications. For the second gold medal, a small positive shift in cabinet approval emerges under certain narrow-bandwidth triangular-kernel specifications (for example, estimates around 0.26–0.31 with p-values near 0.02–0.05), but this pattern is not robust to alternative kernels or bandwidth choices and does not appear for the feeling thermometer.Footnote 16
Even the first gold medal (Women’s Judo 48 kg) does not increase cabinet approval or the feeling thermometer toward the government

Note: This table reports SATE estimates from nonparametric kernel-based local polynomial regressions fitted on either side of the threshold (Equation (1)). The outcomes are cabinet approval (upper panel) and the feeling thermometer toward the Japanese government (lower panel). All specifications include covariates (age, sex, education, income, and ruling party support). The running variable is normalized survey time, measured as the difference between each respondent’s survey timestamp and the moment at which the gold medal was confirmed. Bandwidths are selected using the bias-corrected procedure of Calonico et al. (Reference Calonico, Cattaneo and Titiunik2014), and robust 95% confidence intervals and robust p-values are reported. The different columns present robustness checks across kernel and bandwidth choices (Triangular kernel; MSESUM, MSERD, and CERRD bandwidth selectors), polynomial orders (p = 1, 2), and bias-correction orders (q = 2, 3). Reported bandwidths include the local polynomial bandwidth (h, in minutes) and the bias-correction bandwidth (b), constructed to be symmetric on both sides of the threshold following Calonico et al. (Reference Calonico, Cattaneo and Titiunik2014).
At most a negligible, specification-sensitive uptick near the cutoff: the second gold medal (Men’s Judo 66 kg)

Note: This table presents the sharp average treatment effects (SATEs) of the second gold medal (Men’s Judo 66 kg) on cabinet approval (upper panel) and the feeling thermometer toward the government (lower panel), estimated using nonparametric kernel-based local polynomials on either side of the cutoff. See also Note in Table 1.
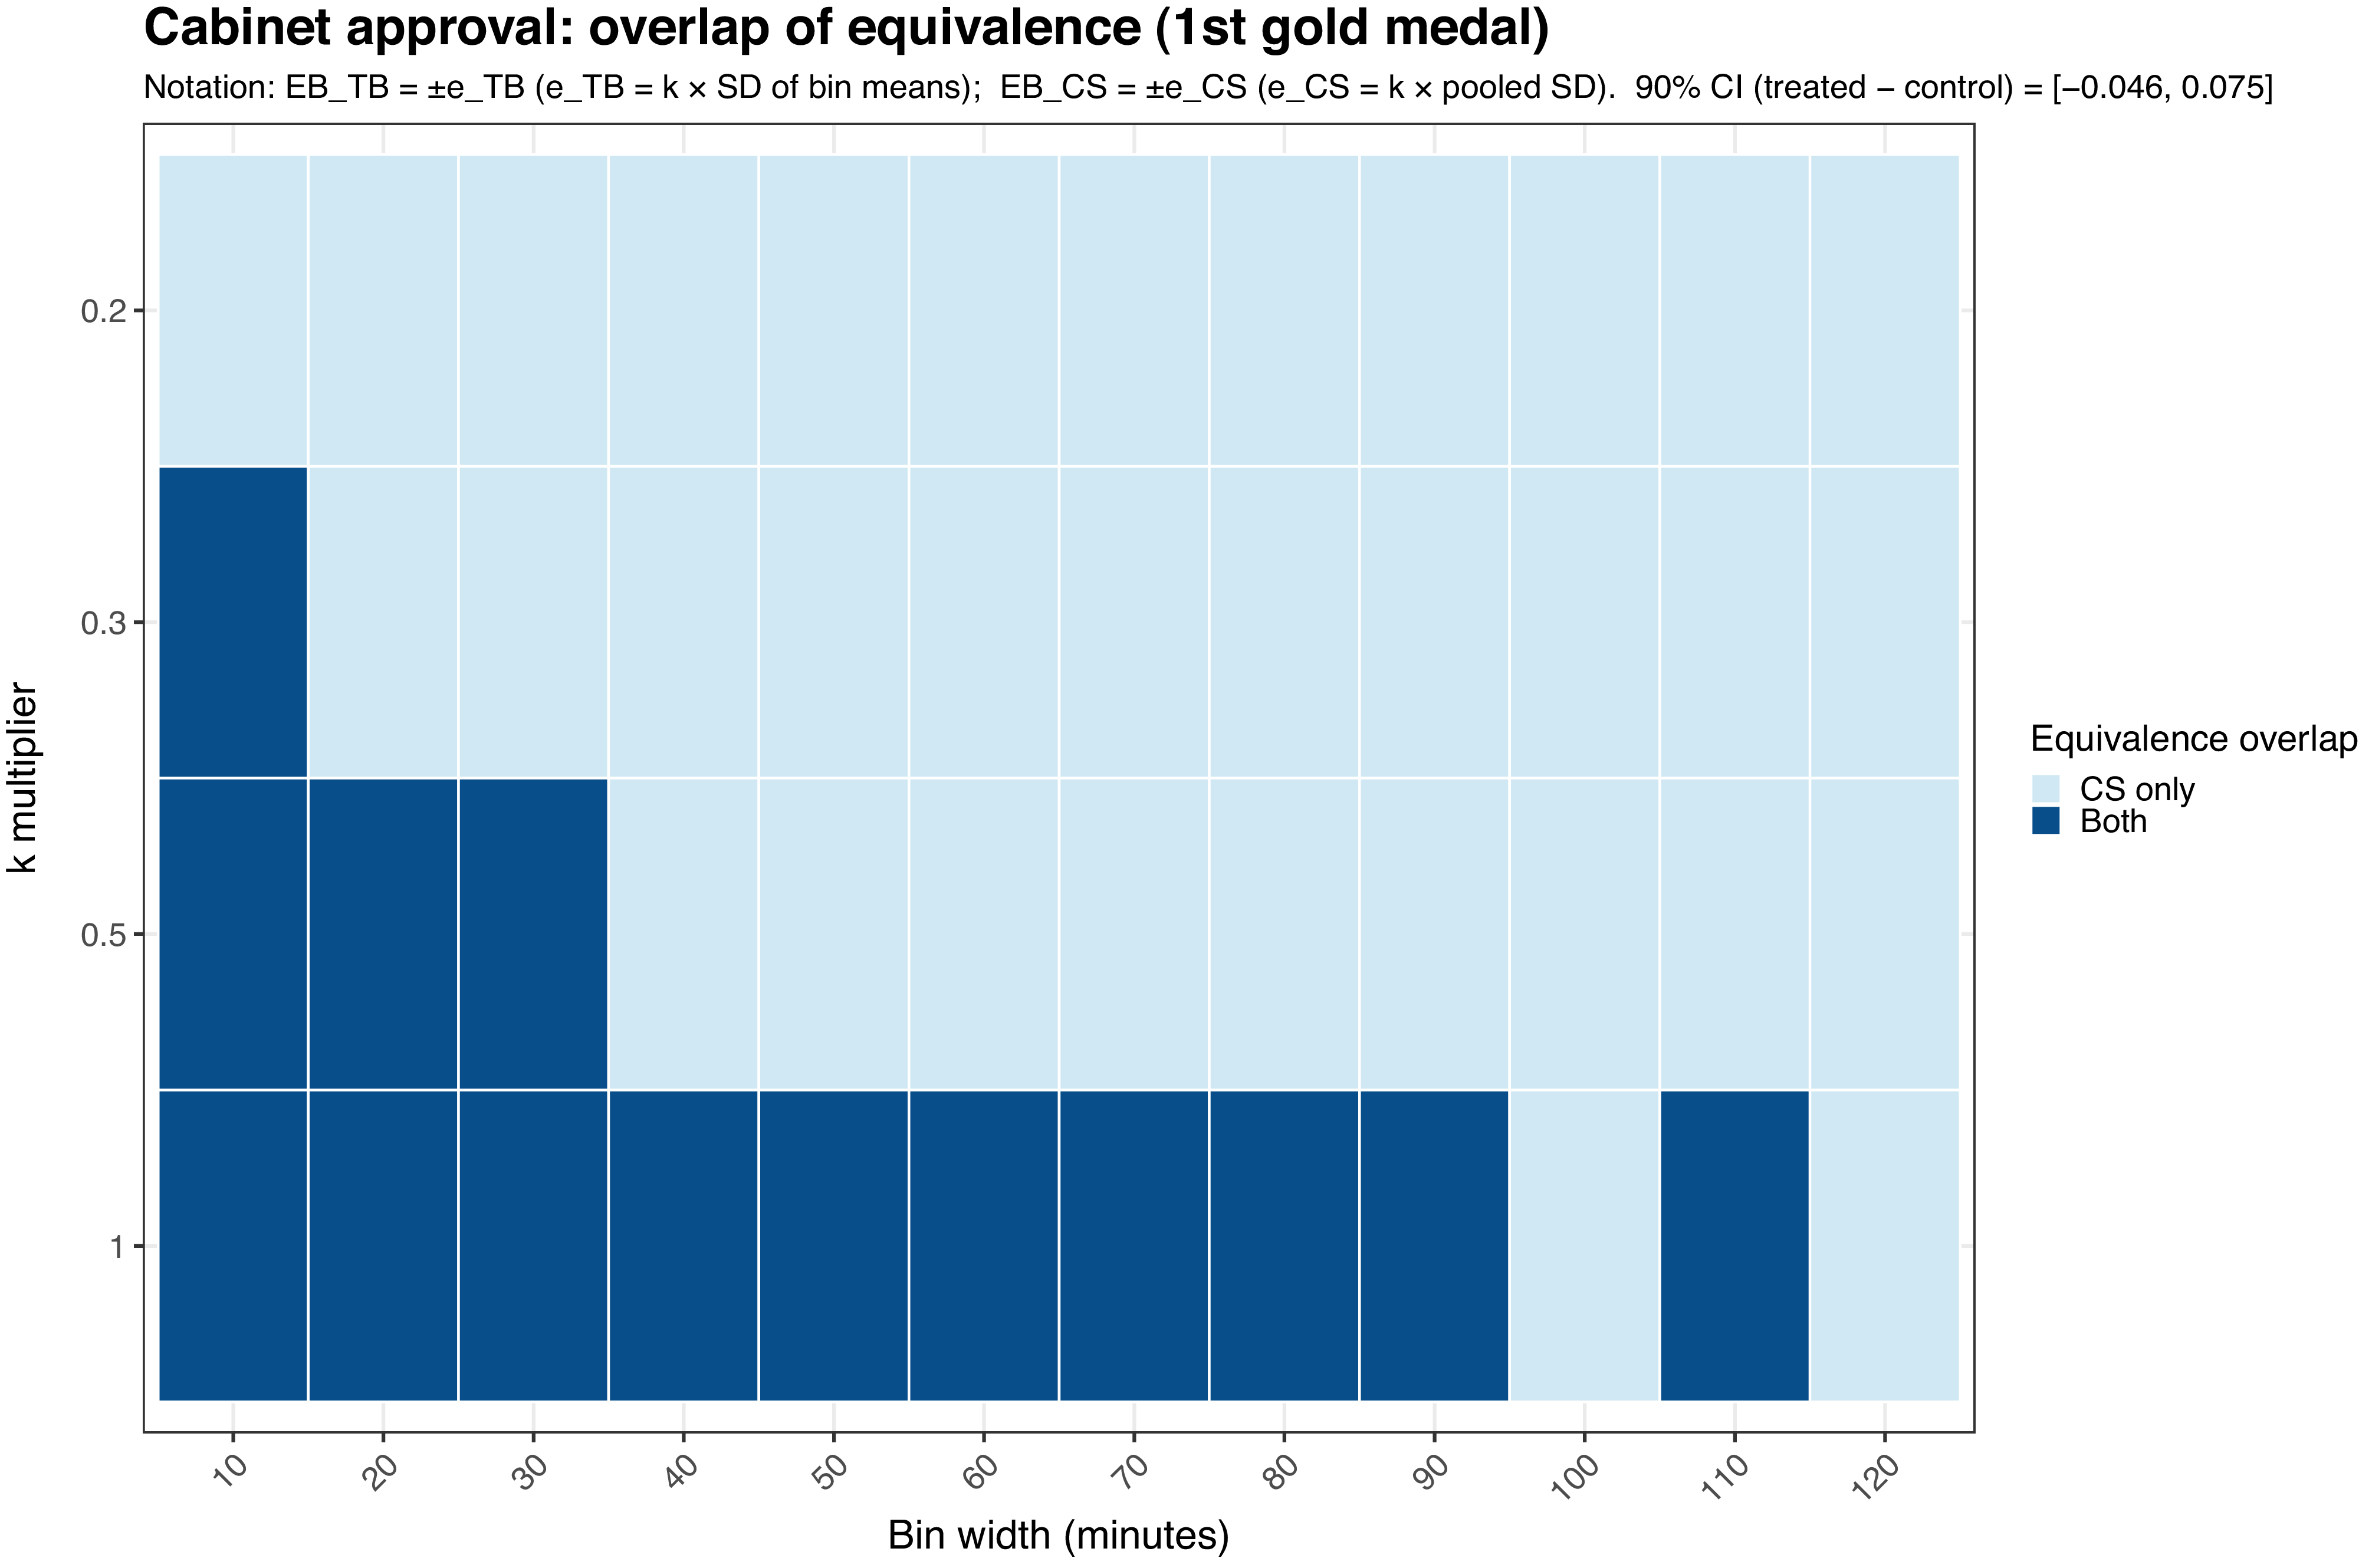
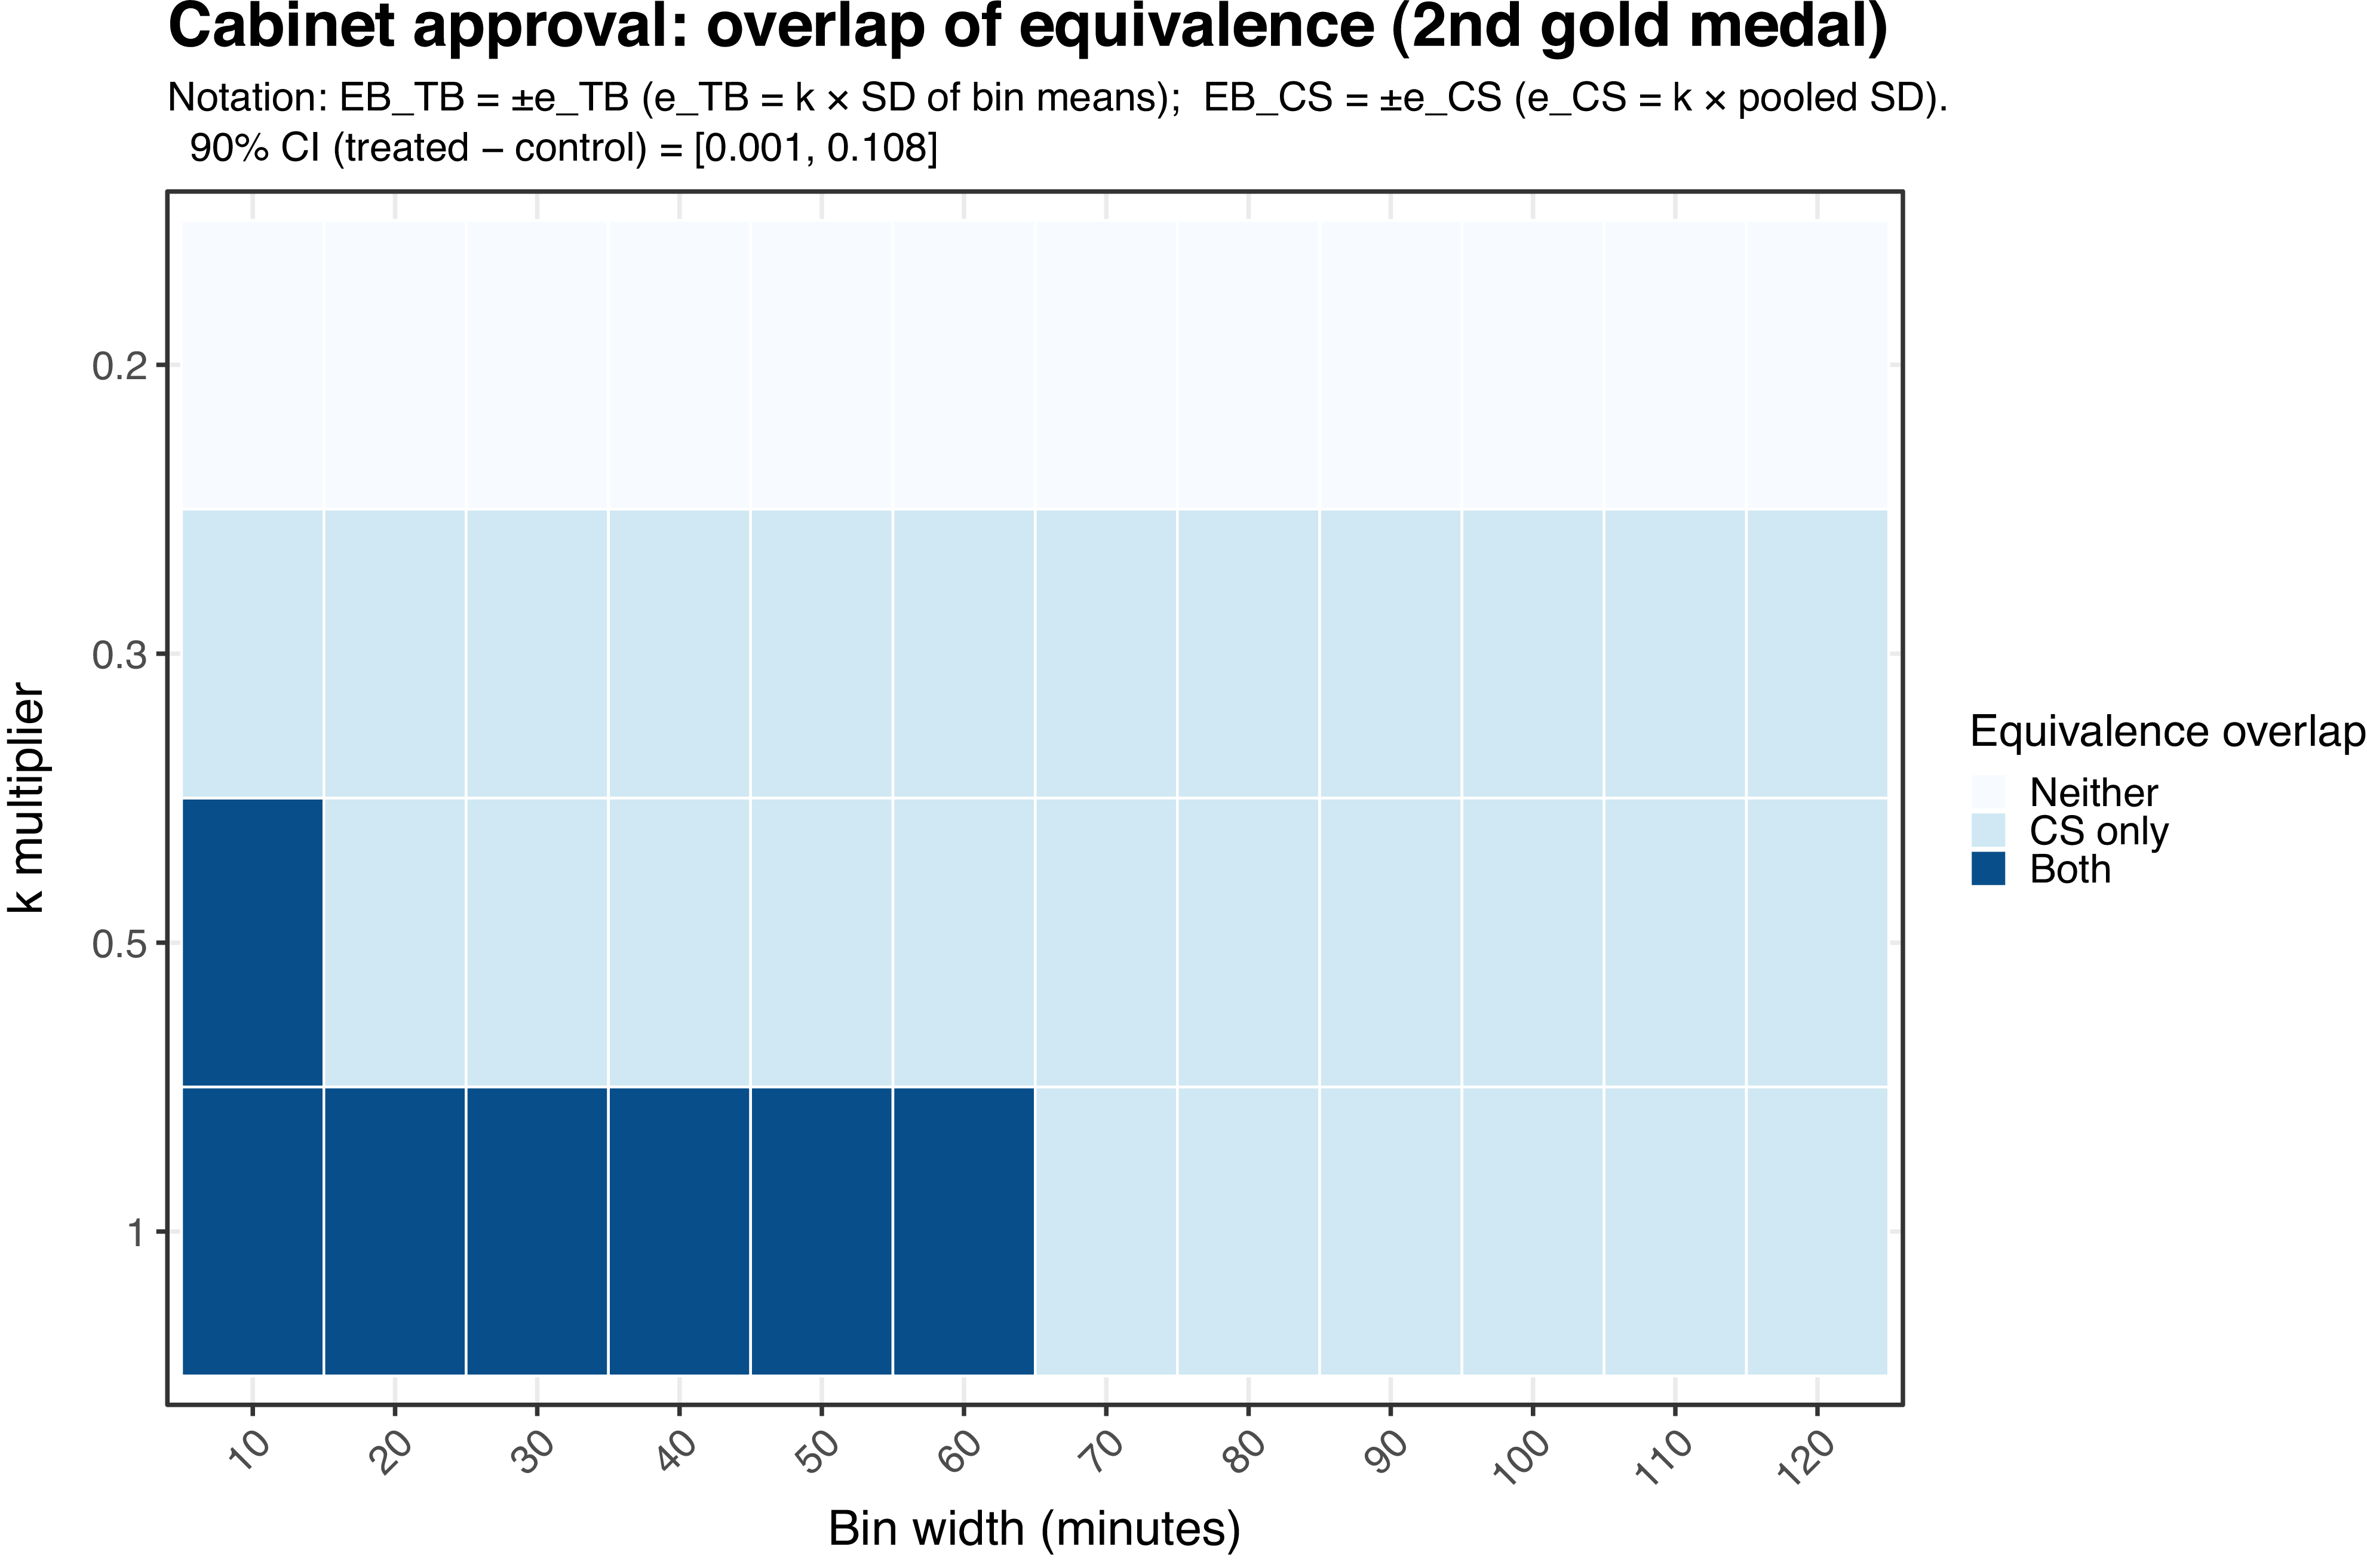
To confirm the overall null effect, we conducted Welch’s two one-sided tests (TOST) to assess equivalence between the treatment and control groups. Figure 4 presents heatmaps of the equivalence test results for cabinet approval.Footnote 17 Each panel places bin width on the horizontal axis and the equivalence-margin multiplier k on the vertical axis. Every cell reports two bounds: EB TB , based on the standard deviation of time-bin means, ϵ TB = k × SD(bin means); and EB CS , based on the pooled cross-sectional standard deviation, ϵ CS = k × SD pooled. The panel header lists the 90% confidence interval for the treatment effect, defined as treated minus control, and the shading indicates whether that interval lies within both sets of bounds, only within the cross-sectional bounds, or within neither. The numeric labels show the corresponding margins, so that 0.085 corresponds to 8.5 percentage points for cabinet approval.
Across bin widths, the first gold medal satisfies cross-sectional equivalence at ± 0.2 SD, while time-bin equivalence emerges only with larger k and narrow bins, indicating a practically negligible effect on cabinet approval.
Note: This figure displays a heatmap of equivalence-test results for cabinet approval in response to the first gold medal during the observation window. Columns indicate the width of the time bins (10, 20, 30, …, 120 minutes), and rows indicate the equivalence-margin multiplier k (0.2, 0.3, 0.5, and 1.0). For each specification, equivalence is assessed by comparing the 90% confidence interval (CI) of the treatment effect (treated minus control) with two symmetric equivalence bounds centred at zero: the time-bin bounds EBTB = [−ϵTB,+ϵ TB ] and the cross-sectional bounds EBCS = [−ϵCS,+ϵ CS ]. The time-bin margin is defined as ϵ TB = k × SD(bin means), where SD(bin means) is computed across the mean outcomes of the time bins under a given bin width. The cross-sectional margin is defined as ϵ CS = k × SD pooled, where SD pooled is the pooled standard deviation of cabinet approval across the treatment and control groups. The panel header reports the 90% CI for the treatment effect, which for this outcome is [−0.046,0.075]. Cell shading indicates whether the 90% CI lies entirely within both sets of bounds (‘Both’), only within the cross-sectional bounds (‘CS only’), or within neither. For interpretation, cabinet approval is scaled from 0 to 1, so an equivalence bound of 0.085 corresponds to an 8.5 percentage-point margin. All figures that show the full set of equivalence boundaries are available in the ReplicationCodes_JJPS2026.html file provided with the replication codes in JJPS Dataverse (https://x.gd/DOKvK).

For cabinet approval after the first gold medal (Figure 4), the 90% confidence interval [−0.046, 0.075] is tightly centred around zero. Under the cross-sectional criterion, equivalence already holds at k = 0.2, where the margin is about ± 0.085 or ± 8.5 percentage points, and this result is stable across bin widths. This supports treating any effect on cabinet approval as practically negligible at the conventional ± 0.2 SD benchmark. By contrast, the time-bin criterion is more conservative. At k = 0.2, the confidence interval always exceeds EB TB ; at k = 0.3 and k = 0.5, it is contained only when bins are relatively narrow; and even at k = 1.0, the overlap disappears for the widest bins. Hence, the time-bin analysis points to an imprecise null unless the margin is relatively large and the binning is fine.
For cabinet approval after the second gold medal (Figure 5), the 90% confidence interval [0.001, 0.108] is slightly positive but still narrow. Under the cross-sectional benchmark, the upper bound just exceeds the ± 0.084 margin at k = 0.2, but the interval is fully contained from k = 0.3 onwards, where the margin is ± 0.126. This supports an interpretation of at most a small effect under a ± 0.3 SD standard. Under the time-bin benchmark, however, equivalence is rarely achieved at k = 0.5 and appears mainly when k = 1.0 is combined with narrow bin widths. As with the first medal, the stricter time-bin criterion therefore yields an imprecise-null verdict unless the margins are relatively generous.
For the second gold medal, cross-sectional equivalence is missed at k = 0.2 but holds from k = 0.3 upward, and time-bin equivalence appears mainly at k = 1.0 with narrow bins, implying at most a small effect on cabinet approval.
Note: This figure presents the results of equivalence tests for cabinet approval in response to the second gold medal during the observation window. The panel header reports the 90% confidence interval for the treatment effect (treated minus control), which for this outcome is [0.001, 0.108]. Shading indicates whether the 90% CI falls within both equivalence bounds (‘Both’), only within the cross-sectional bound (‘CS only’), or within neither, where EBTB = [−ϵTB,+ϵ TB ] and EBCS = [−ϵCS,+ϵ CS ] are defined as in Figure 4. See also note in Figure 4.

The TOST results lead to a clear qualitative conclusion. For cabinet approval in the main text, and for the feeling-thermometer results reported in SI C, the point estimates are substantively small, and the equivalence tests provide additional evidence consistent with a null effect. At the same time, whether the data support a strict ‘precise null’ depends on how demanding the equivalence margin is. With conventional cross-sectional margins of roughly ± 0.2 to ± 0.3 standard deviations, the confidence intervals fall within the bounds, and the null of no meaningful effect is statistically supported. Under the more conservative time-bin margins, some specifications do not meet the equivalence criterion, so relative to these stricter standards the evidence is better described as an imprecise null. Overall, the overlap-of-equivalence analysis reinforces our main finding that the first and second gold medals did not meaningfully alter cabinet approval or feelings toward the government, while also showing that the strength of support for a precise null varies with the choice of equivalence margin.
4.2. Robustness checks from the UESD perspective
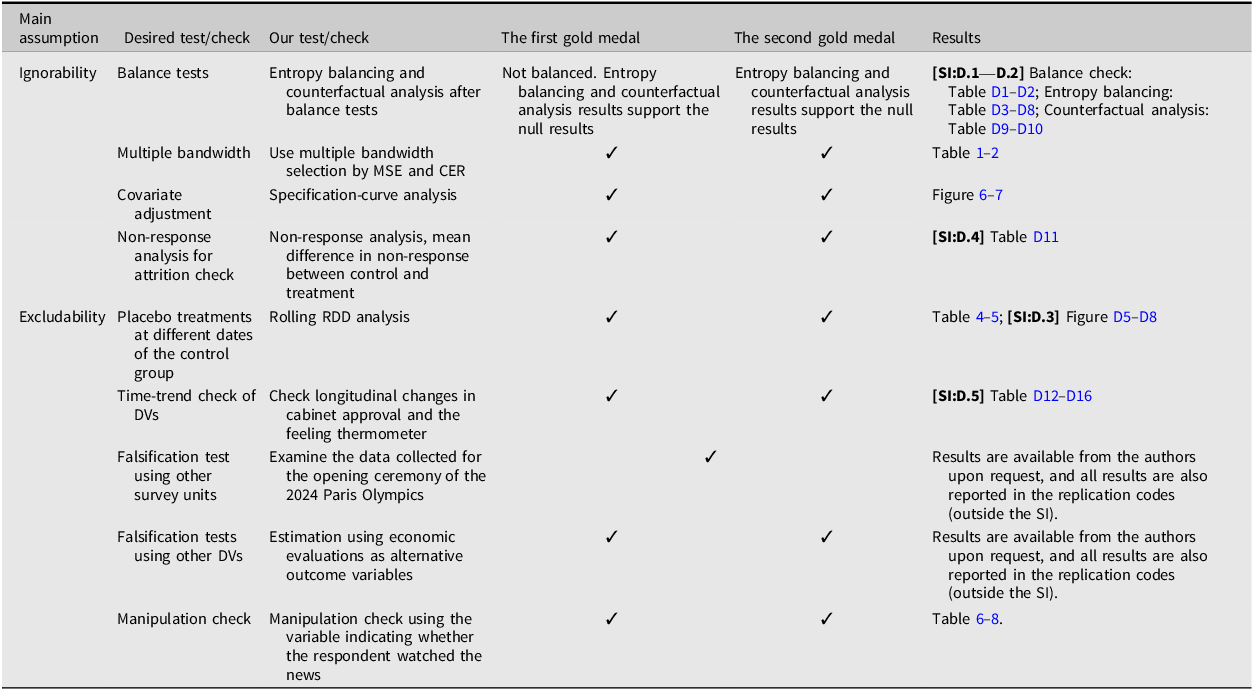
In addition to the main analysis above, we conduct several robustness checks, following the methods outlined by Muñoz et al. (Reference Muñoz, Falcó-Gimeno and Hernández2020) and applied to sporting events by Müller and Kneafsey (Reference Müller and Kneafsey2023). Table 3 lists the specific checks. In this section, we mainly present the results for the first gold medal, together with selected figures and tables. Full results can be found in SI D: ‘Robustness Checks with Unexpected Events during Survey Design Approach’.
Tests and robustness checks to assess and address violations of assumptions

Note: This table is based on Muñoz et al. (Reference Muñoz, Falcó-Gimeno and Hernández2020, Table 1).
4.2.1. Addressing the ignorability assumption
First, to evaluate how selective our samples are and whether sample composition changes around the cutoff, we combine descriptive graphics with balance tests and reweighting. Figures D1–D2 in SI D compare the RDD samples with national demographic benchmarks. The late-night online respondents are somewhat older, slightly more male, and more likely to hold a university degree than the population as a whole, but the gaps are mostly on the order of 10–15 percentage points rather than extreme divergences. Figures D3–D4 then show how sample composition evolves over the survey night: as fieldwork moves from shortly after midnight toward the early morning, the shares of women, older respondents, and lower-income categories increase, while the share of university graduates declines. Regression-based diagnostics confirm a discrete shift toward older, more female, and somewhat lower-income respondents at the first medal cutoff, whereas for the second medal the demographic trends are smooth with no clear break at the cutoff.
These patterns imply that our late-night online samples are selective and that, especially around the first medal, pre-treatment covariates are not perfectly balanced between respondents interviewed just before and just after the cutoff. The balance tests in Tables D1–D2 indeed reveal several statistically significant differences between the control and treatment groups. To address this, we apply entropy balancing to reweight the data (Tables D3–D8) and then use a causal-forest approach to estimate local average treatment effects at the cutoff (Tables D9–D10). Across these reweighted and flexibly adjusted specifications, the estimated effects remain close to zero and statistically indistinguishable from zero, so the basic null pattern is preserved. While these procedures cannot fully eliminate concerns about unobserved differences associated with being part of the late-night online population, they indicate that observable composition changes are unlikely to hide any large positive or negative impact of the judo gold medals on cabinet approval.
Second, we examined how sensitive the RDD estimates of the sporting events’ effects are to the choice of bandwidth. Following Calonico et al. (Reference Calonico, Cattaneo and Titiunik2014), we implemented several bandwidth selectors, including the Mean Squared Error (MSE) optimal bandwidth, the sum of MSEs, and the Coverage Error Rate (CER). As shown in Tables 1–2, the estimated effects remain small and generally statistically insignificant across bandwidths; although a few narrow-bandwidth specifications for cabinet approval after the second gold medal attain conventional significance levels, this pattern is not robust to alternative bandwidth choices.
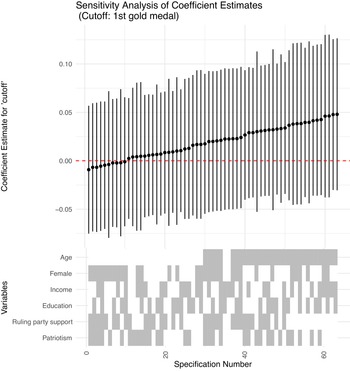
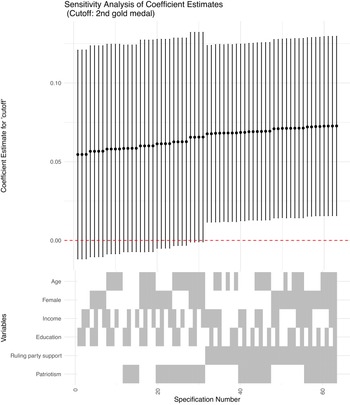
Third, as shown in Figures 6 and 7, we use specification curve analyses to assess whether the local average treatment effect at the cutoff depends on the choice of covariates. Most specifications cluster tightly around zero with confidence intervals overlapping zero. A small subset crosses conventional significance thresholds only when stacking outcome-predictive covariates, most notably when ruling-party support is included together with multiple sociodemographics (age, education, income, sex) and patriotism. These instances are not consistent across adjacent specifications and disappear when any one of the high-leverage covariates is omitted; moreover, the associated effect sizes remain trivially small. Overall, the specification curve indicates that the estimated treatment effect is, at best, negligible and highly sensitive to covariate composition, reinforcing the null pattern.
The specification curve shows the statistical insignificance of the cutoff (the first gold medal) in all covariate combinations.
Note: This figure presents a specification curve analysis for the first gold medal, visualising the sensitivity of coefficient estimates to different model specifications. The x-axis represents the specification number, corresponding to various combinations of covariates included in the model. Each specification is a unique combination of covariates from the set listed in the lower panel of the figure, including variables such as ruling party support, income, education, female, age, and patriotism. The upper panel of the figure displays the coefficient estimates for the cutoff (first gold medal) across these different specifications. Each vertical line represents the 95% confidence interval for the coefficient estimate of the cutoff for a particular specification. The solid horizontal black line indicates the coefficient estimate, while the vertical bars extend to the limits of the confidence intervals. The red dashed line at 0 on the y-axis represents the null hypothesis where the coefficient is zero, meaning there is no effect. In the lower panel, the grey and white rectangles indicate which covariates are included in each specification. A grey bar indicates that the corresponding covariate is included in that specification, while a white bar indicates it is not included. The combination of these rectangles directly corresponds to the coefficient estimates and confidence intervals shown in the upper panel.

The specification curve shows the cutoff estimate for the second gold medal is small and sensitive to covariate combinations.
Note: This figure presents a specification curve analysis for the second gold medal, visualising the sensitivity of coefficient estimates to different model specifications. See also note in Figure 6.

Fourth, we examined the potential impact of data attrition by analysing non-response rates of outcome variables and final screen debriefing. Given the timing of the study, which coincided with an Olympic gold medal event, we anticipated significant differences in non-response rates before and after the event. However, comparisons of mean non-response rates in the pre- and post-event periods showed no statistically significant differences (Table D11). Consequently, data attrition likely did not contribute to any bias that would affect our null findings.
4.2.2. Addressing the excludability assumption
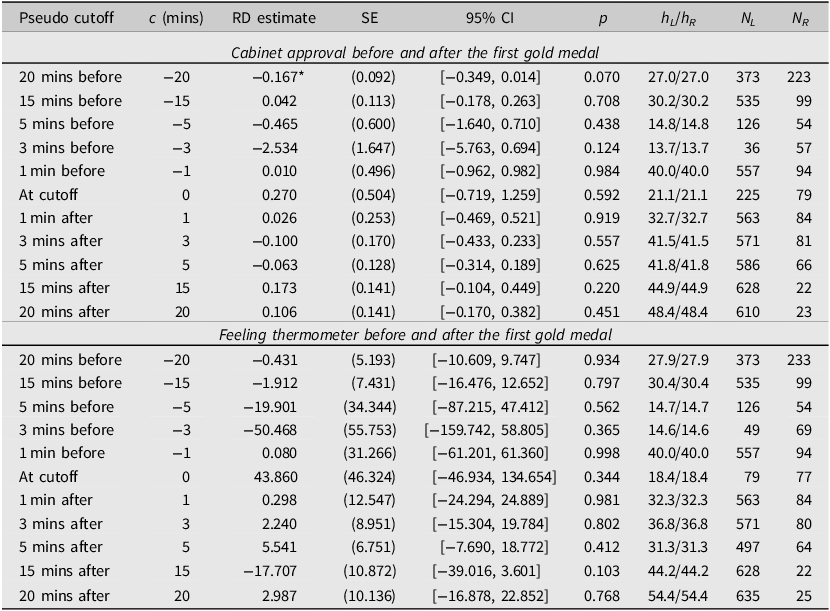
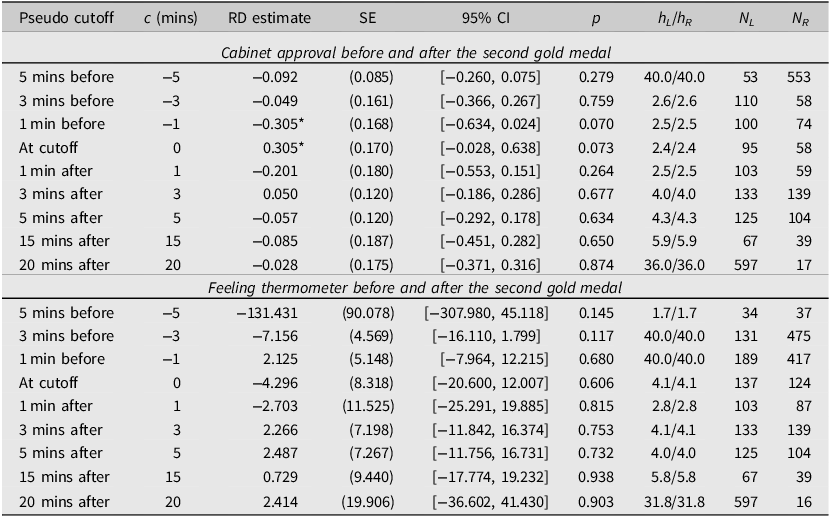
To address the excludability assumption, we conduct a placebo analysis that shifts the cutoff to multiple pseudo thresholds before and after each event and re-estimates the RDD at each of these cutoffs. Tables 4 and 5 report the resulting rolling RDD estimates for the first and second gold medals, respectively. For each pseudo-cutoff, we estimate the local discontinuity using nonparametric kernel-based local polynomials on either side of the threshold and summarise the bias-corrected point estimate with robust inference (the visualisations of the empirical results are provided in SI D.3: Figures D5–D8). Across the full set of pseudo cutoffs, the estimated effects remain statistically indistinguishable from zero, mirroring the null results obtained at the true treatment thresholds. Additionally, following Muñoz et al. (Reference Muñoz, Falcó-Gimeno and Hernández2020) recommendation, we tested for changes in outcome trends by restricting the sample to the control group and setting the cutoff at the median (Tables D12–D15). The placebo treatment in this setting also showed no significant results, reinforcing the null effect. The Dickey-Fuller test and fractional integration analysis further confirmed that the pre- and post-event data were stationary and trend-free (Table D16), providing additional support for the null results.
Rolling RDD estimates around the first gold medal: shifting the cutoff before and after the threshold does not alter the null results for cabinet approval and feeling thermometer

Note: This table reports rolling (pseudo-cutoff) RDD estimates for the first gold medal. For each pseudo cutoff, we estimate the effect using nonparametric kernel-based local polynomials on either side of the threshold, where the true cutoff is set at the confirmation of the first gold medal. The pseudo cutoffs are constructed by shifting the threshold by the number of minutes reported in the second column (negative values indicate earlier cutoffs and positive values later cutoffs). The outcome variables are cabinet approval and a feeling thermometer toward the Japanese government. The running variable is the time difference from the cutoff (in minutes), constructed from the survey timestamp. Each row reports the bias-corrected point estimate and robust inference, including the robust standard error, 95% confidence interval, and the data-driven bandwidth on each side of the cutoff.
Rolling RDD estimates around the second gold medal: shifting the cutoff before and after the threshold does not alter the null results for cabinet approval and feeling thermometer

Note: This table reports rolling (pseudo-cutoff) RDD estimates for the second gold medal. See also Note in Table 4.
We also replicated our main analyses using data from the Olympic opening ceremony, treating it as a placebo event. This exercise likewise yielded null results, which further supports the conclusion that none of these events had a measurable impact on government support.Footnote 18
We further conducted falsification tests to evaluate whether the cutoff affected unrelated outcome variables, such as sociotropic and egotropic economic evaluations.Footnote 19 The results consistently showed no significant effects on these variables, which again strengthens the conclusion that the cutoff had no substantive impact on outcomes.
The UESD framework also emphasises the importance of manipulation checks. In purely observational UESD settings, it is often difficult to verify whether respondents are actually aware of an event or exposed to specific information. In our case, however, the study was explicitly designed to ‘anticipate’ the judo finals and to measure very short-term effects, which allowed us to embed direct questions about information exposure in the survey. In particular, we asked respondents whether they knew the outcomes of the first and second judo gold medals.
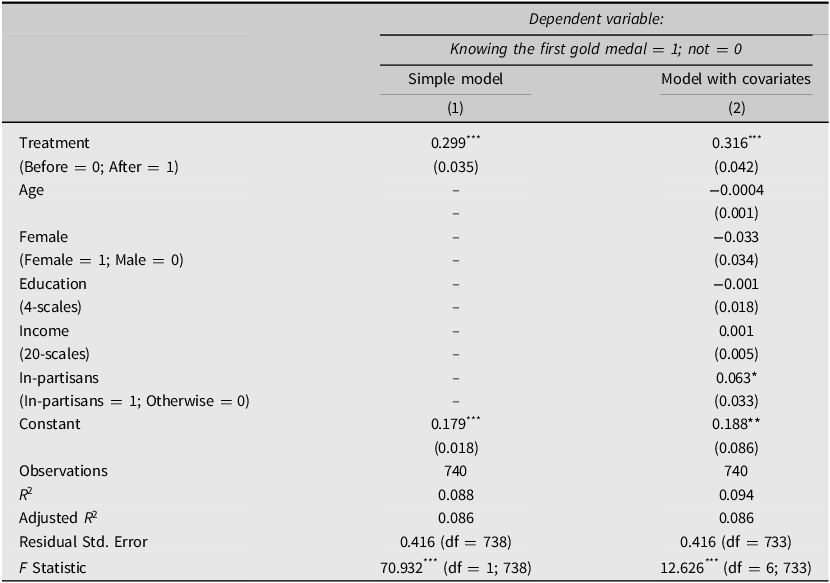
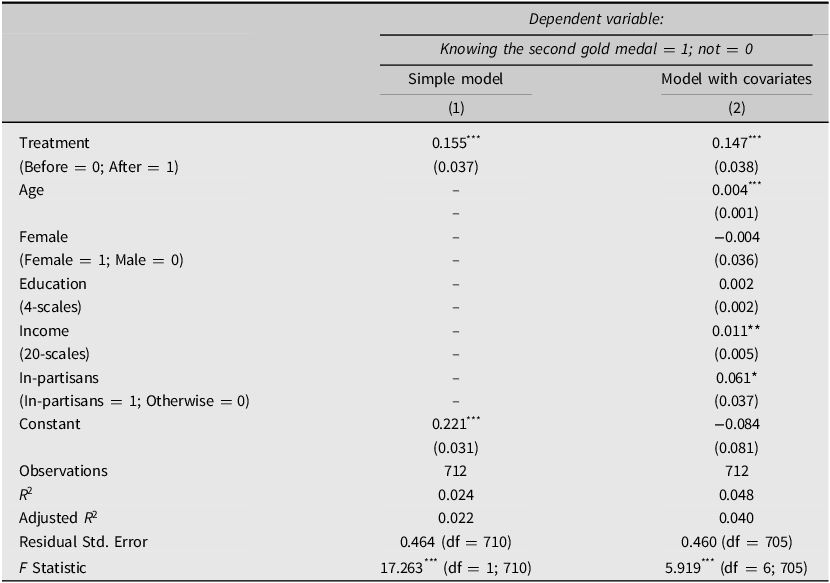
Table 6 reports t-tests that compare knowledge of each gold-medal result between the treatment group (respondents surveyed after the medal was confirmed) and the control group (respondents surveyed before). For both medals, the differences are large and highly significant, indicating that respondents interviewed after the cutoff are much more likely to report knowing the result. Tables 7 and 8 then present linear probability models in which the dependent variable is an indicator for knowing the result of the first (second) gold medal (=1 if aware, 0 otherwise), and the key explanatory variable is the treatment indicator (Before = 0, After = 1), estimated with and without demographic covariates. In all specifications, the treatment coefficient is positive and statistically significant at the 1% level, implying that being interviewed after the medal increases the probability of knowing the outcome by roughly 15–30 percentage points.
The t-test results show a statistically significant difference in information exposure between the treatment and control groups

Note: This table presents the results of the manipulation check, which uses t-tests to verify whether awareness of each gold medal won differs significantly based on the treatment. p-values with Bonferroni correction are also reported. The t-statistics are computed as the mean in the control group minus the mean in the treatment group.
The treatment has a statistically significant effect on awareness of the first gold medal result

Note: This table presents a linear probability model estimating the average treatment effect of the treatment, with the outcome variable being whether the participant is aware of the first gold medal news. This estimation also serves as a manipulation check. The covariate age is self-reported, female is a binary variable coded 1 for female and 0 for male, education is measured on a 4-point scale where 1 represents a middle school graduate and 4 represents a college graduate, and income is categorised into 20 levels. *p < 0.1; **p < 0.05; ***p < 0.01. Values in parentheses represent robust standard errors.
The treatment has a statistically significant effect on awareness of the second gold medal result

Note: This table presents a linear probability model estimating the average treatment effect, with the outcome variable being whether the participant is aware of the second gold medal news. See also Note in Table 7.
The models with covariates also help characterise which respondents actually followed the judo finals. For the first gold medal, awareness of the result is strongly associated with treatment status and, to a lesser extent, with being an in-partisan, whereas age, gender, education, and income do not exhibit systematic relationships with knowledge of the outcome. For the second gold medal, older, higher-income, and in-partisan respondents are more likely to report knowing the result, while gender and education again play little role. These manipulation checks therefore both confirm that our treatment captures a meaningful change in information exposure and provide a clearer picture of which respondents were in fact following the Olympic judo events.
5. Discussion and conclusion
Politically irrelevant events such as sporting contests appear to exert, at most, a minimal influence on political support and public sentiment toward the government, at least when ‘political relevance’ is understood in the narrow sense of retrospective evaluations of cabinet performance.Footnote 20 Even in the Olympics, which typically encourages a sense of national unity, and even in a sport widely regarded as a national symbol, we find no consistent short-term increase in cabinet approval or warmer feelings toward the government. While a small, specification-sensitive uptick appears around the second gold medal in some narrow-bandwidth estimations, it is not robust across kernels, bandwidths, or outcomes, and the effect sizes are trivial. Likewise, two one-sided tests of equivalence leave a few specifications undecided rather than affirming strict equivalence, but these cases do not overturn the overall pattern of negligible impacts. The evidence supports the conclusion that any immediate effect is absent or, at most, consistent with a null effect. In light of the missing short-term response, medium- to long-term gains in support generated by such events are also unlikely.
In interpreting these null results, it is important to consider the institutional and political context in which elite judo operates in Japan. Elite judo athletes are selected and trained primarily by semi-autonomous sports organisations such as the All Japan Judo Federation and the Japanese Olympic Committee, with high-performance support from bodies such as the Japan Sport Council and the Japan Sports Agency.Footnote 21 These organisations receive public funding and operate under ministerial oversight, but day-to-day decisions regarding athlete selection, coaching, and in-competition tactics are not made by the cabinet or the prime minister. In this sense, there is only limited scope for deliberate government action or inaction in the management of judo athletes, and it is reasonable to treat the outcomes of these contests, from the perspective of most voters, as politically irrelevant events in the specific sense that their results lie largely outside the government’s direct control.
Relatedly, we find little evidence that the government or prime minister engaged in explicit credit-claiming around the specific judo finals we study. As is customary in Japan, political leaders issued congratulatory messages (e.g., the Asahi Shimbun’s ‘Prime Minister’s Schedule [Shusho Dosei]’ column of July 29, 2024) and, after the Games, hosted medalists at the Prime Minister’s Office [Hyoukei Houmon] (e.g., the ‘Prime Minister’s Schedule’ column of August 14, 2024), but we do not observe systematic, real-time efforts to present judo victories as direct achievements of government policy.Footnote 22 In the terminology of Busby and Druckman (Reference Busby and Druckman2018), the judo gold medals therefore appear to have operated for most citizens as events that were politically irrelevant but emotionally salient: they generated pride and joy, yet provided few reasons to update beliefs about the cabinet’s policy performance.
At a minimum, this suggests that even an otherwise powerful sporting event such as the Olympic Games, which might seem ripe for political exploitation, has only a small impact on government support when it is not credibly connected to government performance. It also implies that Japanese voters, at least in this setting, tended to keep politically irrelevant successes and their evaluations of the government separate, even when the success in question was the country’s first and second gold medals of the Games.
More broadly, our findings are consistent with, and add nuance to, a growing literature showing that the macro-level effects of international sporting events on national pride are, taken on their own, often modest and short-lived (e.g., Liu and Hong, Reference Liu and Hong2010; Elling et al., Reference Elling, Van Hilvoorde and Remko2014; Gassmann et al., Reference Gassmann, Haut and Emrich2020; Shimokubo, Reference Shimokubo2023). Existing work has indeed shown that post-event framing by political leaders and the media, as well as how citizens perceive the magnitude and meaning of success, can condition whether sporting victories translate into political benefits (e.g., Allison and Monnington, Reference Allison and Monnington2002; Cheng et al., Reference Cheng, Rosner, Chao, Peng, Chen, Li, Kwong, Hong and Chiu2011; Cottrell and Nelson, Reference Cottrell and Nelson2011; Mundim and da Silva, Reference Mundim, da and Almeida2019). Research on ‘everyday nationalism’ further emphasises that sporting events can serve as key arenas in which national identity is continually performed through routine, taken-for-granted practices (Fox and Miller-Idriss, Reference Fox and Miller-Idriss2008), while at the same time providing highly visible stages for protest and contention over pressing political issues (e.g., Cottrell and Nelson, Reference Cottrell and Nelson2011). Likewise, international tournaments such as the Olympic Games and the World Cup have long been used as instruments of public diplomacy and soft power, shaping states’ international status, prestige, and patterns of diplomatic engagement (e.g., Etzioni, Reference Etzioni1962; Allison and Monnington, Reference Allison and Monnington2002; Finlay and Xin, Reference Finlay and Xin2010; Freeman, Reference Freeman2012; Rhamey and Early, Reference Rhamey and Early2013; Bezerra et al., Reference Bezerra, Cramer, Hauser, Miller and Volgy2015). These strands of scholarship convincingly document that sport can be deeply political. Within this research tradition, our study focuses on what is arguably a paradigmatic case of politically charged sporting success: two clear gold medals in a sport widely regarded as a national symbol, yet occurring in a context where elite credit-claiming and explicit politicisation were limited. That our analysis in this most-likely scenario uncovers effects that are essentially null is therefore an aspect we wish to underscore.
In this setting, we observe little evidence of a ‘rally around the flag’ or of large movements in cabinet approval. The analysis therefore underscores that, regardless of whether there is a clear narrative linking athletic success to government performance, national pride by itself appears insufficient to generate a strong political response. Where government involvement in athlete management is indirect and credit-claiming is muted, even Olympic victories that spark widespread popular enthusiasm produce at most very small changes in evaluations of the cabinet. Put differently, when the outcome of a sporting event is not credibly connected to government action or competence, the event may still matter for national pride, soft power, or protest politics, but its immediate impact on retrospective judgements of government performance is likely to be limited.
Inevitably, our research design also has important limitations related to sample composition. Because our survey was conducted online during the late night and early morning, our respondents constitute a highly selective subset of the Japanese electorate: individuals who happen to be awake at those hours and are willing to participate in an online survey. Our descriptive analyses and discontinuity tests do not reveal any sharp changes in sample composition at the cutoff for the second medal, and our main RDD specifications condition on gender, age, education, and income, which reduces the influence of observable composition changes on the estimates. Nevertheless, we cannot completely rule out the possibility that unobserved characteristics associated with belonging to this late-night online population may attenuate or amplify attribution error. Future research that replicates similar designs at different times of day or under alternative sampling frames would be valuable for assessing the extent to which our findings generalise beyond this particular subset of respondents.
In addition, our conclusions pertain only to the lack of a positive shift in public sentiment following non-political events in this particular setting. Negative politically irrelevant events may still lead to attribution error, and our evidence primarily shows that the boost in support through misattribution is weak. Further investigation is needed into how cognitive error drives disapproval in response to negative events. Moreover, research on the effects of sports has been largely confined to advanced democracies, such as the United States, Ireland, Finland, and Japan. Extending this research to developing countries or non-democratic regimes may yield different outcomes. While data collection in authoritarian regimes poses challenges, replicating these studies in diverse contexts could significantly advance our understanding of misattribution effects and the political uses of sport.
Supplementary material
The supplementary material for this article can be found at https://doi.org/10.1017/S1468109926100280.
Acknowledgements
This paper has benefited from presentations at the Graduate School of Law and Politics, Kyoto University. This work was supported by grants-in-aid for scientific research, 23H05426 and 22K01320, from the Japan Society for the Promotion of Science. This study was reviewed and approved by the Institutional Review Board (IRB) of Osaka University of Economics in July 2024. The data that support the findings of this study are available from the corresponding author upon reasonable request. The authors declare that there are no known competing financial interests or personal relationships that could have appeared to influence the work reported in this document.
Author contributions
Conceptualisation: Hanako Ohmura, Masahiro Zenkyo, and Masaki Hata
Methodology: Hanako Ohmura and Masahiro Zenkyo
Formal analysis: Hanako Ohmura, Masahiro Zenkyo, and Masaki Hata
Investigation: Masahiro Zenkyo and Masaki Hata
Data curation: Hanako Ohmura, Masahiro Zenkyo, and Masaki Hata
Writing – Original draft: Hanako Ohmura, Masahiro Zenkyo, Masaki Hata, and Tetsuya Matsubayashi
Writing – Review and Editing: Masahiro Zenkyo, Masaki Hata, and Tetsuya Matsubayashi
Hanako Ohmura (Corresponding author E-mail: ohmura.hanako.8v@kyoto-u.ac.jp) earned her Ph.D. in Law from Kyoto University in 2011. She then served as an assistant professor in the Graduate School of Law at Kyoto University until 2013. From 2013 to 2019, she was an associate professor in the School of Policy Studies at Kwansei Gakuin University, where she was promoted to full professor in 2019 and continued through 2023. In 2024, she returned to Kyoto University as a professor in the Graduate School of Law and Politics.
Masahiro Zenkyo (E-mail: masahirozenkyo@kwansei.ac.jp) Masahiro Zenkyo received his Ph.D. in Policy Science from the Graduate School of Policy Science at Ritsumeikan University in March 2011. In April 2014, he joined the School of Law and Politics at Kwansei Gakuin University as an assistant professor, a post he held until March 2016. He was then promoted to associate professor in that same department from April 2016 through March 2021. Since April 2021, he has served as a professor in the School of Law and Politics at Kwansei Gakuin University.
Masaki Hata (E-mail: m.hata@osaka-ue.ac.jp) received his Ph.D. in Political Science from the Graduate School of Law at Kobe University in March 2016. Upon completion of his doctorate, he was appointed lecturer in the Department of Policy Science, Faculty of Law, University of Kitakyushu, where he served from October 2016 until March 2019. In April 2019, he joined the Faculty of Public Policy at Kyoto Prefectural University as a lecturer and was promoted to an associate professor in April 2020, remaining in that role through March 2024. Since April 2024, he has been an associate professor in the Faculty of Social Informatics at Osaka University of Economics.
Tetsuya Matsubayashi (E-mail: matsubayashi@osipp.osaka-u.ac.jp) received his Ph.D. in Political Science from Texas A&M University in 2007. That same year, he joined the University of North Texas as an assistant professor of political science, where he served until earning tenure in May 2013. In 2013, he moved to Osaka University’s School of International Public Policy as an associate professor, a position he held through 2020. Since 2020, he has been a professor in the Osaka School of International Public Policy at Osaka University.




 Open access

