

1. Introduction
Fractures impact the mechanics and fluid flow of the upper crust (National Research Council, 1996) and are essential deformation mechanisms in basement-cored, fault-related folds (Stearns, Reference Stearns1978; Cosgrove & Ameen, Reference Cosgrove and Ameen2000; Sanz et al. Reference Sanz, Pollard, Allwardt and Borja2008; Mynatt, Seyum & Pollard, Reference Mynatt, Seyum and Pollard2009; Amrouch et al. Reference Amrouch, Lacombe, Bellahsen, Daniel and Callot2010 a, b, Reference Amrouch, Beaudoin, Lacombe, Bellahsen and Daniel2011; Anders, Laubach & Scholz, Reference Anders, Laubach and Scholz2014; Tavani et al. Reference Tavani, Storti, Lacombe, Corradetti, Muñoz and Mazzoli2015). Fractures influence fold hydrology (Beaudoin et al. Reference Beaudoin, Bellahsen, Lacombe and Emmanuel2011, Reference Beaudoin, Leprêtre, Bellahsen, Lacombe, Amrouch, Callot, Emmanuel and Daniel2012, Reference Beaudoin, Lacombe, Bellahsen and Emmanuel2013; Barbier et al. Reference Barbier, Leprêtre, Callot, Gasparini, Daniel, Hamon, Lacombe and Floquet2012), pore-pressure history (Beaudoin et al. Reference Beaudoin, Bellahsen, Lacombe, Emmanuel and Pironon2014 a, b) and provide evidence of how folds and faults have evolved (Narr & Suppe, Reference Narr and Suppe1994; Hennings, Olson & Thompson, Reference Hennings, Olson and Thompson2000; Bellahsen, Fiore & Pollard, Reference Bellahsen, Fiore and Pollard2006). In low-porosity oil and gas reservoirs, contrasts in fracture attributes correspond to differences in production response (Laubach, Reference Laubach2003; Cumella & Scheevel, Reference Cumella, Scheevel, Cumella, Shanley and Camp2008; Solano, Zambrano & Aguilera, Reference Solano, Zambrano and Aguilera2011). It is therefore unsurprising that numerous studies have described or modelled patterns, kinematic evolution and mechanical causes of fractures in fault-related folds (e.g. Stearns & Friedman, Reference Stearns and Friedman1972; Hancock, Reference Hancock1985; Cosgrove & Ameen, Reference Cosgrove and Ameen2000; Wilkins, Reference Wilkins, Jolley, Barr, Walsh and Knipe2007; Sassi et al. Reference Sassi, Guiton, Leroy, Daniel and Callot2012). Nevertheless, marked uncertainty remains concerning what processes control open pore space in fractures and how long open fractures can persist under burial conditions in basins and fold–thrust belts.
Validating fracture models based on outcrop studies or mechanics is impeded by the inherently limited sampling of steeply dipping subsurface fractures afforded by vertical wellbores (Narr, Reference Narr1991). Cores cut in gently dipping sedimentary rock at a high angle to steeply dipping fractures (‘horizontal cores’) are special probes that allow fracture abundance, aperture size populations, spatial patterns and mineral deposits and porosity to be systematically measured. Although rare (and limited in important respects), horizontal cores provide unambiguous and relatively complete samples of subsurface fracture populations; consequently, they have had a profound impact on current thinking about subsurface fracture attributes.
In this paper we revisit a key horizontal well core suite from the eastern Greater Green River Basin, the Rock Island 4-H and Sidewinder 1-H horizontal cores that sample the faulted, basement-cored Table Rock anticline in Upper Cretaceous Frontier Formation sandstones (DeJarnett et al. Reference DeJarnett, Lim and Calogero2001) (Figs 1, 2). Fracture studies based on these cores (Lorenz, Billingsley & Evans, Reference Lorenz, Billingsley and Evans1998; Lorenz & Mroz, Reference Lorenz and Mroz1999; DeJarnett et al. Reference DeJarnett, Lim and Calogero2001; DeJarnett, Lim & Calogero, Reference DeJarnett, Lim and Calogero2001; Lorenz, Krystinik & Mroz, Reference Lorenz, Krystinik, Mroz, Goolsby and Robinson2005) influenced views on the character of subsurface fractures in the Laramide basement-involved province, Wyoming and their effects on fluid flow (e.g. Billingsley, Reference Billingsley2001; Lorenz, Reference Lorenz, Peterson, Olson and Anderson2003; Camp, Reference Camp, Cumella, Shanley and Camp2008; Coleman, Reference Coleman, Cumella, Shanley and Camp2008). Although we are reanalysing all aspects of fracture and rock mechanical properties in these and related Frontier Formation cores and nearby outcrops, here we focus on previously undescribed quartz deposits and porosity patterns in two fracture sets that shed light on why and how long fracture porosity can persist despite protracted burial and uplift in foreland basins, and the extent that such fractures remain open despite being subjected to loads that tend to close them. Recent progress on understanding how quartz cement deposits accumulate in fractures (Ankit, Urai & Nestler, Reference Ankit, Urai and Nestler2015; Lander & Laubach, Reference Lander and Laubach2015) provides useful insights. Evidence for long-term persistence of open fractures has implications for the role of weak pre-existing fractures on fold mechanics and fluid flow, including fluid production response.
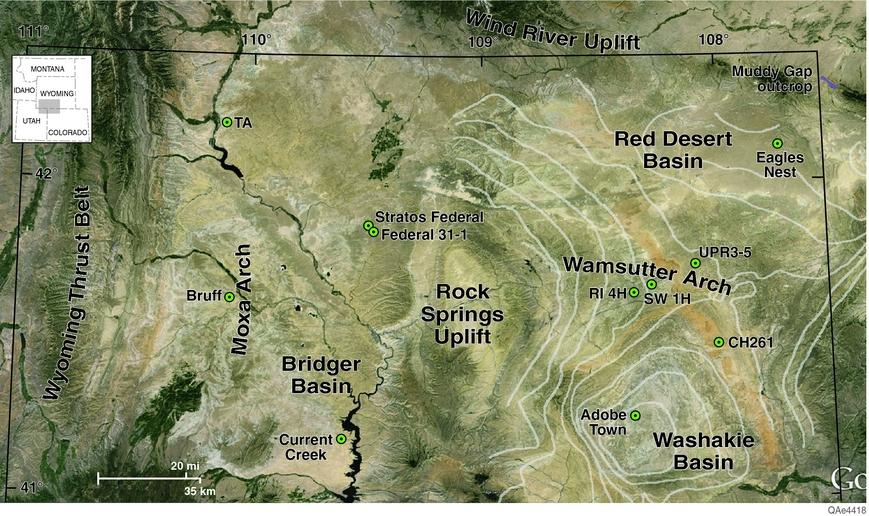
Greater Green River Basin showing sub-basins and well locations. Rock Island 4-H well (RI 4H) and Sidewinder 1-H (SW 1H), Table Rock oil and gas field, township and range coordinates T. 18 and 19N, R. 98W, Sweetwater County, Wyoming (DeJarnett et al. Reference DeJarnett, Lim and Calogero2001). Wells used for burial and thermal history: Eagles Nest, Adobe Town, Bruff, Current Creek from Roberts, Lewan & Finn (Reference Roberts, Lewan and Finn2004); Champlin 261 A-13 (CH261), UPRR 3–5 (UPR3-5) from Tobin et al. (Reference Tobin, McClain, Lieber, Ozkan, Banfield, Marchand and McRae2010). Terra Anderson Canyon (TA), Federal 31-1, from Dutton (Reference Dutton1993); Dutton, Hamlin & Laubach (Reference Dutton, Hamlin and Laubach1995). Selected formlines (no units), eastern Green River Basin, based on Almond Formation structure map. Background image: GoogleEarth.
Geologic setting. (a) Structure, top of Frontier Formation, north Table Rock field, showing well surface locations and trajectories (heavy line), Rock Island 4-H well (RI 4H) and Sidewinder 1-H (SW 1H), faults and contours (feet subsea). Inset map shows field location (TR) in Wyoming. Modified from DeJarnett et al. (Reference DeJarnett, Lim and Calogero2001). Inset fracture strike rose diagrams, primarily showing Set 1, from RI 4H (n = 76) and SW 1H (n = 33), after Lorenz, Krystinik & Mroz (Reference Lorenz, Krystinik, Mroz, Goolsby and Robinson2005), principle fracture sets 1 and 2, grey lines and S Hmax (thick black line, inwards facing arrows) after DeJarnett et al. (Reference DeJarnett, Lim and Calogero2001). (b) Diagram showing well trajectory, Rock Island 4-H well (solid line) through fluvial First Bench and upper and lower facies of marine Second Bench, Frontier Formation and cored intervals. Well azimuth 035 degrees. Modified from DeJarnett et al. (Reference DeJarnett, Lim and Calogero2001). Note that sample depths are in measured depth (MD) along the wellbore over the range 4700–4800 m and corresponding to subsea depths of 4538–4547 m.
2. Geological setting
2.a. Greater Green River Basin and Table Rock field
The Greater Green River Basin (GGRB) is part of the Rocky Mountain foreland basin, a classic area of basement-involved (Laramide) structures (Jordan, Reference Jordan1981; Wiltschko & Dorr, Reference Wiltschko and Dorr1983; Dickinson et al. Reference Dickinson, Klute, Hayes, Janecke, Lundin, McKittrick and Olivares1988; DeCelles, Reference DeCelles2004) and a major gas-producing region in the western United States (Law, Pollastro & Keighin, Reference Law, Pollastro, Keighin, Spencer and Mast1986; Shanley & Cluff, Reference Shanley and Cluff2015). Composed of several sub-basins and uplifts, the GGRB is east of the mid- to Late Cretaceous E-vergent Sevier (or Wyoming) thin-skinned fold–thrust belt and SW of the Wind River uplift (Fig. 1). A major structure within the Greater Green River Basin is the N-trending Rock Springs uplift, an asymmetrical faulted anticline separating the Bridger sub-basin to the west from the Washakie and Red Desert sub-basins and intervening Wamsutter Arch to the east (Mederos, Tikoff & Bankey, Reference Mederos, Tikoff and Bankey2005; Rudolph, Crabaugh & Devlin, Reference Rudolph, Crabaugh and Devlin2015). The uplift has as much as 4.5 km of structural relief relative to surrounding sub-basins and it is cut by ENE-striking faults.
On the Wamsutter Arch, Table Rock is a NE-trending (035–040°) anticline formed on the eastern flank of the Rock Springs uplift during Late Cretaceous – Tertiary (Laramide) deformation (Mees, Copen & McGee, Reference Mees, Copen, McGee and Wiloth1961) (Fig. 2). An open, doubly plunging anticline defined by shallow dips of one to five degrees at the surface (White, Reference White1955), the structure was initially interpreted as cored by a high-angle reverse fault extending from basement through Upper Cretaceous age rocks (Mees, Copen & McGee, Reference Mees, Copen, McGee and Wiloth1961; Dickinson, Reference Dickinson1992). Seismic data reveal a main reverse fault involving basement, an antithetic back-thrust, two NE-trending, steeply dipping faults at depth interpreted as right-lateral strike-slip faults and small normal faults in the crest of the fold (Russell & Stone, Reference Russell, Stone, Ray and Sonnenberg1995). The fold–thrust faults are interpreted to have formed by right-lateral transpression of a pre-existing NE-trending basement structure during east–west Laramide shortening (Russell & Stone, Reference Russell, Stone, Ray and Sonnenberg1995).
Two periods of Laramide movement have been identified (Fan & Carrapa, Reference Fan and Carrapa2014; Rudolph, Crabaugh & Devlin, Reference Rudolph, Crabaugh and Devlin2015): a first stage of uplift during early Maastrichtian – early Palaeocene time (c. 71– 65 Ma); and a second stage during late Palaeocene – early Eocene time, when many faults were active in the foreland basin. Burial histories for Cretaceous rocks vary with position relative to basement-involved uplifts (Painter et al. Reference Painter, Carrapa, DeCelles, Gehrels and Thomson2014). Table Rock field is near a diffuse boundary between the modern Cordilleran extensional province, where maximum horizontal stress (S Hmax) trends north, and the mid-continent compressional province to the east, where S Hmax trends towards the ENE (Zoback & Zoback, Reference Zoback, Zoback, Pakiser and Mooney1989; Heidbach et al. Reference Heidbach, Tingay, Barth, Reinecker, Kurfeß and Müller2010). Based on drilling-induced petal fractures, S Hmax in the field is inferred to trend close to north–south (DeJarnett et al. Reference DeJarnett, Lim and Calogero2001). In Table Rock field the Frontier Formation is below the top of regional overpressure (Dickenson, Reference Dickinson1992; Krystinik, Reference Krystinik2000).
2.b. Cretaceous Frontier Formation
In the Washakie sub-basin, the early Late Cretaceous (Cenomanian–Turonian) Frontier Formation (Cobban & Reeside, Reference Cobban and Reeside1952; Kirschbaum & Mercier, Reference Kirschbaum and Mercier2013) occurs at a range of depths to over 7300 m. Our samples are from depths of 4538–4547 m. The unit is overlain by Hilliard/Baxter Shale and underlain by Aspen/Mowry Shale (Myers, Reference Myers, Heisey, Lawson, Norwood, Wach and Hale1977; Moslow & Tillman, Reference Moslow, Tillman, Spencer and Mast1986, Reference Moslow and Tillman1989). Comprising fine to medium sandstones, muddy sandstones and sandy mudstones (Dutton et al. Reference Dutton, Hamlin and Laubach1995), the Frontier is subdivided into several members and named sandstone beds (e.g. Merewether Reference Merewether1983) as well as having informal oilfield numerical designations of members and beds (Kirschbaum & Mercier, Reference Kirschbaum and Mercier2013); these include, in descending order, First, Second, Third and Fourth Frontier. The Second Frontier is an exploration target correlative with the Dry Hollow/Wall Creek and Oyster Ridge/Emigrant Gap members (Merewether, Reference Merewether1983; Merewether, Blackmon & Webb, Reference Merewether, Blackmon and Webb1984; Merewether & Cobban, Reference Merewether, Cobban and Peterson1986; Kirschbaum & Roberts, Reference Kirschbaum and Roberts2005). The Second Frontier in the eastern Green River Basin comprises an upper fluvial and an underlying marine section – the marine Second Bench of the Second Frontier – that grades upwards from offshore mudstones to shoreface sandstones.
In Table Rock field sandstones typically coarsen upwards from very-fine to medium and are well to very-well sorted with cross laminations in high-energy deposits and bioturbation structures elsewhere (Merewether, Reference Merewether1983). Marine depositional environments represented in core we examined are primarily middle- to lower-shoreface facies (DeJarnett et al. Reference DeJarnett, Lim and Calogero2001) (Table 1). Vertically, the sampled interval includes c. 12 m of sandstone (DeJarnett et al. Reference DeJarnett, Lim and Calogero2001; Lorenz, Krystinik & Mroz, Reference Lorenz, Krystinik, Mroz, Goolsby and Robinson2005).
Composition and mechanical properties; microanalysis samples.
a This study; b400 points counted (values shown are averages of two samples); cDeJarnett et al. Reference DeJarnett, Lim and Calogero2001.
Regionally, Frontier sandstones are dominantly litharenites to sublitharenites, with average composition of 64% quartz, 6% feldspar and 30% lithics, although more quartz-rich facies are locally present (Dutton et al. Reference Dutton and Hamlin1992). Quartz content ranges over 26–89%, plagioclase feldspar 0–55% (orthoclase feldspar is mostly absent) and lithic grains 10–75% (Dutton & Hamlin, Reference Dutton and Hamlin1992). In Table Rock field, sandstones are litharenites and sublitharenites with 5–10% rock fragments consisting of sedimentary, volcanic and metamorphic rock types (Dickenson, Reference Dickinson1992; DeJarnett et al. Reference DeJarnett, Lim and Calogero2001; our point counts) (Table 1).
Regionally, depositional porosity loss by mechanical compaction marked by low intergranular volume is extensive where ductile grains are common. Cements, principally quartz, calcite and clay minerals, comprise up to 38% of sandstone volume (Dutton & Hamlin, Reference Dutton and Hamlin1992). In Table Rock field illite-smectite clays locally comprise 2–4% of the sandstone (Dickenson, Reference Dickinson1992). Porosities are 0–19% with average primary porosity of 1.8%, average secondary porosity of 4.6% and estimated average microporosity of 6% (Dutton & Hamlin, Reference Dutton and Hamlin1992). Quartz-rich upper-shoreface facies of the Second Frontier has the highest porosity (average of 15%) compared with the fluvial part of the Second Frontier and the lower-shoreface facies of the Second Bench (average of 10% and 12%, respectively) (Dutton & Hamlin, Reference Dutton and Hamlin1992; Stonecipher & Diedrich, Reference Stonecipher, Diedrich, Stroock and Andrew1993). Permeability is low regionally, with values ranging from less than 0.1 to 10 mD (Dickenson, Reference Dickinson1992). Rock Island and Sidewinder cores have 8–12% porosity and 0.01–0.04 mD permeability (Table 1; DeJarnett et al. Reference DeJarnett, Lim and Calogero2001, DeJarnett, Lim & Calogero, Reference DeJarnett, Lim and Calogero2001).
2.c. Well histories
Well histories demonstrate that natural fractures in Table Rock are fluid conduits. In 1998 and 1999, Union Pacific Resources (UPR) drilled the Rock Island 4-H and Sidewinder 1-H horizontal wells on the N-plunging Table Rock anticline at depths of c. 4538–4547 m (DeJarnett et al. Reference DeJarnett, Lim and Calogero2001; DeJarnett, Lim & Calogero, Reference DeJarnett, Lim and Calogero2001) (Fig. 2; Table 1). The locations and NNE (c. 035°) well trajectories were intended to intersect fractures near ENE-trending reverse faults (Fig. 2). In the Frontier Formation the Rock Island well trajectory extended 533 m sub-parallel to bedding. The Rock Island well was completed as a natural-gas producer with a 30-day average initial production of 396400 m3 gas/day (14000 thousand cubic feet of gas per day or MCFGD) (DeJarnett et al. Reference DeJarnett, Lim and Calogero2001; Camp, Reference Camp, Cumella, Shanley and Camp2008), rates that represented the highest gas flow capacities encountered to that time in the Frontier Formation (DeJarnett et al. Reference DeJarnett, Lim and Calogero2001). According to Coleman (Reference Coleman, Cumella, Shanley and Camp2008), based on Wyoming Conservation Commission data, the Rock Island 4-H produced 2860000150 m3 gas (10.1 BCFG) and 321950 m3 water (2025 thousand barrels of water or MBW) between 1999 and 2007, when the well was still on production. Although detrimental to well economics (Krystinik, Reference Krystinik2000; Camp, Reference Camp, Cumella, Shanley and Camp2008), subsequent high water production corroborates that fractures dominate fluid flow pathways. The Sidewinder 1-H well also encountered fractures and had high water flow rates but uneconomic gas production. Three other wells in and near the field that have vertical Frontier Formation core with fracture descriptions (Dickenson, Reference Dickinson1992; Lorenz, Krystinik & Mroz, Reference Lorenz, Krystinik, Mroz, Goolsby and Robinson2005) show that the same fracture sets found in the horizontal cores are present over a wide area.
3. Methods
Using standard approaches on the available cores we divided fractures into sets using orientation, cross-cutting and abutting relations marking relative timing (Hancock, Reference Hancock1985) and cement deposits. Fracture orientation, cross-cutting relationships and fracture cement content were measured at the hand-lens scale using conventional and Celeron digital hand-lenses (×10 and ×50) and binocular microscopes. Fracture kinematic aperture, or opening displacement, was measured for fractures intersecting one-dimensional lines of observation (scanlines) both along core and in thin-section. Each scanline was oriented along the direction of the wellbore, which was oriented nearly orthogonal to fracture strike for one set and at a high angle to fracture surfaces (dip). Macroscopic fracture aperture sizes were measured using a comparator containing lines having a graduated range of widths from 0.05 to 5 mm (Ortega, Marrett & Laubach, Reference Ortega, Marrett and Laubach2006) and microfractures were measured on SEM-CL images obtained from multiple contiguous thin-sections (Gomez & Laubach, Reference Gomez and Laubach2006; Hooker et al. Reference Hooker, Laubach, Gomez, Marrett, Eichhubl, Diaz-Tushman and Pinzon2011).
Host rock, fault and fracture mineralogy and textures were documented using transmitted light petrography and cathodoluminescence (CL) imaging obtained with a Zeiss Sigma High Vacuum Field Emission SEM with an Oxford X-Max 50 Silicon drift detector (SDD) and a Gatan MonoCL4 system specifically configured for large-area mosaic SE, BSE, EDS and CL imaging. The SEM was operated at 12–15 kV and at large sample currents for panchromatic and colour CL imaging. Some colour CL images were obtained by combining three greyscale images produced using red, green and blue filters. Fracture cement textures were mapped at up to ×1000 using a high-resolution graphics touch screen. Sandstone composition was documented using standard point count techniques, and rock mechanical properties were measured for representative samples.
Mineral deposits for fluid inclusion analysis were chosen for completeness, optical clarity and abundance and distinctness of unambiguous fluid inclusion assemblages (FIAs). Rock analysed for fluid inclusions was impregnated with clear epoxy, and mounted in 2.5×5 cm 40–50 µm thick double-polished thin-sections. For fluid inclusion analysis thin-sections were broken into c. 1 cm2 pieces. For microthermometry we used a USGS-style gas flow heating/freezing stage mounted on an Olympus microscope equipped with a ×40 objective (numerical aperture 0.55) and ×15 oculars using the Becker et al. (Reference Becker, Eichhubl, Laubach, Reed, Lander and Bodnar2010) procedure. The heating/freezing stage was calibrated at 374.1°C and 0.0°C using synthetic pure H2O fluid inclusions, and at –56.6°C using synthetic CO2 fluid inclusions.
Multiple homogenization temperatures were measured from each FIA following Goldstein & Reynolds (Reference Goldstein and Reynolds1994) to ascertain that measurements within individual crack-seal gap-filling quartz deposits (marking opening increments) are internally consistent and fall within a narrow range of values. Liquid-vapour homogenization temperatures (T h) of individual inclusions within FIAs were determined to ±0.5°C by thermal cycling using temperature steps of 1°C (Goldstein & Reynolds, Reference Goldstein and Reynolds1994). Final ice-melting temperatures (T m) were determined to ±0.1°C by the same procedure. Eutectic melting temperature of fluid inclusions was not specifically measured; however, in some inclusions the approximate temperature was observed to estimate the overall chemical system. Fluid inclusion microthermometry analyses were performed prior to SEM imaging to avoid localized heating from the electron beam and possible re-equilibration of fluid inclusions by inelastic stretching and/or leakage.
4. Results
4.a. Sandstone rock types
Frontier Formation horizontal cores from the UPR Rock Island 4-H and Sidewinder 1-H wells comprise 41.5 m of rock in four cored intervals (Table 2). All four cores we examined are interpreted to be nearshore marine sandstones and are similar in that they are pervasively burrowed, as is common regionally for middle- to lower-shoreface Frontier sandstones. Cores 1 and 2 from the Rock Island well sampled the marine Second Bench of the Second Frontier. Sparse burrows and local planar laminations suggest this is middle- to possibly upper-shoreface sandstone, although quartz-rich, trough cross-bedded facies typical of ‘clean’ upper-shoreface facies is absent. Core 3 from the Rock Island well and Core 4 from the Sidewinder well sampled underlying intensively burrowed lower-shoreface sandstone of the Second Bench (DeJarnett et al. Reference DeJarnett, Lim and Calogero2001).
Sample depths and number of fractures. RI – Rock Island 4-H well; SW – Sidewinder 1-H well.
* Within second frontier; very fine to fine sublitharenite.
Our point counts agree with previous compositional analysis reported by DeJarnett et al. (Reference DeJarnett, Lim and Calogero2001) that sandstones are low porosity (3–10%) litharenites to sublitharenites (average 87.4% quartz, 2.1% feldspar, 10.6% lithics) and fall within regional patterns for the unit. Two samples from middle- to upper-shoreface sandstone in Core 1 contain 81–94% quartz, 0–6% feldspar and 6–18% lithic grains. Lower-shoreface sandstone has values of 79–93% quartz, 0–5% feldspar and 7–20% lithics. Low porosity (3–10%) results from compaction and quartz, calcite and kaolinite cement.
4.b. Fracture orientations and sets
Our observations of fracture orientations and relative timing agree for the most part with previous descriptions by Lorenz, Krystinik & Mroz (Reference Lorenz, Krystinik, Mroz, Goolsby and Robinson2005). Sets 1 and 2 of opening-mode fractures with east–west and north–south strikes, respectively, dip at a high angle to bedding (Fig. 3). Sets are oriented at both high and low angles to the present-day north–south direction of maximum horizontal stress (S Hmax) as defined by drilling-induced petal fractures. Both sets contain quartz and porosity. Bitumen is widespread in Set 1 but is locally found in Set 2. Both sets locally have calcite and kaolinite cement. About half of the cored fractures are sufficiently intact to have measurable opening displacement of 0.25–0.5 mm and most of these have visible porosity. Striations (slip lineations), primarily deformed quartz cement fracture fill, are present in 22 E-striking fractures, 11 from the middle- to upper-shoreface facies and 11 from the lower-shoreface facies. We interpret these to be Set 1 fractures subsequently reactivated in shear (faulted joints, Wilkins et al. Reference Wilkins, Gross, Wacker, Eyal and Engelder2001). These are mostly low plunge striations compatible with strike-slip to oblique-slip movement. No slip indicators were found on N-striking Set 2 fractures. Centimetre-wide zones of locally striated, microporous quartz-lined breccia having steep dips and strikes similar to Set 1 are small-displacement oblique-slip faults that are also visible on borehole image logs. Set 3 comprises a few narrow E-striking fractures occluded by kaolinite.
Core photographs showing abutting relations and fracture porosity. (a) N-striking Set 2 fracture abuts E-striking Set 1 fracture. Note porosity visible in Set 2 fracture. Sidewinder core, measured depth 4878.4 m (16005.2 ft) using a digital hand-lens. (b) Intersecting fractures at 4857.1 m (15935.5 ft) measured depth. A N-striking fracture intersects and apparently abuts an E-striking fracture. Note cement patches on Set 2 fracture face. Looking down on Rock Island 4-H Core 3. Shallower depths (up hole) are to left. North is indicated by arrow.

Although only two clear examples of cross-cutting and abutting relations were found, both are compatible with E-striking fractures forming before N-striking fractures. In lower-shoreface facies in Core 4 at 4878.4 m (Fig. 3a), an E-striking fracture mostly filled with quartz cement is cross-cut by a N-striking fracture also partly filled with quartz cement but with a large amount of remnant fracture porosity.
The other example, in Core 3 at 4857.1 m (Fig. 3b), is an E-striking fracture filled with quartz, bitumen and kaolinite that contains striations, indicating that this is a shear-reactivated fracture. A N-striking Set 2 fracture filled with quartz and some bitumen is present on the up-core side of the E-striking fracture, but not on the down-core side. The Set 2 fracture either abuts or is offset by slip on the E-striking fracture. The geometry could result from either: (1) formation of the E-striking fracture, shear reactivation, then formation of the N-striking fracture that abutted and terminated against the E-striking fracture; or (2) formation of the E-striking fracture, formation of the N-striking fracture that crossed the E-striking fracture, then shear reactivation of the E-striking fracture displaced the other end of the N-striking fracture, sufficiently far away to avoid sampling by the core.
In both cases, the E-striking fracture pre-dates the N-striking fracture, but this example provides the only geometric evidence for the relative timing of shear reactivation of E-striking Set 1 relative to when Set 2 formed. The E-striking fracture is narrow and may not have been a substantial fracture growth barrier, so we interpret slip on Set 1 to post-date formation of Set 2. Reactivation of Set 1 is kinematically compatible with small faults in the core and small faults (c. 3 m offset) documented by DeJarnett et al. (Reference DeJarnett, Lim and Calogero2001) in wellbore image logs. We interpret Set 1 reactivation and small faults to be contemporaneous. Lorenz, Krystinik & Mroz (Reference Lorenz, Krystinik, Mroz, Goolsby and Robinson2005) interpreted Set 1 to be regional fractures and Set 2 to be possibly related to folding of Table Rock anticline. Our fluid inclusion results illuminate absolute timing; the topic is revisited in the discussion in Section 5.
4.c. Spacing
Nearest-neighbour spacing between fractures is the length of rock between two adjacent fractures, measured perpendicular to fracture walls. Spacing was measured for all 139 macroscopic fractures. We found average fracture abundance of 3.4 fractures/m, in agreement with previous observations of about 3 fractures/m (DeJarnett et al. Reference DeJarnett, Lim and Calogero2001; Lorenz, Krystinik & Mroz, Reference Lorenz, Krystinik, Mroz, Goolsby and Robinson2005). Close spacing is consistent with the presence of fractures in core from three nearby vertical wells (Lorenz, Billingsley & Evans, Reference Lorenz, Billingsley and Evans1998; Lorenz, Krystinik & Mroz, Reference Lorenz, Krystinik, Mroz, Goolsby and Robinson2005). For all sets, fracture spacing is uneven (Fig. 4). In Cores 1 and 2 distance between fractures is as much as 5.2 m, and in Core 3 about 1.2 m. A few fractures are as little as 2.5 cm apart.
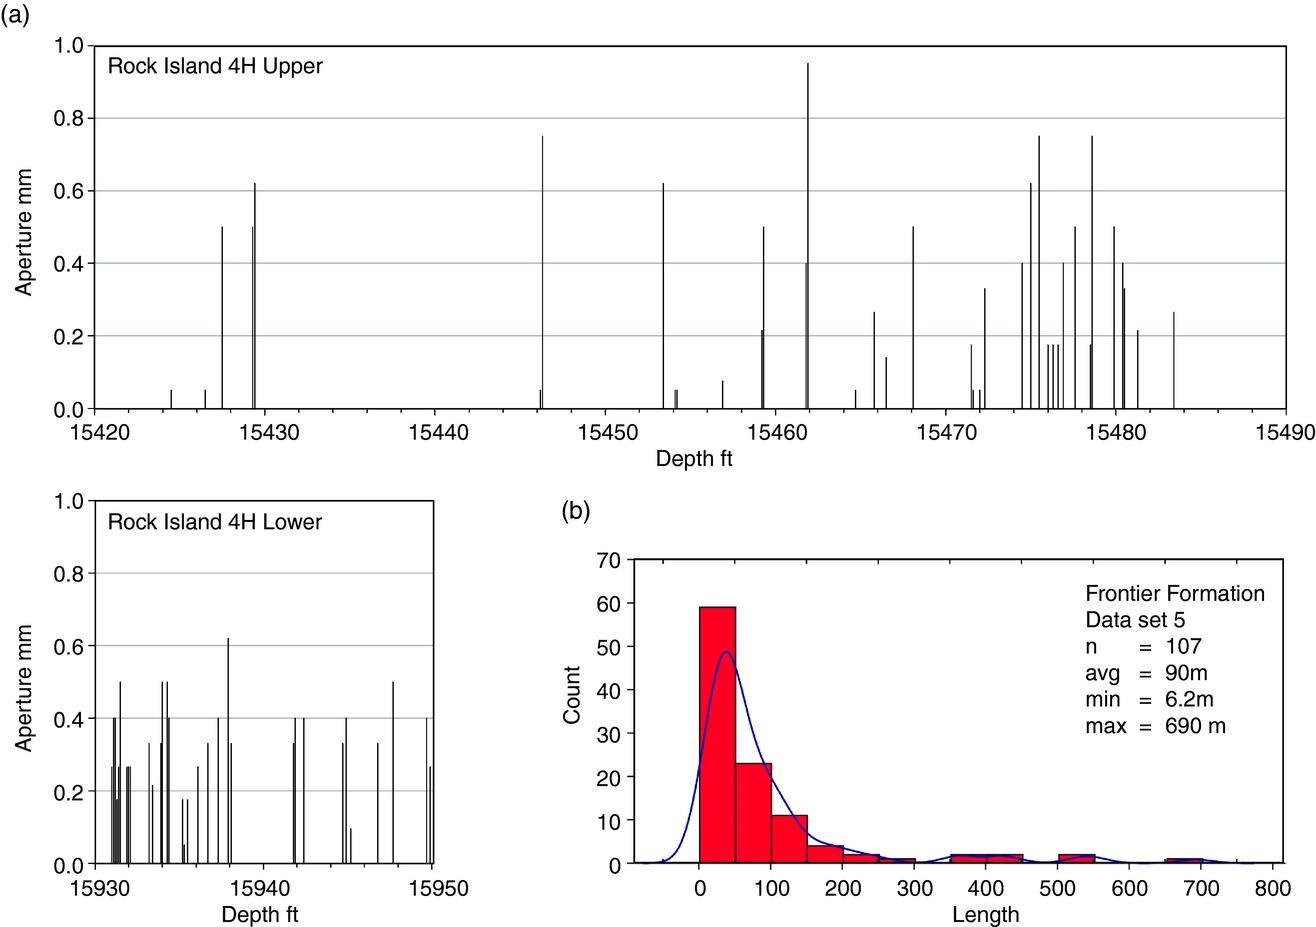
Fracture sizes. (a) Kinematic aperture sizes versus distance along core. Note apparent clustering. Average spacing measurements do not take apparent clustering into account. Core measured depths are in feet. (b) Fracture trace length histogram from outcrop. Shape of distribution partly governed by censoring due to outcrop size. Data from Frontier outcrops near Muddy Gap, Wyoming. Measured from Google Earth. Outcrop trace patterns and lengths are also documented in Lorenz & Laubach (Reference Lorenz and Laubach1994) and Laubach (Reference Laubach, Schmoker, Coalson and Brown1992) from low-level air photographs and outcrop maps.
We found 127 Set 1 fractures of which 41 are in middle- to upper-shoreface sandstone and 86 in lower-shoreface sandstone. Set 1 spacing ranges from 0.0025 to 6.95 m (mean 0.35 m). In upper-shoreface facies, Set 1 spacing ranges from 0.0018 to 3.71 m (mean 0.43 m). In lower-shoreface facies, Set 1 spacing ranges from 0.0025 to 6.95 m (mean 0.31 m). Fewer spacing measurements for Set 2 result from this set striking close to the well trajectory. Only 12 N-striking Set 2 fractures were found, 2 in middle- to upper-shoreface and 10 in lower-shoreface sandstones. Set 2 spacing ranges from 0.0013 to 16.79 m (mean 0.19 m). In upper-shoreface facies, two Set 2 fractures are 0.23 m apart. In lower-shoreface facies, Set 2 spacing ranges from 0.0013 to 16.77 m (mean, 3.51 m).
4.d. Aperture sizes and microfractures
Fracture sizes have not previously been measured in these cores. One aspect of fracture size is kinematic aperture (Marrett, Ortega & Kelsey, Reference Marrett, Ortega and Kelsey1999), the width or opening component of displacement regardless of cement fill. Kinematic apertures were obtained for 69 macroscopic fractures, 20 from middle- to upper-shoreface facies (Cores 1 and 2) and 49 from lower-shoreface facies (Cores 3 and 4). About half of the macrofractures observed in core are broken, likely during coring or extraction, precluding accurate aperture measurement. Some core separated along quartz-lined fractures of indeterminate aperture in the subsurface may have been open but unbridged by cement. In a few cases we estimated minimum kinematic apertures from cement deposit thickness on fracture faces. Narrow fractures are more likely to preserve accurate kinematic apertures, since wider fractures have remnant porosity and are therefore more likely to lack spanning quartz deposits, to break apart or to have been reactivated. For striated, reactivated fractures, cement deposit widths are measurable but, due to unknown width changes during slip, are unreliable records of opening displacement. These were omitted from the statistical compilation.
Intact and measurable Set 1 fractures range in kinematic aperture from 0.10 mm to more than 0.9 mm (mean and mode 0.33 mm) (Fig. 4). In middle- to upper-shoreface facies, Set 1 fractures apertures range from 0.10 to 0.62 mm (mean 0.32 mm). In lower-shoreface facies, Set 1 ranges from 0.12 to 1.75 mm wide (mean of 0.33 mm). Set 2 fractures range in kinematic aperture from 0.14 to 0.50 mm (mean 0.26 mm). The upper-shoreface facies has two N-striking fractures that have apertures of 0.18 and 0.27 mm. In the lower-shoreface facies fractures range in width from 0.14 to 0.50 mm (mean 0.28 mm).
Microfractures or fractures that can only be seen using magnification and generally having kinematic apertures less than 0.1 mm (Anders, Laubach & Scholz, Reference Anders, Laubach and Scholz2014) are common in deeply buried, quartz-cemented sandstones (i.e. Hooker, Laubach & Marrett, Reference Hooker, Laubach and Marrett2014) including in some quartz-rich (‘clean’) upper-shoreface Frontier Formation sandstones (Stratos Federal 1–24 core analysis in DeJarnett, Lim & Calogero, Reference DeJarnett, Lim and Calogero2001). Transgranular microfractures are those crossing at least two grains, and are the type of microfracture most readily interpreted as the small-size fraction of a fracture population rather than artefacts, inherited features or grain-scale compactional deformation (Laubach, Reference Laubach1997) (Fig. 5). In the cores we examined, transgranular microfractures are nearly absent. Our analysis used SEM CL image mosaics in scanlines across 32 thin-sections encompassing 1.1 m of core from six sampled areas: three in upper-shoreface facies and three from lower-shoreface facies. More than 100 microfractures were found in the mosaics, but only 26 of these are transgranular. All microfractures are filled with quartz cement. Microfractures are equally sparse in middle- to upper- and in lower-shoreface facies: 0.10 and 0.09 microfractures/mm, respectively. Some other clay-mineral- and lithic-rich sandstones have similarly low microfracture abundance (Ellis et al. Reference Ellis, Laubach, Eichhubl, Olson and Hargrove2012); low microfracture abundance in the Rock Island and Sidewinder cores compared to numerous transgranular microfractures in quartz-rich upper-shoreface sandstones in the Stratos core and some other Cretaceous sandstones in the Rocky Mountain region (Hooker et al. Reference Hooker, Gale, Gomez, Laubach, Marrett and Reed2009) therefore likely reflects fracture style in rock having high lithic, feldspar and clay mineral content.
Quartz-filled microfractures. Colour CL images. Textures are compatible with these examples forming by inter-grain compaction. (a) Sparse compaction microfractures, Rock Island sample depth 15621 ft (image by R. Reed). (b) High microfracture density, Stratos Federal well, west of the Rock Springs uplift. G – grain; Qc – quartz overgrowth cement; F – microfracture; P – porosity.

Aspects of fracture size that are not readily measurable in cores are height and length. Fracture heights in nearby Frontier Formation outcrops are typically bed-bounded and therefore span sandstone thickness (Laubach & Lorenz, Reference Laubach, Lorenz and Mullen1992). Vertical well data reported by Lorenz, Krystinik & Mroz (Reference Lorenz, Krystinik, Mroz, Goolsby and Robinson2005) for nearby Frontier wells are compatible with fracture heights bounded within sandstone beds. Lengths are not measureable in core but, on the assumption that fracture lengths in outcrop may be useful guides to lengths of subsurface fractures, we measured fracture trace lengths in large outcrops around the Green River Basin margin of those readily visible on GoogleEarth images (with field check for many outcrops). Although the length distribution patterns are incompletely sampled due to censoring by finite outcrop size and other problems, results show that in outcrops of this formation extremely long fractures (>500 m) are common (Fig. 4b).
4.e. Fracture cements and porosity
Previous studies of Frontier Formation in and near Table Rock field noted fracture cements composed of quartz, calcite and kaolinite and, in Set 1, bitumen (Dickenson, Reference Dickinson1992; Lorenz, Billingsley & Evans, Reference Lorenz, Billingsley and Evans1998; Lorenz & Mroz, Reference Lorenz and Mroz1999; DeJarnett et al. Reference DeJarnett, Lim and Calogero2001; Lorenz, Krystinik & Mroz, Reference Lorenz, Krystinik, Mroz, Goolsby and Robinson2005). Fracture pore-space preservation varies, from open to mostly cement-sealed. In the Rock Island cores about half of Set 1 fractures have striations superposed on fracture cement due to shearing during reactivation.
Quartz is the most abundant mineral in both sets (Figs 6–10) and in fault rocks. Quartz is the first cement to precipitate, although quartz in two-dimensional sections locally (and misleadingly) appears to overlap bitumen due to some elongate quartz crystals at an angle to Set 1 walls. Where other phases are present, overlapping textures among minerals and the fracture surfaces show a sequence of quartz cement first, followed by bitumen (in Set 1) then calcite. Calcite is only distributed in rare patches (Fig. 8). Some fractures in both sets only have quartz cement as well as open remnant porosity.
Quartz cement patterns and internal structures. Bridge (Br) and rind (Rd) deposits develop in response to rapid accumulation in gap deposits (Gd) compared to slow rates on euhedral crystal faces. Bridge formation depends on the ratio of rates of quartz growth to fracture opening (Lander & Laubach, Reference Lander and Laubach2015). (a) Diagram based on transmitted light images showing bridge, rinds, fluid-inclusion trails of various lengths (FIA), and lateral cement (Lt) in bridge. Fw – fracture wall; P – porosity. Based on Laubach (Reference Laubach1988). (b) Bridge schematic showing gap deposits (Gd – box indicates part of deposit), fluid-inclusion assemblages (FIA) within gap deposits, and lateral deposits (Lt). P – porosity; G – grain; Oc – quartz cement lining host-rock porosity. Based on Lander & Laubach (Reference Lander and Laubach2015) simulation and CL images. Although in 2D section bridges appear to block porosity continuity, their pillar shape in three dimensions does not impede flow. DeJarnett et al. (Reference DeJarnett, Lim and Calogero2001) report high laboratory flow rates on intact, quartz-bridged fractures from Table Rock Frontier wells.
Set 1 fracture porosity and quartz cement. (a) Transmitted light (TL). (b) Map of porosity and areas of quartz deposits having crack-seal texture (pink). P – porosity (blue); Br – quartz bridge; F1w – Set 1 fracture wall; Cs and pink highlight – areas within quartz having crack-seal texture determined from CL images, marked in transmitted light by dense fluid-inclusion occurrence visible as faint speckled patterns in TL image. F2m and red line transverse to Set 1 fracture wall is a cross-cutting Set 2 microfracture. Sample RI15933 ft measured depth. Bed-parallel thin-sections; north is to right in image.

Set 1 fracture porosity and quartz cement. (a) Transmitted light (TL). (b) Map. P – porosity (blue); Br – quartz bridge; F – Set 1 fracture wall; Ri – quartz rind on fracture wall; CC – patch of calcite fill overlapping quartz. Sample 15465 ft measured depth. Bed-parallel thin-sections; north is to right in image.

Set 1 fracture showing bridge and rind morphology. Transmitted light. Boxes labelled a–d show areas of close-up images. FIAs – fluid-inclusion assemblages. Gd and pink highlights in main image and c and d, areas of gap deposits. (a) Porous area dominated by rind deposits, Ri. (b) Amalgamated bridge with narrow areas of crack-seal texture (marked by FIAs). Texture similar to that of CL image in Figure 11. (c) Bridge with gap deposits (pink) that do not span between fracture walls. X indicates textureless quartz that spanned fracture after opening ceased. (d) Bridge spanned by narrow crack-seal core of gap deposits, surrounded by wide lateral quartz deposits, Lt. P (blue) – porosity. Sample RI15933 ft measured depth. Bed-parallel thin-sections; north is to top of image.

Set 2 fracture porosity and quartz cement. (a) Transmitted light (TL). Box indicates bridge with FIA measurements. (b) Map. P – porosity (blue); Br – quartz bridge; F – Set 1 fracture wall; Ri – quartz rind on fracture wall. Sample SW16005.2 ft. Bed-parallel thin sections; north is to top of image. Porosity exists in fractures of both sets. Because quartz cement deposits are typically in isolated bridges surrounded by thin rind deposits where porosity is extensive, the spatial continuity of porosity within fractures is great. Temporal persistence of fracture porosity despite long-term exposure to cement accumulation is consistent with slow rates of modelled quartz accumulation and documented rates in basins having simple and well-known burial histories (Lander & Laubach, Reference Lander and Laubach2015).

Although overlap relationships are ambiguous, kaolinite cement likely post-dates bitumen and probably post-dates calcite cements. Kaolinite cement fills irregular voids within reactivated E-striking fractures. Set 3 comprises a few fractures having only kaolinite cement fill with no quartz cement. One 0.5 mm wide N-striking fracture is filled with kaolinite. These kaolinite-bearing fractures are in sandstones having identical composition to those containing fractures with quartz deposits. Possibly these kaolinite-only fractures formed at a different time to those containing quartz. Since kaolinite overlaps quartz in fractures containing both phases, relations imply that kaolinite-only fractures formed later than those containing quartz and kaolinite.
For Sets 1 and 2, fracture porosity is arranged in distinctive patterns comprising thick quartz deposits that may span between fracture walls (bridges) surrounded by areas of extensive porosity and extremely thin quartz deposits (rinds) (Figs 6, 9). Porosity in some reactivated Set 1 fractures comprises relict porosity and bridges that have been cross-cut by narrow zones of comminuted and quartz-cemented low-porosity rock.
4.f. Crack-seal textures, bridges and rinds
High-resolution SEM-CL imaging techniques that allow delineation of crack-seal and overgrowth textures within quartz deposits, documenting the relative timing of accumulation of various cements and reconstruction of sequences of fracture widening (Laubach et al. Reference Laubach, Olson and Gale2004), were not available for previous studies of these Frontier Formation cores. Quartz lines and locally spans fractures of both Sets 1 and 2; spanning cement is in isolated deposits called quartz bridges (Fig. 6). Under SEM-CL imaging these bridges exhibit crack-seal texture (Figs 11, 12), indicating that quartz precipitated concurrently with fracture opening. Textural mapping and reconstruction allow numerous and previously undescribed fluid inclusion assemblages (FIAs) in Sets 1 and 2 to be put into a time sequence (Figs 13–15).
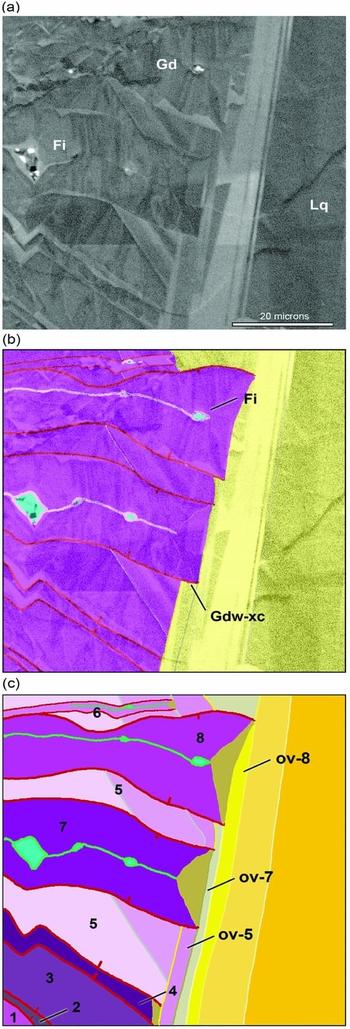
Quartz cement structures, Set 1. (a) CL image of fracture quartz (Q) and partial grain and cement map (wall rock; see (b) for key). Shades of grey in CL image mark crack-seal and overlap textures in quartz. Box shows location of Figure 12. P – porosity; Fp – local fracture porosity in microfracture localized on clay-mineral rich clast (green); Lf – late microfracture. (b) Map of (a) showing crack-seal gap deposits (purple) in three synkinematic bridges (BRa–c), surrounded successively by synkinematic lateral deposits (yellow; Lq1–4) and by post-kinematic overlap quartz (Pkq). Measured fluid-inclusion assemblages from Figure 13: fi-1 – oldest; fi-5 – youngest. Map key: 1, monocrystalline quartz grains; 2, shale rock fragments; 3, chert; 4, potassium feldspar grains; 5, other grains; 6, carbonate cement; 7, clay minerals/chlorite; 8, quartz grain-fracture surface; 9, polycrystalline quartz; 10, grain contact; 11, lateral cement quartz Lq1–3; 12, gap deposit quartz; 13, pre-kinematic quartz cement (wall rock); 14, synkinematic cement undifferentiated; 15, porosity. Rock Island core measured depth 15933 ft.

Gap deposit sequences from cross-cutting crack-seal textures and overlap relations in part of BRa, inset in Figure 10. (a) CL – crack-seal and overlap cement; Gd – gap deposits; Lq – lateral deposits. (b) Map showing area of gap (purple; colour key as in Figure 11) and lateral deposits. Gdw-xc – gap-deposit wall (fracture). Note cross-cutting relation. Fi – fluid inclusion trapped on gap deposit medial line. (c) Map differentiating gap deposits: 1 (oldest in map) to 8 (youngest). Lateral deposits ov-5, 7 and 8 overlap gap deposit 5, 7 and 8 respectively. Set 1 fracture. Rock Island measured depth 15933 ft.
Set 1. (a) Transmitted light image with locations of FIAs (yellow line), FIA temperatures (°C) and number of inclusions in FIA (brackets). (b) Panchromatic CL mosaic of same area. (c) Interpreted sequence. Colours show groups of gap deposits and FIAs that are about the same relative age based on cross-cutting and overlap relations. 1, oldest; 5 youngest. Rock Island 15933 ft, bridges 3, 4.

Set 2. (a) Transmitted light image with locations of FIAs (yellow line), FIA temperatures (°C) and number of inclusions in FIA (brackets). (b) Panchromatic CL mosaic of same area. (c) Interpreted sequence. Colours show groups of gap deposits and FIAs that are about the same relative age based on cross-cutting and overlap relations. 1, oldest; 4 youngest. Sidewinder 16005.2 ft, bridge 3.

Set 2. (a) Transmitted light image with locations of FIAs (yellow line), FIA temperatures (°C) and number of inclusions in FIA (brackets). (b) Panchromatic CL mosaic of same area. Colours show groups of gap deposits and FIAs that are about the same relative age based on cross-cutting and overlap relations. 1, oldest; 4 youngest. Sidewinder 16005.2 ft, bridge 1.

Isolated quartz deposits that span between fracture walls (bridges) are common in sandstones that have experienced deformation at burial temperatures of c. 80°C or more (Laubach, Reference Laubach1988; Laubach et al. Reference Laubach, Olson and Gale2004) (Figs 7–10). Bridge deposits are pillar-shaped and elongate normal to fracture walls. Commonly they contain crack-seal texture, marking repeated fracture widening and cement precipitation. Bridge pillars are typically surrounded by thin rinds or veneers of quartz and porosity or later cement deposits. According to Lander & Laubach (Reference Lander and Laubach2015), rind morphologies develop because crystals that fail to span fractures between widening increments develop slow-growing euhedral faces. Failure to span occurs when fracture opening rate exceeds two times the fastest rate of quartz growth in the fastest growth setting, along the c-axis on non-euhedral surfaces. Where cement does not span, accumulation at the slowest rates results in inconspicuous, thin idiomorphic rind deposits. The occurrence of bridges and rinds therefore implies that the rate limiting step for quartz accumulation is temperature-history-dependent precipitation, as is commonly the case for quartz cement in host sandstones (Lander, Larese & Bonnell, Reference Lander, Larese and Bonnell2008; Taylor et al. Reference Taylor, Giles, Hathon, Diggs, Braunsdorf, Birbiglia, Kittridge, Macaulay and Espejo2010).
Rind deposits gradually encroach into open pore space, and lack textural evidence of fracture widening. But in fracture-spanning bridges, textural evidence of incremental fracture widening is evident for both Set 1 and Set 2 bridges. Paired fracture walls and a gap form at each widening step within bridges. Quartz accumulating on pairs of fracture surfaces represents the sealing step of the crack-seal process (Lander & Laubach, Reference Lander and Laubach2015, fig. 7). Quartz deposits accreting on facing walls within bridges called gap deposits meet along sinuous median/centreline surfaces (Figs 6, 12), where fluid inclusions are trapped by rapid cement accumulation. Gap deposits that span between fracture walls are a consequence of rapid cement accumulation being confined to those parts of cement deposits subjected to repeated fracturing. In Frontier Formation fractures, all of these features are visible in parts of quartz bridge deposits. Within individual bridges, gap deposits are commonly nearly parallel to one another and the main fracture walls; later fractures cut across earlier deposits however, producing complex cross-cutting relations. Repeated fracturing and continuous cement growth during bridge development subdivides gap deposits into complex patterns (Figs 11, 12).
Trails of fluid inclusions parallel to fracture walls and trapped within gap deposits are surrounded by inclusion-poor quartz, comprising lateral cement deposits that are continuously deposited and therefore in part concurrent with bridge growth (Lander & Laubach, Reference Lander and Laubach2015). Measured parallel to fracture walls, where gap deposits are longer, lateral cement deposits are narrower. This pattern arises because lateral cement accumulates concurrently with crack seal, gradually widening the base and sides of the bridge and increasing bridge girth (Lander & Laubach, Reference Lander and Laubach2015). Lateral deposits gradually thicken with time and are cut by later fractures, which can form at any point in the bridge, creating longer gap deposits and giving the interface between central crack-seal gap deposits and lateral cement deposits a serrate pattern. Differences in gap length parallel to the fracture are a measure of gap deposit relative age, with longer gap deposits generally younger (Lander & Laubach, Reference Lander and Laubach2015) if bridge geometry is simple (no interference from adjacent deposits).
By using lengths of gap deposits, or by structural mapping and palinspastic restoration of crack-seal gap and lateral deposits, sequences and relative timing of gap deposits can be documented (Fig. 12). This procedure also sequences the fluid inclusion assemblages contained within gap deposits.
Set 1 fractures that were not reactivated in shear contain the widest (greatest girth) and most extensive preserved bridges and the largest pores. Measured parallel to fracture walls in wide fractures, bridge girths are commonly less than 0.1–0.25 mm wide, although areas where nearby bridges have grown together are up to 1.5 mm wide. In cross-section, porous fracture areas surrounded by rind deposits have dimensions of 1.5 mm to more than 2 mm (Fig. 9); however, due to circumscribed bridge shapes these porous areas are interconnected. Moreover, narrower fractures tend to be more completely quartz filled due to the greater quartz-spanning potential (Lander & Laubach, Reference Lander and Laubach2015). On some wide fractures that were not preserved intact (and that may have been wider than intact fractures), inspection of fracture faces in porous areas shows mostly rind quartz. This is consistent with bridges being less prevalent in wide fractures.
There are as many as 30–50 gap deposits within fractures of width 0.5 mm. Gap deposit widths (measured normal to fracture walls) range from 5 μm to more than 25 μm. Although average gap size is about 7 μm, early-formed gap deposits tend to be markedly wider than those formed later. Early gap deposits are typically from 15 μm to more than 25 μm wide, whereas late gap deposits are commonly only 5–7 μm wide but with numerous, much narrower widths (as much as 0.5 μm). In some bridges, textures indicate that quartz failed to immediately span between fracture walls during fracture opening for some part of the opening history (Figs 9c; Fig. 11, BRa). Crystals with rind morphology and lacking crack-seal texture subsequently spanned these gaps.
Measured parallel to fracture walls gap deposit lengths are only a fraction of bridge girth. The balance of the bridge is made of clear, inclusion-free quartz that grew as a lateral deposit overlapping quartz core crack-seal texture. The small areas of synkinematic quartz cement compared to the larger areas of later overlap quartz cement is evident in the narrow dimensions of areas having crack-seal texture and fluid inclusions, highlighted in Figure 9.
Some of the lateral quartz was deposited concurrently with bridge growth. This timing is marked by lateral cement cut by later gap deposits. Lateral deposits not cut by gap deposits post-date fracture wall movement. These post-kinematic overgrowth and lateral cement deposits are thick in Set 1 such that only approximately 25–50% or less of the area of individual quartz bridges exhibit crack-seal texture (e.g. Fig. 9). Within these bridges, areas having fluid inclusions and therefore synkinematic quartz are commonly narrow parallel to the fracture wall and locally discontinuous perpendicular to the fracture wall. Sections cut through edges of pillar-shaped bridges could overestimate the quantity of lateral cement relative to gap deposits in bridge centres. However, systematically narrow gap-deposit areas relative to overlap quartz cannot be explained by cut effects.
Mapping shows that initially, during widening, bridge girths were narrow (as measured parallel to the fracture wall). In Set 1 subsequent accretion of post-kinematic lateral quartz greatly enlarged bridge dimensions parallel to fracture walls. These texture patterns show that although copious quartz cement is present in Set 1 fractures now, only the small amount within gap deposits and the lateral cement cut by gap deposits was added during fracture widening. The textures show that considerable amounts of quartz accumulated on the sides of bridges, as well as along the unbridged section of fracture walls (rind deposits). In other words, present-day quartz bridges are wide but the crack-seal parts of the bridges are narrow, meaning that quartz spanning between fracture walls was in slender, spindle-shaped deposits during fracture opening.
These textures of extensive lateral deposits are compatible with fracture exposure to protracted elevated temperatures after fractures ceased widening.
Set 1 bridge quartz also contains local arrays of microfractures aligned obliquely at 20–30° to fracture walls (Fig. 11). These narrow late microfractures are kinematically compatible with and likely mark the same deformation that comminuted and striated quartz cement in some Set 1 fractures.
Set 2 bridges tend to have narrower girth overall than those of Set 1. The number and size of gap deposits are similar. Early-formed gap deposits tend to be numerous, closely spaced, wide (10–20 μm) and of closely similar length parallel to fracture walls. Later Set 2 gap deposits are narrow (15 μm or less), sparsely distributed in bridges and many angle across earlier gap deposits at shallow angles to the fracture wall (rather than paralleling the wall). Bridge lateral deposits and rind deposits are thinner than those of Set 1 (Fig. 10).
Set 2 bridges show evidence of two-stage growth. Although Set 2 bridge girths are narrower than those of Set 1, within Set 2 bridges the proportion of quartz having crack-seal texture is higher than for Set 1 and the proportion of overlapping lateral deposits is less. Moreover, these lateral deposits are cut by a few gap deposits having lengths (dimension parallel to the fracture wall) that extend nearly to the edge of the bridge. This pattern forms when an early formed bridge experiences a period of quiescence (no fracture widening) during which time the unstructured lateral deposits accumulate. The sparse late, longer gap deposits are evidence of a second stage of Set 2 fracture widening.
The pattern of overlap quartz cement deposits suggests that for both fracture sets, after fractures ceased opening and no more crack-seal texture was formed, quartz continued to accumulate in relict pore space within fractures and around existing bridges. The larger volumes of post-fracture quartz in Set 1 compared to Set 2 is compatible with Set 1 being older than Set 2, as inferred from cross-cutting relations among macroscopic fractures.
4.g. Fluid-inclusion assemblages
Two fractures in Set 1, from Rock Island well MD 4856.65 m (15933.9 ft) and Sidewinder well MD 4876.04 m (15997.5 ft), and one fracture analysed in Set 2 from Sidewinder well MD 4878.38 m (16005.2 ft), contain quartz cement bridges with fluid inclusions large enough to be suitable for microthermometry (Table 3). The fluid inclusion assemblages (FIA; Goldstein & Reynolds, Reference Goldstein and Reynolds1994) trapped along the median line of the fracture wall-parallel gap deposits (Figs 13–15) are composed of two-phase aqueous liquid-vapour fluid inclusions. The inclusions contain a 7–10 vol% vapour bubble at room temperature, have shapes ranging from elongate-rounded to negative crystal shapes and have long diameters aligned with the gap deposits over the range c. 1–15 µm.
Fluid inclusion microthermometry results. Fluid inclusion assemblages (FIA) are arranged in chronologic order with FIA#1 the oldest in each bridge. n – number of fluid inclusions in respective fluid inclusion assemblage.

Microthermometry on inclusions from four quartz bridges from the two E-striking Set 1 fractures (Fractures 1 and 2) and three bridges from the one N-striking Set 2 fracture (Fracture 3) in the lower-shoreface facies (Figs 13–15) show a range and a progression of trapping temperatures (Table 3). Temperature variation within any single FIA was generally less than 2–4°C. Homogenization temperatures (T h) in Fracture Set 1 range from c. 140°C to c. 165°C, and show systematic temperature change with both increasing and decreasing trends from c. 140°C to c. 165°C to c. 150°C when correlated with the sequence of gap deposits (Table 3; Fig. 13). T h in Fracture Set 2 range from c. 160°C to c. 142°C while correlation with gap deposit sequence shows a decreasing temperature trend with time (Table 3; Fig. 15).
Initial ice melting (eutectic) temperatures of the inclusions were observed (where possible) to be in the range of –22 ° to –20°C, suggesting a NaCl-dominated fluid composition for the inclusions. Final ice melting temperatures were found to be consistent in both fracture sets and range between –4°C and –5°C, corresponding to salinities in the range of 6.5–7.9 wt% NaCl equivalents (Bodnar, Reference Bodnar1993).
The vapour bubble in the aqueous inclusion following homogenization reappears near the observed T h without the need to be supercooled by 20–30°C, typical for bubble nucleation in aqueous inclusions (Roedder, Reference Roedder1984; Goldstein & Reynolds, Reference Goldstein and Reynolds1994). This suggests the presence of a substantial amount of dissolved gas in the aqueous fluid (most probably CH4) which lowers the surface tension of the fluid, a barrier needing to be overcome for bubble nucleation (Jennings & Newman, Reference Jennings and Newman1971; Sachs & Meyn, Reference Sachs and Meyn1995). Similar behaviour during bubble nucleation was observed in methane-saturated aqueous inclusions in East Texas and Colorado sandstone fractures (Becker et al. Reference Becker, Eichhubl, Laubach, Reed, Lander and Bodnar2010; Fall et al. Reference Fall, Eichhubl, Cumella, Bodnar, Laubach and Becker2012, Reference Fall, Eichhubl, Bodnar, Laubach and Davis2015). Although free gas inclusions coexisting with the aqueous inclusions within the FIAs were not observed a free gas phase is likely in contact with the aqueous fluid, the reservoir being a gas producer (DeJarnett et al. Reference DeJarnett, Lim and Calogero2001). Under such conditions we infer that the aqueous phase is methane saturated and the homogenization temperatures represent true trapping temperatures of the fluid inclusions.
5. Discussion
5.a. Fracture porosity history
Our results show that open fractures can persist through protracted burial and uplift in foreland basins. Both Sets 1 and 2 retain fracture porosity despite quartz deposited within fractures both during and after fracture growth. The pattern of quartz cement deposits in bridges and intervening rind deposits closely matches cement accumulations expected if patterns are governed by the thermal history of the rock and interactions between fracture opening and quartz accumulation on different types of surface. Overall the rates are slow, but with relatively fast accumulation on non-euhedral fracture surfaces and much slower accumulation on faceted surfaces (Lander & Laubach, Reference Lander and Laubach2015).
Although fast-accumulating quartz locally keeps pace with fracture opening in the pillar-shaped quartz bridges due to renewal of fracture surfaces by crack-seal processes, elsewhere in fractures porosity destruction is extremely gradual. Where well-constrained burial histories allow these slow rates to be documented, porosity persistence can be many tens of millions of years even under deep burial conditions (Laubach & Diaz-Tushman, Reference Laubach and Diaz-Tushman2009; Becker et al. Reference Becker, Eichhubl, Laubach, Reed, Lander and Bodnar2010; Fall et al. Reference Fall, Eichhubl, Bodnar, Laubach and Davis2015: Hooker et al. Reference Hooker, Larson, Eakin, Laubach, Eichhubl, Fall and Marrett2015). Slow porosity diminution by quartz cementation accounts for extensive relict pore space in Frontier Formation Sets 1 and 2 at Table Rock. Similar quartz-lined porosity is evident in Frontier Formation fractures sampled from below 6200 m at Madden field in northern Wyoming (Laubach et al. Reference Laubach, Olson and Gale2004, fig. 8). This type of quartz deposit is ubiquitous in many formations in fractures formed in sandstones at depth (Laubach et al. Reference Laubach, Olson and Gale2004).
Diagenesis is evidently a key determinant of whether fractures are open. Fractures are open despite being subject to all-around compression and, in the case of Set 1, oriented at right angles to the current north–south maximum compressive stress (S Hmax) direction, confirming observations that open fractures in the subsurface need not be aligned with current S Hmax (Laubach, Olson & Gale, Reference Laubach, Olson and Gale2004; Wilkins et al. Reference Wilkins, Mount, Mahon, Perry and Koenig2014). Formation of Set 2 may also considerably pre-date the current stress field. Depending on when Set 2 and the current north–south S Hmax of the Cordilleran extensional province was established, fractures of both Sets 1 and 2 likely spent millions of years misaligned with the ambient stress field without closing.
How long did fracture porosity persist in the Frontier Formation at Table Rock? FIA and quartz cement patterns provide some evidence, but interpretations are sensitive to available burial/thermal histories which have considerable uncertainty. Thermal histories on the Wamsutter Arch are not well constrained. We made some plausible assumptions based on published burial histories and the overall tectonic evolution of the foreland province.
If our interpretation that the aqueous inclusions are gas saturated is correct, homogenization temperatures can be interpreted as trapping temperatures and no pressure corrections are needed. The onset and end of fracture development can be dated if the temperatures observed in the fluid inclusions are correlated with burial and thermal evolution models of the basin. We assume fluids were in thermal equilibrium with the rock, that is, they are not hydrothermal fluids. This assumption is consistent with the narrow salinity range for Sets 1 and 2 (Table 3).
Since no burial history was available for the specific well locations, we used or modified the burial history curves for the base of the Frontier Formation using curves from nearby wells: Adobe Town, Eagles Nest and Federal 31-1, Anderson Canyon and others (Fig. 1). Considering the stratigraphic (Rudolph, Crabaugh & Devlin, Reference Rudolph, Crabaugh and Devlin2015) and structural history (Dutton & Hamlin, Reference Dutton and Hamlin1992; Roberts, Lewan & Finn, Reference Roberts, Lewan and Finn2004) of the basin from the literature, two scenarios can be proposed for the burial history and therefore the timing of fracture formation (Fig. 16).
Burial curves and fracture timing. (a) Assumes burial curve shape similar to Adobe Town well. (b) Assumes burial curve shape similar to Bruff or Terra Anderson Canyon well. See Figure 1 for well locations. Relating FIA temperature sequences to time depends on a defensible assumption that quartz bridge accumulation primarily reflects burial-dependent thermal exposure rather than advection of heat or material (Lander & Laubach, Reference Lander and Laubach2015). Present-day Rock Island well conditions at Frontier Formation depths are 132°C and 10000 psi (DeJarnett et al. Reference DeJarnett, Lim and Calogero2001).
We note that inclusions in Set 1 gap deposits record an increasing and then decreasing temperature trend, whereas the younger Set 2 has decreasing temperatures for the youngest FIAs. In the first scenario (Fig. 16a) we consider the well-constrained burial history of the Adobe Town well, which is located south of Table Rock along regional strike in the foreland basin in the deep part of the Washakie Basin. Use of this history is not ideal in that the Frontier Formation at our well locations on the Wamsutter Arch are currently much shallower than the Frontier Formation at Adobe Town. But if we assume that the shape of the burial curves match and that the wells differ only in maximum burial, we can shift the Adobe Town burial curve to the maximum temperature observed in the Table Rock fluid inclusions. The temperature gradients associated with the Adobe Town burial curves represent present-day thermal gradients of c. 30°C km–1 (Roberts, Lewan & Finn, Reference Roberts, Lewan and Finn2004). If thermal gradients vary, inferred timing shifts along the curve.
Using these assumptions and correlating fracture Set 1 fluid inclusion temperatures with the burial history evolution curve suggests that fracture opening onset in Set 1 occurred at c. 31 Ma during burial, and ended at c. 4 Ma near the final stages of uplift and erosion. Onset of fracture opening during the Oligocene period is later than the widely accepted Palaeocene timing of folding near the Rock Springs uplift. In this scenario, the oldest fracture set post-dates Table Rock folding. Onset of fracture Set 2 started at a later stage in burial at c. 19 Ma, and ended similarly to Set 1 at c. 2 Ma during uplift (Fig. 16a). A variant on scenario 1 is to use the thermal history documented for the younger Almond Formation for wells near Table Rock field on the Wamsutter Arch (described in Tobin et al. Reference Tobin, McClain, Lieber, Ozkan, Banfield, Marchand and McRae2010; Fig. 1). This thermal history, extrapolated down to Frontier Formation depths, implies that maximum temperatures were reached earlier at c. 10 Ma.
In this first scenario the durations of fracture opening for Sets 1 and 2 imply these sets were concurrently active for a long time. Although quartz cement textures in the few intersecting fractures do not refute concurrent opening, the presence of bitumen after quartz in Set 1 (primarily) and the greater lateral cement thicknesses in Set 1 suggests that the timing for the two sets was not fully concurrent. Moreover, although Set 1 FIA sequences show evidence for smooth temperature increase and decrease, Set 2 does not show a clear increasing or decreasing trend among the hottest (oldest) FIAs. Set 2 records the highest burial temperatures of c. 160°C but no progressive temperature increase; the shape and length of the Set 2 curve (grey line in Fig. 16a) is therefore unconstrained. In addition, the cooler temperatures of c. 140°C in Set 2 are in gap deposits that cut across overlap deposits that post-date the hottest FIAs in Set 2. The pattern likely formed as a consequence of a period of quiescence and lateral quartz accumulation after the hottest Set 2 FIAs formed. During quiescence the bridges were at high temperatures for a substantial amount of time, but not experiencing widening. This quiescence was followed by a late and – in terms of widening amount – minor subsequent Set 2 opening. The shape of the Adobe Town burial curve does not agree with this bridge opening and FIA sequence. Although based on the best constrained burial curves, we rate scenario 1 to be unlikely.
In the second scenario (Fig. 16b), we used the same conclusions about the FIA sequence and shifted the burial curve to the maximum observed FIA temperatures and adopted the same thermal gradient. We made different assumptions about the probable shape of the burial curve, however. Many areas in the Wyoming foreland province experienced well-attested uplift relative to adjacent areas during Palaeocene–Eocene time as basement-involved deformation migrated east into the foreland during the Laramide Orogeny (DeCelles, Reference DeCelles2004; Roberts, Lewan & Finn, Reference Roberts, Lewan and Finn2004; Rudolph, Crabaugh & Devlin, Reference Rudolph, Crabaugh and Devlin2015). In Figure 16b we modified part of the burial curve to reflect such a punctuated uplift history. The burial patterns match the shapes of some wells on uplifts (Bruff, Terra Anderson Canyon; Fig. 1). This postulated history could reflect formation of the Rock Springs uplift or Wamsutter Arch, both of which have more structural relief than we show, or the Table Rock anticline and other nearby structures (e.g. Montgomery, Reference Montgomery1996) which have comparable relief.
With this burial history curve (or thermal history curve), correlation of fluid inclusion temperatures suggests that compared to scenario 1 Set 1 fractures formed earlier and were active over a much shorter time period during c. 44–38 Ma. Eocene movement is still late for Laramide deformation (80–55 Ma), but plausible for these easterly uplifts if deformation migrated inboard to the east (English & Johnston, Reference English and Johnston2004).
Onset of Set 2 also occurred earlier, and lasted longer from c. 32 to c. 2 Ma (Fig. 16b). The time of Set 2 activity post-dates Set 1 based on cross-cutting relations, but the duration of high-temperature Set 2 movement is indeterminate. The shorter overall duration is consistent with the small number of crack-seal opening increments compared, for example, to the several hundred found in the long-duration opening history documented by Becker et al. (Reference Becker, Eichhubl, Laubach, Reed, Lander and Bodnar2010) from a passive margin basin. Set 2 is not tightly constrained by FIAs or any published burial curve because the post-Palaeocene parts of all burial curves in the region are relatively flat (some are completely flat). These patterns likely reflect uncertainty in the amounts of removed overburden (Painter et al. Reference Painter, Carrapa, DeCelles, Gehrels and Thomson2014). Uncertainty partly reflects the challenges of unravelling non-marine Tertiary stratigraphy (Norsted, Carroll & Smith, Reference Norsted, Carroll, Smith, Smith and Carroll2015). Without more variation in the burial curve, FIA patterns correlated to the burial curve provide only a time range. Set 2 fractures could have formed over a shorter time than we show.
The gap in the timing of Set 2 fracturing, shown in Figure 16b from 38 to 32 Ma, marks the hiatus in fracture opening that we infer from the overlap patterns noted above. This hiatus honours the considerable difference in the relative length of the early and late Set 2 fluid inclusion trails (Figs 14, 15). Continuous fracture cementation during arrested fracture opening between c. 10 and 5 Ma resulted in the formation of thick lateral cement deposits (Figs 14, 15) which were fractured at a later stage during uplift. After a period of quiescence, Set 2 reopened in temperatures of c. 140°C, on a probable cooling trajectory. Intermittent Set 2 opening could reflect fault movement, followed after a pause by Set 2 reactivation in the modern stress field during uplift. This interpretation is compatible with a sequence of events where, after initial growth of Set 2, some Set 1 fractures reactivated as small-displacement oblique-slip faults and are associated with faults having microporous quartz-lined breccia and Set 3 fractures with kaolinite deposits that locally occlude fracture porosity. If changing fluid conditions and fluid mixing resulted from faulting and folding (e.g. Evans, Bebout & Brown, Reference Evans, Bebout and Brown2012), it was likely during formation of these late-stage structures since Sets 1 and 2 FIAs record narrow and overlapping salinity ranges (Table 3).
Our timing estimates do not match previous accounts of the timing, and therefore inferred origin, of fractures at Table Rock (e.g. Lorenz, Krystinik & Mroz, Reference Lorenz, Krystinik, Mroz, Goolsby and Robinson2005). On the other hand, fracture arrays are low-strain phenomena that do not require orogeny or folding to form (Olson, Laubach & Lander, Reference Olson, Laubach and Lander2009). Elsewhere in the Rocky Mountain region, fracture formation has been tied to various processes including gas generation (Fall et al. Reference Fall, Eichhubl, Bodnar, Laubach and Davis2015). Our results suggest that fracture models for the region need reassessment.
Given the uncertainties in several aspects of the burial and thermal histories, further curve matching would be speculative and, for the purpose of this paper, three points are notable. First, for a range of possible thermal histories, in the Frontier Formation temperatures corresponding to the highest-temperature FIAs we measured were reached at around Palaeocene–Eocene time. Despite copious quartz accumulation fracture porosity at Table Rock persisted for a long time (probably 30–45 Ma). Second, the fracture porosity lasted through an involved loading history. Fracture porosity in deeply buried sandstones is not easily destroyed by mechanical processes. Finally, although the burial histories in Figure 16 have uncertainties, histories like these are susceptible to incremental improvement that can be helped by using the numerous temperature sequences recorded by FIAs in fractures. Moreover, as shown in Lander & Laubach (Reference Lander and Laubach2015) quartz cement accumulation modelling can further constrain thermal histories beyond what is possible with FIAs alone.
Based on correlation of fluid-inclusion-based temperature histories with burial history, Sets 1 and 2 likely remained open and potentially weak mechanical discontinuities for millions of years, even at depths of >4000 m.
Evidence for a marked mechanical role for pre-existing fractures in fold development is increasingly apparent in several foreland settings (Bergbauer & Pollard, Reference Bergbauer and Pollard2004; Mynatt, Seyum & Pollard, Reference Mynatt, Seyum and Pollard2009; Amrouch et al. Reference Amrouch, Lacombe, Bellahsen, Daniel and Callot2010 a; Iñigo, Laubach & Hooker, Reference Iñigo, Laubach and Hooker2012; Ismat, Reference Ismat2012). Observations from Table Rock show that persistent open fractures that last for millions of years even at great depth are plausible weak mechanical discontinuities that could influence subsequent fold evolution.
Both Table Rock fracture sets appear to have a fairly narrow aperture size range. Fracture porosity is concentrated in sparse, wide fractures of c. 0.5 mm aperture (Fig. 4a). Total fracture porosity is therefore probably low (<1%), although the incomplete or damaged state of many of the fractures precludes accurate quantification. The probable continuity of porosity within fractures, however, means that laterally and temporally persistent fracture porosity could have a marked effect on permeability. Bridges do not block porosity continuity within fractures so their effect on flow in fractures is likely minimal, in agreement with flow tests on intact fractures from these wells (DeJarnett et al. Reference DeJarnett, Lim and Calogero2001). Narrow fracture tips and fracture–fracture interconnections are however prone to blockage by cements, so the effect of gradual quartz accumulation on permeability is likely to be manifest in decreasing fracture network connectivity and predictable reduction in permeability (Olson, Laubach & Lander, Reference Olson, Laubach and Lander2009). Considered by itself, Set 1 is therefore probably less well interconnected than the younger Set 2.
5.b. Implications for exploration and development
Based on open and sheared fractures in the Rock Island well and high flow rates and numerous unsheared fractures in a nearby well with low flow rates, Dickenson (Reference Dickinson1992), Lorenz, Billingsley & Evans (Reference Lorenz, Billingsley and Evans1998), Lorenz & Mroz (Reference Lorenz and Mroz1999), DeJarnett et al. (Reference DeJarnett, Lim and Calogero2001) and Lorenz, Krystinik & Mroz (Reference Lorenz, Krystinik, Mroz, Goolsby and Robinson2005) inferred that in these rocks shearing and reactivation enhance flow rates. We found that within individual, unsheared Set 1 fractures pore space continuity is excellent (c. 100% in the widest parts of fractures), although narrow parts of fractures and fracture tips are more fully cemented. Moreover, within the Rock Island and Sidewinder cores, slip is commonly associated with fracture porosity reduction rather than porosity enhancement, although in some reactivated Set 1 fractures the initial pore space from the opening-mode fracture is preserved locally where shear zones cut across earlier fractures at a low angle. In at least one example, shear has reduced porosity continuity within the fracture network. In cataclastic zones porosity reduction is by quartz accumulation in small width fractures. Fault rocks tend to be heavily quartz cemented although vuggy (i.e. poorly interconnected) porosity is present.
By sealing wide fractures, bitumen (primarily in Set 1), calcite and kaolinite are potential barriers to flow. In the Rock Island and Sidewinder cores these phases have patchy distribution in fractures (Fig. 8), but these minerals tend to vary considerably from place to place in the extent to which they fill fractures. Elsewhere in the Frontier Formation, for example, wide quartz-lined fractures are completely filled with calcite (Laubach, Reference Laubach2003). The possibility that the distribution of late calcite that seals some fractures is responsible for some well-to-well production variability remains to be investigated.
Larger faults, unsampled in core but documented in the wellbore (DeJarnett et al. Reference DeJarnett, Lim and Calogero2001), could be flow conduits, for example if they have laterally persistent open breccia zones. If thermal history governs quartz accumulation, late-stage quartz-rich fault rocks would be subject to less occlusion by quartz (Fisher & Knipe, Reference Fisher, Knipe, Jones, Fisher and Knipe1998; Fisher et al. Reference Fisher, Casey, Harris and Knipe2003). Sandstone fault cores that conduct fluids because quartz cement inefficiently fills large (vuggy) pores have been documented in some outcrop examples (Laubach et al. Reference Laubach, Eichhubl, Hargrove, Ellis and Hooker2014). On the other hand, in feldspar and lithic-rich rocks such as middle- to lower-shoreface Frontier sandstones, fault cores are more likely to form dense cataclastite (gouge).
Without additional shearing, opening-mode fractures can account for high flow rates if fractures are open and long (or well interconnected; Long & Witherspoon, Reference Long and Witherspoon1985). In core, both Set 1 and 2 contain extensive and laterally persistent porosity. Sets intersect at nearly right angles, so open connectivity could be high. The length distribution of these fractures (or interconnected networks) is a key determinant of the likely effect on permeability enhancement (Olson, Laubach & Lander, Reference Olson, Laubach and Lander2009). Unfortunately length distribution is not readily measureable using wellbore observations (but see Hoffman & Narr, Reference Hoffman and Narr2012). Nevertheless, contrary to some recent interpretations in the engineering literature (e.g. Stephenson & Coflin, Reference Stephenson and Coflin2015), opening-mode fracture arrays are by no means necessarily ‘small-scale’ features. Around the margins of the Green River Basin, systematic measurement of Frontier Formation fracture trace lengths shows extremely long (>500 m) fractures that otherwise resemble those found in core (Fig. 4). Production differences might reflect whether or not a long fracture was encountered. Frontier outcrop observations of long fractures are the basis for proposals that some reservoirs have highly elliptical well drainage patterns (Harstad et al. Reference Harstad, Teufel, Lorenz, Babcock, Close and Casey1997).
Evidence for long-term persistence of open regional fractures implies that enhanced fluid flow is unlikely to be restricted to the vicinity of folds and faults. Likewise, Set 1 fractures are at right angles to S Hmax. Large, open and weak fractures oriented at a high angle to the current maximum compressive stress could potentially influence engineering operations such as hydraulic fracturing.
6. Conclusions
Horizontal cores from Table Rock anticline show that quartz deposited during and after fracture formation records porosity creation and destruction. Fractures remain open and weak mechanical discontinuities for millions of years even at depths of >4000 m, despite being subject to compression and, in the case of Set 1, oriented at right angles to the current maximum compressive stress (S Hmax) direction. Depending on when the current north–south S Hmax of the Cordilleran extensional province was established, fractures of both Sets 1 and 2 likely spent millions of years at high angles to the ambient maximum compressive stress field without closing.
Sequencing quartz crack-seal cement deposits and the fluid inclusion assemblages they contain shows that Set 1 fluid inclusion (FIA) trapping temperatures increase progressively from 140°C through 160°C then decrease to c. 150°C. Set 2 opened at c. 150–160°C, probably near maximum burial. After a period of quiescence marked by thick lateral quartz deposits, Set 2 reopened at c. 140°C on a probable cooling trajectory. Relating FIA temperature sequences to time assumes that quartz bridge accumulation primarily reflects temperature-sensitive quartz accumulation (Lander & Laubach, Reference Lander and Laubach2015). Absolute time estimates are sensitive to the accuracy of thermal histories, which in this example have considerable uncertainty. Patterns are compatible with Set 1 opening during burial but possibly later than the main phase of Palaeocene (Laramide) deformation. Increasing then decreasing temperature of fracturing is compatible with Set 1 forming during subsidence then uplift of the Rock Springs uplift and/or Wamsutter Arch. Intermittent Set 2 movement could reflect local basement-involved fault movement, followed by a pause, then reactivation in the modern stress field during uplift.
For the mechanics of basement-involved fold–thrust belts, our results underline that early formed and pre-folding fractures can remain persistently open at depth and therefore need to be accounted for in mechanical and fluid-flow models of structural development. Our results also suggest that distribution of and controls on fracture porosity in the Greater Green River Basin need to be re-evaluated to better understand variable patterns of flow enhancement.
Acknowledgements
This study was funded by grant DE-FG02-03ER15430 from Chemical Sciences, Geosciences and Biosciences Division, Office of Basic Energy Sciences, Office of Science, US Department of Energy (SEL) and by the Fracture Research and Application Consortium. Field work was supported by GDL Foundation and Jackson School of Geosciences scholarships (Copley). Core acquisition in the 1990s was made possible by the US Department of Energy and Union Pacific Resources. We are grateful to Anadarko Petroleum for permission to describe and sample the core. Seminal research on these cores was conducted by L. Krystinik, B. DeJarnett, F. Lim and J. Lorenz. We thank B. DeJarnett for access to DOE project files and reports. These valuable studies are now hard to access and are only partly available online; they deserve to be more widely known. J.N. Hooker and S. Elliott contributed to core description and SEM imaging, S.P. Dutton provided compilations of compositional data and J. E. Olson provided access for mechanical property testing. We are grateful to Olivier Lacombe for the invitation to participate in this volume. We appreciate comments on an earlier version of this work by B. DeJarnett, E. Potter and J.F.W. Gale and reviews by Wayne Narr and Ron Nelson. Publication authorized by the Director, Bureau of Economic Geology.


