

INTRODUCTION
About 110 000 cases of Chlamydia trachomatis (CT) were diagnosed in women in England in 2009 [1]. However, CT infection is often asymptomatic and undiagnosed, which is one of the key motivating factors for screening. Dynamic models of disease transmission are commonly used to assess the potential impact of screening and its cost-effectiveness [Reference Adams, Turner and Edmunds2–Reference Turner4], and these models need to be consistent with observed information on the age-specific incidence of infection.
One study that provides estimates of CT incidence in England has been published [Reference LaMontagne5]. Women aged 16–24 years were screened for Chlamydia in General Practitioner (GP), Family Planning (FP), and Sexually Transmitted Disease clinic (STD) settings in two areas in England, and were followed prospectively at 6-month intervals for 6–18 months to assess CT infection and re-infection. However, this study is restricted to clinic patients and it does not address incidence in the English general population. In addition, due to the interval-censored observations in the study, it is possible for women to have both acquired and cleared the infection during the periods between observations, leading to under-estimation of incidence. This was not accounted for in the original paper [Reference LaMontagne5].
This paper sets out to produce a set of age-group-specific estimates of CT incidence in the general population of women in England based on all available evidence. There are several novel aspects in our approach. First, we re-analysed the data from the LaMontagne et al. [Reference LaMontagne5] incidence study accounting for CT clearance, informing clearance rate from a recent synthesis of the duration of asymptomatic infection. Second, we use information on setting-specific prevalence [Reference Adams6] of CT in the UK, which included estimates in the general population as well as in GP, FP, and STD settings, to ‘recalibrate’ the estimated incidence rates from LaMontagne to the general population setting. Third, we exploit the well known epidemiological relationship: prevalence = incidence × duration to generate an independent set of incidence estimates based on prevalence and duration data. This provides a degree of independent validation for the estimates obtained directly from the incidence study. Finally, we produce a coherent set of estimates of age-specific incidence and prevalence, and duration in women in the general population that both, conform to the appropriate epidemiological relationships, and are based on all the available data. This is an application of multi-parameter evidence synthesis [Reference Ades and Sutton7, Reference Goubar8] to Chlamydia epidemiology.
METHODS
Multi-parameter evidence synthesis
Multi-parameter evidence synthesis (MPES) is a method for estimating models by statistically combining all the available information on model parameters and functions of parameters [Reference Ades and Sutton7, Reference Goubar8]. The uncertainty in the data inputs is taken into account and propagated through the model. In MPES parameters are defined as basic or functional. The model is fully specified by the basic parameters [Reference Eddy, Hasselblad and Shachter9]. All functional parameters can be written as functions of these basic parameters. They are important either because some data informs a functional parameter, or because the distribution and summary statistics for the functional parameter are of interest.
Data are available on incidence, prevalence, and duration, and also on risk factors. Because there is information on more functions of parameters than there are parameters, it is possible to assess the consistency of the evidence. A schematic directed acyclic graph (DAG) (Fig. 1) shows the relationships between the sources of data and the model parameters, and spells out their mathematical form. The data sources are shown in clear rectangles, and informative priors in light grey rectangles. Basic parameters are shown in shaded ellipses, and functional parameters in clear ellipses. All basic parameters that do not have an arrow pointing to them from an informative prior have uninformative priors which are not shown on the diagram. We estimated the models using the Bayesian Markov Chain Monte Carlo (MCMC) package WinBUGS [Reference Lunn10]. With WinBUGS software the user needs to specify the prior distributions on the basic parameters, to specify the likelihood for each of the data observations, and specify the mathematical relations, as shown in the figure, that link them. Full details of the statistical model are given in Appendix 1.
Directed acyclic graph (DAG) of the evidence network. The data sources are shown in clear rectangles, and informative priors in light grey rectangles. Basic parameters are shown in shaded ellipses, and functional parameters in clear ellipses. The arrows show the direction of flow. Light arrows point to data, heavy arrows indicate functional relationships between parameters, which are set out as equations. Data may be available to provide evidence on either basic or functional parameters. All basic parameters that do not have an arrow pointing to them from an informative prior have uninformative priors which are not shown on the diagram. The ‘basic’ parameters are: λ
1,1,1 the infection rate in age group 1, setting 1; γ
a the hazard ratio for infection in age group a relative to group 1 (age 16–17 years); ρ
s
the hazard ratio for infection in setting s relative to setting 1 (GP setting); η
s the setting-specific reinfection:infection rate ratio; p
a,GP the proportion of patients at recruitment in the GP attenders in age group a in the LaMontagne study that were in the re-infection group reweighted to account for differential recruitment; ΔA and ΔS, the durations of asymptomatic and symptomatic infection; φ the proportion of incident infections in which symptoms develop. Functional parameters are: λ
A, λ
S clearance rates of asymptomatic and symptomatic infection; λ
a,s,i incidence in age a, setting s, for infections (i = 1) and re-infections (i = 2); κ (t)a,s,i proportion infected in that group after t years (for the LaMontagne study t = 0·5); $\tilde \lambda\hskip0.5pt_{{\rm a},{\rm pop}}^{{\rm FOI}} $
the force of infection and
$\tilde \lambda\hskip0.5pt_{{\rm a},{\rm pop}}^{{\rm FOI}} $
the force of infection and $\tilde \lambda\hskip0.5pt _{{\rm a},{\rm pop}}^{{\rm INC}} $
the incidence rate in the general population; Δ the average duration of infection. π
a,pop, the general population prevalence at age a is either a basic or functional parameter depending on whether separate incidence estimates (methods A and B are performed in parallel) or the full synthesis model is being used. The black bar indicates where the network can be cut to obtain separate estimates of incidence. (Further explanation is given in the text and the statistical Appendix).
$\tilde \lambda\hskip0.5pt _{{\rm a},{\rm pop}}^{{\rm INC}} $
the incidence rate in the general population; Δ the average duration of infection. π
a,pop, the general population prevalence at age a is either a basic or functional parameter depending on whether separate incidence estimates (methods A and B are performed in parallel) or the full synthesis model is being used. The black bar indicates where the network can be cut to obtain separate estimates of incidence. (Further explanation is given in the text and the statistical Appendix).

Models and data sources
An attempt was made to identify data sources on incidence and prevalence of CT in the UK. A formal systematic review was not conducted, but papers were identified from recent reviews and synthesis exercises. Only one published report on incidence was identified [Reference LaMontagne5], and a recent synthesis of UK CT prevalence data was also used [Reference Adams6]. Information on CT duration was based on a recent synthesis [Reference Price11] described below. The information in Tables 1–4 represents all the information incorporated in the synthesis. Below we set out the assumptions that were made about the processes that generated the data, and the main features of the synthesis model. We begin by discussing the duration of CT infection which is required for all subsequent analyses.
Data on duration (years) of Chlamydia trachomatis infection

CrI, Credible interval.
Data derived from tables 2 and 4 from LaMontagne et al. [Reference LaMontagne5] on infection and re-infection rates per 100 women years: numerators r and denominators n

GP, General practitioner; FP, family planning; STD, sexually transmitted disease clinic.
* n is estimated as the total number of 6-month follow-up periods (events were assumed to happen halfway between observations when the rates were estimated in LaMontagne). This has been calculated from the reported rates and numbers of events.
Estimated prevalence of Chlamydia trachomatis in females in the general population reported in table 4 in Adams et al. [Reference Adams6]

CI, Confidence interval.
Reported adjusted odds ratios for the effect of setting on Chlamydia prevalence in females in the UK, from table 3 in Adams et al. [Reference Adams6]

OR, Odds ratio; CI, confidence interval; GP, general practitioner; FP, family planning; STD, sexually transmitted disease clinic.
Duration of CT infection
The mean duration of infection, Δ, can be expressed as a weighted average of the length of asymptomatic (untreated) infection ΔA and symptomatic (treated) infection ΔS,
 $${\rm \Delta} = {\rm \Delta} \varphi + {\rm \Delta} _{\rm A}. (1 - \varphi ),$$
with φ being the proportion of incident infections in which symptoms develop. In the Discussion section we show that results would have been similar if we considered durations of treated and untreated infections instead.
For the duration of asymptomatic CT infections, ΔA, we use an estimate of 1·36 (95% CrI 1·11–1·62) years, based on a previous evidence synthesis of studies on CT duration in asymptomatic women [Reference Price11]. This was a synthesis of nine studies identified from recent reviews [Reference Korenromp12–Reference Golden14], four that recruited asymptomatic infected women in STD clinic settings, and five studies based on population screening. Evidence was presented that these approximately represented incident and prevalent infections, respectively. The authors fitted mixtures of exponential models to these data. The estimates used here (Table 1) were based on a model that assumed CT infections clear at a constant rate.
Studies of CT duration have the inherent limitation that patients may clear infection and be re-infected during the follow-up period. For this reason we consider same-partner re-infections, which microbiological evidence suggest comprise the great majority of re-infections [Reference Molano15], to be part of a continuous episode.
The proportion of CT infections, φ, in which symptoms develop can be estimated from studies where asymptomatic women within a few days of exposure are followed without treatment to determine if symptoms develop, and we have interpreted studies of asymptomatic women attending for STD testing as studies of this type. This interpretation is supported by the synthesis of studies on CT duration described above [Reference Price11]. We identified only one such study reporting the proportion of incident CT in which symptoms develop [Reference Price11]. This found that 26 out of a total of 115 women developed symptoms, estimating φ at 23% (95% CI 16–31) [Reference Geisler16].
Duration of symptomatic infection, ΔS, is defined as the time between the point at which the patient becomes infected, and the point at which the infection is diagnosed, or the patient is empirically treated and the infection is cleared. This could be derived from information on the incubation period of CT and studies of time taken to seek healthcare in women subsequently diagnosed with CT. A recent literature search [Reference Korenromp12] found no data on incubation period, and although there were studies of time to seek healthcare in women with genital symptoms, specific information on those diagnosed with CT was not found. We have placed an informative prior on the time from infection to diagnosis assuming it is uniformly distributed between 4 and 8 weeks, and that once diagnosed a woman would not participate in a prevalence survey. We assess sensitivity to this by fitting a model where the duration of symptomatic infection varies uniformly from 3 to 12 weeks.
CT incidence data
The only study of CT incidence in England is LaMontagne et al. [Reference LaMontagne5]. Women aged 16–24 years were screened for Chlamydia in GP, FP, and STD settings in two areas in England in 2003–2004, and were followed prospectively at 6-month intervals for 6–18 months to assess CT infection and re-infection. A ligase chain reaction (LCR) test was used, for which we assumed 100% sensitivity and specificity. Women found positive were treated. Table 2 gives the proportions of 6-month-long observations in which CT-negative women were CT positive on follow-up. These are divided into ‘infections’ and ‘re-infections’: the latter being infections observed in women who were CT positive on recruitment or were infected during the follow-up period. The data are reported for age groups (a = 1, 16–17 years; a = 2, 18–20 years; a = 3, 21–24 years).
Regression model to estimate infection and re-infection rates by age and setting
We model the infection rates as a function of a baseline infection rate λ 1,1,1 multiplied by the between setting hazard ratios ρ s and the between age-group hazard ratios γ a. The age- and setting-specific re-infection rates λ a,s,2 equal the respective infection rate multiplied by a setting-specific re-infection hazard ratio η s [equation (2)]. Other regression models are considered in Appendix 2:
 $$\lambda _{{\rm a},{\rm s},1} = \gamma _{\rm a}\,\rho _{\rm s} \lambda _{111} \quad {\rm and}\quad {\rm} \lambda _{{\rm a},{\rm s},2} = \eta _{\rm s}\,\lambda _{{\rm a},{\rm s},1}, $$
The infection rates λ a,s,1 in equation (2) are informed by the data in Table 2, which shows the number of initially uninfected women in each age and setting who were found to be infected after a 6-month follow-up period. However the mathematical relationship between the infection rates in each group and the proportions infected κ (t)a,s,i at the end of a period of time length t is complex. The formula shown in Figure 1 allows for the fact that in the LaMontagne data it is possible for a woman to clear infection spontaneously or through treatment, and then re-acquire infection within the 6-month follow-up. It is necessary therefore to take account of the clearance rates of symptomatic and asymptomatic infection, and the proportion of incident infections that become symptomatic (see Appendix 1).
Estimation of force of infection (FOI)
The infection and re-infection rates can be used to estimate the mean FOI, $\tilde \lambda\hskip0.5pt _{{\rm a},{\rm s}}^{{\rm FOI}} $
, in the CT-negative women in each setting and age group using equation (3):
$\tilde \lambda\hskip0.5pt _{{\rm a},{\rm s}}^{{\rm FOI}} $
, in the CT-negative women in each setting and age group using equation (3):
 $$\tilde \lambda\hskip0.5pt_{{\rm a},{\rm s}}^{{\rm FOI}} = (1 - p_{{\rm a},{\rm s}} ).\lambda _{{\rm a},{\rm s},1} + p_{{\rm a},{\rm s}}. \lambda _{{\rm a},{\rm s},2}, $$
where the weights p a,s are given by the prevalence of CT in each setting observed in the LaMontagne study (Appendix 1). However, as the LaMontagne study only samples from GP, STD, and FP settings it is necessary to turn to a third source of evidence, CT prevalence, to map these estimates of FOI to estimates for the general population.
CT prevalence
CT prevalence varies by age and setting. Table 3 shows estimates of CT prevalence by age in the general population from a logistic regression of UK prevalence studies [Reference Adams6] identified by a systematic review in 2004. These data inform the absolute prevalence in 18- to 19-year-olds, π 1,pop (the youngest age group in the study), and the relative risk RRa of infection in the generic age group a relative to age 18–19 years so that:
 $$\pi _{{\rm a},{\rm pop}} = \pi _{\rm 1,pop}. {\rm RR}_{\rm a}. $$
Table 4 shows prevalence odds ratios for the different settings FP, STD clinics, and general population settings (pop), relative to the General Practice (GP) setting, from the same study: these are used to inform setting-specific relative risks (RRs). The interpretation of odds ratios as relative risks is an approximation that is justified by the rarity of the disease [Reference Rothman, Greenland and Lash17]. Other prevalence data have been collected subsequently [Reference Macleod18, Reference Oakeshott19], but have not been incorporated due to doubts about the national representativeness.
In order to use these data to map our estimates of FOI to the general population we make the assumption that the between-setting and between age-group relative risks in the prevalence data directly inform the hazard ratios (γ a and ρ s) in the incidence model described above. For a fixed duration, prevalence ratios must be equal to incidence rate ratios, so the assumption is that ratios of incidence are equivalent to ratios of FOI, and of infection. We consider this assumption further in Appendix 2.
A first estimate of CT incidence in England (method A)
We use the odds ratio between the general population setting and the GP setting, which informs the parameter ρ
pop to map the FOI in the GP setting to provide an estimate of the FOI in women in the general population $\tilde \lambda\hskip0.5pt _{{\rm a},{\rm pop}}^{{\rm FOI}} $
:
$\tilde \lambda\hskip0.5pt _{{\rm a},{\rm pop}}^{{\rm FOI}} $
:
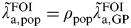 $$\tilde \lambda\hskip0.5pt _{{\rm a},{\rm pop}}^{{\rm FOI}} = \rho _{{\rm pop}} \tilde \lambda\hskip0.5pt _{{\rm a},{\rm GP}}^{{\rm FOI}} $$
Estimates of FOI are of interest in themselves. However, we can easily calculate the annual population incidence rate $\tilde \lambda\hskip0.5pt _{{\rm a},{\rm pop}}^{{\rm INC1}} $
(years−1) for age groups 16–17, 18–20, and 21–24 years as a function of FOI (years−1) and duration using equation (5):
$\tilde \lambda\hskip0.5pt _{{\rm a},{\rm pop}}^{{\rm INC1}} $
(years−1) for age groups 16–17, 18–20, and 21–24 years as a function of FOI (years−1) and duration using equation (5):
 $$\tilde \lambda\hskip0.5pt _{{\rm a},{\rm pop}}^{{\rm INC}1} = \displaystyle{{\tilde \lambda\hskip0.5pt _{{\rm a},{\rm pop}}^{{\rm FOI}}} \over {1 - \tilde \lambda\hskip0.5pt _{{\rm a},{\rm pop}}^{{\rm FOI}} {\rm \Delta}}}. $$
A second estimate of CT incidence in England (method B)
A second estimate of the annual population incidence (years−1) can be obtained using data on duration and data on prevalence using the relationship: incidence = prevalence/duration, so that:
 $$\tilde \lambda\hskip0.5pt _{{\rm a},{\rm pop}}^{{\rm INC}2} = \displaystyle{{\pi _{{\rm a},{\rm pop}}} \over {\rm \Delta}}, $$
Where duration is estimated as previously described and prevalence π
a,pop is informed directly by the data in Table 1 so $\tilde \lambda\hskip0.5pt _{{\rm a},{\rm pop}}^{{\rm INC}2} $
is estimated for the groups 18–19, 20–24, 25–29, and 30–44 years.
$\tilde \lambda\hskip0.5pt _{{\rm a},{\rm pop}}^{{\rm INC}2} $
is estimated for the groups 18–19, 20–24, 25–29, and 30–44 years.
Full synthesis model
We can combine both of the above analyses in a single joint synthesis using the relationship:
 $$\pi _{{\rm a},{\rm pop}} = \tilde \lambda\hskip0.5pt _{{\rm a},{\rm pop}}^{{\rm INC}}. {\rm \Delta}, {\rm} $$
where $\tilde \lambda\hskip0.5pt _{{\rm a},{\rm pop}}^{{\rm INC}} $
is informed as described in method A, and the parameters π
a,pop and Δ are informed as described in method B. This is shown in the DAG in Figure 1. This single joint analysis provides estimates of population incidence for age groups 16–17, 18–20, 21–24, 25–29, and 30–44 years. The only age groups for which incidence is estimated in both methods A and B are 18–20, and 21–24 years. However, estimates for the other age groups are also expected to change. The full synthesis model provides estimates for all parameters based on the entire data ensemble. So, for example, when our knowledge of the regression parameters described in method A are updated by the data described in method B, estimates of the annual population incidence rate in 16- to 17-year-olds may change.
$\tilde \lambda\hskip0.5pt _{{\rm a},{\rm pop}}^{{\rm INC}} $
is informed as described in method A, and the parameters π
a,pop and Δ are informed as described in method B. This is shown in the DAG in Figure 1. This single joint analysis provides estimates of population incidence for age groups 16–17, 18–20, 21–24, 25–29, and 30–44 years. The only age groups for which incidence is estimated in both methods A and B are 18–20, and 21–24 years. However, estimates for the other age groups are also expected to change. The full synthesis model provides estimates for all parameters based on the entire data ensemble. So, for example, when our knowledge of the regression parameters described in method A are updated by the data described in method B, estimates of the annual population incidence rate in 16- to 17-year-olds may change.
Note that the DAG in Figure 1 also describes methods A and B above. We remove the constraint that prevalence = incidence × duration shown on the DAG under the heavy black bar replacing it with equation (6) above, and place uninformative priors on π a,pop. This single unconstrained model then produces estimates from both methods A and B in parallel.
Statistical estimation and model critique
The full specification of the model is set out in Appendix1. Estimation was pereformed using a Bayesian approach, where the posterior distribution was sampled through MCMC implemented in the WinBUGS package version 1.4.3 [Reference Lunn10]. The Bayesian approach was taken because of its flexibility in pooling information on complex functions of parameters: we would expect similar results from a frequentist approach. MCMC estimation is performed by drawing thousands of samples from the joint posterior distribution. The first 50 000 iterations were discarded: this was the ‘burn-in’ period to ensure that the distributions had converged to the posterior. The Brooks–Gelman–Rubin statistic [Reference Brooks and Gelman20] demonstrated convergence of all parameters to their posterior distribution after at most 25 000 samples. The results reported below are summary means and credible intervals of the marginal distributions from this joint posterior based on 200 000 samples from each of two chains.
To assess goodness of fit, we used the posterior mean residual deviance, which should approximate to the number of data points under the assumption that the model is true [Reference Dempster21, Reference Spiegelhalter22]. We compared the goodness of fit of the combined synthesis model and the model with separate incidence estimates: this provides a direct assessment of the statistical assumptions. A graphical comparison of the separate incidence estimates is also presented. We assessed the validity of some more specific statistical assumptions in Appendix2. Unless otherwise stated vague priors are employed throughout, so that results are dominated by the data. The WinBUGS code is available along with the datasets as Supplementary online material. It has been annotated to help readers to understand the model.
RESULTS
Table 5 shows the posterior estimates of the annual population incidence from method A (column 2), method B (column 3), and the full synthesis model (column 4). Estimates from method A are available for the 16–17, 18–19, and 20–24 years age groups, method B provides estimates for the 18–19, 20–24, 25–29, and 30–44 years age groups, and estimates for all age groups are available from the full synthesis model. Estimates from the full synthesis model are around a factor of 1·5 lower than those obtained from method A, but only marginally higher than those obtained from method B. This is because the uncertainty in the incidence information from the LaMontagne data is much greater than in the combined duration and prevalence information. This effect is shown graphically in Figure 2, which compares the estimates of incidence in the 18–19 and 20–24 years age groups, and also shows the combined estimate incorporating all data sources. Results from the full synthesis model for all five age groups are also given in Figure 3.
Marginal posterior distributions of incidence parameters, comparing results based on the information in incidence study (LaMontagne), with results based on information in prevalence and duration studies (alone), and with results based on pooling all sources of information (a) age group 18–19 years, (b) age group 18–20 years.

Posterior distribution of incidence, by age range, based on all available information.

Population Chlamydia trachomatis incidence rate (years−1) in women by age estimated using each method

n.a., Not available.
Results given are mean (95% credible interval).
Table 6 shows the estimates of the basic parameters in the model estimated when the constraint that prevalence = incidence × duration is excluded (column 2) and included (column 3) in the model, representing respectively, methods A and B being performed simultaneously in parallel, and the full synthesis model. It shows that for most parameters: duration, proportion symptomatic, re-infection:infection rate ratios, age- and setting-specific risk ratios, and prevalence parameters, the synthesis has not contributed much additional information over and above the ‘direct’ data already available. However, the general population-to-GP relative risk is lowered by a factor of about 1·35 compared to method A and the 95% credible intervals are about half the width.
Parameter estimates obtained from the separate models fitted using methods A and B in parallel (column 2), and from the full synthesis model (column 3)

CrI, Credible interval; CT, Chlamydia trachomatis; n.a., not available; GP, general practitioner; FP, family planning; STD, sexually transmitted disease.
Model fit statistics for each dataset from the separate models fitted using methods A and B in parallel and the full synthesis model

Our separate models of incidence in women aged 16–24 years included nine parameters and had a residual deviance of 18·4 for a dataset with 21 data points (Tables 2 and 3) representing a good fit (Table 7). When these data are combined with the prevalence information, residual deviance increases only marginally (19·5), indicating a lack of conflict between the different sources of information on incidence. Prevalence and duration data also fitted equally well. Results (not shown) with a wider uniform prior distribution on the duration of symptomatic infection, 3–12 weeks rather than 4–8 weeks, were almost identical (<1% multiplicative change). We therefore recommend using results from the full synthesis model that uses all of the data, giving an estimated incidence rate in females aged 16–24 years, the population targeted by the National Chlamydia Screening Programme, of 0·05 per year (95% CrI 0·035–0·071), and in females aged 16–44 years 0·021 per year (95% CrI 0·015–0·028).
DISCUSSION
While CT prevalence in the general UK population has been studied [Reference Adams6], incidence estimates have only been produced in clinic patients [Reference LaMontagne5]. We used data on ratios between clinic settings and the general population in prevalence to ‘recalibrate’ the incidence data to a lower value appropriate to a general population setting. We were able to show that three independent and separate sets of data on prevalence, incidence and duration were all consistent with each other, under a model which captured the logical relationships between these parameters. The possibility of clearance of infection and re-infection during the follow-up period was also taken into account: the effect of this is to raise incidence estimates above the levels that are directly observed. The estimate based on the recalibrated incidence study was found to be compatible with an estimate based on combining prevalence and duration information.
A certain degree of simplification is involved. The incidence data was collected in 2003–2004, 2–3 years later than the NATSAL study [Reference Fenton23], which contributes all the general population prevalence information to the estimates in the Adams study [Reference Adams6], and in a period before intensive screening was taking place. We have assumed that incidence is unlikely to have changed greatly between these dates, and that our estimates are therefore relevant to the years 2001–2005.
The application of Bayesian evidence synthesis methods to CT epidemiology can shed light on the value of different study designs and the relationships between them. In addition, the ability to confirm, for example, that setting- and age-specific risk ratios in an incidence study are compatible with odds ratios in prevalence studies, makes it a valuable approach to epidemiology. However, as with any evidence synthesis method, conclusions are limited by the quality of the original data and the assumptions made in interpreting them. The CT prevalence information in NATSAL was based on self-testing in a structured population sample and is vulnerable to response biases, although these have been extensively analysed elsewhere [Reference McCadden24]. The incidence data were collected in two English areas, which were metropolitan and urban. The extent to which these data can be assumed to be nationally representative is not known. Finally, the estimates of duration of asymptomatic CT duration, 1·36 (95% CrI 1·11–1·62) years, were based on an earlier synthesis of studies with different designs [Reference Price11]. The estimate assumes a constant clearance rate, and the model did not allow for re-infection. However, a model including fast and slow clearers provided no improvement in residual deviance, and the bias introduced by not accounting for CT re-infection in duration studies is far lower than the bias introduced by not accounting for clearance in studies of incidence. These findings are supported by a recent analysis by Althaus et al. [Reference Althaus25] who fitted a reversible model to data extracted using the Kaplan–Meier curve from the Molano et al. study [Reference Molano15]. They showed that a single rate model provided a good fit and found that allowing for re-infection had almost no impact on estimates of duration. A further key assumption in [Reference Price11] was that clinic-based studies on asymptomatic women could effectively be interpreted as studies of incident infection, while studies of population screening were picking up prevalent infection. The authors cited several external evidence sources supporting this assumption.
Additional validation of our estimates and of our overall approach is available by multiplying our estimated incidence rate by the number of women aged 16–24 years in England based on population census projections for 2002 [26]. This predicts a total of 137 100 (95% credible interval 95 520–192 500) infections. This can be compared to the 31 510 and 34 660 women aged 16–24 years who were treated for CT in STD clinics in 2002 and 20 03 respectively [1]. The ratios of numbers treated to predicted total infections in women aged 16–24 are 24% (95% CrI 16–33) for 2002 and 26% (95% CrI 18–36) for 2003. This accords closely with the proportion of infections in which symptoms develop estimated from the model, and the Geisler et al. [Reference Geisler16] findings. Therefore, had we partitioned women as treated or untreated when estimating the mean duration as is often done in dynamic models and used recursive equations to estimate the proportion treated from routine data, we would have obtained almost identical results.
Although estimates of CT incidence and prevalence in England may be of limited interest elsewhere, the study does have wider implications. First, the fact that incidence, prevalence and duration evidence is internally consistent provides a degree of independent validation of our estimates of all three parameters. Second, it indicates that estimates of CT prevalence or incidence in other countries can each be generated from the other, using our estimates of duration. Alternatively, where information is available on both incidence and prevalence, a similar exercise could be carried out to provide a further validation of our results and the models on which they are based.
The study raises the question: what is the best way to obtain accurate population-based estimates of CT incidence? Further direct study of infection and re-infection rates in opportunistically recruited women appears to be worthwhile. However, as well as taking account of clearance and re-infection during follow-up, it will probably always be necessary to ‘recalibrate’ setting-specific estimates to the general population. Studies of either prevalence or incidence based on structured general population surveys are, therefore, essential.
Our analysis of incidence, prevalence and duration has relied on an essentially static epidemiological model. The alternative would be to assess the consistency of a somewhat wider evidence base within a dynamic modelling context. For example, a dynamic model could be estimated from the same sources of data (incidence, prevalence, duration of symptomatic and asymptomatic infection, proportion symptomatic), but also incorporating information on contact rates and transmission rates per contact. Dynamic modelling is not normally conceived as a synthesis exercise: more often, incidence is seen as an ‘output’ of a dynamic model. However, the feasibility of an evidence synthesis and consistency checking approach to dynamic models has already been established [Reference Presanis27]. This kind of approach would lead to a further extension to incorporate information on incidence, prevalence and duration of CT incidence in men.
APPENDIX 1. Statistical methods
The schematic influence diagram (Fig. 1) sets out all the relationships between model parameters and data in mathematical terms. Basic parameter nodes are shown as shaded ellipses and functional parameter nodes as clear ellipses. Two of the basic parameters are given informative prior distributions shown in shaded rectangles with arrows pointing from the rectangle and to the parameter. The remaining ‘basic’ parameters are given vague prior distributions which are not shown on the figure. The ‘functional’, parameters are defined in terms of basic parameters, and the definitions are shown in equations. Data which are entered as a likelihood are shown in clear rectangles, with arrows pointing from the parameter to the data. A full list of basic and functional parameters along with brief descriptions is provided in Table A1.
Most of the functional relationships have been spelled out in the methods section as equations (1)–(7), or in the DAG. Some expressions require further explanation.
The expression:
 $$\kappa (t) = 1 - \displaystyle{{\lambda ^{\rm C} + \lambda. {\rm e}^{ - (\lambda + \lambda ^{\rm C} ).t}} \over {\lambda + \lambda ^{\rm C}}} {\rm,} $$
relates the proportion of infected individuals κ(t), who were initially uninfected, observed after time t, to an incidence rate λ and a clearance rate λ C . This can be derived from Kolmogorov's forward equations [Reference Grimmett and Stirzaker28, Reference Welton and Ades29]. In Figure 1, the more complex relationship represents a weighted average of two clearance rates: one being in symptomatic and the other in asymptomatic women. The proportion of infections that develop symptoms is the weight, and the clearance rates in each group are the reciprocals of the mean duration of symptomatic and asymptomatic infections.
Strictly speaking, Figure 1 sets out the relationships as they would be if the incidence and prevalence data were available on the exact same age groups. As the age groupings in the studies were slightly different, we used census information on the English female population sizes from 2002 for each year of ages 16–44 years to reweight the parameters. Readers can see what was done from the WinBUGS code provided as Supplementary material, which is annotated to make all these adjustments clear.
Prior distributions
Vague normal priors were placed on the log incidence rate in the LaMontagne study in age group 1 and GP setting: ln(λ 1,GP,1) ∼ N(0,1002), and also on the rate ratios ρ s for setting s relative to the GP setting, and γ a for age group a relative to the 16–17 years age group, and for the ratios η s in re-infection rate to infection rate in setting s: ρ a, γ s, η s ∼ N(0,1002).
Priors for the duration of infection and proportion symptomatic were as follows: proportion symptomatic φ∼beta (1,1); ΔA∼n (0,1002), ΔS∼uniform (0·0767–0·1533), i.e. uniform between 4 and 8 weeks. Information on the proportion of patients at recruitment in the GP setting, p a,GP in the LaMontagne study who were in the re-infection group reweighted to account for disproportionate inclusion into the study of initially CT positive women were introduced via informative beta priors, derived from table 1 in LaMontagne et al. [Reference LaMontagne5]. For example, in women aged 16–19 years who were tested at GP clinics, 663 + 137 = 800 were CT negative, and 45 + 48 were CT positive. So the correct weights for the infection and re-infection groups are 800/893, and 93/893, respectively. We repeated the same calculation for women aged 20–24 years, and we assume the weights are constant within these two age groups. Although testing and treatment every 6 months interferes with the natural history, CT-positive women are subsequently placed in the re-infection group so this does not bias the results.
Information on two parameters, ΔS and the proportion of women subject to the re-infections rate, p a,GP, was introduced via informative priors rather than through the data likelihood. This prevents these ‘data’ from contributing directly to the global goodness-of-fit assessment. The decision to treat these inputs differently was because the source of evidence on the first was expert clinical knowledge quite unrelated to the other sources of data in the synthesis, while the second was local to the LaMontagne study. We were therefore interested less in the ‘goodness of fit’ of this information, and more in the goodness of fit of the other data, conditional on the priors we assigned to these parameters. In addition, we applied the ‘cut function’ to both these parameters, a facility within the WinBUGS programming language that prevents information from the rest of the evidence network from ‘updating’ priors [Reference Lunn10] so in these cases the posterior for the parameter is the same as the informative prior.
Data likelihoods
The age-specific prevalence data D a,pop in Table 3 was given a normal likelihood on the logit scale: logit(D a,pop)∼N(π a,pop,V a,pop), with the variance calculated from the 95% CIs. The setting-specific odds ratios (ORs) in Table 4 were handled in the same way: logit(ORs)∼N(γ s,,V s). The data on duration of asymptomatic infection (Table 1) was entered as a normal likelihood: DurA∼N(ΔA,V A).
The numbers infected in Table 3 (r) are considered as having a binomial likelihood, with parameters κ a,s,i, and denominators also shown in the table so that r a,s,i ∼B (κ a,s,i (0·5), n a,s,i). The number of symptomatic infections (r = 26), reported by Geisler et al. [Reference Oakeshott19] is binomially distributed with parameter φ and denominator 115.
The WinBUGS code, available as Supplementary material, consists of the priors and likelihoods as described above, and the functional relationships described exactly as in Figure 1 and in the text.
APPENDIX 2: Assessment of statistical modelling assumptions
Regression analysis of the LaMontagne data
We fit the following nine regression models to the 18 data points from LaMontagne shown in Table 2:
- Model 1
-
log(λ a,s,i) = α+γ a+ρ s+η i+γρ as+γη ai+ρη si+γρη asi,
- Model 2
-
log(λ a,s,i) = α+γ a+ρ s+η i+γρ as+γη ai+ρη si,
- Model 3
-
log(λ a,s,i) = α+γ a+ρ s+η i+γη ai+ρη si,
- Model 4
-
log(λ a,s,i) = α+γ a+ρ s+η i+γρ as+ρη si,
- Model 5
-
log(λ a,s,i) = α+γ a+ρ s+η i+γρ as+γη ai,
- Model 6
-
log(λ a,s,i) = α+γ a+ρ s+η i+γρ as,
- Model 7
-
log(λ a,s,i) = α+γ a+ρ s+η i+γη ai,
- Model 8
-
log(λ a,s,i) = α+γ a+ρ s+η i+ρη si,
- Model 9
-
log(λ a,s,i) = α+γ a+ρ s+η i,
where: γ 1, ρ 1, η 1, γρ a1, γρ 1s, γη a1,γη 1i, ρη s1, ρη 1i, γρη as1, γρη a1i, γρη 1si = 0; γρ as represents an interaction between age and setting, γη ai between age and re-infection, ρη si between setting and re-infection, and γρη asi is a three-way interaction between age, setting, and re-infection.
The estimates of λ a,s,i along with estimates of duration feed into equation (8) to estimate κ (t)a,s,i: the parameter in the likelihood function for the LaMontagne data. Model fit statistics together with the nominal numbers of parameters for each model are shown in Table A2. Results are based on two chains run for 40 000 samples after a 10 000 burn-in. The results show that model 8, which includes only the main effects and an interaction between setting and infection/re-infection status has the lowest Deviance Information Criterion (DIC). The DIC is a commonly used statistical measure of model fit which penalizes more complex models [Reference Spiegelhalter22]. A plot of the deviance residuals for model 8 showed no problems (not shown). Model 8 is identical to the one described in the main text although it has been re-parameterized slightly to simplify the notation. It is only marginally better than a model that also includes an interaction between age and setting (model 4), or a model that assumes no interactions (model 9).
Master list of parameters

CT, Chlamydia trachomatis.
* Prevalence is a basic parameter in method B but a functional parameter in the full synthesis model.
Model fit statistics for each of the regression models fitted to the LaMontagne data from Table 2

DIC, Deviance Information Criterion; pD, effective number of parameters [Reference Spiegelhalter22].
Between-setting ratios of infection (INF) rates, force of infection (FOI) rates, and incidence (INC) rates estimated for the LaMontagne [Reference LaMontagne5] data alone, along with odds ratios reported in Adams [Reference Adams6]

FP, Family planning; GP, general practitioner; STD, sexually transmitted disease clinic.
Assumed relationship between setting-specific odds ratios from Adams and hazard ratios in the model for the LaMontagne data
We assume that the between-setting odds ratios are equivalent to between-setting relative risks due to the rare disease assumption and that these inform the between-setting hazard ratios in LaMontagne. This is not strictly correct as they should inform the between-setting incidence ratios.
We assess the sensitivity of the results to this assumption. Table A3 shows the between-setting infection (INF) ratios (column 1), FOI ratios (column 2), and incidence (INC) ratios (column 3), estimated from the LaMontagne data alone. The corresponding results from Adams (introduced in table 4) are repeated in column 4. The INF ratios from LaMontagne are almost identical to the odds ratios from Adams. However, this is not a reason to conclude that our model is better than the ‘correct’ model where they inform INC ratios. There is some discrepancy between the INF ratios compared to the INC or FOI ratios. The FOI and INC ratios are almost identical.
Because of the lack of data for the general population in LaMontagne it is incredibly difficult to correctly parameterize the model so that the ORs inform the INC ratios. It is however possible, although considerably more mathematically complicated than the model described in this paper, to apply the odds ratios to FOI ratios. We performed this analysis for the full synthesis model and found that incidence changed by less than a multiplicative factor of 5% in all age groups (mean <3%). From this, and the fact that the INC and FOI ratios agree so closely, we conclude that there is only very negligible bias from not parameterizing the model so that odds ratios inform INC ratios.
SUPPLEMENTARY MATERIAL
For supplementary material accompanying this paper visit http://dx.doi.org/10.1017/S0950268813001027.
ACKNOWLEDGEMENTS
This study was funded by Medical Research Council strategic project grant G0801947. While finishing writing-up this work M. J. Price was funded by an Economic and Social Research Council postdoctoral fellowship ES/J002909/1. The authors thank Dr Kate Soldan and Dr Ian Simms for providing expert advice during the project and commenting on the manuscript.
DECLARATION OF INTEREST
None.


 Open access