


1. INTRODUCTION
Most of the aspects of marine navigation have been subjects of scientific research, with many of the navigational processes having been modelled and the decision problems described formally. Especially, there are a number of methods solving multi-ship encounter situations. A deterministic approach based on differential games has been proposed in (Lisowski, Reference Lisowski2007), while the heuristic one with the application of Genetic Algorithms (GA) or Evolutionary Algorithms (EA) has been introduced in (Smierzchalski and Michalewicz, Reference Smierzchalski and Michalewicz2000). Similar heuristic Evolutionary Computation (EC) approaches have been tried by other researchers: EA may be applied for finding an optimal path (Zeng, Reference Zeng2003 and Tam and Bucknall, Reference Tam and Bucknall2010). GA are used for optimisation of collision avoidance manoeuvres (Ito et al., Reference Ito, Feifei and Yoshida1999; Tsou et al., Reference Tsou, Kao and Su2010b). Other related approaches include trajectory optimisation using genetic annealing algorithm (Cheng and Liu, Reference Cheng and Liu2007) and ship collision avoidance route planning by ant colony algorithm (Tsou and Hsueh, Reference Tsou and Hsueh2010a). Apart from these, automatic collision avoidance of ships using artificial potential field and speed vector (Xue et al., Reference Xue, Lee and Han2009) has also been used; it is an adaptation of the Potential Field Method (PFM). Summaries of applying EC to maritime collision avoidance and trajectory planning have been presented in (Yang et al., Reference Yang, Cao and Li2006; Statheros et al., Reference Statheros, Howells and McDonald-Maier2008) among others. The above mentioned navigational problems are generally considered to have been solved from the scientific point of view, even if some of the solutions have not been applied yet. However, the problems associated with Traffic Separation Schemes (TSS) have not been thoroughly investigated yet. In particular, there has been no Artificial Intelligence (AI) method that would automatically plan ship routes taking into account Rule 10 of the Convention on the International Regulations for Preventing Collisions at Sea (COLREGS, 1972).
In an earlier paper for this journal, the author has presented the Evolutionary Sets of Safe Ship Trajectories (ESoSST) methodology (Szlapczynski, Reference Szlapczynski2011). This methodology, instead of finding the optimal own trajectory for the unchanged courses and speeds of targets, was searching for an optimal set of safe trajectories of all ships involved in an encounter. In this paper an extension to the ESoSST methodology is introduced, which allows us to support TSSs and thus to be applied in Vessel Traffic Service (VTS) centres. Dealing with Rule 10 of COLREGS affects three phases of the evolutionary methodology: generating the initial population (which should include some predefined TSS-compliant sets of tracks), evaluation (where breaking the rules is detected and penalized by a fitness function) and specialised EA operators, which aim at eliminating the violations of these rules by adjusting the trajectories of ships. The last phase has been described extensively in (Szlapczynski, Reference Szlapczynski2012). This paper focuses on the first two phases. The rest of the paper is organized as follows. In the next section a more formal description of the problem is given, including Rule 10 of COLREGS and the EA is presented. Then the pre-processing phase (generating predefined ship tracks) is described and the ways of detecting violations of Rule 10 are discussed. A description of the evaluation phase (especially penalizing TSS violations) is provided and finally some examples of the results of using the methodology are presented.
2. OPTIMISATION PROBLEM AND SOLUTION BY EVOLUTIONARY ALGORITHM
The goal is to find a set of trajectories, which minimizes the average time loss or way loss spent on manoeuvring, while fulfilling the following conditions:
• None of the stationary constraints (including TSS Inshore Traffic Zone [ITZ] and separation zones) are violated.
• None of the ship domains are violated (Coldwell, Reference Coldwell1983).
• The course alteration should not be too small or too large (minimum and maximum alteration values are configurable and by default are set to 15 and 60 degrees respectively).
• Speed alterations are not to be applied unless necessary (collision cannot be avoided by a configured maximum course alteration value).
• A ship only manoeuvres when she is obliged to and, in case of head-on and crossing encounters, manoeuvres to starboard are favoured over manoeuvres to port.
• COLREGS rules are not violated (especially Rule 10 and Rules 13 to 17).
It is assumed that we are given the following data:
• Stationary constraints (land masses and other obstacles and the locations and parameters of each TSS's parts).
• Positions, courses and speeds of all ships involved.
• Additional ship parameters used for estimating the manoeuvre's dynamics and ship domains (ship lengths, turning circle radius and angular speeds for course alteration manoeuvres).
Some of the above mentioned parameters are provided either by electronic charts or by Automatic Identification System (AIS); motion parameters also by Automatic Radar Plotting Aid (ARPA). At present, no information on ship's manoeuvring abilities (e.g., turning circle radius and turning speed) is provided in AIS messages, however these data can be directly obtained by a VTS operator from a ship's navigator and perhaps in future the content of AIS messages will be extended to include more information.
The selected COLREGS rules (Cockcroft and Lameijer, Reference Cockcroft and Lameijer2011; COLREGS, 1972), which have to be directly handled by the methodology are summarised as follows:
• Rule 13 – Overtaking: ‘an overtaking vessel must keep well clear of the vessel being overtaken’.
• Rule 14 – Head-on Situations: ‘when two power-driven vessels are meeting head-on both must alter course to starboard so that they pass on the port side of the other’.
• Rule 15 – Crossing Situations: ‘when two power-driven vessels are crossing, the vessel, which has the other on the starboard side, must give way’.
• Rule 16 – The Give-Way Vessel: ‘the give-way vessel must take early and substantial action to keep well clear’.
• Rule 17 – The Stand-On Vessel: ‘the stand-on vessel may take action to avoid collision if it becomes clear that the give-way vessel is not taking appropriate action’.
The behaviour of ships within a TSS are governed by Rule 10 (COLREGS, 1972), whose essential points (for this research) are summarised as follows:
• Rule 10(b): ‘A vessel using a traffic separation scheme shall:
○ proceed in the appropriate traffic lane in the general direction of traffic flow for that lane,
○ so far as practicable keep clear of a traffic separation line or separation zone,
○ normally join or leave a traffic lane at the termination of the lane, but when joining or leaving from either side shall do so at as small an angle to the general direction of traffic flow as practicable’.
• Rule 10(c): ‘A vessel shall so far as practicable avoid crossing traffic lanes, but if obliged to do so shall cross on a heading as nearly as practicable at right angles to the general direction of traffic flow’.
• Rule 10(d): ‘A vessel shall not use an inshore traffic zone when she can safely use the appropriate traffic lane within the adjacent traffic separation scheme unless:
○ it is a vessel of less than 20 metres in length, a sailing vessel or a vessel engaged in fishing,
○ it is on route to or from a port, offshore installation or structure, pilot station or any other place situated within the inshore traffic zone, or to avoid immediate danger.’
• Rule 10(e): ‘A vessel other than a crossing vessel or a vessel joining or leaving a lane shall not normally enter a separation zone or cross a separation line except:
○ in cases of emergency to avoid immediate danger,
○ to engage in fishing within a separation zone’.
The above described optimization problem is solved by the evolutionary algorithm whose general flow is presented in Figure 1.
The updated scheme of EA used by ESoSST methodology.

Typically for EA, the initial population is generated and then processed in an evolutionary cycle consisting of four phases: specialised operators and mutation, reproduction (crossover), evaluation and succession. The best individuals (here: sets of trajectories) have the largest chance of being selected for the next generation, which results in a progress towards the final solution. The main difference between this algorithm and the traditional EA, used in (Szlapczynski, Reference Szlapczynski2011; Reference Szlapczynski2012), is that the order of the EA phases is changed here and the specialised operators phase precede reproduction instead of following it. This change allows for applying EA operators, which take into account the data obtained during evaluation phase, without doubling the evaluation phase in the evolutionary cycle. However, the important change concerns generating the initial population. Apart from straight segments (Figure 2) and randomly generated individuals (Figure 3) the initial population now includes individuals consisting of predefined tracks, generated automatically (Figure 4). The random sets of trajectories, which constitute the majority of the initial population, are necessary for wide exploration, while the predefined routes result in a faster convergence to a solution.
An individual consisting of two straight trajectories.

An individual consisting of two random trajectories.

An individual consisting of two predefined routes.

In the following sections we will analyse how the predefined tracks are generated (Section 3), how TSS violations can be detected (Section 4), and then how the data on violations is used for evaluation (Section 5).
3. PRE-PROCESSING: GENERATING PREDEFINED TRACKS
The permissible types of routes, which are the results of applying Rule 10 of COLREGS, are shown in Figure 5 (Anwar and Khalique, Reference Anwar and Khalique2006).
TSS and different routes through a sector.

For a TSS sector shown in Figure 5 the preferred routes that the ships should follow are:
• Track A – through traffic.
• Track B – traffic using a lane and crossing another lane to reach an ITZ; it leaves the lane at a small angle to reach the separation zone and alters course within the separation zone.
• Track C – traffic crossing TSS at right heading.
• Track D – traffic joining lane from the side.
• Track E – traffic leaving the ITZ, crossing one lane and joining the other lane.
• Track F – traffic leaving the lane at a small angle.
To reduce the number of generations needed to reach a correct solution by the ESoSST methodology, predefined tracks partially compliant with traffic lanes are determined prior to the main optimisation process, in the course of pre-processing. These tracks are then added to the initial population. They are generated based on the endpoints of the segments of the traffic lanes and the traffic lane courses. It is performed as follows. First, a table of nodes (Figure 6) is prepared for each traffic lane within a TSS. This table includes transit nodes as well as nodes being the incoming and outgoing gates for joining a lane from the side and leaving it at its side. The table is generated offline and stored in the system's memory throughout the system's work.
An exemplary table of nodes for generating predefined tracks (points of entry/exit from the side are marked with larger dots, transit nodes with smaller dots).

Depending on the ship domain dimensions and the width of a traffic lane, a table of nodes may allow for different number of parallel tracks on one lane. In Figure 7 three parallel tracks are shown. Based on the table of nodes and the ship's start and destination points the appropriate traffic lane is selected. In case of two or more possible selections (multiple traffic lanes in the same direction within one TSS) the lane which results in the shortest total passage time is chosen. Once the lane is selected, the following three decisions must be made: will the ship join the lane at the start or from the side, how many transit nodes will the ship use and will the ship exit the lane at the end or at the side? Depending on the lane's orientation, joining the lane from the side or leaving it at the side may additionally involve crossing the opposite lane and crossing the separation zone. This gives a total of six typical cases, corresponding to the ones already shown in Figure 5. Examples of predefined tracks generated by the method for these six cases are presented below in Figures 8 to 13.
An exemplary table of nodes for generating predefined tracks.

Through traffic.

Traffic using a lane and crossing another lane.

Traffic crossing TSS.

Traffic joining lane from the side.
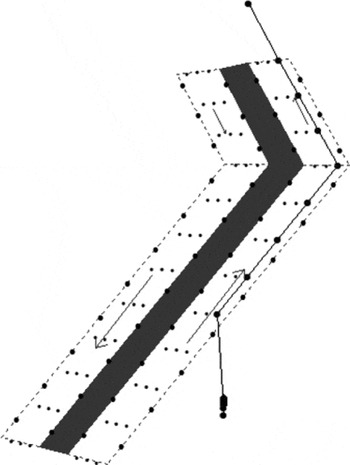
Traffic crossing one lane and joining the other lane.

Traffic leaving the lane.

4. DETECTING TSS VIOLATIONS
Detecting violations of static constraints, ship domains (Coldwell, Reference Coldwell1983) and general COLREGS rules has already been covered in (Szlapczynski and Szlapczynska, Reference Szlapczynski and Szlapczynska2011). Therefore in this paper only detection of TSS violations is described. The algorithm for TSS rules violation detection is given as follows. The first step in determining a potential TSS rule violation is to check whether a trajectory's segment has crossed a TSS. If so, then each of the TSS's parts will be checked. Since each part of a TSS is a polygon, it is enough to detect a crossing of a trajectory's segment with one of the polygon's edges. Once such a crossing has been detected, the further conditions for violations will be checked, depending on the particular TSS part. Three general groups of TSS violations have been dealt within this research. For each of these groups various violation types have been distinguished for detection and correction purposes.
4.1. Violations of ITZ ( Figure 14 – listed clockwise from top left):
4.1.1. ITZ entered:
the first endpoint of a trajectory's segment is outside the ITZ and the second one is inside.
Violations of ITZ.

4.1.2. ITZ transited through:
both endpoints of a trajectory's segment are inside the ITZ.
4.1.3. ITZ exited:
the first endpoint of a trajectory's segment is inside the ITZ and the second one is outside.
4.1.4. ITZ crossed:
both endpoints of a trajectory's segment are outside the ITZ and the segment crosses with ITZ boundaries.
4.2. Violations of a Separation Zone ( Figure 15 – listed clockwise from top left):
4.2.1. Separation zone entered:
the first endpoint of a trajectory's segment is outside the separation zone and the second one is inside.
Violations of a separation zone.

4.2.2. Separation zone exited:
the first endpoint of a trajectory's segment is inside the separation zone and the second one is outside.
4.2.3. Separation zone crossed:
both endpoints of a trajectory's segment are outside the separation zone.
4.2.4. Separation zone transited through:
both endpoints of a trajectory's segment are inside the separation zone.
4.3. Violations of Traffic Lanes
(Figure 16 – listed clockwise from top left). For detection purposes it had to be decided when a ship's heading can be classified as a violation of a traffic lane. The author has assumed a 10-degree difference between the ship's heading and the lane's direction for transiting through a lane, a 10-degree difference from the perpendicular for crossing a lane and a 20-degree difference from the lane's direction for entering and exiting a lane. Also, to enable penalizing and correction of the violations it is checked whether the current heading is closer to transiting through (difference from the lane's direction within 10 to 45 degree range), closer to crossing (difference from perpendicular within 10 to 45 degree range), or closer to going in the wrong direction down a traffic lane (difference from the lane's direction over 135 degrees).
Violations of a traffic lane.

4.3.1. Traffic lane entered on a wrong heading:
the first endpoint of a trajectory's segment is outside the traffic lane and the second one is inside. The heading of entrance differs from the lane's direction by more than 20 degrees, but less than 135 degrees.
4.3.2. Traffic lane exited on a wrong heading:
the first endpoint of a trajectory's segment is inside the traffic lane and the second one is outside. The heading of a segment differs from the lane's direction by more than 20 degrees, but less than 135 degrees.
4.3.3. Traffic lane crossed on a wrong heading:
both endpoints of a trajectory's segment are outside the lane. The heading of a segment differs from the perpendicular to the lane's direction by more than 10 degrees and less than 45 degrees.
4.3.4. Traffic lane cross-transited through on a wrong heading:
both endpoints of a trajectory's segment are outside the lane. The heading of a segment differs from the lane's direction by more than 10 degrees but less than 45 degrees.
4.3.5. Traffic lane transited through on a wrong heading:
both endpoints of a trajectory's segment are inside the lane. The heading of a segment differs from the lane's direction by more than 10 degrees.
4.3.6. Traffic lane cross-transited through in the wrong direction:
the heading of a segment differs from the lane's direction by more than 135 degrees.
5. EVALUATION
In EA all individuals (here: sets of trajectories) are evaluated by the specially designed fitness function, which should reflect optimisation criteria and constraints (Michalewicz and Fogel, Reference Michalewicz and Fogel2004). The fitness function is a sum of fitness of all trajectories in a set:
 $$fitness = \sum\limits_{i = 1}^n {\left[ {trajectory {\mbox \_}\hskip1pt fitness_i} \right]} $$
where:
 $$trajectory\mbox{\_}\hskip1pt fitness_i = trajectory\mbox{\_} \hskip1.2pt economy\mbox{\_} \hskip1pt factor_i * scf_i * caf_i * ccf_i * tcf_i $$
and:
scf i (static constraint factor), caf i (collision avoidance factor) and ccf i (COLREGS-compliance factor) have been described in (Szlapczynski, Reference Szlapczynski2011), therefore only the elements of Equation (2) which have changed, namely: trajectory_economy_factor i and tcf i (TSS compliance factor) are discussed here.
5.1. Trajectory Economy Factor
The basic optimisation criterion is the economic one; minimizing time losses of all ships in a set for fixed propeller's settings. However, where there are changes in ship propeller's settings (due to the necessity of speed reduction) this criterion cannot be used and a simplified criterion of way loss is then used. Therefore for each of the trajectories, a trajectory_economy_factor is computed according to Equations (3) or (4).
For fixed propeller's settings:
 $$trajectory\mbox{\_} \hskip1pt economy\mbox{\_} \hskip2pt factor_i = \left( {\displaystyle{{trajectory\mbox{\_} \hskip1pt time_i - time\mbox{\_} \hskip1ptloss_i} \over {trajectory\mbox{\_} \hskip1pttime_i}}} \right)$$
For changing propeller's settings:
 $$trajectory\mbox{\_} \hskip1pt economy\mbox{\_} \hskip2pt factor_i = \left( {\displaystyle{{trajectory\mbox{\_}length_i - way\mbox{\_} \hskip1pt loss_i} \over {trajectory\mbox{\_} \hskip1ptlength_i}}} \right)$$
where:
i is the index of the current ship.
trajectory_time i is the total time by the i-th ship between the endpoints of its trajectory [hours].
time_loss i is the total time loss of the i-th ship computed as a difference between the trajectory time and the time spent on covering a straight segment joining the trajectory's endpoints. time_loss i includes temporary fall in speed (for fixed propeller's settings) due to course alteration manoeuvres.
trajectory_length iis the total length of the i-th ship's trajectory [nautical miles].
way_loss iis the difference between the length of the i-th ship's trajectory and the length of a straight segment joining the endpoints of the i-th ship's trajectory [nautical miles].
5.2. TSS Compliance Factor
The tcf i factor is computed according to Equation (5).
 $$tcf_i = \left( {1 - \sum\limits_{k = 1}^m {\left[ {TSS\mbox{\_}violation\mbox{\_} \hskip1ptpenalty{_k}} \right]}} \right) * \left[ {1 + lpf_i * (lef - 1)} \right],$$
where:
m is the number of TSS rules violations registered for the current ship,
k is the index of a registered violation,
TSS_violation_penalty k is the penalty for the k-th of the registered TSS rules violations,
lef is the lane encouragement factor applied to encourage using traffic lanes, set to 1·5 by default,
lpf i is the trajectory's lane percentage factor (a percentage of the trajectory's length that transits through a traffic lane).
The TSS rules violations listed in Section 4 and used in Equation (5) are penalized as follows:
• Section 4.1.1 to 4.1.4 (ITZ violations):
(6) $$\eqalign{TSS\mbox{\_}violation\mbox{\_} \hskip1pt penalty = 2 * segment\mbox{\_}violation\mbox{\_} \hskip1pt percentage}$$
• Section 4.2.1 to 4.2.4 (Separation zone violations):
(7)$$TSS\mbox{\_}violation\mbox{\_} \hskip1pt penalty = segment\mbox{\_}violation\mbox{\_} \hskip1pt percentage$$• Section 4.3.1 and 4.3.2. (Traffic lane is entered or exited on a wrong heading):
(8)where:$$TSS\mbox{\_}violation\mbox{\_} \hskip1pt penalty = \displaystyle{{segment\mbox{\_}violation\mbox{\_} \hskip1pt percentage * \sin (e\mbox{\_} \hskip1pt dev\mbox{\_} \hskip1pt angle)} \over 2}$$(9)$$e\mbox{\_} \hskip1pt dev\mbox{\_} \hskip1pt angle = \left| {traffic\mbox{\_} \hskip1pt lane\mbox{\_} \hskip1pt course - ship\mbox{\_} \hskip1pt course} \right| - 20$$• Section 4.3.3. (Traffic lane is crossed on a wrong heading):
(10)where:$$TSS\mbox{\_}violation\mbox{\_} \hskip1pt penalty = segment\mbox{\_}violation\mbox{\_} \hskip1pt percentage * \sin (c\mbox{\_} \hskip1pt dev\mbox{\_} \hskip1pt angle)$$(11)$$c\mbox{\_} \hskip1pt dev\mbox{\_} \hskip1pt angle = \left| {\,perpendicular\mbox{\_} \hskip1pt to\mbox{\_} \hskip1pt traffic\mbox{\_} \hskip1pt lane\mbox{\_} \hskip1pt course - ship\mbox{\_} \hskip1pt course} \right|$$• Sections 4.3.4 and 4.3.5. (Traffic lane is cross-transited through on a wrong heading or Traffic lane is transited through on a wrong heading):
(12)$$TSS\mbox{\_}violation\mbox{\_} \hskip1pt penalty =\tab segment\mbox{\_}violation\mbox{\_} \hskip1pt percentage\cr\tab * \sin (t\mbox{\_} \hskip1pt dev\mbox{\_} \hskip1pt angle)$$where:
(13)$$t\mbox{\_} \hskip1pt dev\mbox{\_} \hskip1pt angle = \left| {traffic\mbox{\_} \hskip1pt lane\mbox{\_} \hskip1pt course - ship\mbox{\_} \hskip1pt course} \right| - 10$$• Section 4.3.6. (Traffic lane is cross-transited through in the wrong direction):
(14)where:$$\eqalign{TSS\mbox{\_}violation\mbox{\_} \hskip1pt penalty =\tab{ 2 * segment\mbox{\_}violation\mbox{\_} \hskip1pt percentage}\cr\tab * \sin \left( {\displaystyle{{ct\mbox{\_} \hskip1pt dev\mbox{\_} \hskip1pt angle} \over 2}} \right)\hfill$$(15)$$ct\mbox{\_} \hskip1pt dev\mbox{\_} \hskip1pt angle = \left| {traffic\mbox{\_} \hskip1pt lane\mbox{\_} \hskip1pt course - ship\mbox{\_} \hskip1pt course} \right| - 10$$• For all penalty equations:
(16)$$segment\mbox{\_}violation\mbox{\_} \hskip1pt percentage = \displaystyle{{violating\mbox{\_}\hskip1pt part\mbox{\_} \hskip1pt length} \over {segment\mbox{\_} \hskip1pt length}}$$











As has been reflected in Equations (6) and (14), the violations which are most severely punished are ITZ violations and transiting a lane in the wrong direction (a heading opposite or close to the opposite of the recommended one).
5.3. How TSS Penalties Affect the Solutions
The values of penalties for TSS violations given in Section 5.2 have been subject to modifications in the course of simulation experiments. If the penalties are too small, the methodology may give rise to a solution which ignores TSS violations to minimize time loss. On the other hand, too large penalties may result in convergence to a solution which avoids entering a TSS, even at the cost of a larger time loss. Such situations are shown in Figure 17 (penalties set to much smaller than normal) and Figure 18 (penalties set to much larger than normal) respectively. In Figure 19 a solution generated with standard penalty settings (from Section 5.2) is shown.
Too small penalties lead to violating the inbound traffic lane.

Too large penalties result in avoiding the traffic lanes.

Standard penalty settings lead to using the outbound traffic lane.

6. EXAMPLES OF SIMULATION RESULTS
In this section, examples of ship routes planned using the methodology will be shown. The time for making a decision is set to 6 minutes. All ships in the scenarios have the turning speed of 0·3 degrees per second, length of 150 metres and turning circle radius of 0·5 nautical miles. Ship speeds are shown in Figures 20 to 25. The computational time limit has been set to 1 minute, which in the case of the simulation environment (a standard PC machine) allowed for 100–200 generations, depending on the number of ships. Usually however, 50 generations were enough to find an acceptable solution.
Overtaking in a traffic lane.

Crossing a traffic lane.

The trajectories of three ships involved in a crossing and overtaking encounter (ship positions during passing marked by ‘x’).

Evolution of trajectories: the set of trajectories after 5 generations.

Evolution of trajectories: the set of trajectories after 20 generations (positions of Ship 4 and Ship 5 during passing marked by ‘x’).

The final set of trajectories of five ships involved in overtaking and crossing encounters (ship positions during passing marked by ‘x’).

All scenarios are set in the Gulf of Gdansk TSS (fully shown in Figures 22 to 25) which includes the following elements:
• ‘TSS-WEST’ (Inbound Traffic Lane and Outbound Traffic Lane separated by a separation line – these traffic lanes are shown in the left part of each figure).
• ‘TSS-EAST’ (Inbound Traffic Lane and Outbound Traffic Lane separated by a separation lane – these traffic lanes are shown in the right part of each figure).
• ‘ITZ’ – Inshore Traffic Zones (shown in the left part of Figures 22 to 25).
6.1. Simple Collision Avoidance Scenarios – Overtaking and Crossing
Two simple collision avoidance scenarios on a traffic lane are presented below. For the overtaking encounter, the resulting trajectories are shown in Figure 20. Ship 2, whose speed is greater by 5 knots, keeps close to the left side of the outbound traffic lane throughout the passage and safely overtakes Ship 1. Ship positions during passing are marked by ‘x’.
For the crossing encounter the resulting trajectories are shown in Figure 21. Ship 1 transits through outbound traffic lane keeping close to its left side. Ship 2 avoids violating the IZ and TSS WEST and crosses TSS EAST astern of Ship 1.
6.2. A Mixed Scenario – Crossing and Overtaking Involving Three Ships
The resulting trajectories are shown in Figure 22. Ship 2 overtakes Ship 1, keeping a safe distance throughout the overtaking manoeuvre, while Ship 3 crosses astern of Ship 1 and Ship 2.
6.3. A Mixed Scenario – Evolution of Trajectories
For this mixed scenario of overtaking and crossing involving five ships, an evolution towards the final solution is illustrated. The sets of trajectories after 5 generations and 20 generations are shown in Figure 23 and Figure 24 respectively.
As expected, after 5 generations (Figure 23) some obvious violations of TSS are visible and the best set of trajectories is far from acceptable.
After 20 generations (Figure 24) the TSS violations have been eliminated for the most part, but during the overtaking manoeuvre Ship 5 is relatively close to Ship 4. Further evolution brings improvement. After 50 generations the evolutionary process converges to a solution, which does not change significantly thereafter. The solution is presented in Figure 25. Here Ship 2 overtakes Ship 1 and Ship 5 overtakes Ship 4 keeping a safe distance. Ship 3 crosses astern of all other ships.
7. SUMMARY AND CONCLUSIONS
In the paper a new version of the author's Evolutionary Sets of Safe Ship Trajectories (ESoSST) methodology has been presented. The paper does not re-work the basic principles which have been provided in (Szlapczynski, Reference Szlapczynski2011; Szlapczynski and Szlapczynska, Reference Szlapczynski and Szlapczynska2011), but instead focuses on dealing with Rule 10 of COLREGS. This rule has not been properly investigated from the Artificial Intelligence (AI) point of view before and in particular has not been handled by Evolutionary Algorithms (EA) methods of ship collision avoidance, safe route planning and safe trajectory planning. In the course of the work the following tasks have been solved. First, a simple method of generating predefined ship tracks within Traffic Separation Schemes (TSS) has been introduced. Then, TSS violations have been grouped into categories. Finally, based on these categories, a fitness function including penalties for TSS violations has been proposed for evaluation of the sets of trajectories. The effectiveness of correcting TSS violations is additionally increased by applying previously designed specialized TSS-dedicated EA operators (Szlapczynski, Reference Szlapczynski2012). Computer simulation experiments have been carried out and they have confirmed the usefulness of the presented approach. Examples of the methodology's results have been provided to illustrate how it finds a solution in typical situations. The methodology has been designed for application in software systems used by Vessel Traffic Service (VTS) centres. When provided with complete and precise data and equipped with sufficient computational power it should make the work of VTS operators easier by assisting them in their task of synchronizing multiple ship trajectories.



