


1. Introduction
Fiscal expansion through increased government spending is a key policy instrument for stimulating the economy. For instance, during the 2008 global financial crisis and recent COVID-19 pandemic, many countries implemented large-scale fiscal stimulus packages to fight severe recessions. Given the significance of the fiscal policy, it is necessary to understand the circumstances under which fiscal expansion is more effective in boosting the economy. Hence, numerous studies have investigated the potential factors that could affect fiscal multipliers, such as business cycles (Auerbach and Gorodnichenko (Reference Auerbach and Gorodnichenko2012), Ramey and Zubairy (Reference Ramey and Zubairy2018)), wealth inequality (Brinca et al. (Reference Brinca, Holter, Krusell and Malafry2016)), government debt levels (Ilzetzki et al. (Reference Ilzetzki, Mendoza and Végh2013), Huidrom et al. (Reference Huidrom, Kose, Lim and Ohnsorge2020)), degree of economic development (Sheremirov and Spirovska (Reference Sheremirov and Spirovska2022)), zero lower bound (Klein and Winkler (Reference Klein and Winkler2021)), and demographic structure (Honda and Miyamoto (Reference Honda and Miyamoto2021), Miyamoto and Yoshino (Reference Miyamoto and Yoshino2022), Cho and Rhee (Reference Cho and Rhee2024)).Footnote 1
In addition to these potential factors, tax systems may be among the most substantial determinants of fiscal multipliers. Taxes significantly affect both resource allocation and responses to changes in government spending. Hence, fiscal policies may lead to considerably distinct economic outcomes between large-government countries with relatively high tax rates and those with relatively low tax rates. However, tax systems have received little attention in the literature as determinants of fiscal multipliers. Motivated by this, we provide a theoretical and empirical analysis of the effects of overall tax systems on the responses of key macroeconomic variables, such as output, employment, and consumption to changes in government purchases. To the best of our knowledge, this is the first study to investigate how the macroeconomic effects of fiscal policies interact with the overall tax systems.
First, we consider a static neoclassical model with variable labor for the theoretical analysis, following Baxter and King (Reference Baxter and King1993) and Woodford (Reference Woodford2011). In this framework, we derive an analytical result regarding the effect of the income tax rate on the government spending multiplier (i.e., the change in output caused by an unanticipated increase in government purchases). Then, we generalize the theoretical analysis to a dynamic neoclassical model with labor and capital. After calibrating the model, we quantify two types of fiscal multipliers: (i) the responses of steady-state output to a permanent increase in government purchases and (ii) the impulse responses of output to a temporary hike in government purchases. This analysis enables us to quantitatively explore the effects of the income tax rate on both the long- and short-run output responses.
Next, in an empirical analysis, we estimate the state-dependent impulse responses of output and other key macroeconomic variables to an unanticipated shock to government purchases in 12 Organisation for Economic Cooperation and Development (OECD) countries from 1985 to 2019. Specifically, we employ a state-dependent local projection method in which the estimated impulse responses depend on the tax revenue to gross domestic product (tax-GDP) ratio, that is, the ratio of total tax revenue to GDP. This measure is a useful indicator of government size or overall tax systems, and corresponds to the income tax rate in our theoretical models. Prior to estimating the state-dependent (or nonlinear) local projections, we identify government spending shocks based on the differences between the realized values of government purchases and their forecasts obtained from the OECD. Thus, the shocks identified in our empirical analysis represent unanticipated changes in government purchases in the theoretical analysis.
The main findings of this study are as follows. First, in the static neoclassical model, we show that the government spending multiplier increases in the income tax rate with standard forms of the utility and production functions.Footnote 2 Interestingly, this finding differs considerably from the traditional Keynesian model’s prediction that a multiplier should decrease in the income tax rate. The two models yield contrasting results because they are based on different channels of fiscal expansion effects on output. In the traditional Keynesian model, a hike in government purchases increases output through positive consumption responses. However, in the static neoclassical model, such a fiscal expansion generates a negative wealth effect on households by reducing the goods available for consumption. Consequently, households consume less but work more in response to the fiscal expansion. As a result, output rises, driven by an increase in labor supply, but the stimulus effect is comparably weakened as consumption falls.
A possible explanation can also be provided for why the government spending multiplier increases with the income tax rate. With the standard forms of utility and production functions, labor supply becomes more elastic, and consumption becomes less elastic as household income decreases. Thus, when initial output is small, an increase in government purchases leads to a large increase in labor supply but a small decrease in consumption. In this case, fiscal expansion can increase output more significantly. Thus, high income tax rates can reinforce the stimulus effect of fiscal expansion on output because they reduce initial output through distortions in resource allocation. Thus, the government spending multiplier increases with the income tax rate.
The positive effect of the income tax rate on the government spending multiplier was also quantitatively confirmed in a dynamic neoclassical model calibrated with standard functional forms and parameter values.Footnote 3 We find that a permanent increase in government purchases has a stronger positive effect on steady-state output as the income tax rate increases. In addition, an unanticipated one-time hike in government purchases tends to generate more significant positive impulse responses of output when the income tax rate is high. These quantitative results are consistent with the analytical findings of the static neoclassical model. Taken together, our theoretical results suggest that fiscal expansion can be more effective in stimulating output in large governments with high income tax rates.Footnote 4
Furthermore, our results from the empirical framework are consistent with the theoretical results. Specifically, the estimation results reveal that while the state-dependent impulse responses of output to an unanticipated government spending shock tend to be significantly positive when the tax-GDP ratio is high, they are statistically indistinguishable from zero when the ratio is low. Our empirical findings confirm the theoretical result that fiscal expansion can stimulate output more effectively in large governments with relatively high tax rates.
Our estimation results are inconsistent with the predictions of traditional Keynesian models, which imply that the government spending multiplier should decrease in the income tax rate. In addition, we find that the impulse responses of output are qualitatively similar to those of employment, but different from those of consumption. Specifically, the estimated impulse responses of employment to a positive government spending shock tend to be significantly positive when the tax-GDP ratio is high, but insignificant when the ratio is low. However, the estimated impulse responses of consumption are insignificant, regardless of the tax-GDP ratio. It should be emphasized that these results are not supported by the traditional Keynesian model. According to the model, the responses of output and consumption to fiscal expansion should exhibit a positive correlation because the multiplier effect on output is primarily driven by positive responses of consumption.
This study is related to several strands of the literature. First, our theoretical analysis builds on Baxter and King (Reference Baxter and King1993) and Woodford (Reference Woodford2011) as static and dynamic neoclassical models are drawn from them. However, we extend their analyses by examining how the income tax rate affects government spending multipliers in these models. As discussed, the government spending multiplier tends to increase with the income tax rate, which contradicts the well-known predictions of the traditional Keynesian model. As such, our theoretical analysis contributes to the literature by providing novel insights into the role of the income tax rate in the multiplier effect of government spending.
Our theoretical analysis is also related to the literature on the flypaper effect, that is, a well-documented empirical fact that local government spending responds more significantly to unconditional grants from the national government than to local income. Theoretically, this phenomenon is puzzling because unconditional grants and local tax revenue are perfect substitutes as a source of local government spending.Footnote 5 However, several studies (e.g., Hamilton (Reference Hamilton1986), Dahlby (Reference Dahlby2011), and Vegh and Vuletin (Reference Vegh and Vuletin2016)) find that the flypaper effect can be explained if local tax is distortionary rather than lump-sum. Our theoretical analysis is related to these studies in that the economic models are similar and the interaction between government spending and distortionary taxes plays a key role.
However, our theoretical models are distinguishable from theirs in several aspects. In our analysis, government spending is exogenous whereas output is endogenous because the government spending multiplier represents the endogenous response of output to an exogenous change in government spending. For this reason, we consider a government that exogenously determines government spending. In contrast, in the aforementioned studies, income (or output) is exogenous whereas government spending is endogenous because the flypaper effect is concerned with the endogenous response of local government spending to an exogenous change in local income or unconditional inter-governmental grants. For this reason, they consider a Ramsey local government that optimizes local government spending (and tax rates). As such, our theoretical analysis is clearly distinct from the aforementioned studies in the government behavior and the focus of the analysis.
Our empirical analysis is based on a growing body of literature that measures the macroeconomic effects of changes in government spending or tax rates. Most studies in the related literature estimate the dynamic responses of output to an exogenous change in government spending or tax rates. The existing literature focuses on the first derivatives of output with respect to government spending and tax rates. In contrast, our study contributes to the literature by conducting a comprehensive analysis of the second-order cross-derivative of output with respect to government spending and tax revenue. As discussed earlier, in our empirical analysis, the dynamic responses of output to government spending shocks are determined by the tax-GDP ratio, which represents government size. Thus, our analysis sheds light on the interactions between government spending and tax policy or government size in the government’s stabilization policy.
Our empirical analysis employs a state-dependent (or nonlinear) local projection method, with the state of the economy determined by the tax-GDP ratio. State-dependent local projection methods have been used to explore the characteristics of the economy that may influence the multiplier effects of government spending or tax rates. Ramey and Zubairy (Reference Ramey and Zubairy2018) adopt a state-dependent local projection method to compare government spending multipliers for the U.S. during economic booms and slumps, the zero lower bound (ZLB) period and normal states. Klein and Winkler (Reference Klein and Winkler2021) and Miyamoto et al. (Reference Miyamoto, Nguyen and Sergeyev2018) use similar approaches to examine the role of the ZLB in government spending multipliers for 13 OECD countries and Japan, respectively. Similarly, Miyamoto and Yoshino (Reference Miyamoto and Yoshino2022) adopt a state-dependent local projection method to investigate the effect of population aging on the effectiveness of fiscal expansion.
Since the pioneering work of Blanchard and Perotti (Reference Blanchard and Perotti2002), structural vector autoregressive (SVAR) models have been widely used to quantify the macroeconomic effects of changes in government spending or tax rates. For instance, Ben Zeev and Pappa (Reference Ben Zeev and Pappa2017) and Mountford and Uhlig (Reference Mountford and Uhlig2009) quantify the macroeconomic effects of government spending shocks in the U.S. using SVAR models. Ilzetzki et al. (Reference Ilzetzki, Mendoza and Végh2013) apply the SVAR approach to a panel of 44 countries to obtain government spending multipliers and examine several country-specific characteristics that could influence the multipliers.Footnote 6
A key issue in the literature is the identification of government spending shocks representing unanticipated exogenous changes in government spending. In any period, part of government expenditure may be anticipated by people or motivated by changes in output or other important macroeconomic events. Hence, these components should be removed to identify government spending shocks relevant to fiscal multipliers. There have been alternative approaches to identifying exogenous shocks to government spending and tax rates. First, Blanchard and Perotti (Reference Blanchard and Perotti2002) argue that for high-frequency data, government expenditures in a period are likely to be exogenous because they tend to be predetermined in the past through lengthy legislative and political processes. Several studies have exploited this identification scheme (Ilzetzki et al. (Reference Ilzetzki, Mendoza and Végh2013), Ramey and Zubairy (Reference Ramey and Zubairy2018), Klein and Winkler (Reference Klein and Winkler2021)). However, this may not be valid for our empirical analysis with annual data because government purchases in a year may be influenced by output in the same year.
Alternatively, other studies use government military spending because it is mainly motivated by international conflicts or geopolitical risks and is unlikely to respond to the state of the economy. Based on this idea, Ramey and Zubairy (Reference Ramey and Zubairy2018) use military spending as an instrument for government spending to estimate government spending multipliers.Footnote 7 However, military spending is less useful for this study because it does not exhibit sufficiently large variations for the European economies in our sample. The third approach to identifying exogenous fiscal policy shocks is narrative-based method. In this approach, government spending shocks are constructed based on historical government documents. Starting with the Romer and Romer’s (Reference Romer and Romer2010) seminal work, several studies have used this approach to quantify the macroeconomic effects of exogenous tax rate changes (e.g., Mertens and Ravn (Reference Mertens and Ravn2013, Reference Mertens and Ravn2014), Cloyne (Reference Cloyne2013), Guajardo et al. (Reference Guajardo, Leigh and Pescatori2014), Riera-Crichton et al. (Reference Riera-Crichton, Vegh and Vuletin2016)). However, this type of a shock is not available for some countries in our sample. Thus, following Auerbach and Gorodnichenko (Reference Auerbach and Gorodnichenko2012, Reference Auerbach, Gorodnichenko, Auerbach and Gorodnichenko2013), we identify government spending shocks from government purchase forecast errors. As discussed, this notion of shocks is consistent with unexpected exogenous changes in government spending in our theoretical analysis.
The remainder of this paper is organized as follows. The next section presents a theoretical analysis using both standard static and dynamic neoclassical models. Section 3 describes the data used and presents state-dependent local projections. Section 4 presents the estimation results for the output effects and shows the state-dependent impulse responses of key macroeconomic variables such as employment and consumption to government spending shocks. Finally, Section 5 provides the concluding remarks.
2. Theoretical analysis
In this section, we analyze the effects of an unanticipated rise in government purchases on the economy and the role of the income tax rate in standard neoclassical models (Baxter and King (Reference Baxter and King1993), Woodford (Reference Woodford2011)). First, using a static neoclassical model with variable labor, we derive a formula suggesting that the government spending multiplier can increase with the income tax rate. Then, using a general dynamic neoclassical model with reasonable parameter values, we show that the government spending multiplier tends to increase in the income tax rate. Finally, we discuss whether such theoretical results can be extended to the standard New Keynesian models.
2.1 Static neoclassical model with variable labor
Before analyzing the neoclassical model, we briefly review the main predictions of the traditional Keynesian model regarding the macroeconomic effects of changes in government purchases. In the traditional Keynesian model, a one-unit increase in government purchases $G$
can raise output
$G$
can raise output $Y$
by more than one unit because of positive consumption responses. This mechanism has several implications. First, fiscal expansions that raise
$Y$
by more than one unit because of positive consumption responses. This mechanism has several implications. First, fiscal expansions that raise $G$
are expected to stimulate output significantly. Second, the government spending multiplier,
$G$
are expected to stimulate output significantly. Second, the government spending multiplier, $\partial Y/\partial G$
, falls as the income tax rate rises because income tax payments weaken consumption responses by reducing disposable income. Thus, consumption and output are expected to move in the same direction in response to changes in government purchases because output is primarily driven by changes in consumption. As discussed, neoclassical models provide different predictions of the effects of fiscal expansion. Hence, in Sections 3 and 4, we evaluate the predictions of the two types of models in our empirical analysis.
$\partial Y/\partial G$
, falls as the income tax rate rises because income tax payments weaken consumption responses by reducing disposable income. Thus, consumption and output are expected to move in the same direction in response to changes in government purchases because output is primarily driven by changes in consumption. As discussed, neoclassical models provide different predictions of the effects of fiscal expansion. Hence, in Sections 3 and 4, we evaluate the predictions of the two types of models in our empirical analysis.
Our theoretical analysis is based on static neoclassical models developed by Baxter and King (Reference Baxter and King1993) and Woodford (Reference Woodford2011). In this model, homogeneous households choose consumption $C$
and labor supply
$C$
and labor supply $L$
to maximize utility
$L$
to maximize utility $u\left ( C\right ) -v\left ( L\right )$
, that satisfies
$u\left ( C\right ) -v\left ( L\right )$
, that satisfies $u^{\prime }\gt 0\gt u^{\prime \prime }$
and
$u^{\prime }\gt 0\gt u^{\prime \prime }$
and $v^{\prime }\gt 0$
,
$v^{\prime }\gt 0$
, $\ v^{\prime \prime }\gt 0$
, subject to the budget constraint:
$\ v^{\prime \prime }\gt 0$
, subject to the budget constraint:
 \begin{equation*} C=\left ( 1-\tau \right ) \left ( wL+\Pi \right ) +TR, \end{equation*}
where $\tau \in \left ( 0,1\right ), \ w,\ \Pi, $
and
$\tau \in \left ( 0,1\right ), \ w,\ \Pi, $
and $TR$
denote the income tax rate, wages, dividends from firm profits, and lump-sum transfers from the government, respectively. Then, labor supply is determined by the following condition:
$TR$
denote the income tax rate, wages, dividends from firm profits, and lump-sum transfers from the government, respectively. Then, labor supply is determined by the following condition:
 \begin{equation*} \left ( 1-\tau \right ) w=\frac {v^{\prime }\left ( L\right ) }{u^{\prime }\left ( C\right ) }\end{equation*}
On the supply side, identical firms produce output using labor. Their problem is to maximize profits by optimally choosing labor.
 \begin{equation*} \Pi =\max _{L}\left [ f\left ( L\right ) -wL\right ], \end{equation*}
where $Y=f\left ( L\right )$
is a production function satisfying
$Y=f\left ( L\right )$
is a production function satisfying $f^{\prime }\gt 0\gt f^{\prime \prime }.$
Note that profit
$f^{\prime }\gt 0\gt f^{\prime \prime }.$
Note that profit $\Pi$
is distributed among households as dividends. The firms’ labor demand is determined by
$\Pi$
is distributed among households as dividends. The firms’ labor demand is determined by
 \begin{equation*} w=f^{\prime }\left ( L\right ) . \end{equation*}
The government receives income tax from households, makes purchases $G$
, and provides lump-sum transfers
$G$
, and provides lump-sum transfers $TR$
to households. Thus, the government budget constraint is given as
$TR$
to households. Thus, the government budget constraint is given as
 \begin{equation*} G+TR=\tau \left ( wL+\Pi \right ) . \end{equation*}
In this model, we assume that the government chooses $G$
exogenously but maintains
$G$
exogenously but maintains $\tau$
at a given value. Then, the budget surplus,
$\tau$
at a given value. Then, the budget surplus, $TR=\tau \left ( wL+\Pi \right ) -G,$
is rebated to households as lump-sum transfers. This type of government behavior is suitable for our analysis because the government spending multiplier represents the endogenous response of output
$TR=\tau \left ( wL+\Pi \right ) -G,$
is rebated to households as lump-sum transfers. This type of government behavior is suitable for our analysis because the government spending multiplier represents the endogenous response of output $Y$
to an exogenous change in
$Y$
to an exogenous change in $G$
.
$G$
.
Alternatively, the current model could be combined with a Ramsey government that optimizes the policy instruments $\left ( \tau, G,TR\right ) .$
Such a model can be useful to analyze how
$\left ( \tau, G,TR\right ) .$
Such a model can be useful to analyze how $G$
responds to various shocks. For example, Vegh and Vuletin (Reference Vegh and Vuletin2016) consider a Ramsey local government problem in a model analogous to the current one to account for the flypaper effect, which refers to the phenomenon that local government spending responds more significantly to unconditional grants from the national government than to local income. They show that the flypaper effect arises in their model only under distortionary taxation.Footnote 8 Indeed, if we assumed a Ramsey government in the current model, we could replicate their results: there is a flypaper effect with
$G$
responds to various shocks. For example, Vegh and Vuletin (Reference Vegh and Vuletin2016) consider a Ramsey local government problem in a model analogous to the current one to account for the flypaper effect, which refers to the phenomenon that local government spending responds more significantly to unconditional grants from the national government than to local income. They show that the flypaper effect arises in their model only under distortionary taxation.Footnote 8 Indeed, if we assumed a Ramsey government in the current model, we could replicate their results: there is a flypaper effect with $TR=0$
but no flypaper effect with
$TR=0$
but no flypaper effect with $\tau =0.$
However, since our main focus is on the government spending multiplier in this analysis, we assume that the government changes
$\tau =0.$
However, since our main focus is on the government spending multiplier in this analysis, we assume that the government changes $G$
exogenously, rather than optimizing it, in what follows.
$G$
exogenously, rather than optimizing it, in what follows.
In equilibrium, the resource constraint $Y=C+G$
and the conditions for labor supply and demand should be satisfied. Combining these results yields the following equation:
$Y=C+G$
and the conditions for labor supply and demand should be satisfied. Combining these results yields the following equation:
 \begin{equation} \left ( 1-\tau \right ) u^{\prime }\left ( Y-G\right ) =\frac{v^{\prime }\left ( L\right ) }{f^{\prime }\left ( L\right ) }\equiv \tilde{v}^{\prime }\left ( Y\right ), \end{equation}
where $\tilde{v}\left ( Y\right ) \equiv v\left ( f^{-1}\left ( Y\right ) \right )$
represents the (utility) cost of producing output
$\tilde{v}\left ( Y\right ) \equiv v\left ( f^{-1}\left ( Y\right ) \right )$
represents the (utility) cost of producing output $Y.$
It is trivial to verify
$Y.$
It is trivial to verify $\tilde{v}^{\prime }\left ( Y\right ) \gt 0$
and
$\tilde{v}^{\prime }\left ( Y\right ) \gt 0$
and $\tilde{v}^{\prime \prime }\left ( Y\right ) \lt 0$
using the properties of
$\tilde{v}^{\prime \prime }\left ( Y\right ) \lt 0$
using the properties of $v\left ( L\right )$
and
$v\left ( L\right )$
and $f\left ( L\right )$
. Equation (1) has only one endogenous variable
$f\left ( L\right )$
. Equation (1) has only one endogenous variable $Y$
with policy variables
$Y$
with policy variables $\tau$
and
$\tau$
and $G.$
Thus, we can use the equation to characterize the effects of
$G.$
Thus, we can use the equation to characterize the effects of $\tau$
and
$\tau$
and $G$
on
$G$
on $Y.$
First, total differentials of equation (1) with respect to
$Y.$
First, total differentials of equation (1) with respect to $\tau$
and
$\tau$
and $Y$
yields
$Y$
yields
 \begin{equation} \frac{\partial Y}{\partial \tau }=-\frac{u^{\prime }}{\tilde{v}^{\prime \prime }-\left ( 1-\tau \right ) u^{\prime \prime }}\lt 0. \end{equation}
This equation implies that the income tax rate $\tau$
has a negative impact on equilibrium output
$\tau$
has a negative impact on equilibrium output $Y.$
This appears to be intuitive because a large
$Y.$
This appears to be intuitive because a large $\tau$
discourages labor supply, thereby reducing output. We can also derive the government spending multiplier,
$\tau$
discourages labor supply, thereby reducing output. We can also derive the government spending multiplier, $m$
, from the total differentials of equation (1) with respect to
$m$
, from the total differentials of equation (1) with respect to $G$
and
$G$
and $Y$
.
$Y$
.
 \begin{equation*} m\equiv \frac {\partial Y}{\partial G}=\frac {-\left ( 1-\tau \right ) u^{\prime \prime }}{\tilde {v}^{\prime \prime }-\left ( 1-\tau \right ) u^{\prime \prime }}\end{equation*}
Moreover, because $1-\tau =\tilde{v}^{\prime }/u^{\prime }$
from equation (1), we can rewrite the above equation as
$1-\tau =\tilde{v}^{\prime }/u^{\prime }$
from equation (1), we can rewrite the above equation as
 \begin{equation} m=\frac{\eta _{u}}{\eta _{v}+\eta _{u}}=\frac{1}{\eta _{v}/\eta _{u}+1}, \end{equation}
where $\eta _{u}\equiv -Yu^{\prime \prime }/u^{\prime }\gt 0$
and
$\eta _{u}\equiv -Yu^{\prime \prime }/u^{\prime }\gt 0$
and $\eta _{v}\equiv Y\tilde{v}^{\prime \prime }/\tilde{v}^{\prime }\gt 0$
denote the elasticities of marginal utility
$\eta _{v}\equiv Y\tilde{v}^{\prime \prime }/\tilde{v}^{\prime }\gt 0$
denote the elasticities of marginal utility $u^{\prime }$
and marginal cost
$u^{\prime }$
and marginal cost $\tilde{v}^{\prime }$
with respect to
$\tilde{v}^{\prime }$
with respect to $Y$
.
$Y$
.
Equation (3) implies that the government spending multiplier is positive but less than one. Hence, the static neoclassical model predicts a smaller multiplier effect than the traditional Keynesian model. This difference arises because government purchases influence output through different channels in the neoclassical model. Specifically, an increase in $G$
has a negative wealth effect on households because, given
$G$
has a negative wealth effect on households because, given $C=Y-G$
, such fiscal expansion effectively removes resources from households. Hence, they reduce consumption but raise labor supply in response to fiscal expansion. In other words,
$C=Y-G$
, such fiscal expansion effectively removes resources from households. Hence, they reduce consumption but raise labor supply in response to fiscal expansion. In other words, $dG\gt 0$
leads to
$dG\gt 0$
leads to $dY\gt 0$
(because
$dY\gt 0$
(because $dL\gt 0$
) but
$dL\gt 0$
) but $dY\lt dG$
because
$dY\lt dG$
because $dC=dY-dG\lt 0$
. These results imply
$dC=dY-dG\lt 0$
. These results imply $0\lt m\lt 1$
, as suggested by equation (3). Interestingly, while consumption decreases under the static neoclassical model, it increases under the traditional Keynesian model.
$0\lt m\lt 1$
, as suggested by equation (3). Interestingly, while consumption decreases under the static neoclassical model, it increases under the traditional Keynesian model.
We also examine the impact of the income tax rate on the government spending multiplier using $\partial m/\partial \tau$
. Therefore, we decompose the derivative as follows.
$\partial m/\partial \tau$
. Therefore, we decompose the derivative as follows.
 \begin{equation*} \frac {\partial m}{\partial \tau }=\frac {\partial Y}{\partial \tau }\times \frac {\partial \left ( \eta _{v}/\eta _{u}\right ) }{\partial Y}\times \frac {dm}{d\left ( \eta _{v}/\eta _{u}\right ) }\end{equation*}
In this equation, $\partial Y/\partial \tau \lt 0$
from equation (2) and
$\partial Y/\partial \tau \lt 0$
from equation (2) and $dm/d\left ( \eta _{v}/\eta _{u}\right ) \lt 0$
from equation (3). Thus,
$dm/d\left ( \eta _{v}/\eta _{u}\right ) \lt 0$
from equation (3). Thus, $\partial m/\partial \tau$
should have the same sign as
$\partial m/\partial \tau$
should have the same sign as $\partial \left ( \eta _{v}/\eta _{u}\right ) /\partial Y$
in the model. Intuitively, the sign of
$\partial \left ( \eta _{v}/\eta _{u}\right ) /\partial Y$
in the model. Intuitively, the sign of $\partial \left ( \eta _{v}/\eta _{u}\right ) /\partial Y$
determines the magnitude of labor supply and consumption responses to changes in government purchases. To observe this, we suppose that
$\partial \left ( \eta _{v}/\eta _{u}\right ) /\partial Y$
determines the magnitude of labor supply and consumption responses to changes in government purchases. To observe this, we suppose that $\eta _{v}/\eta _{u}$
is small. In other words, the marginal cost
$\eta _{v}/\eta _{u}$
is small. In other words, the marginal cost $\tilde{v}^{\prime }$
is relatively inelastic whereas the marginal utility
$\tilde{v}^{\prime }$
is relatively inelastic whereas the marginal utility $u^{\prime }$
is relatively elastic. In this case, when government purchases rise, output increases significantly because the marginal cost
$u^{\prime }$
is relatively elastic. In this case, when government purchases rise, output increases significantly because the marginal cost $\tilde{v}^{\prime }$
increases relatively slowly, whereas consumption does not decrease significantly because the marginal utility
$\tilde{v}^{\prime }$
increases relatively slowly, whereas consumption does not decrease significantly because the marginal utility $u^{\prime }$
increases relatively rapidly. Consequently, the government spending multiplier is high when
$u^{\prime }$
increases relatively rapidly. Consequently, the government spending multiplier is high when $\eta _{v}/\eta _{u}$
is low. Then, we can conclude that
$\eta _{v}/\eta _{u}$
is low. Then, we can conclude that $\partial m/\partial \tau \gt 0$
is associated with
$\partial m/\partial \tau \gt 0$
is associated with $\partial \left ( \eta _{v}/\eta _{u}\right ) /\partial Y\gt 0$
because
$\partial \left ( \eta _{v}/\eta _{u}\right ) /\partial Y\gt 0$
because $\eta _{v}/\eta _{u}$
decreases as
$\eta _{v}/\eta _{u}$
decreases as $\tau$
increases through a decrease in
$\tau$
increases through a decrease in $Y$
by equation (2). By contrast,
$Y$
by equation (2). By contrast, $\partial m/\partial \tau \lt 0$
if
$\partial m/\partial \tau \lt 0$
if $\partial \left ( \eta _{v}/\eta _{u}\right ) /\partial Y\lt 0$
because a large value of
$\partial \left ( \eta _{v}/\eta _{u}\right ) /\partial Y\lt 0$
because a large value of $\tau$
results in a large value of
$\tau$
results in a large value of $\eta _{v}/\eta _{u}.$
The sign of $\partial m/\partial \tau$
is generally ambiguous because
$\partial m/\partial \tau$
is generally ambiguous because $\partial \left ( \eta _{v}/\eta _{u}\right ) /\partial Y$
can take any sign, depending on the form of the utility and production functions. However,
$\partial \left ( \eta _{v}/\eta _{u}\right ) /\partial Y$
can take any sign, depending on the form of the utility and production functions. However, $\partial m/\partial \tau \gt 0$
may arise realistically in the static neoclassical model, even though it is the opposite of the prediction of the traditional Keynesian model. To demonstrate this, we present the following group of widely used functional forms of
$\partial m/\partial \tau \gt 0$
may arise realistically in the static neoclassical model, even though it is the opposite of the prediction of the traditional Keynesian model. To demonstrate this, we present the following group of widely used functional forms of $u,\ v,$
and
$u,\ v,$
and $f$
that give rise to
$f$
that give rise to $\partial m/\partial \tau \gt 0$
.
$\partial m/\partial \tau \gt 0$
.
 \begin{equation} \left . \begin{array} [c]{l}u\left ( C\right ) =\frac{C^{1-\sigma }-1}{1-\sigma },\ \ \sigma \gt 0\\[5pt] v_{1}\left ( L\right ) =-\frac{\xi }{1-\phi }\left ( 1-L\right ) ^{1-\phi },\ \ \phi \gt 0,\ \xi \gt 0,\ L\in \left [ 0,1\right ] \\[5pt] v_{2}\left ( L\right ) =\frac{\xi }{1+\phi }L^{1+\phi },\ \ \phi \gt 0,\ \xi \gt 0,\ L\geq 0\\[5pt] f\left ( L\right ) =L^{\theta },\ 0\lt \theta \lt 1 \end{array} \right . \end{equation}
Each of these functions has been widely used in economics as a standard form of the utility and production functions. The consumption utility function $u\left ( C\right )$
and one of the labor disutility functions,
$u\left ( C\right )$
and one of the labor disutility functions, $v_{1}\left ( L\right )$
, exhibit constant relative risk aversion. The other labor disutility function
$v_{1}\left ( L\right )$
, exhibit constant relative risk aversion. The other labor disutility function $v_{2}\left ( L\right )$
is characterized by the constant Frisch elasticity of labor supply. The production function is a standard concave power function.
$v_{2}\left ( L\right )$
is characterized by the constant Frisch elasticity of labor supply. The production function is a standard concave power function.
Using algebra, we can calculate $\eta _{v}/\eta _{u}$
as implied by the functions in equation (4) as follows.
$\eta _{v}/\eta _{u}$
as implied by the functions in equation (4) as follows.
 \begin{equation*} \frac {\eta _{v}}{\eta _{u}}=\left \{ \begin {array} [c]{cc}\frac {1}{\sigma }\left ( \frac {\phi }{\alpha }\frac {Y^{1/\theta }}{1-Y^{1/\theta }}+\frac {1}{\theta }-1\right ) \left ( 1-\frac {G}{Y}\right ) \text { } & \text {if }v\left ( L\right ) =v_{1}\left ( L\right ) \\[5pt] \left ( \frac {1-\theta +\phi }{\theta \sigma }\right ) \left ( 1-\frac {G}{Y}\right ) & \text {if }v\left ( L\right ) =v_{2}\left ( L\right ) \end {array} \right . \end{equation*}
In both cases, $\eta _{v}/\eta _{u}$
increases with
$\eta _{v}/\eta _{u}$
increases with $Y$
. Consequently,
$Y$
. Consequently, $\partial m/\partial \tau \gt 0$
with functions in equation (4). In other words, the government spending multiplier increases with the income tax rate if the economy is well represented by these functions. Admittedly, this result does not prove that the income tax rate has a positive impact on the multiplier effect. However, it may suggest that the positive impact of the income tax rate on the government spending multiplier can be a realistic possibility because it is based on the standard utility and production functions that can account for numerous macroeconomic phenomena. Indeed, in our empirical analysis, we find that an unanticipated increase in government purchases tends to have more significant and positive effects on output when the tax-GDP ratio is high. This finding may corroborate our theoretical result in the static neoclassical model with the functions in equation (4).
$\partial m/\partial \tau \gt 0$
with functions in equation (4). In other words, the government spending multiplier increases with the income tax rate if the economy is well represented by these functions. Admittedly, this result does not prove that the income tax rate has a positive impact on the multiplier effect. However, it may suggest that the positive impact of the income tax rate on the government spending multiplier can be a realistic possibility because it is based on the standard utility and production functions that can account for numerous macroeconomic phenomena. Indeed, in our empirical analysis, we find that an unanticipated increase in government purchases tends to have more significant and positive effects on output when the tax-GDP ratio is high. This finding may corroborate our theoretical result in the static neoclassical model with the functions in equation (4).
2.2 Dynamic neoclassical model with labor and capital
In this subsection, we consider a dynamic neoclassical model with capital and labor following Baxter and King (Reference Baxter and King1993). This is more general than the static neoclassical model because it has more channels through which government purchases can influence output. Even in this general dynamic model, we quantitatively show that the income tax rate tends to have a positive impact on output responses to a rise in government purchases.
2.2.1 Model setup
The economy is composed of households, firms, and a government. First, homogeneous households choose consumption $C_{t}$
, labor
$C_{t}$
, labor $L_{t}\in \left [ 0,1\right ]$
, and capital
$L_{t}\in \left [ 0,1\right ]$
, and capital $K_{t+1}$
in period
$K_{t+1}$
in period $t$
to maximize the following sum of utilities:
$t$
to maximize the following sum of utilities:
 \begin{equation*} \mathbb {E}\left [ \sum _{t=0}^{\infty }\beta ^{t}\left [ \ln C_{t}+\xi \ln \left ( 1-L_{t}\right ) \right ] \right ], \ \ \beta \in \left ( 0,1\right ), \ \xi \gt 0, \end{equation*}
where $\ln C_{t}$
and
$\ln C_{t}$
and $\ln \left ( 1-L_{t}\right )$
represent the utilities from consumption
$\ln \left ( 1-L_{t}\right )$
represent the utilities from consumption $C_{t}$
and leisure
$C_{t}$
and leisure $\left ( 1-L_{t}\right ), $
respectively. Notice that both functions have the form given in equation (4) for
$\left ( 1-L_{t}\right ), $
respectively. Notice that both functions have the form given in equation (4) for $dm/d\tau \gt 0$
in a static neoclassical model. Household choices
$dm/d\tau \gt 0$
in a static neoclassical model. Household choices $\left \{ C_{t},L_{t},K_{t+1}\right \}$
should satisfy the following budget constraint.
$\left \{ C_{t},L_{t},K_{t+1}\right \}$
should satisfy the following budget constraint.
 \begin{equation*} C_{t}+K_{t+1}=\left ( 1-\tau \right ) \left ( W_{t}L_{t}+R_{t}^{k}K_{t}\right ) +\left ( 1-\delta \right ) K_{t}+TR_{t}, \end{equation*}
where $W_{t}$
and
$W_{t}$
and $R_{t}^{k}$
denote the wage and rental price of capital in period
$R_{t}^{k}$
denote the wage and rental price of capital in period $t$
. As before,
$t$
. As before, $\tau \in \left ( 0,1\right )$
and
$\tau \in \left ( 0,1\right )$
and $\ TR_{t}$
are the income tax rate and lump-sum government transfers in period
$\ TR_{t}$
are the income tax rate and lump-sum government transfers in period $t$
. Finally,
$t$
. Finally, $\delta \in \left [ 0,1\right ]$
is the depreciation rate of capital.
$\delta \in \left [ 0,1\right ]$
is the depreciation rate of capital.
On the supply side, homogeneous firms choose $L_{t}$
and
$L_{t}$
and $K_{t}$
to solve the following problem:
$K_{t}$
to solve the following problem:
 \begin{equation*} \max _{\left \{ K_{t},L_{t}\right \} }\left [ K_{t}^{\alpha }L_{t}^{1-\alpha }-W_{t}L_{t}-R_{t}^{k}K_{t}\right ], \ \ \alpha \in \left ( 0,1\right ), \end{equation*}
where $Y_{t}=K_{t}^{\alpha }L_{t}^{1-\alpha }$
denotes the production function. Finally, the government collects income tax, purchases goods
$Y_{t}=K_{t}^{\alpha }L_{t}^{1-\alpha }$
denotes the production function. Finally, the government collects income tax, purchases goods $G_{t},$
and provides lump-sum transfers
$G_{t},$
and provides lump-sum transfers $TR_{t}$
to households in period
$TR_{t}$
to households in period $t$
. Hence, the government budget constraint can be written as
$t$
. Hence, the government budget constraint can be written as
 \begin{equation*} G_{t}+TR_{t}=\tau \left ( W_{t}L_{t}+R_{t}^{k}K_{t}\right ) . \end{equation*}
Note that $TR_{t}$
can be interpreted as the government budget surplus.
$TR_{t}$
can be interpreted as the government budget surplus.
The competitive equilibrium of this economy is characterized by the following equations.
 \begin{align} \xi \frac{C_{t}}{1-L_{t}}=\left ( 1-\tau \right ) \left ( 1-\alpha \right ) K_{t}^{\alpha }L_{t}^{-\alpha } \end{align}
 \begin{align} \frac{1}{C_{t}}=\beta \mathbb{E}_{t}\left [ \frac{1}{C_{t+1}}\left \{ 1-\delta +\left ( 1-\tau \right ) \alpha K_{t+1}^{\alpha -1}L_{t+1}^{1-\alpha }\right \} \right ] \end{align}
 \begin{align} C_{t}+G_{t}+K_{t+1}=K_{t}^{\alpha }L_{t}^{1-\alpha }+\left ( 1-\delta \right ) K_{t} \end{align}
We derive equation (5) by combining the first-order conditions for labor supply and demand. Similarly, we obtain equation (6) from the households’ intertemporal Euler equation and condition for capital demand. In addition, equation (7) is the resource constraint or goods-market-clearing condition that should hold in competitive equilibrium. In the next subsections, we characterize the economy using equilibrium conditions (5)–(7) given government policy $\left \{ \tau, G_{t}\right \}$
.
$\left \{ \tau, G_{t}\right \}$
.
2.2.2 The effects of a permanent fiscal expansion in the steady state
We begin by analyzing the effects of a permanent rise in government purchases on output and other steady-state variables. This exercise could be interpreted as a generalization of the static neoclassical model, as the dynamic model incorporates both the intratemporal and intertemporal responses of economic agents. In the steady state, equilibrium conditions (5)–(7) are simplified as follows:
 \begin{align} \xi \frac{C^{\ast }}{1-L^{\ast }}=\left ( 1-\tau \right ) \left ( 1-\alpha \right ) \left ( K^{\ast }\right ) ^{\alpha }\left ( L^{\ast }\right ) ^{-\alpha }, \end{align}
 \begin{align} 1=&\; \beta \left [ 1-\delta +\alpha \left ( 1-\tau \right ) \left ( K^{\ast }\right ) ^{\alpha -1}\left ( L^{\ast }\right ) ^{1-\alpha }\right ], \\& C^{\ast }+G^{\ast }+\delta K^{\ast }=\left ( K^{\ast }\right ) ^{\alpha }\left ( L^{\ast }\right ) ^{1-\alpha },\nonumber \end{align}
where $X^{\ast }$
denotes the steady-state value of a variable
$X^{\ast }$
denotes the steady-state value of a variable $X_{t}$
. For any policy mix
$X_{t}$
. For any policy mix $\left ( \tau, G^{\ast }\right ), $
we find
$\left ( \tau, G^{\ast }\right ), $
we find $\left ( C^{\ast },K^{\ast },L^{\ast },Y^{\ast }\right )$
from those conditions and the production function
$\left ( C^{\ast },K^{\ast },L^{\ast },Y^{\ast }\right )$
from those conditions and the production function $Y^{\ast }=\left ( K^{\ast }\right ) ^{\alpha }\left ( L^{\ast }\right ) ^{1-\alpha }$
.
$Y^{\ast }=\left ( K^{\ast }\right ) ^{\alpha }\left ( L^{\ast }\right ) ^{1-\alpha }$
.
We can also obtain the derivatives of $\left ( C^{\ast },K^{\ast },L^{\ast },Y^{\ast }\right )$
with respect to
$\left ( C^{\ast },K^{\ast },L^{\ast },Y^{\ast }\right )$
with respect to $G^{\ast }$
from the total differentials of steady-state equilibrium conditions. Our primary interest is in
$G^{\ast }$
from the total differentials of steady-state equilibrium conditions. Our primary interest is in $\partial Y^{\ast }/\partial G^{\ast }$
, denoted by
$\partial Y^{\ast }/\partial G^{\ast }$
, denoted by $m^{\ast }.$
This can be interpreted as a long-run government spending multiplier, because it represents the long-run effect of a permanent rise in government purchases on steady-state output. Appendix A shows,
$m^{\ast }.$
This can be interpreted as a long-run government spending multiplier, because it represents the long-run effect of a permanent rise in government purchases on steady-state output. Appendix A shows, $m^{\ast }$
is expressed in terms of the income tax rate
$m^{\ast }$
is expressed in terms of the income tax rate $\tau$
and other model parameters as follows:
$\tau$
and other model parameters as follows:
 \begin{equation} m^{\ast }=\frac{1}{1+\psi \left ( 1-\tau \right ) }, \ \text{with }\,\psi \equiv \frac{1-\alpha }{\xi }-\frac{\delta \alpha }{\beta ^{-1}-1+\delta }. \end{equation}
The properties of $m^{\ast }$
depend crucially on
$m^{\ast }$
depend crucially on $\psi$
, that is, the coefficient on
$\psi$
, that is, the coefficient on $\left ( 1-\tau \right )$
. If
$\left ( 1-\tau \right )$
. If $\psi \gt 0$
, then
$\psi \gt 0$
, then $\partial m^{\ast }/\partial \tau \gt 0$
and
$\partial m^{\ast }/\partial \tau \gt 0$
and $0\lt m^{\ast }\lt 1$
. In this case,
$0\lt m^{\ast }\lt 1$
. In this case, $m^{\ast }$
exhibits qualitative properties similar to those of
$m^{\ast }$
exhibits qualitative properties similar to those of $m$
in equation (3) into a static neoclassical model.Footnote 9 By contrast, if
$m$
in equation (3) into a static neoclassical model.Footnote 9 By contrast, if $\psi \lt 0$
, then
$\psi \lt 0$
, then $\partial m^{\ast }/\partial \tau \lt 0$
and
$\partial m^{\ast }/\partial \tau \lt 0$
and $m^{\ast }\gt 1$
. In this case,
$m^{\ast }\gt 1$
. In this case, $m^{\ast }$
has properties similar to those of the government spending multiplier in the traditional Keynesian model.
$m^{\ast }$
has properties similar to those of the government spending multiplier in the traditional Keynesian model.
In equation (10), the sign of $\psi$
is primarily determined by
$\psi$
is primarily determined by $\xi$
because there are standard values of
$\xi$
because there are standard values of $\alpha$
(capital share in GDP),
$\alpha$
(capital share in GDP), $\beta$
(discount factor), and
$\beta$
(discount factor), and $\delta$
(depreciation rate of capital) in the literature. Specifically, let us define
$\delta$
(depreciation rate of capital) in the literature. Specifically, let us define $\bar{\xi }$
as the value of
$\bar{\xi }$
as the value of $\xi$
corresponding to
$\xi$
corresponding to $\psi =0$
, given the values of
$\psi =0$
, given the values of $\left ( \alpha, \beta, \delta \right )$
. From equation (10), we obtain
$\left ( \alpha, \beta, \delta \right )$
. From equation (10), we obtain $\bar{\xi }$
as follows:
$\bar{\xi }$
as follows:
 \begin{equation} \bar{\xi }\equiv \frac{\left ( 1-\alpha \right ) (\beta ^{-1}-1+\delta )}{\alpha \delta }. \end{equation}
Then, $\xi \lt \bar{\xi }$
is required for
$\xi \lt \bar{\xi }$
is required for $\psi \gt 0$
because
$\psi \gt 0$
because $\psi$
decreases in
$\psi$
decreases in $\xi$
. This condition is likely to be satisfied by realistic parameter values. It should be noted that the equilibrium labor
$\xi$
. This condition is likely to be satisfied by realistic parameter values. It should be noted that the equilibrium labor $L^{\ast }$
tends to decrease with
$L^{\ast }$
tends to decrease with $\xi$
because the parameter represents the importance of leisure in the utility function. However, if
$\xi$
because the parameter represents the importance of leisure in the utility function. However, if $\xi \geq \bar{\xi }$
with standard values of
$\xi \geq \bar{\xi }$
with standard values of $\left ( \alpha, \beta, \delta \right )$
,
$\left ( \alpha, \beta, \delta \right )$
, $L^{\ast }$
tends to be unrealistically low. Thus, the value of
$L^{\ast }$
tends to be unrealistically low. Thus, the value of $\xi$
is likely to be smaller than
$\xi$
is likely to be smaller than $\bar{\xi }$
to generate an empirically plausible
$\bar{\xi }$
to generate an empirically plausible $L^{\ast }$
. In other words, the condition
$L^{\ast }$
. In other words, the condition $\psi \gt 0$
tends to be satisfied in the steady state.
$\psi \gt 0$
tends to be satisfied in the steady state.
To illustrate these results, we simulate the model using realistic parameter values. To this end, we choose $\alpha =0.33,\ \beta =0.96$
, and
$\alpha =0.33,\ \beta =0.96$
, and $\delta =0.1$
because we interpret one model period as one year. These parameter values are widely used in the literature. We set
$\delta =0.1$
because we interpret one model period as one year. These parameter values are widely used in the literature. We set $\xi$
depending on fiscal policy
$\xi$
depending on fiscal policy $\left ( \tau, G^{\ast }\right )$
so that
$\left ( \tau, G^{\ast }\right )$
so that $L^{\ast }=0.33$
may be attained in the steady state under any given combination of
$L^{\ast }=0.33$
may be attained in the steady state under any given combination of $\tau$
and
$\tau$
and $G^{\ast }.$
Then, we compare
$G^{\ast }.$
Then, we compare $\xi$
with the threshold
$\xi$
with the threshold $\bar{\xi }=2.876,$
which can be calculated from equation (11). We also examine the behavior of the long-run multiplier
$\bar{\xi }=2.876,$
which can be calculated from equation (11). We also examine the behavior of the long-run multiplier $m^{\ast }$
and related variables from the simulated model.
$m^{\ast }$
and related variables from the simulated model.
To assess the plausibility of $\xi \lt \bar{\xi }$
through this simulation, we need to consider a wide range of fiscal policy (e.g., from a small government to a big one). Therefore, we choose 20%, 40%, and 60%, as values of
$\xi \lt \bar{\xi }$
through this simulation, we need to consider a wide range of fiscal policy (e.g., from a small government to a big one). Therefore, we choose 20%, 40%, and 60%, as values of $\tau .$
These values can represent government size observed in the real world. For each value of
$\tau .$
These values can represent government size observed in the real world. For each value of $\tau$
, we choose
$\tau$
, we choose $G^{\ast }$
ranging from 95% of total tax revenue
$G^{\ast }$
ranging from 95% of total tax revenue $\tau Y^{\ast }$
to 120%. As a result, the government deficit to GDP ratio falls on the interval
$\tau Y^{\ast }$
to 120%. As a result, the government deficit to GDP ratio falls on the interval $[{-}5\%,20\%]$
in the simulation. As such, the combinations of
$[{-}5\%,20\%]$
in the simulation. As such, the combinations of $\tau$
and
$\tau$
and $G^{\ast }$
can capture the various types of fiscal policy observed in the real world.
$G^{\ast }$
can capture the various types of fiscal policy observed in the real world.
The simulation results are shown in Fig. 1. In Panel (a), we display $\xi$
that can yield
$\xi$
that can yield $L^{\ast }=0.33$
for each combination of
$L^{\ast }=0.33$
for each combination of $\tau$
and
$\tau$
and $G^{\ast }.$
The figures in all other panels are drawn for the various values of
$G^{\ast }.$
The figures in all other panels are drawn for the various values of $\tau$
and
$\tau$
and $G^{\ast }$
and corresponding values of
$G^{\ast }$
and corresponding values of $\xi .$
In Panel (a), we can clearly see that
$\xi .$
In Panel (a), we can clearly see that $\xi \lt \bar{\xi }$
, which is the condition for
$\xi \lt \bar{\xi }$
, which is the condition for $\psi \gt 0$
, is satisfied for most values of
$\psi \gt 0$
, is satisfied for most values of $\tau$
and
$\tau$
and $G^{\ast }$
. We observe
$G^{\ast }$
. We observe $\xi \gt \bar{\xi }$
only when both
$\xi \gt \bar{\xi }$
only when both $\tau$
and
$\tau$
and $G^{\ast }$
are unrealistically large. By equation (10), the result implies
$G^{\ast }$
are unrealistically large. By equation (10), the result implies $\psi \gt 0$
,
$\psi \gt 0$
, $\ 0\lt m^{\ast }\lt 1$
, and
$\ 0\lt m^{\ast }\lt 1$
, and $\partial m^{\ast }/\partial \tau \gt 0$
in cases where
$\partial m^{\ast }/\partial \tau \gt 0$
in cases where $\xi \lt \bar{\xi }$
, as shown in Panels (b)–(d) of Fig. 1. These results are consistent with the properties of the multiplier
$\xi \lt \bar{\xi }$
, as shown in Panels (b)–(d) of Fig. 1. These results are consistent with the properties of the multiplier $m$
in equation (3) in the static neoclassical model. They suggest that
$m$
in equation (3) in the static neoclassical model. They suggest that $m^{\ast }$
tends to be smaller than one, but increases in
$m^{\ast }$
tends to be smaller than one, but increases in $\tau$
in the steady states under the realistic types of fiscal policy. Moreover, we observe a negative wealth effect of an increase in government purchases in the steady states of the dynamic neoclassical model. As discussed previously, such fiscal expansion reduces consumption, but raises labor supply in the static neoclassical model through the negative wealth effect. Indeed, Fig. 1 shows that
$\tau$
in the steady states under the realistic types of fiscal policy. Moreover, we observe a negative wealth effect of an increase in government purchases in the steady states of the dynamic neoclassical model. As discussed previously, such fiscal expansion reduces consumption, but raises labor supply in the static neoclassical model through the negative wealth effect. Indeed, Fig. 1 shows that $\partial L^{\ast }/\partial G^{\ast }\gt 0$
in Panel (e) and
$\partial L^{\ast }/\partial G^{\ast }\gt 0$
in Panel (e) and $\partial C^{\ast }/\partial G^{\ast }\lt 0$
in Panel (f) regardless of
$\partial C^{\ast }/\partial G^{\ast }\lt 0$
in Panel (f) regardless of $\tau$
and
$\tau$
and $G^{\ast }$
in the steady states of the dynamic model.Footnote 10
$G^{\ast }$
in the steady states of the dynamic model.Footnote 10
Long-run effects of a permanent rise in government purchases. This figure displays the steady-state outcomes of the simulated dynamic neoclassical model with labor and capital as discussed in Subsection 2.2. In all panels, the horizontal axis represents government purchases $G^{\ast }$
as a percentage of total tax revenue
$G^{\ast }$
as a percentage of total tax revenue $ \tau Y^{\ast }.$
Also, in all panels, for each combination of
$ \tau Y^{\ast }.$
Also, in all panels, for each combination of $ \tau$
and
$ \tau$
and $G^{\ast },$
we choose a different
$G^{\ast },$
we choose a different $ \xi$
so that
$ \xi$
so that $L^{\ast }=0.33$
may be attained. Such
$L^{\ast }=0.33$
may be attained. Such $ \xi$
is displayed for all combinations of
$ \xi$
is displayed for all combinations of $ \tau$
and
$ \tau$
and $G^{\ast }$
in panel (a). In other panels, we display
$G^{\ast }$
in panel (a). In other panels, we display $ \psi, $
defined in equation (10), in panel (b);
$ \psi, $
defined in equation (10), in panel (b); $m^{\ast }=\partial Y^{\ast }/\partial G^{\ast },$
also defined in equation (10), in panel (c);
$m^{\ast }=\partial Y^{\ast }/\partial G^{\ast },$
also defined in equation (10), in panel (c); $\partial m^{\ast }/\partial \tau$
in panel (d);
$\partial m^{\ast }/\partial \tau$
in panel (d); $\partial L^{\ast }/\partial G^{\ast }$
in panel (e); and
$\partial L^{\ast }/\partial G^{\ast }$
in panel (e); and $\partial C^{\ast }/\partial G^{\ast }$
in panel (f). The black dashed line in panel (a) represents a threshold value
$\partial C^{\ast }/\partial G^{\ast }$
in panel (f). The black dashed line in panel (a) represents a threshold value $\bar{ \xi }$
defined in equation (11). If
$\bar{ \xi }$
defined in equation (11). If $ \xi \lt \bar{ \xi },$ $ \psi \gt 0$
in panel (b),
$ \psi \gt 0$
in panel (b), $m^{\ast }\lt 1$
in panel (c), and
$m^{\ast }\lt 1$
in panel (c), and $\partial m^{\ast }/\partial \tau \gt 0$
in panel (d). See the equations and related discussion in Subsection 2.2.2 for details.
$\partial m^{\ast }/\partial \tau \gt 0$
in panel (d). See the equations and related discussion in Subsection 2.2.2 for details.

Overall, the simulation results from the steady state of the dynamic neoclassical model tend to confirm the analytical results from the static neoclassical model. In addition, the main simulation results, such as $m^{\ast }\in \left ( 0,1\right )$
and
$m^{\ast }\in \left ( 0,1\right )$
and $\partial m^{\ast }/\partial \tau \gt 0$
are quite robust, because they are shown in Fig. 1 for almost all values of
$\partial m^{\ast }/\partial \tau \gt 0$
are quite robust, because they are shown in Fig. 1 for almost all values of $\tau$
and
$\tau$
and $G^{\ast }$
. These results suggest that a relatively small multiplier effect and the positive effect of the income tax rate on the multiplier can be realistic outcomes of an increase in government purchases and not just theoretical possibilities.
$G^{\ast }$
. These results suggest that a relatively small multiplier effect and the positive effect of the income tax rate on the multiplier can be realistic outcomes of an increase in government purchases and not just theoretical possibilities.
2.2.3 Impulse responses to a one-time fiscal expansion
In the second exercise using the dynamic neoclassical model, we quantify the effects of an unanticipated one-time increase in government purchases. To this end, we characterize the impulse responses of macroeconomic variables to one-time fiscal expansion. In particular, we focus on the magnitude of the impulse responses of output and the impact of the income tax rate on these impulse responses. The results in this subsection can be compared with the empirical results for the government spending multipliers in Section 3.
We log-linearize the equilibrium conditions (5)–(7) and production function $Y_{t}=K_{t}^{\alpha }L_{t}^{1-\alpha }$
around the steady state:
$Y_{t}=K_{t}^{\alpha }L_{t}^{1-\alpha }$
around the steady state:
 \begin{align*} c_{t} & =\alpha k_{t}-\left ( \alpha +\frac{L^{\ast }}{1-L^{\ast }}\right ) l_{t},\\ c_{t} & =\mathbb{E}_{t}\left [ c_{t+1}+\left \{ 1-\beta \left ( 1-\delta \right ) \right \} \left ( 1-\alpha \right ) \left ( k_{t+1}-l_{t+1}\right ) \right ], \\ s_{K}k_{t+1} & =\left [ \alpha +\left ( 1-\delta \right ) s_{K}\right ] k_{t}+\left ( 1-\alpha \right ) l_{t}-s_{C}c_{t}-s_{G}g_{t},\\ y_{t} & =\alpha k_{t}+\left ( 1-\alpha \right ) l_{t}, \end{align*}
where $x_{t}\equiv \ln X_{t}-\ln X^{\ast }$
and
$x_{t}\equiv \ln X_{t}-\ln X^{\ast }$
and $s_{X}\equiv X^{\ast }/Y^{\ast }$
for each variable
$s_{X}\equiv X^{\ast }/Y^{\ast }$
for each variable $X_{t}$
with steady-state output
$X_{t}$
with steady-state output $Y^{\ast }$
. Government purchases are assumed to evolve as an AR(1) process as follows:
$Y^{\ast }$
. Government purchases are assumed to evolve as an AR(1) process as follows:
 \begin{equation} g_{t}=\rho g_{t-1}+\nu _{t},\ \ \rho \in \left ( 0,1\right ), \end{equation}
where $g_{t}\equiv \ln \left ( G_{t}/G^{\ast }\right )$
and
$g_{t}\equiv \ln \left ( G_{t}/G^{\ast }\right )$
and $\nu _{t}$
is an i.i.d. shock. For the quantitative analysis, we assume
$\nu _{t}$
is an i.i.d. shock. For the quantitative analysis, we assume $\rho =0.7$
. In addition, we choose
$\rho =0.7$
. In addition, we choose $\alpha =0.33,\ \beta =0.96,$
and
$\alpha =0.33,\ \beta =0.96,$
and $\delta =0.1$
as in the steady-state analysis. For fiscal policy, we consider the two values of
$\delta =0.1$
as in the steady-state analysis. For fiscal policy, we consider the two values of $\tau$
, 0.2 and 0.4, to examine the role of the income tax rate. For each
$\tau$
, 0.2 and 0.4, to examine the role of the income tax rate. For each $\tau$
, we choose
$\tau$
, we choose $G^{\ast }$
such that the government budget is balanced in the steady state (i.e.,
$G^{\ast }$
such that the government budget is balanced in the steady state (i.e., $G^{\ast }=\tau Y^{\ast }$
or
$G^{\ast }=\tau Y^{\ast }$
or $TR^{\ast }=0$
). Subsequently, we set
$TR^{\ast }=0$
). Subsequently, we set $\xi$
such that
$\xi$
such that $L^{\ast }=0.33$
can be obtained in the steady state for each combination of
$L^{\ast }=0.33$
can be obtained in the steady state for each combination of $\tau$
and
$\tau$
and $G^{\ast }$
.
$G^{\ast }$
.
To obtain impulse responses, we assume that each economy has been in a balanced-budget steady state up to period $-1$
. However, a one-time positive shock occurs to government purchases in period 0, such that
$-1$
. However, a one-time positive shock occurs to government purchases in period 0, such that $\nu _{t}=1$
for
$\nu _{t}=1$
for $t=0$
and
$t=0$
and $\nu _{t}=0$
for
$\nu _{t}=0$
for $t\geq 1$
in equation (12). In other words, government purchases increase unexpectedly by 1% in period 0 and change in subsequent periods according to equation (12). Given the process for
$t\geq 1$
in equation (12). In other words, government purchases increase unexpectedly by 1% in period 0 and change in subsequent periods according to equation (12). Given the process for $g_{t}$
and parameter values, we can calculate the impulse responses
$g_{t}$
and parameter values, we can calculate the impulse responses $\left ( c_{t},l_{t},k_{t},y_{t}\right )$
using log-linearized equilibrium conditions. However, the impulse responses of output are not government spending multipliers because both
$\left ( c_{t},l_{t},k_{t},y_{t}\right )$
using log-linearized equilibrium conditions. However, the impulse responses of output are not government spending multipliers because both $g_{t}$
and
$g_{t}$
and $y_{t}$
are logarithmic. Hence, we calculate the cumulative output responses as follows:
$y_{t}$
are logarithmic. Hence, we calculate the cumulative output responses as follows:
 \begin{equation*} M^{h}\equiv \frac {\sum _{t=0}^{h}\left ( Y_{t}-Y^{\ast }\right ) }{\sum _{t=0}^{h}\left ( G_{t}-G^{\ast }\right ) }\end{equation*}
Intuitively, $M^{h}$
represents the total change in output over
$M^{h}$
represents the total change in output over $h$
periods, due to the total change in government purchases. In this sense, the cumulative responses can be interpreted as cumulative government spending multipliers.
$h$
periods, due to the total change in government purchases. In this sense, the cumulative responses can be interpreted as cumulative government spending multipliers.
Figure 2 presents the simulated output, labor, and consumption responses. In Panels (a) and (b), the characteristics of the impulse and cumulative responses of output are consistent with the main theoretical results. First, a positive shock to government purchases can stimulate output. However, all impulse responses are smaller than 0.2 in Panel (a), and the cumulative responses are far below one in Panel (b). These results indicate that government spending multipliers are smaller than one. Another interesting finding is that the negative wealth effect of fiscal expansion is also observed in impulse responses. In Panels (c) and (d) of Fig. 2, labor supply increases, whereas consumption decreases in response to a positive shock to government purchases. As previously discussed, these are characteristics of the negative wealth effect of fiscal expansion.
Simulated impulse responses to a one-time fiscal expansion. Panels (a), (c), and (d) display the impulse responses of log of output, labor, and consumption to an unexpected one-time 1% rise in government purchases in period 0. Panel (b) shows the cumulative responses of output. All panels are based on the calibrated dynamic neoclassical model. Refer to discussion in Subsection 2.2 for details regarding the model specification and calibration.
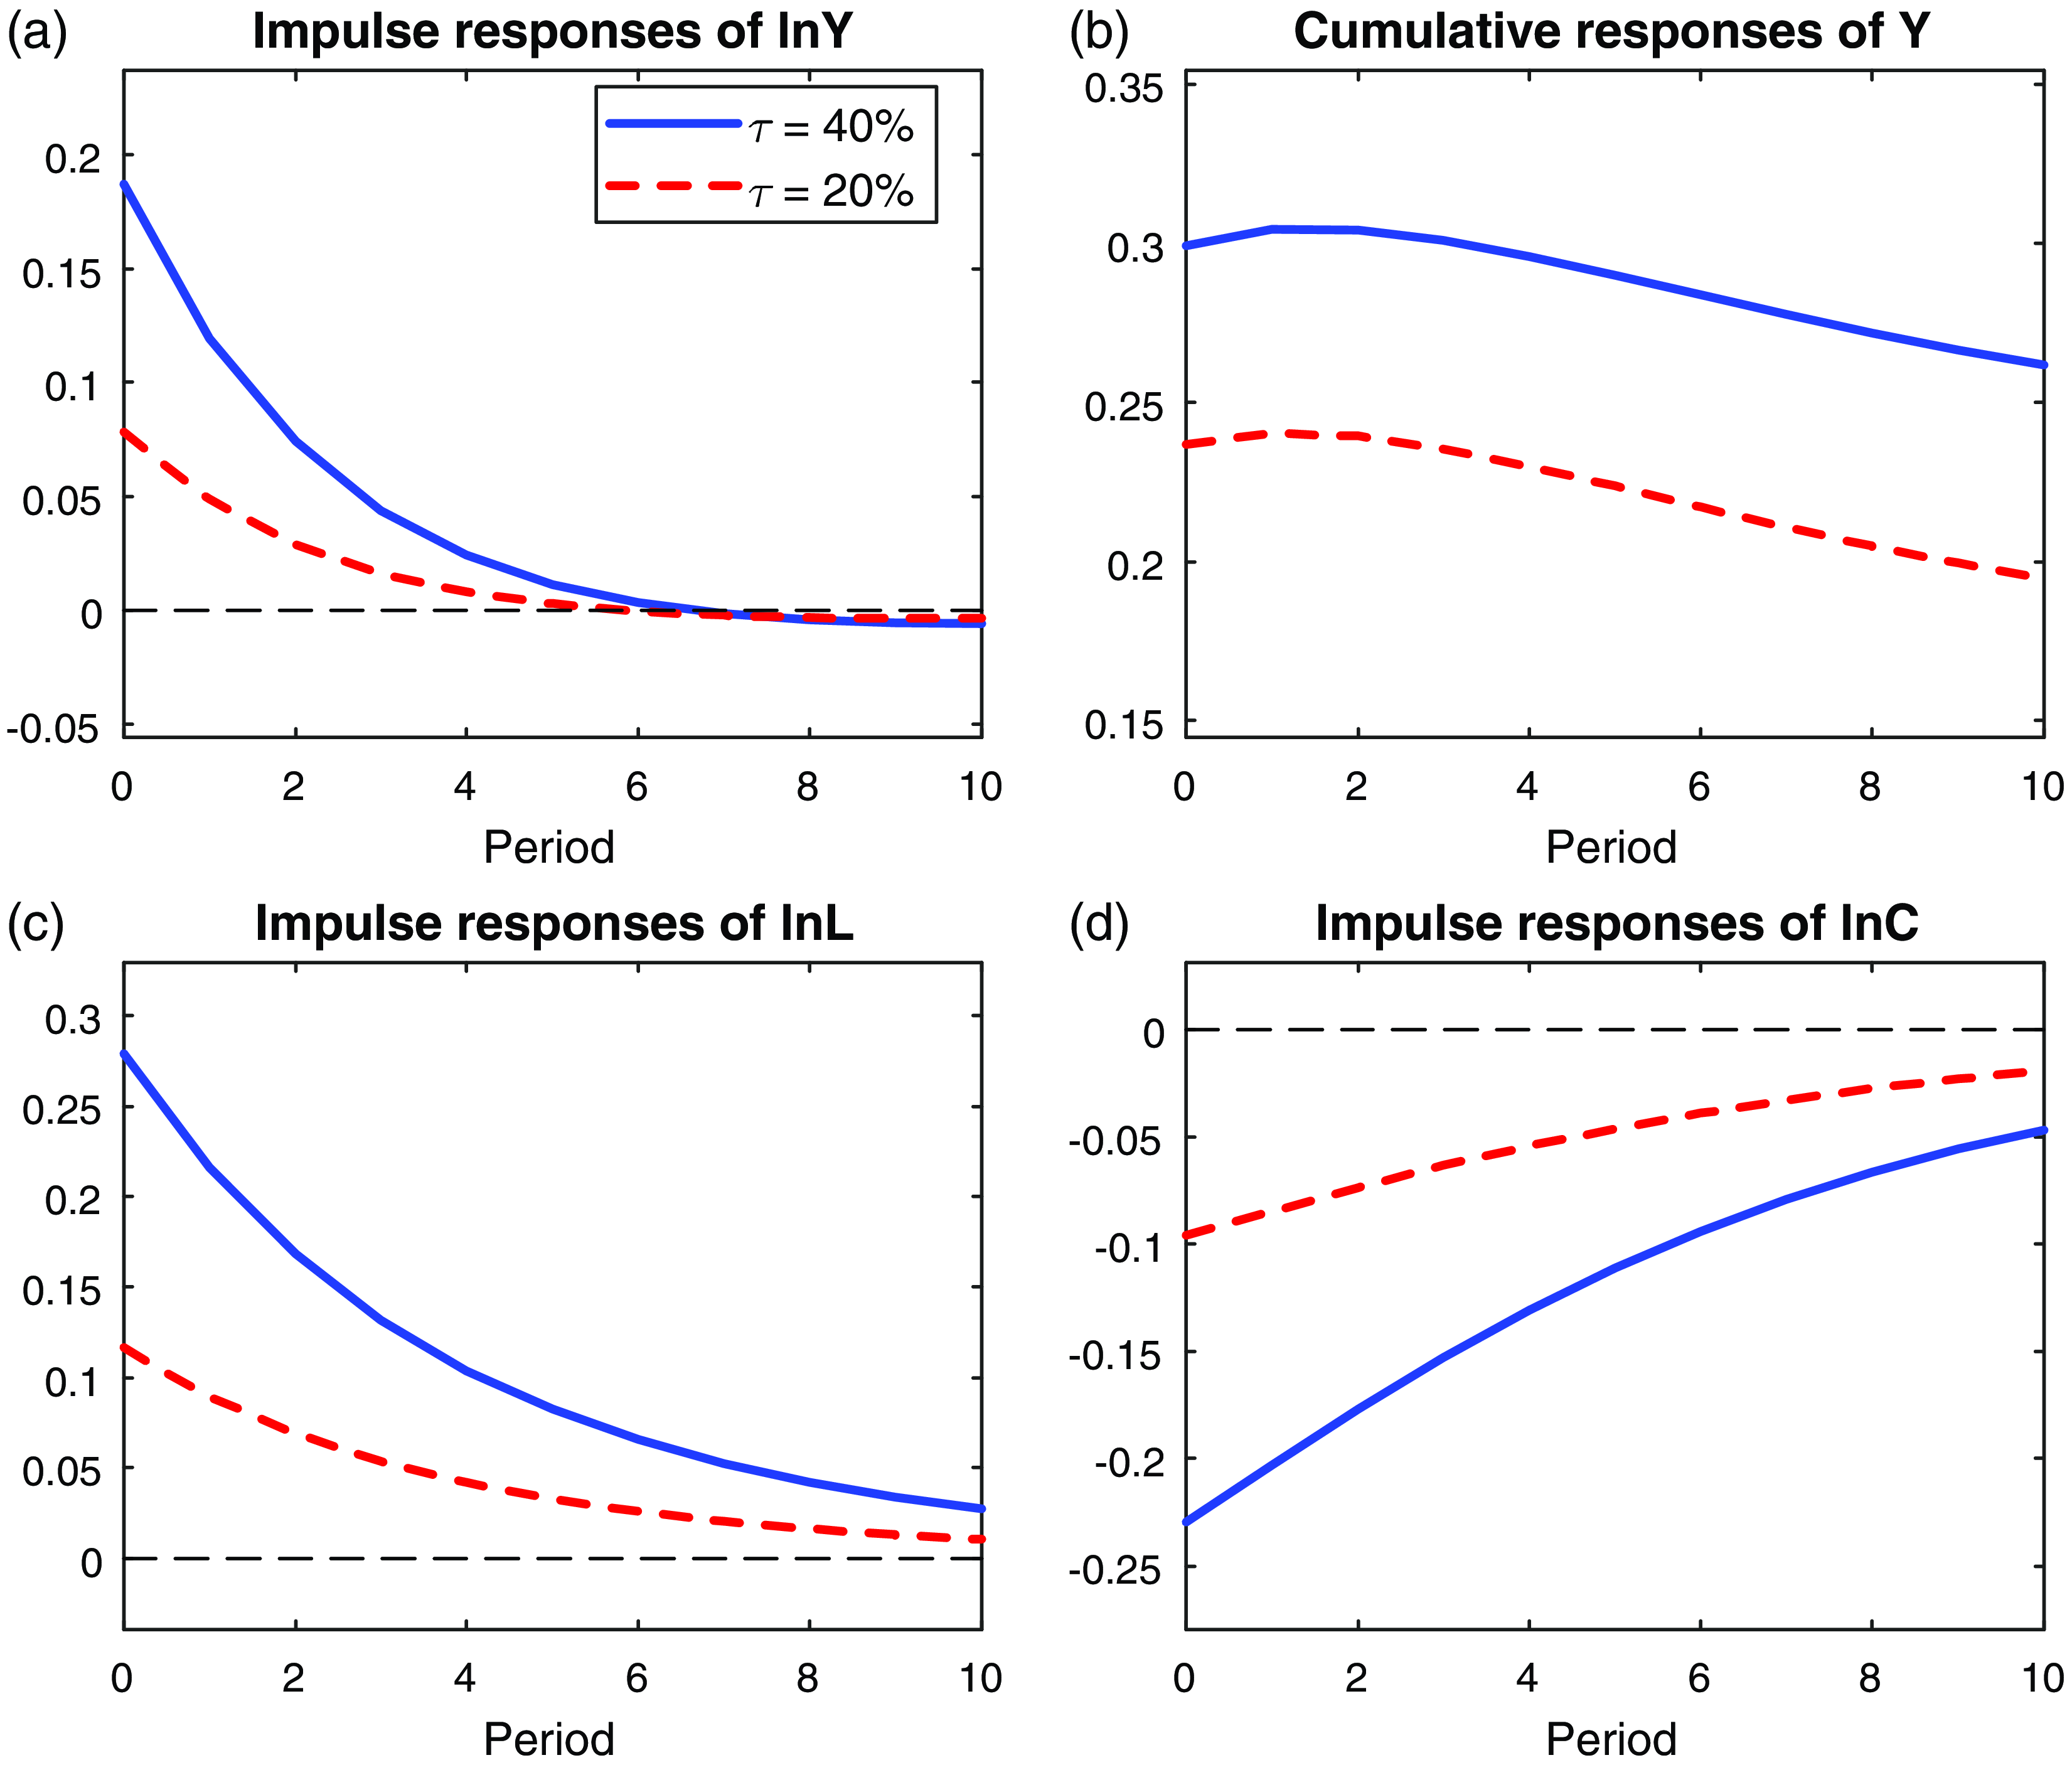
Regarding the role of the income tax rate, a positive shock to government purchases has a more significant stimulating impact on output when $\tau$
is higher. In Panel (a) of Fig. 2, output exhibits stronger impulse responses when
$\tau$
is higher. In Panel (a) of Fig. 2, output exhibits stronger impulse responses when $\tau =0.4$
for up to six periods after the shock. Similarly, the cumulative responses of output are larger for
$\tau =0.4$
for up to six periods after the shock. Similarly, the cumulative responses of output are larger for $\tau =0.4$
than for
$\tau =0.4$
than for $\tau =0.2$
in Panel (b). Such differences in impulse and cumulative responses indicate that the higher the income tax rate, the stronger the multiplier effect of a rise in government purchases. Obviously, this relationship is not generalizable. However, this has been proven analytically in the static neoclassical model with standard forms of the utility and production functions. It is also verified quantitatively using a dynamic neoclassical model calibrated with standard functional forms and parameter values. With a high income tax rate, a permanent increase in government purchases raises the steady-state output more significantly, and a temporary increase in government purchases leads to stronger positive output responses. Overall, the positive impact of the income tax rate on the government spending multiplier is quite robust in our theoretical analysis using both static and dynamic neoclassical models.
$\tau =0.2$
in Panel (b). Such differences in impulse and cumulative responses indicate that the higher the income tax rate, the stronger the multiplier effect of a rise in government purchases. Obviously, this relationship is not generalizable. However, this has been proven analytically in the static neoclassical model with standard forms of the utility and production functions. It is also verified quantitatively using a dynamic neoclassical model calibrated with standard functional forms and parameter values. With a high income tax rate, a permanent increase in government purchases raises the steady-state output more significantly, and a temporary increase in government purchases leads to stronger positive output responses. Overall, the positive impact of the income tax rate on the government spending multiplier is quite robust in our theoretical analysis using both static and dynamic neoclassical models.
2.3 Economies with monopolistic competition
So far, we have analyzed both static and dynamic neoclassical models. In these models, we showed that high tax rates can amplify the multiplier effect of increased government purchases with realistic functional forms and parameter values. However, this result might hold less relevance for other types of models if they have a quite different structure from the neoclassical models. In particular, the New Keynesian models feature monopolistic competition and various types of frictions such as nominal rigidities. Hence, our theoretical results from the neoclassical models may not necessarily apply to the New Keynesian models. Given the importance of New Keynesian models in macroeconomics, we discuss in this subsection how our theoretical findings can be extended to the New Keynesian models.
First, we show that our theoretical results still hold even if monopolistic competition is introduced to the model. For this purpose, we consider the Dixit–Stiglitz model of monopolistic competition. In the economy, there is a continuum of differentiated goods on the interval $\left [ 0,1\right ] .$
Each good is produced by a producer with some degree of market power. Households consume differentiated goods and supply labor for the production of those goods. Let
$\left [ 0,1\right ] .$
Each good is produced by a producer with some degree of market power. Households consume differentiated goods and supply labor for the production of those goods. Let $c\left ( i\right )$
and
$c\left ( i\right )$
and $l\left ( i\right )$
denote consumption and labor supply for good
$l\left ( i\right )$
denote consumption and labor supply for good $i.$
The utility function for households is assumed as follows:
$i.$
The utility function for households is assumed as follows:
 \begin{equation*} u\left ( C\right ) -\int _{0}^{1}v\left ( l\left ( i\right ) \right ) di, \end{equation*}
where $C$
is composite consumption defined as
$C$
is composite consumption defined as
 \begin{equation*} C\equiv \left [ \int _{0}^{1}c\left ( i\right ) ^{\frac {\theta -1}{\theta }}di\right ] ^{\frac {\theta }{\theta -1}},\ \ \theta \gt 1. \end{equation*}
As in the neoclassical models, we assume $u^{\prime }\gt 0\gt u^{\prime \prime }$
and
$u^{\prime }\gt 0\gt u^{\prime \prime }$
and $v^{\prime }\gt 0,\ v^{\prime \prime }\gt 0.$
With differentiated goods, the households’ budget constraint is modified as follows:
$v^{\prime }\gt 0,\ v^{\prime \prime }\gt 0.$
With differentiated goods, the households’ budget constraint is modified as follows:
 \begin{equation*} \int _{0}^{1}p\left ( i\right ) c\left ( i\right ) di=\left ( 1-\tau \right ) \left [ w\int _{0}^{1}l\left ( i\right ) di+\Pi \right ] +TR, \end{equation*}
where $p\left ( i\right )$
is the price of good
$p\left ( i\right )$
is the price of good $i.$
As defined earlier,
$i.$
As defined earlier, $w,\ \tau, \ \Pi, $
and
$w,\ \tau, \ \Pi, $
and $TR$
denote the wage, income tax rate, dividends from firms and lump-sum transfers from the government, respectively.
$TR$
denote the wage, income tax rate, dividends from firms and lump-sum transfers from the government, respectively.
Each household maximizes its utility subject to the budget constraint. The first-order conditions of the households’ problem imply that $l\left ( i\right )$
is the same for all
$l\left ( i\right )$
is the same for all $i.$
Hence, we denote common labor supply by
$i.$
Hence, we denote common labor supply by $L.$
Then, labor disutility can be simplified to
$L.$
Then, labor disutility can be simplified to $v\left ( L\right ), $
which coincides with labor disutility in the static neoclassical model. Also, the demand for good
$v\left ( L\right ), $
which coincides with labor disutility in the static neoclassical model. Also, the demand for good $i$
is obtained as
$i$
is obtained as
 \begin{equation*} c\left ( i\right ) =\left ( \frac {p\left ( i\right ) }{P}\right ) ^{-\theta }C\ \ \text {for all }i\in \left [ 0,1\right ], \end{equation*}
where $P$
is the price index defined as
$P$
is the price index defined as
 \begin{equation*} P=\left [ \int _{0}^{1}p\left ( i\right ) ^{1-\theta }di\right ] ^{\frac {1}{1-\theta }}. \end{equation*}
Finally, labor supply and consumption should satisfy the following condition:
 \begin{equation*} v^{\prime }\left ( L\right ) =\left ( 1-\tau \right ) \frac {w}{P}u^{\prime }\left ( C\right ) \end{equation*}
On the production side, firm $i$
produces output
$i$
produces output $y\left ( i\right )$
using labor
$y\left ( i\right )$
using labor $l\left ( i\right )$
according to a production function
$l\left ( i\right )$
according to a production function $y\left ( i\right ) =f\left ( l\left ( i\right ) \right )$
. The production function
$y\left ( i\right ) =f\left ( l\left ( i\right ) \right )$
. The production function $f$
is assumed to be identical across firms. Also, it satisfies the standard assumption,
$f$
is assumed to be identical across firms. Also, it satisfies the standard assumption, $f^{\prime }\gt 0\gt f^{\prime \prime }.$
As firms have market power, firm
$f^{\prime }\gt 0\gt f^{\prime \prime }.$
As firms have market power, firm $i$
chooses
$i$
chooses $p\left ( i\right )$
to maximize its profit
$p\left ( i\right )$
to maximize its profit $p\left ( i\right ) c\left ( i\right ) -wf^{-1}\left ( c\left ( i\right ) \right )$
. Solving the firm’s problem provides the following condition for labor demand.
$p\left ( i\right ) c\left ( i\right ) -wf^{-1}\left ( c\left ( i\right ) \right )$
. Solving the firm’s problem provides the following condition for labor demand.
 \begin{equation*} p\left ( i\right ) =\mu \frac {w}{f^{\prime }\left ( l\left ( i\right ) \right ) }, \end{equation*}
where $\mu \equiv \frac{\theta }{\theta -1}$
represents the degree of the markup. From the household’s problem,
$\mu \equiv \frac{\theta }{\theta -1}$
represents the degree of the markup. From the household’s problem, $l\left ( i\right ) =L$
for all
$l\left ( i\right ) =L$
for all $i.$
Then, the labor demand condition implies
$i.$
Then, the labor demand condition implies $p\left ( i\right ) =P$
for all
$p\left ( i\right ) =P$
for all $i.$
$i.$
In equilibrium, both labor supply and demand conditions are satisfied. Also, $Y=C+G$
for goods market clearing. Combining all those conditions, we obtain the following equation:
$Y=C+G$
for goods market clearing. Combining all those conditions, we obtain the following equation:
 \begin{equation} \left ( 1-\tau \right ) u^{\prime }\left ( Y-G\right ) =\mu \tilde{v}^{\prime }\left ( Y\right ), \end{equation}
where $\tilde{v}\left ( Y\right ) =v\left ( f^{-1}\left ( Y\right ) \right )$
is defined in the static neoclassical model. This equation is almost identical to equation (1), except for the markup
$\tilde{v}\left ( Y\right ) =v\left ( f^{-1}\left ( Y\right ) \right )$
is defined in the static neoclassical model. This equation is almost identical to equation (1), except for the markup $\mu .$
Moreover, all results in the static neoclassical model still hold in the current model with monopolistic competition. More specifically, (i) the income tax rate has a negative impact on the equilibrium output (i.e.,
$\mu .$
Moreover, all results in the static neoclassical model still hold in the current model with monopolistic competition. More specifically, (i) the income tax rate has a negative impact on the equilibrium output (i.e., $\partial Y/\partial \tau \lt 0$
); (ii) the government spending multiplier
$\partial Y/\partial \tau \lt 0$
); (ii) the government spending multiplier $m$
takes exactly the same form as in equation (3); and (iii)
$m$
takes exactly the same form as in equation (3); and (iii) $\partial m/\partial \tau$
will be positive for the functions in equation (4). As such, the main theoretical results in the static neoclassical model can be generalized to the economies with monopolistic competition. In addition, the negative wealth effect channel is still relevant even if the economy is characterized with monopolistic competition.
$\partial m/\partial \tau$
will be positive for the functions in equation (4). As such, the main theoretical results in the static neoclassical model can be generalized to the economies with monopolistic competition. In addition, the negative wealth effect channel is still relevant even if the economy is characterized with monopolistic competition.
Our interest lies in whether it is feasible to derive analogous theoretical outcomes in New Keynesian dynamic models. Although New Keynesian models are more complicated than the simple model of monopolistic competition. However, even in the New Keynesian models, an equilibrium condition analogous to equation (13) should be satisfied for the labor market. In addition, households’ labor supply and firms’ labor demand in the New Keynesian models are based on those in the simple model of monopolistic competition. Given these similarities, it is reasonable to anticipate that in the New Keynesian models, an increase in government purchases may still induce a negative wealth effect, reducing consumption but raising labor supply. Moreover, the New Keynesian models are often calibrated with the functions presented in equation (4). Consequently, the negative wealth effect of fiscal expansion can also generate a positive impact of the income tax rate on the government spending multiplier in the New Keynesian models.
On the other hand, there are many other channels through which the income tax rate affects the government spending multiplier. Consequently, the overall effect of the income tax rate on the government spending multiplier may often be negative in the New Keynesian models. However, the negative wealth effect is expected to exist and interact with the income tax rate in these models. Therefore, if the New Keynesian models are calibrated with the functions specified in equation (4), the income tax rate can positively affect the government spending multiplier through the negative wealth effect. Taken together, the assertion that an increase in government purchases stimulates output more effectively when the income tax rate is high is not generally applicable in the New Keynesian models. Nevertheless, the positive effect of the income tax rate on the government spending multiplier is likely to coexist with other channels in the New Keynesian models.
3. Empirical analysis
The theoretical analysis indicates that the government spending multiplier tends to be less than one but increases with the income tax rate. Motivated by these theoretical results, we estimate the dynamic effects of a shock to government purchases on output and other macroeconomic variables. This section describes the dataset and explains the econometric methods used in the empirical analysis. In the next section, we discuss the estimation results and implement robustness checks.
3.1 Data and the identification of shocks to government purchases
For our empirical analysis, we construct a dataset of both macroeconomic and fiscal variables for 12 OECD countries over the period 1985–2019. All variables in our dataset are obtained from the OECD Economic Outlook and OECD Statistics and Projections databases. Our dataset includes Belgium, Denmark, France, Germany, Italy, the Netherlands, Spain, Sweden, Portugal, Switzerland, the United Kingdom, and the United States.Footnote 11 However, our dataset is an unbalanced panel, due to differences in data availability across the sample countries.
In our empirical analysis, we estimate the macroeconomic effects of unanticipated changes in government purchases using the state-dependent local projection method (Jordà (Reference Jordà2005)). To implement this method, the shocks to government purchases must be identified. Following Auerbach and Gorodnichenko (Reference Auerbach and Gorodnichenko2012, Reference Auerbach, Gorodnichenko, Auerbach and Gorodnichenko2013), we use forecast errors of government purchases as “government spending shocks” because they represent the component of government purchases unexpected by economic agents. Specifically, let $G_{it}$
and
$G_{it}$
and $G_{it}^{e}$
denote actual and forecasted government purchases, respectively, for country
$G_{it}^{e}$
denote actual and forecasted government purchases, respectively, for country $i$
in year
$i$
in year $t$
.Footnote 12 The forecast
$t$
.Footnote 12 The forecast $G_{it}^{e}$
is predetermined in year
$G_{it}^{e}$
is predetermined in year $t-1.$
We define the government spending shock
$t-1.$
We define the government spending shock $\varepsilon _{it}$
for country
$\varepsilon _{it}$
for country $i$
in year
$i$
in year $t$
as follows:
$t$
as follows:
 \begin{equation} \varepsilon _{it}\equiv \frac{G_{it}-G_{it}^{e}}{Y_{i,t-1}}, \end{equation}
where $Y_{i,t-1}$
is GDP of country
$Y_{i,t-1}$
is GDP of country $i$
in year
$i$
in year $t-1$
. In other words, the government spending shock in a year is the forecast error of government purchases scaled by GDP in the previous year.Footnote 13
$t-1$
. In other words, the government spending shock in a year is the forecast error of government purchases scaled by GDP in the previous year.Footnote 13 $^{,}$
Footnote 14 Note that
$^{,}$
Footnote 14 Note that $\varepsilon _{it}$
is analogous to the shock
$\varepsilon _{it}$
is analogous to the shock $\nu _{t}$
in equation (12) for the calibrated dynamic neoclassical model in Section 2 because both can be interpreted as forecast errors of government purchases.
$\nu _{t}$
in equation (12) for the calibrated dynamic neoclassical model in Section 2 because both can be interpreted as forecast errors of government purchases.
Ideally, $G_{it}^{e}$
should be determined at the end of year
$G_{it}^{e}$
should be determined at the end of year $t-1$
. In this case,
$t-1$
. In this case, $\varepsilon _{it}$
could be a pure shock to
$\varepsilon _{it}$
could be a pure shock to $G_{it}$
because it would only include the component of
$G_{it}$
because it would only include the component of $G_{it}$
that was totally unanticipated until the end of the previous year. Moreover, a regression of
$G_{it}$
that was totally unanticipated until the end of the previous year. Moreover, a regression of $Y_{i,t+h}$
on
$Y_{i,t+h}$
on $\varepsilon _{it}$
yields an unbiased estimate of the output response in period
$\varepsilon _{it}$
yields an unbiased estimate of the output response in period $t+h$
to an unexpected change in
$t+h$
to an unexpected change in $G_{it}$
in period
$G_{it}$
in period $t$
. In other words, we can avoid the well-known issues of fiscal foresight (Leeper et al. (Reference Leeper, Walker and Yang2013)) and potential feedback from the state of the economy to fiscal policy. In contrast, if
$t$
. In other words, we can avoid the well-known issues of fiscal foresight (Leeper et al. (Reference Leeper, Walker and Yang2013)) and potential feedback from the state of the economy to fiscal policy. In contrast, if $G_{it}^{e}$
is determined relatively early in year
$G_{it}^{e}$
is determined relatively early in year $t-1$
,
$t-1$
, $\varepsilon _{it}$
may include the component of
$\varepsilon _{it}$
may include the component of $G_{it}$
that is fully expected in year
$G_{it}$
that is fully expected in year $t-1$
based on the newly available information after
$t-1$
based on the newly available information after $G_{it}^{e}$
is determined. In this case, a regression of
$G_{it}^{e}$
is determined. In this case, a regression of $Y_{it}$
on
$Y_{it}$
on $\varepsilon _{it}$
may also include part of output that is not caused by shocks to government purchases in period
$\varepsilon _{it}$
may also include part of output that is not caused by shocks to government purchases in period $t$
.
$t$
.
Considering the importance of the forecasting timing, we draw $G_{it}^{e}$
from forecasts of government purchases published in the fall issue of the previous year in the OECD Economic Outlook and Statistics and Projections databases. Hence, there is only a two- or three-month gap between the publication of forecast
$G_{it}^{e}$
from forecasts of government purchases published in the fall issue of the previous year in the OECD Economic Outlook and Statistics and Projections databases. Hence, there is only a two- or three-month gap between the publication of forecast $G_{it}^{e}$
and the beginning of year
$G_{it}^{e}$
and the beginning of year $t$
. Consequently,
$t$
. Consequently, $\varepsilon _{it}$
can identify the shock component of
$\varepsilon _{it}$
can identify the shock component of $G_{it}$
reasonably well as significant events or policy changes are not as frequent after the publication of OECD forecasts of government purchases. If this is the case, then the regression of the macroeconomic variables on
$G_{it}$
reasonably well as significant events or policy changes are not as frequent after the publication of OECD forecasts of government purchases. If this is the case, then the regression of the macroeconomic variables on $\varepsilon _{it}$
can properly capture their responses to unanticipated changes in government purchases. Based on these advantages, we interpret
$\varepsilon _{it}$
can properly capture their responses to unanticipated changes in government purchases. Based on these advantages, we interpret $\varepsilon _{it}$
as a government spending shock, which is the main explanatory variable in our empirical analysis.
$\varepsilon _{it}$
as a government spending shock, which is the main explanatory variable in our empirical analysis.
3.2 Estimation equations
To evaluate the dynamic responses of the macroeconomic variables to unexpected changes in government purchases, we employ a state-dependent local projection method. We estimate the following equation for each $h=0,1,\cdots, 4$
:
$h=0,1,\cdots, 4$
:
 \begin{equation} \ln Z_{i,t+h}-\ln Z_{i,t-1}=\alpha _{i}^{h}+\theta _{t}^{h}+\left [ \beta _{LT}^{h}H\left ( T_{i,t-1}\right ) +\beta _{HT}^{h}\left \{ 1-H\left ( T_{i,t-1}\right ) \right \} \right ] \varepsilon _{it}+\omega ^{h}X_{it}+u_{i,t+h}^{h}, \end{equation}
with the transition function $H\left ( \cdot \right )$
defined as
$H\left ( \cdot \right )$
defined as
 \begin{equation} H\left ( T_{i,t-1}\right ) =\frac{1}{1+\exp \left ( \gamma T_{i,t-1}\right ) },\text{ }\,\gamma \gt 0. \end{equation}
In the estimation equation, $Z$
is a variable of interest, and
$Z$
is a variable of interest, and $i$
and
$i$
and $t$
are the indices for the country and year, respectively.
$t$
are the indices for the country and year, respectively. $\alpha _{i}^{h}$
and
$\alpha _{i}^{h}$
and $\ \theta _{t}^{h}$
are the country and year dummies, respectively, and
$\ \theta _{t}^{h}$
are the country and year dummies, respectively, and $X_{it}$
is a vector of the control variables.Footnote 15
$X_{it}$
is a vector of the control variables.Footnote 15 $\varepsilon _{it}$
denotes the government spending shock defined in equation (14). Note that the coefficient on
$\varepsilon _{it}$
denotes the government spending shock defined in equation (14). Note that the coefficient on $\varepsilon _{it}$
consists of two parameters,
$\varepsilon _{it}$
consists of two parameters, $\beta _{LT}^{h}$
and
$\beta _{LT}^{h}$
and $\beta _{HT}^{h}$
, which correspond to the “low-tax (LT)” and “high-tax (HT)” states, as explained below. The error term
$\beta _{HT}^{h}$
, which correspond to the “low-tax (LT)” and “high-tax (HT)” states, as explained below. The error term $u_{i,t+h}^{h}$
may not be spherical. Hence, we calculate the Driscoll–Kraay (1998) standard errors, as they are robust to heteroskedasticity, autocorrelation, and cross-sectional dependence. We estimate equation (15) for various
$u_{i,t+h}^{h}$
may not be spherical. Hence, we calculate the Driscoll–Kraay (1998) standard errors, as they are robust to heteroskedasticity, autocorrelation, and cross-sectional dependence. We estimate equation (15) for various $Z$
, such as output, employment, and consumption, over the horizon
$Z$
, such as output, employment, and consumption, over the horizon $h=0,1,\cdots, 4$
, so that we can characterize their dynamic responses over four years after a government spending shock occurs.
$h=0,1,\cdots, 4$
, so that we can characterize their dynamic responses over four years after a government spending shock occurs.
In the transition function $H$
in equation (16), we use the lagged tax-GDP ratio, denoted by
$H$
in equation (16), we use the lagged tax-GDP ratio, denoted by $T_{i,t-1},$
as a transition variable. The tax-GDP ratio is a useful indicator of the overall tax burden or government size. Also, it is directly related to the income tax rate
$T_{i,t-1},$
as a transition variable. The tax-GDP ratio is a useful indicator of the overall tax burden or government size. Also, it is directly related to the income tax rate $\tau$
in the theoretical analysis in Section 2 because it coincides with the tax-GDP ratio in equilibrium. The parameter
$\tau$
in the theoretical analysis in Section 2 because it coincides with the tax-GDP ratio in equilibrium. The parameter $\gamma$
in equation (16) determines the speed of transition. We assume
$\gamma$
in equation (16) determines the speed of transition. We assume $\gamma =1.5$
following Auerbach and Gorodnichenko (Reference Auerbach, Gorodnichenko, Auerbach and Gorodnichenko2013) and Honda and Miyamoto (Reference Honda and Miyamoto2021). However, the main results are robust to changes in
$\gamma =1.5$
following Auerbach and Gorodnichenko (Reference Auerbach, Gorodnichenko, Auerbach and Gorodnichenko2013) and Honda and Miyamoto (Reference Honda and Miyamoto2021). However, the main results are robust to changes in $\gamma$
. We also normalize
$\gamma$
. We also normalize $T_{it}$
in equation (16) so that
$T_{it}$
in equation (16) so that $\mathbb{E}\left ( T_{it}\right ) =0$
and
$\mathbb{E}\left ( T_{it}\right ) =0$
and $var\left ( T_{it}\right ) =1$
.
$var\left ( T_{it}\right ) =1$
.
We use the lagged tax-GDP as the transition variable to avoid potential issues caused by contemporaneous effects of government purchases and the dependent variables on tax revenue. For example, there can be potential reverse causality from output to tax revenue. Also, if government purchases can influence tax revenue, a positive $\varepsilon _{it}$
, or equivalently, an unanticipated increase in government purchases, may also affect tax revenue. In other words, the government spending shock may influence the transition variable. These issues can create some bias in our regression analysis. Therefore, we use the lagged tax-GDP ratio
$\varepsilon _{it}$
, or equivalently, an unanticipated increase in government purchases, may also affect tax revenue. In other words, the government spending shock may influence the transition variable. These issues can create some bias in our regression analysis. Therefore, we use the lagged tax-GDP ratio $T_{i,t-1}$
as the transition variable because it is unlikely to be affected by the government spending shock
$T_{i,t-1}$
as the transition variable because it is unlikely to be affected by the government spending shock $\varepsilon _{it}$
or output
$\varepsilon _{it}$
or output $Y_{it}$
in period
$Y_{it}$
in period $t.$
Footnote 16
$t.$
Footnote 16
With the transition function discussed so far, we can interpret the regression equation (15). In particular, the coefficient on $\varepsilon _{it}$
is expressed as a weighted average of
$\varepsilon _{it}$
is expressed as a weighted average of $\beta _{LT}^{h}$
and
$\beta _{LT}^{h}$
and $\beta _{HT}^{h}$
with the weights,
$\beta _{HT}^{h}$
with the weights, $H$
and
$H$
and $\left ( 1-H\right )$
. With this specification, the tax-GDP ratio controls the dynamic responses of the macroeconomic variables to government spending shocks because weights are fully determined by
$\left ( 1-H\right )$
. With this specification, the tax-GDP ratio controls the dynamic responses of the macroeconomic variables to government spending shocks because weights are fully determined by $T_{i,t-1}$
. Specifically, as the lagged tax-GDP ratio increases, the weight on
$T_{i,t-1}$
. Specifically, as the lagged tax-GDP ratio increases, the weight on $\beta _{HT}^{h}$
increases, but the weight on
$\beta _{HT}^{h}$
increases, but the weight on $\beta _{LT}^{h}$
decreases in the coefficient on
$\beta _{LT}^{h}$
decreases in the coefficient on $\varepsilon _{it}$
because
$\varepsilon _{it}$
because $H$
is a decreasing function of
$H$
is a decreasing function of $T_{i,t-1}$
. Thus,
$T_{i,t-1}$
. Thus, $\beta _{HT}^{h}$
is more relevant for large governments with high tax rates, whereas
$\beta _{HT}^{h}$
is more relevant for large governments with high tax rates, whereas $\beta _{LT}^{h}$
is more relevant for small governments with low tax rates. We compare
$\beta _{LT}^{h}$
is more relevant for small governments with low tax rates. We compare $\beta _{LT}^{h}$
and
$\beta _{LT}^{h}$
and $\beta _{HT}^{h}$
to evaluate the quantitative effects of the tax-GDP ratio or government size on the dynamic responses of the macroeconomic variables to government spending shocks. Such an analysis is closely related to the theoretical analysis in Section 2 because the tax-GDP ratio is represented by the income tax rate
$\beta _{HT}^{h}$
to evaluate the quantitative effects of the tax-GDP ratio or government size on the dynamic responses of the macroeconomic variables to government spending shocks. Such an analysis is closely related to the theoretical analysis in Section 2 because the tax-GDP ratio is represented by the income tax rate $\tau$
in theoretical models. We focus on the comparison between
$\tau$
in theoretical models. We focus on the comparison between $\beta _{LT}^{h}$
and
$\beta _{LT}^{h}$
and $\beta _{HT}^{h}$
when interpreting the estimation results in the next section.
$\beta _{HT}^{h}$
when interpreting the estimation results in the next section.
4. Estimation results
This section discusses the estimation results of equation (15) for output, employment, and consumption because they are key variables in the theoretical analysis in Section 2. The results are shown in Fig. 3. For each variable, the figure displays the estimates of $\beta _{LT}^{h}$
and
$\beta _{LT}^{h}$
and $\beta _{HT}^{h}$
for
$\beta _{HT}^{h}$
for $h=0,1,\cdots, 4$
with 90% and 95% confidence bands to highlight the role of the tax-GDP ratio or government size on the macroeconomic effects of a positive government spending shock, which represents an unanticipated increase in government purchases.
$h=0,1,\cdots, 4$
with 90% and 95% confidence bands to highlight the role of the tax-GDP ratio or government size on the macroeconomic effects of a positive government spending shock, which represents an unanticipated increase in government purchases.
Estimated impulse responses of output, employment, and consumption to a positive shock to government purchases. This figure displays the responses of the log of those variables to an unexpected rise in government purchases by 1% of GDP. In each panel, the horizontal axis indicates the years from the shock. Left and right panels show $\beta _{HT}^{h}$
and
$\beta _{HT}^{h}$
and $\beta _{LT}^{h}$
, which are relevant for high and low tax-GDP ratios, respectively. Shaded areas indicate 90% confidence bands and dark shaded areas denote 95% confidence bands. See equation (15) for details.
$\beta _{LT}^{h}$
, which are relevant for high and low tax-GDP ratios, respectively. Shaded areas indicate 90% confidence bands and dark shaded areas denote 95% confidence bands. See equation (15) for details.

4.1 Responses of output
First, we discuss the estimated output responses to positive government spending shocks. Noticeably, the estimated output responses are almost opposite in the high- and low-tax economies shown in the top panels of Fig. 3. In the left panel, the estimated $\beta _{HT}^{h}$
is positive for all
$\beta _{HT}^{h}$
is positive for all $h=0,1,\cdots, 4$
and even statistically significant for
$h=0,1,\cdots, 4$
and even statistically significant for $h=1,2$
. By contrast, the estimated
$h=1,2$
. By contrast, the estimated $\beta _{LT}^{h}$
in the right panel is negative regardless of
$\beta _{LT}^{h}$
in the right panel is negative regardless of $h$
, although all estimates are statistically insignificant. These contrasting results clearly suggest that a positive government spending shock can stimulate output only when the tax-GDP ratio is relatively high. In an economy with a relatively low tax-GDP ratio, such fiscal expansion may fail to increase output.
$h$
, although all estimates are statistically insignificant. These contrasting results clearly suggest that a positive government spending shock can stimulate output only when the tax-GDP ratio is relatively high. In an economy with a relatively low tax-GDP ratio, such fiscal expansion may fail to increase output.
These empirical results are consistent with the corresponding theoretical results. In Section 2, using the standard neoclassical models, we find that the stimulus effect of an increase in government purchases can increase with the income tax rate. This result is proven analytically in a static neoclassical model with standard functional forms and confirmed quantitatively through steady-state and impulse-response analyses in dynamic neoclassical models calibrated with standard functional forms and parameter values. The theoretical result is similar to the empirical result $\beta _{HT}^{h}\gt \beta _{LT}^{h}$
for output because both indicate that increases in government purchases have stronger stimulating effects as tax rates rise or government size grows.
$\beta _{HT}^{h}\gt \beta _{LT}^{h}$
for output because both indicate that increases in government purchases have stronger stimulating effects as tax rates rise or government size grows.
Despite these similarities, we also observe differences between the estimated impulse responses of output in Fig. 3 and the simulated impulse responses in Panel (a) of Fig. 2 from the dynamic neoclassical model. First, the estimated impulse responses in Fig. 3 are positive only with a high tax-GDP ratio, whereas the simulated impulse responses in Panel (a) of Fig. 2 are always positive for $h=0,1,\cdots, 4$
whether the income tax rate
$h=0,1,\cdots, 4$
whether the income tax rate $\tau$
is high or low. In addition, the estimated responses are U-shaped or inverted U-shaped, whereas the simulated impulse responses are monotonically decreasing up to
$\tau$
is high or low. In addition, the estimated responses are U-shaped or inverted U-shaped, whereas the simulated impulse responses are monotonically decreasing up to $h=4$
regardless of the value of
$h=4$
regardless of the value of $\tau$
.
$\tau$
.
However, these differences appear plausible because the dynamic neoclassical model is intended to clearly highlight how the income tax rate influences the macroeconomic effects of a government spending shock. Thus, we set up a dynamic neoclassical model as simply as possible, abstracting from various factors and frictions that could help the model better match the macroeconomy of the countries in the sample. Due to its simplicity, the dynamic neoclassical model may not generate impulse responses that match their empirical counterparts, which could explain the differences between the theoretical and empirical impulse responses. From this perspective, our primary focus is on the qualitative properties of $\left ( \beta _{HT}^{h}-\beta _{LT}^{h}\right )$
when we compare the theoretical results in Fig. 2 with the empirical results in Fig. 3.
$\left ( \beta _{HT}^{h}-\beta _{LT}^{h}\right )$
when we compare the theoretical results in Fig. 2 with the empirical results in Fig. 3.
4.2 Responses of employment
Next, we analyze the impulse responses of employment, as presented in the second row of Fig. 3. In the left panel, the estimates of $\beta _{HT}^{h}$
are positive for all
$\beta _{HT}^{h}$
are positive for all $h=0,1,\cdots, 4$
, but statistically significant only for
$h=0,1,\cdots, 4$
, but statistically significant only for $h=1,2$
. By contrast, in the right panel, the estimates of
$h=1,2$
. By contrast, in the right panel, the estimates of $\beta _{LT}^{h}$
are negative and statistically insignificant, regardless of
$\beta _{LT}^{h}$
are negative and statistically insignificant, regardless of $h$
. In other words, a positive government spending shock can boost employment when the tax-GDP ratio is high but it fails to do so when the tax-GDP ratio is low. These results are qualitatively identical to those of the output responses shown in the top panels of Fig. 3. Such similarities suggest that employment responses could be one of the key driving forces for output responses.
$h$
. In other words, a positive government spending shock can boost employment when the tax-GDP ratio is high but it fails to do so when the tax-GDP ratio is low. These results are qualitatively identical to those of the output responses shown in the top panels of Fig. 3. Such similarities suggest that employment responses could be one of the key driving forces for output responses.
Neoclassical models appear to explain the important characteristics of employment impulse responses. As discussed in Section 2, an increase in government purchases can increase output because it induces people to work more through a negative wealth effect. In this sense, whether and how much such fiscal expansion stimulates output depends crucially on the magnitude of the positive labor response. Hence, output and labor are expected to exhibit qualitatively similar impulse responses, as theoretically confirmed in Fig. 2. Thus, the similarity in the estimated responses between output and labor in Fig. 3 is consistent with the theoretical prediction.
Moreover, the empirical result $\beta _{HT}^{h}\gt \beta _{LT}^{h}$
for employment can be explained using the neoclassical models with the standard functional forms considered in Section 2. In this case, the negative wealth effect of an unanticipated increase in government purchases tends to have a stronger positive impact on labor supply as the income tax rate
$\beta _{HT}^{h}\gt \beta _{LT}^{h}$
for employment can be explained using the neoclassical models with the standard functional forms considered in Section 2. In this case, the negative wealth effect of an unanticipated increase in government purchases tends to have a stronger positive impact on labor supply as the income tax rate $\tau$
rises. Therefore, output can be further stimulated by a high value of
$\tau$
rises. Therefore, output can be further stimulated by a high value of $\tau .$
For this reason, the theoretical impulse responses of both output and labor are more significant with a high value of
$\tau .$
For this reason, the theoretical impulse responses of both output and labor are more significant with a high value of $\tau$
, especially for
$\tau$
, especially for $h=0,1,\cdots, 4$
, as shown in Panels (a) and (c) of Fig. 2. As such, the income tax rate can influence the characteristics of the negative wealth effect, thereby affecting both output and labor responses. This effect could also contribute to the empirical result
$h=0,1,\cdots, 4$
, as shown in Panels (a) and (c) of Fig. 2. As such, the income tax rate can influence the characteristics of the negative wealth effect, thereby affecting both output and labor responses. This effect could also contribute to the empirical result $\beta _{HT}^{h}\gt \beta _{LT}^{h}$
as shown in Fig. 3.
$\beta _{HT}^{h}\gt \beta _{LT}^{h}$
as shown in Fig. 3.
4.3 Responses of consumption
We characterize the estimated impulse responses of consumption to a positive government spending shock. In the third row of Fig. 3, all estimates of $\beta _{HT}^{h}$
and
$\beta _{HT}^{h}$
and $\beta _{LT}^{h}$
are statistically insignificant for consumption. This result indicates that consumption does not respond strongly to changes in government purchases regardless of the tax-GDP ratio. Focusing on the point estimates, both
$\beta _{LT}^{h}$
are statistically insignificant for consumption. This result indicates that consumption does not respond strongly to changes in government purchases regardless of the tax-GDP ratio. Focusing on the point estimates, both $\beta _{HT}^{h}$
and
$\beta _{HT}^{h}$
and $\beta _{LT}^{h}$
remain close to zero for
$\beta _{LT}^{h}$
remain close to zero for $h\leq 2$
, but diverge for
$h\leq 2$
, but diverge for $h=3,4$
. Consequently,
$h=3,4$
. Consequently, $\left ( \beta _{HT}^{h}-\beta _{LT}^{h}\right )$
for consumption is essentially zero for
$\left ( \beta _{HT}^{h}-\beta _{LT}^{h}\right )$
for consumption is essentially zero for $h\leq 2$
but becomes negative for
$h\leq 2$
but becomes negative for $h=3,4$
. This result could be related to the theoretical counterpart in Panel (d) of Fig. 2, in which the simulated impulse responses of consumption are larger for the low-income tax rate. However, we do not observe a significant drop in consumption in Fig. 3, unlike the impulse responses obtained from the dynamic neoclassical model through a negative wealth effect. As previously discussed, this inconsistency could be caused by factors that were not considered in our theoretical analysis.
$h=3,4$
. This result could be related to the theoretical counterpart in Panel (d) of Fig. 2, in which the simulated impulse responses of consumption are larger for the low-income tax rate. However, we do not observe a significant drop in consumption in Fig. 3, unlike the impulse responses obtained from the dynamic neoclassical model through a negative wealth effect. As previously discussed, this inconsistency could be caused by factors that were not considered in our theoretical analysis.
Moreover, the estimated responses of output and consumption tend to support the predictions of the neoclassical models rather than those of the traditional Keynesian model. In response to a positive shock to government purchases, output rises but consumption drops, according to neoclassical models, through the negative wealth effect of fiscal expansion. If this prediction is correct, then the output and consumption responses should exhibit a negative correlation. In contrast, according to the traditional Keynesian model, both output and consumption rise in response to fiscal expansion because output is stimulated through the positive reaction of consumption. In this case, the output and consumption responses exhibit a positive correlation. However, the estimated output and consumption responses tend to be negatively correlated, as shown in Fig. 3, because $\left ( \beta _{HT}^{h}-\beta _{LT}^{h}\right ) \gt 0$
for output and
$\left ( \beta _{HT}^{h}-\beta _{LT}^{h}\right ) \gt 0$
for output and $\left ( \beta _{HT}^{h}-\beta _{LT}^{h}\right ) \lt 0$
for consumption. Overall, these empirical results tend to be more consistent with neoclassical models than traditional Keynesian models.
$\left ( \beta _{HT}^{h}-\beta _{LT}^{h}\right ) \lt 0$
for consumption. Overall, these empirical results tend to be more consistent with neoclassical models than traditional Keynesian models.
4.4 Discussion
Our empirical results can be summarized as follows. First, a positive shock to government purchases can significantly stimulate output only when the tax-GDP ratio is sufficiently high. This result is inconsistent with the predictions of the traditional Keynesian model. However, this can be better explained by static and dynamic neoclassical models, as discussed in Section 2. We find that government spending multipliers tend to increase in the income tax rate in neoclassical models with standard functional forms and parameter values. Taken together, these theoretical and empirical results suggest that fiscal expansion through rises in government purchases tends to be more effective in large governments with relatively high tax rates.
Second, we provide evidence of a negative wealth effect when governments make more purchases. In Fig. 3, output tends to exhibit a strong positive correlation with employment, but a weak negative correlation with consumption. Again, such differences in the signs of the correlations are better explained by the negative wealth effect in the neoclassical models than by the multiplier effect in the traditional Keynesian model. Thus, the empirical results corroborate the theoretical analysis.
4.5 Robustness checks
In this subsection, we confirm the robustness of our empirical results from state-dependent local projections. Specifically, we obtain state-dependent impulse responses of output to a government spending shock using various specifications as robustness checks in Fig. 4: (a) using an alternative government spending shock based on the forecast of government spending in the fall issue of the same year rather than that in the fall issue of the previous year as in the baseline case, (b) including control variables, such as current and lagged output growth shocks defined as the forecast error of GDP growth to deal with the endogeneity issue, which is caused by unexpected business cycle conditions, (c) including country-specific time trends, (d) excluding control variables such as government spending (over GDP), consumer price inflation, and short-term interest rate, and (e) controlling for tax response.
Robustness checks. Estimated impulse responses of output to a positive shock to government purchases using various specifications, with 90% confidence bands.

The estimated fiscal multipliers, using alternative specifications in Panels (a) through (e), remain similar to those from the baseline case as reported in Panel (a) of Fig. 3. That is, it suggests that a positive government spending shock can boost output when the tax-GDP ratio is relatively high. However, in an economy with a relatively low tax-GDP ratio, such fiscal expansion yields statistically insignificant responses of output. Overall, our main findings in Fig. 3 remain qualitatively unaltered across alternative specifications.
5. Conclusion
This study investigates the association between the effectiveness of fiscal policy and government size. To this end, we analyze the effects of the tax-GDP ratio on the responses of output and other macroeconomic variables to unanticipated changes in government purchases. Our main findings are summarized as follows. Theoretically, we show that the government spending multiplier can increase with the income tax rate in a static neoclassical model with standard forms of utility and production functions. Interestingly, this result contradicts the prediction of the traditional Keynesian model that the multiplier effect decreases in the income tax rate. The two models yield contrasting results because they are based on different channels of fiscal expansion effects on output.
In addition, the positive effect of the income tax rate on the government spending multiplier is quantitatively confirmed using a dynamic neoclassical model calibrated with standard functional forms and parameter values. We find that a permanent increase in government purchases has a stronger positive effect on steady-state output as the income tax rate rises. Regarding the effect of a one-time hike in government purchases, such a temporary fiscal expansion tends to generate more significant positive impulse responses of output when the income tax rate is high. Hence, these quantitative results validate the analytical findings of the static neoclassical model.
Furthermore, our empirical analysis using a state-dependent local projection method provides supporting evidence for our theoretical results. Specifically, the estimation results reveal that, while the state-dependent impulse responses of output to an unanticipated government spending shock tend to be significantly positive when the tax-GDP ratio is high, they are statistically insignificant when the tax-GDP ratio is low. In addition, the estimated impulse responses of output tend to be positively correlated with those of employment but negatively correlated with those of consumption. The signs of the correlation appear consistent with the predictions of the static and dynamic neoclassical models whereas they are at odds with the predictions of the traditional Keynesian model. Overall, our theoretical and empirical findings suggest that fiscal expansion has more significant positive effects on output in countries with large governments or relatively high tax rates.
This study contributes to the literature by providing a comprehensive analysis on the impact of tax policy or government size on government spending multipliers because no previous study considered overall tax rates or government size as a factor or determinant of the multipliers. In this sense, this study provides novel insights into the role of underlying tax rates in government stabilization policies through government spending. However, our analysis can be extended in several ways. First, we consider relatively simple neoclassical models to illustrate the role of the income tax rate in the government spending multiplier. In contrast, a similar analytical or quantitative analysis could be conducted using more sophisticated models that could better match real-world phenomena. Empirically, we use the tax-GDP ratio as an indicator of overall tax policy. Alternatively, one can use actual tax rates, such as income and value-added tax rates, as indicators of tax policy. In addition, one could estimate state-dependent tax multipliers that depend on the size of government spending using the narrative-based method à la Romer and Romer (Reference Romer and Romer2010). These approaches could shed light on the interactions between taxes and government spending on fiscal policy to stabilize the macroeconomy.
Appendix A. The steady state of the dynamic neoclassical model
In this appendix, we prove the two propositions discussed in Subsection 2.2. First, we show that $m^{\ast }=\partial Y^{\ast }/\partial G^{\ast }$
has the same sign as
$m^{\ast }=\partial Y^{\ast }/\partial G^{\ast }$
has the same sign as $\partial L^{\ast }/\partial G^{\ast }$
but has the opposite sign to
$\partial L^{\ast }/\partial G^{\ast }$
but has the opposite sign to $\partial C^{\ast }/\partial G^{\ast }$
. Then, we derive equation (10). We can provide the equilibrium conditions in the steady state as follows:
$\partial C^{\ast }/\partial G^{\ast }$
. Then, we derive equation (10). We can provide the equilibrium conditions in the steady state as follows:
 \begin{gather*} \xi \frac{C^{\ast }}{1-L^{\ast }}=\left ( 1-\tau \right ) \left ( 1-\alpha \right ) \left ( K^{\ast }\right ) ^{\alpha }\left ( L^{\ast }\right ) ^{-\alpha }\\ 1=\beta \left [ 1-\delta +\alpha \left ( 1-\tau \right ) \left ( K^{\ast }\right ) ^{\alpha -1}\left ( L^{\ast }\right ) ^{1-\alpha }\right ] \\ C^{\ast }+G^{\ast }+\delta K^{\ast }=\left ( K^{\ast }\right ) ^{\alpha }\left ( L^{\ast }\right ) ^{1-\alpha }\\ Y^{\ast }=\left ( K^{\ast }\right ) ^{\alpha }\left ( L^{\ast }\right ) ^{1-\alpha } \end{gather*}
We can find the values of $\left ( C^{\ast },L^{\ast },K^{\ast },Y^{\ast }\right )$
from these equations.
$\left ( C^{\ast },L^{\ast },K^{\ast },Y^{\ast }\right )$
from these equations.
Next, we take total differentials of the steady-state equilibrium conditions and divide them by $dG^{\ast }$
as follows:
$dG^{\ast }$
as follows:
 \begin{equation} \frac{1}{C^{\ast }}\frac{\partial C^{\ast }}{\partial G^{\ast }}+\left ( \frac{1}{1-L^{\ast }}+\frac{\alpha }{L^{\ast }}\right ) \frac{\partial L^{\ast }}{\partial G^{\ast }}-\frac{\alpha }{K^{\ast }}\frac{\partial K^{\ast }}{\partial G^{\ast }}=0 \end{equation}
 \begin{equation} \frac{1}{L^{\ast }}\frac{\partial L^{\ast }}{\partial G^{\ast }}=\frac{1}{K^{\ast }}\frac{\partial K^{\ast }}{\partial G^{\ast }} \end{equation}
 \begin{equation} -\frac{\partial C^{\ast }}{\partial G^{\ast }}+\left ( 1-\alpha \right ) \frac{Y^{\ast }}{L^{\ast }}\frac{\partial L^{\ast }}{\partial G^{\ast }}+\left [ \alpha \frac{Y^{\ast }}{K^{\ast }}-\delta \right ] \frac{\partial K^{\ast }}{\partial G^{\ast }}=1 \end{equation}
 \begin{equation} \frac{\partial Y^{\ast }}{\partial G^{\ast }}=\alpha \frac{Y^{\ast }}{K^{\ast }}\frac{\partial K^{\ast }}{\partial G^{\ast }}+\left ( 1-\alpha \right ) \frac{Y^{\ast }}{L^{\ast }}\frac{\partial L^{\ast }}{\partial G^{\ast }} \end{equation}
Using these conditions, we prove the following proposition:
 \begin{equation} sign\left ( \frac{\partial Y^{\ast }}{\partial G^{\ast }}\right ) =sign\left ( \frac{\partial L^{\ast }}{\partial G^{\ast }}\right ) =-sign\left ( \frac{\partial C^{\ast }}{\partial G^{\ast }}\right ) . \end{equation}
Equation (A2) implies
 \begin{equation*} \frac {\partial K^{\ast }}{\partial G^{\ast }}=\frac {K^{\ast }}{L^{\ast }}\frac {\partial L^{\ast }}{\partial G^{\ast }}. \end{equation*}
Plugging this equation into equations (A1) and (A4), we obtain the following equations:
 \begin{align*} \frac{\partial C^{\ast }}{\partial G^{\ast }} & =-\frac{C^{\ast }}{1-L^{\ast }}\frac{\partial L^{\ast }}{\partial G^{\ast }}\\ \frac{\partial Y^{\ast }}{\partial G^{\ast }} & =\frac{Y^{\ast }}{L^{\ast }}\frac{\partial L^{\ast }}{\partial G^{\ast }} \end{align*}
Clearly, these equations imply equation (A5).
We turn to express $m^{\ast }=\partial Y^{\ast }/\partial G^{\ast }$
in terms of model parameters. Using the previous three equations, we can rewrite equation (A3) as
$m^{\ast }=\partial Y^{\ast }/\partial G^{\ast }$
in terms of model parameters. Using the previous three equations, we can rewrite equation (A3) as
 \begin{equation*} \frac {\partial L^{\ast }}{\partial G^{\ast }}=\left [ \frac {C^{\ast }}{1-L^{\ast }}+\frac {Y^{\ast }}{L^{\ast }}-\delta \frac {K^{\ast }}{L^{\ast }}\right ] ^{-1}. \end{equation*}
Then, $\partial Y^{\ast }/\partial G^{\ast }$
is obtained from equation (A4) as follows:
$\partial Y^{\ast }/\partial G^{\ast }$
is obtained from equation (A4) as follows:
 \begin{equation*} \frac {\partial Y^{\ast }}{\partial G^{\ast }}=\frac {Y^{\ast }}{L^{\ast }}\frac {\partial L^{\ast }}{\partial G^{\ast }}=\left [ \frac {C^{\ast }}{1-L^{\ast }}\frac {L^{\ast }}{Y^{\ast }}+1-\delta \frac {K^{\ast }}{Y^{\ast }}\right ] ^{-1}. \end{equation*}
The first and third terms in the square brackets are obtained from equations (8) and (9) as follows:
 \begin{align*} \frac{C^{\ast }}{1-L^{\ast }}\frac{L^{\ast }}{Y^{\ast }} & =\frac{\left ( 1-\tau \right ) \left ( 1-\alpha \right ) }{\xi }\\ \delta \frac{K^{\ast }}{Y^{\ast }} & =\delta \left ( \frac{K^{\ast }}{L^{\ast }}\right ) ^{1-\alpha }=\frac{\delta \alpha \left ( 1-\tau \right ) }{\beta ^{-1}-1+\delta } \end{align*}
Therefore, $m^{\ast }$
is rewritten as
$m^{\ast }$
is rewritten as
 \begin{equation*} m^{\ast }=\frac {\partial Y^{\ast }}{\partial G^{\ast }}=\left [ \frac {\left ( 1-\tau \right ) \left ( 1-\alpha \right ) }{\xi }+1-\frac {\delta \alpha \left ( 1-\tau \right ) }{\beta ^{-1}-1+\delta }\right ] ^{-1}. \end{equation*}
Rearranging terms yields the expression for $m^{\ast }$
in equation (10).
$m^{\ast }$
in equation (10).
Appendix B. Impulse responses of output during expansions and recessions depending on the size of governments
Recent studies, such as Auerbach and Gorodnichenko (Reference Auerbach and Gorodnichenko2012) and Ramey and Zubairy (Reference Ramey and Zubairy2018), indicate that fiscal multipliers are contingent on the phase of the business cycle.Footnote 17 It has been suggested that fiscal multipliers tend to be more substantial during periods of economic downturn. When estimating the effect of fiscal policy on economic variables, economic conditions, whether a boom or recession, can be considered. Thus, our study takes into consideration both the business cycle and the size of governments (i.e., tax revenue).
Specifically, we employ a dummy variable for the tax-GDP ratio. Then, we estimate state-dependent local projections using output growth in the previous period as a transition variable so that we can analyze the effect of fiscal policy during periods of expansion and recession. Fig. B1 illustrates the estimated impulse responses of output to a positive government purchases shock, contrasting economies with high tax-GDP ratios against those with low ratios. Interestingly, during recessions, countries with higher tax revenues exhibit a more significant and pronounced effect of fiscal policy compared to those with lower revenues, and this difference is statistically significant. However, for both groups, it appears that fiscal policy is ineffective during expansions. Taken together, this analysis suggests that countries with higher tax revenues may have more fiscal space, which allows them to pursue more expansive fiscal policies during recessions. This can include increasing government spending on infrastructure and social services to stimulate demand. In contrast, countries with lower tax revenues may have limited fiscal space, making it challenging to implement significant fiscal stimulus measures during recessions.
Estimated impulse responses of output to a positive shock to government purchases using lagged output growth as a transition variable for economies with high and low tax-GDP ratios, respectively, with 90% confidence bands.
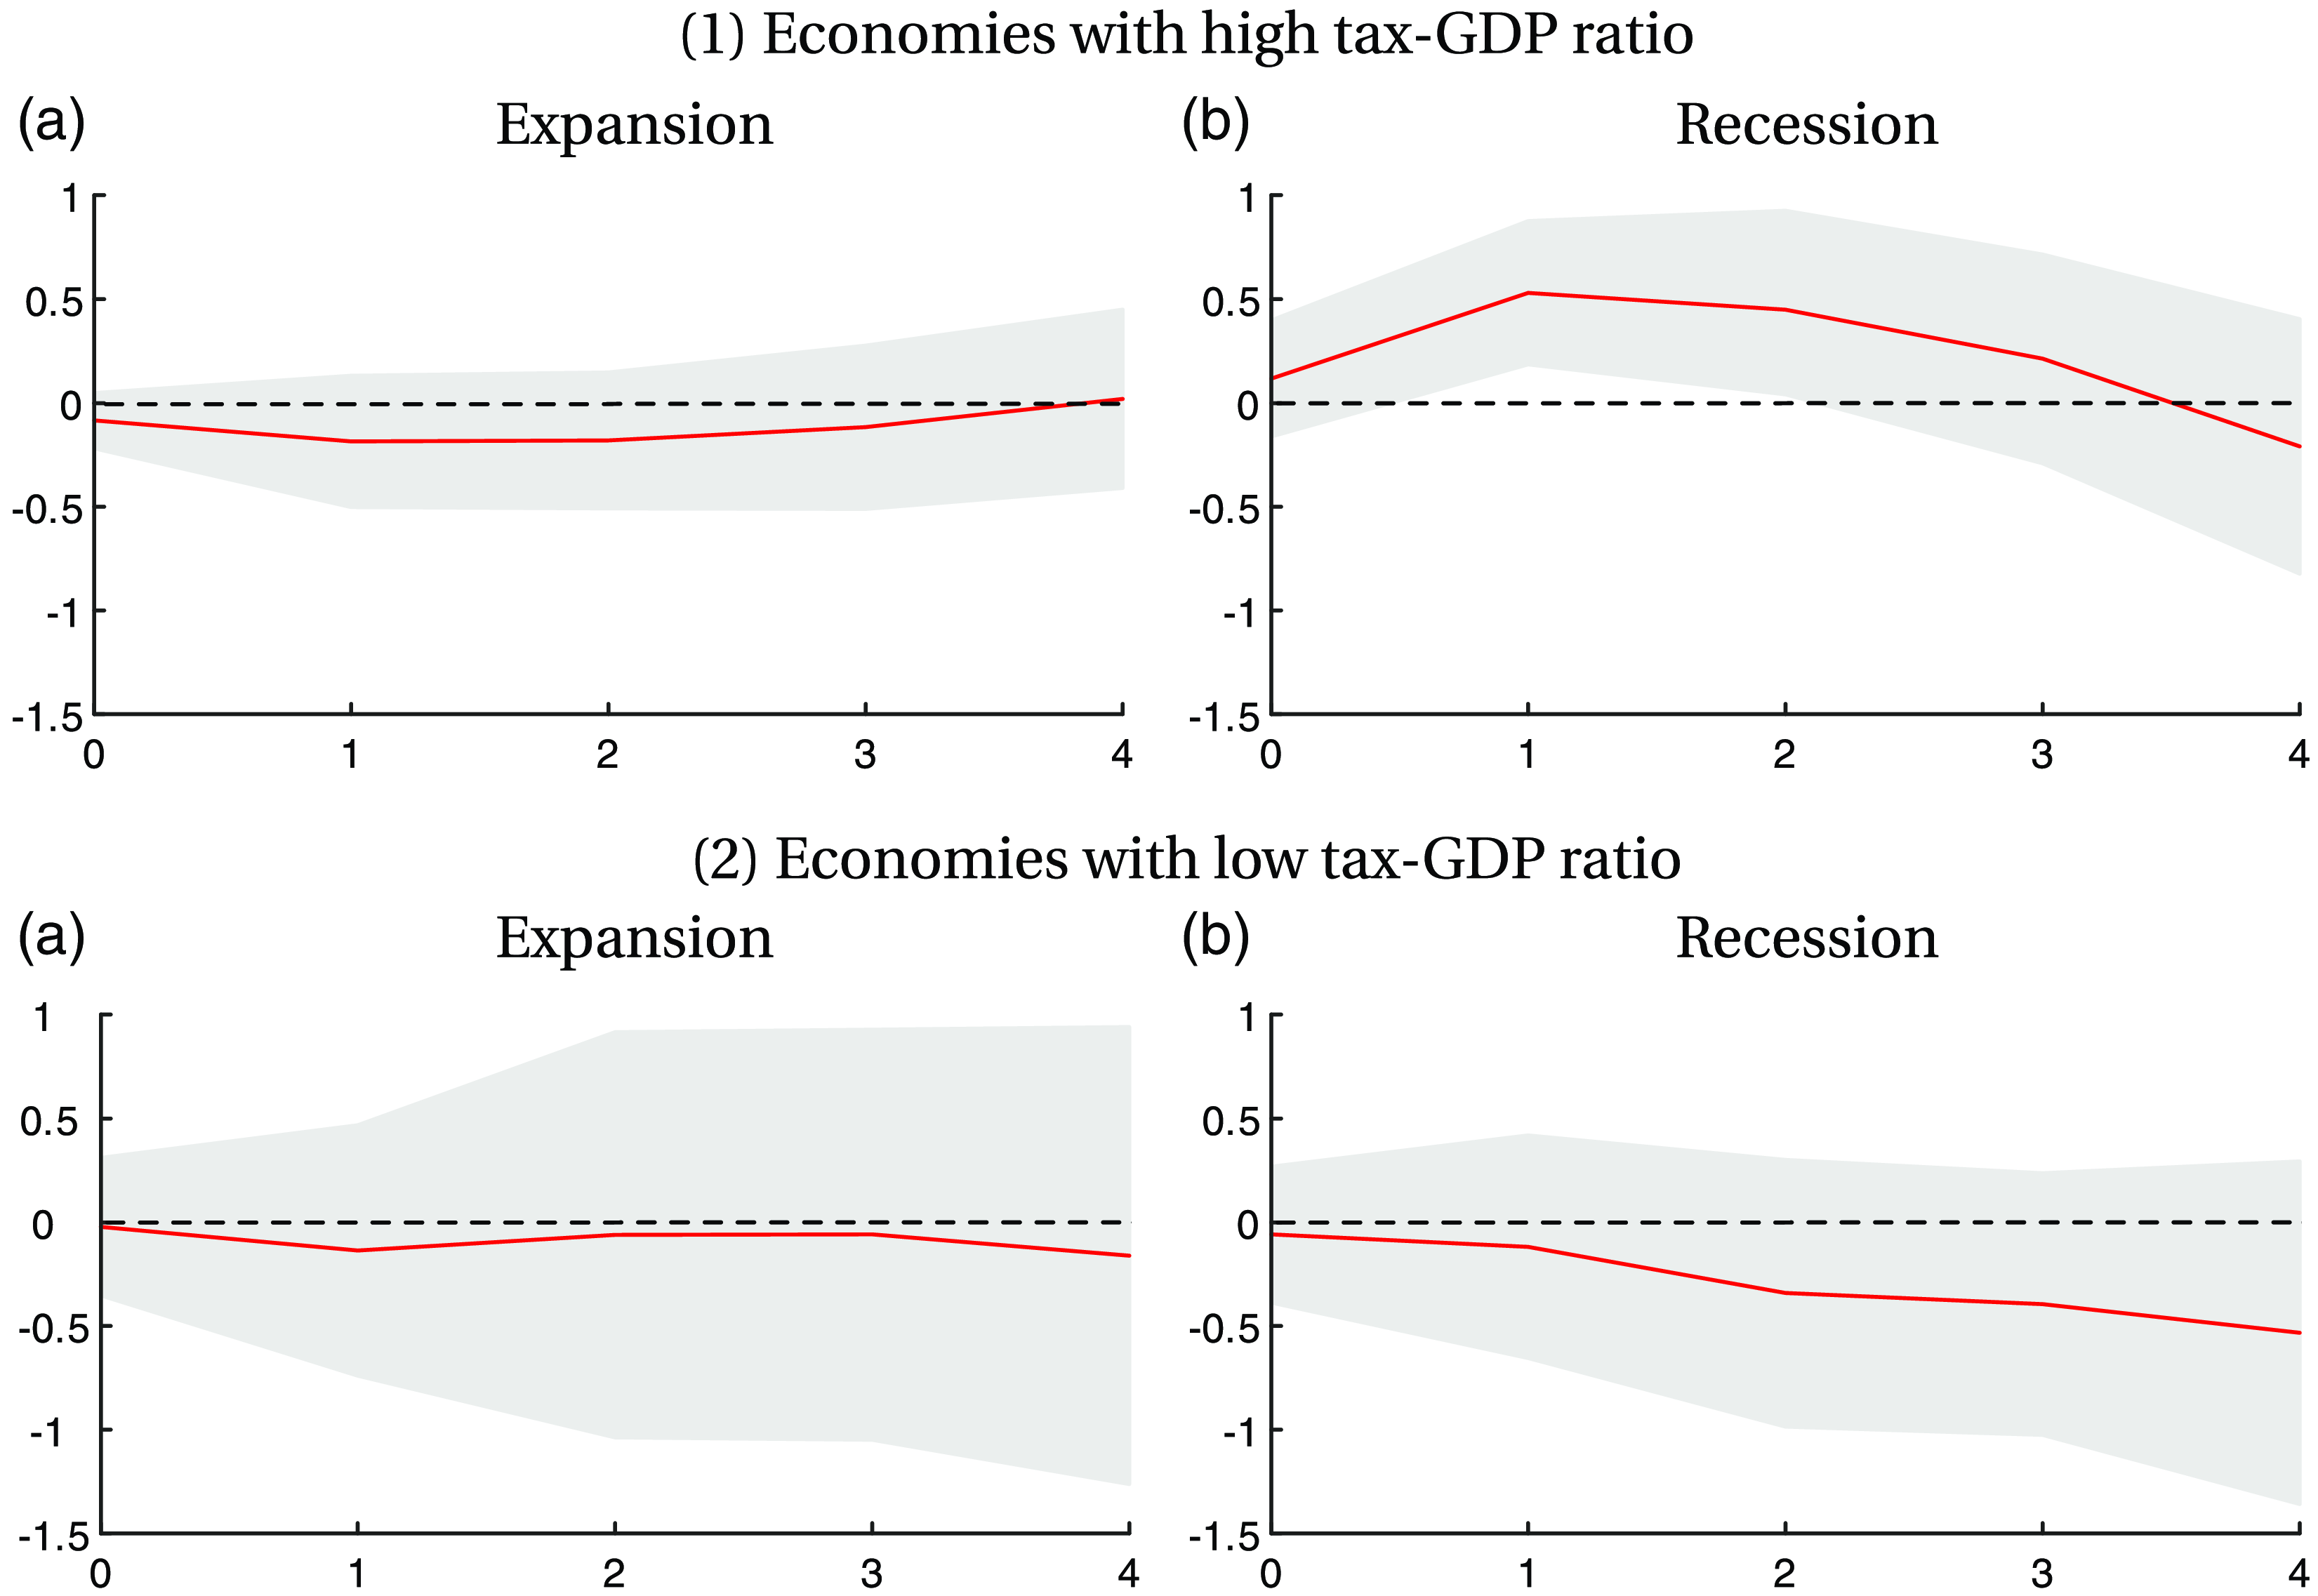
Appendix C. Impulse response of output estimated from a linear model
Figure C1 demonstrates the impulse response of output, estimated from a linear model. The linear model delivers a clear picture. Following an expansionary fiscal policy shock, the level of output increases. Specifically, to a positive government spending shock, there is an immediate positive impact on output (i.e., at $h=0$
), which is statistically significant. This suggests that, in the absence of considering the state of tax revenue, an increase in government spending tends to stimulate output. Subsequently, at
$h=0$
), which is statistically significant. This suggests that, in the absence of considering the state of tax revenue, an increase in government spending tends to stimulate output. Subsequently, at $h=1$
and
$h=1$
and $h=2$
, the impulse response of output continues to exhibit positive values, indicating a prolonged but diminishing effect of the government spending shock on output. However, these effects are statistically insignificant. This suggests that while the positive impact on output persists beyond the immediate period, it becomes less discernible and lacks statistical significance as time progresses.
$h=2$
, the impulse response of output continues to exhibit positive values, indicating a prolonged but diminishing effect of the government spending shock on output. However, these effects are statistically insignificant. This suggests that while the positive impact on output persists beyond the immediate period, it becomes less discernible and lacks statistical significance as time progresses.
Impulse response of output to a positive shock to government purchases estimated from a linear model. Shaded areas indicate 90% confidence bands.

Overall, the estimation results imply that when tax revenue is not taken into account, a positive government spending shock tends to induce a short-term boost in output. This finding is in line with the literature.Footnote 18 That is, previous studies suggest that the effect of fiscal policy is positive, meaning that government purchases stimulate output. However, as aforementioned, when the state of tax revenue is considered, the dynamics of fiscal policy effects on output reveal a notable pattern. The state-dependent output responses tend to diverge between economies with high and low tax revenues. This divergent pattern indicates that an increase in government spending tends to boost output when the tax-GDP ratio is high. Conversely, in economies with a lower tax-GDP ratio, such an expansion in fiscal policy may lead to a statistically insignificant response of output.


 Open access