

1. Introduction
In 2023, the U.S. Office of Management and Budget (OMB) transformed policy assessment practices by promulgating a set of distributional weights that agencies could use in their benefit-cost analyses. The two principal OMBs (2023b, 2023c) guidance documents for policy analyses by federal agencies are Circular A-4, which provides guidance for regulatory analyses, and Circular A-94, which provides guidance for policy analyses more generally. In each of these circulars, OMB established the same framework for assigning distributional weights to benefit and cost impacts. The following statement appears in footnote 126 of Circular A-4 (OMB, 2023b) and footnote 3 of Circular A-94 (OMB, 2023c): “In other words, you can compute a weighted sum of the subgroup-specific net benefits where the weight for subgroup 𝑖, denoted $ {w}_i $
, is
$ {w}_i $
, is
 $$ {w}_i={\left(\frac{{\overline{y}}_i}{y_{\mathrm{med}}}\right)}^{-\varepsilon }. $$
In this formula, $ {\overline{y}}_i $
is the median income for subgroup 𝑖,
$ {\overline{y}}_i $
is the median income for subgroup 𝑖, $ {y}_{\mathrm{med}} $
is U.S. median income, and ε is the absolute value of the elasticity of marginal utility (OMB, 2023b, 2023c). OMB sets the absolute value of the income elasticity of the marginal utility of income equal to 1.4.
$ {y}_{\mathrm{med}} $
is U.S. median income, and ε is the absolute value of the elasticity of marginal utility (OMB, 2023b, 2023c). OMB sets the absolute value of the income elasticity of the marginal utility of income equal to 1.4.
Adopting this weighting procedure was not a minor technical modification to benefit-cost analysis practice, despite the formula being relegated to footnotes in both guidance documents. This weighting approach represents a stark departure from efficiency-oriented benefit-cost analyses and produces a fundamental reduction in the traditional role of benefit-cost analyses in policy assessments. If incorporated into policy decisions, this technical shift will also produce a transformation of government policies and the distributional effects that these policies will have.
While some modifications in the benefit-cost procedures to reflect distributional concerns are desirable, the rationale for this OMB weighting approach is not compelling. As I observed in my remarks on the Circular A-4 panel at the 2023 Society for Benefit-Cost Analysis conference, these distributional weights may reflect the Biden OMB social welfare function, but they do not reflect society’s social welfare function. I further speculated that these weights would be eliminated from future drafts of Circular A-4 by any Republican or centrist Democratic administration. In this article, I elaborate on why the weights do not reflect society’s social welfare function and how government agencies can retain the constructive role of efficiency-oriented benefit-cost analyses while also better addressing equity concerns. A letter to the administrator of the OMB Office of Information and Regulatory Affairs by all past presidents of the Society for Benefit-Cost Analysis and the two recent editors-in-chief of the Journal of Benefit-Cost Analysis expressed unanimous opposition to the proposed distributional weights (Harberger et al., Reference Harberger, Jenkins, Cordes, Weimer, Lisa Robinson, Dudley, Karoly, Kenkel, Nardinelli, Thornton, Whittington, Kniesner and Hoyt2023).Footnote 1 In my A-4 peer review comments (Viscusi, Reference Viscusi2024), I also opposed the weights.
My assessment of the impact of the OMB weights will be quite general and will include both financial impacts as well as health effects. Valuing risks to life is the dominant benefit component of regulatory impact analyses for government regulations, as documented in Viscusi (Reference Viscusi2018) and Aldy and Viscusi (Reference Aldy and Viscusi2024). For many years, OMB has recognized that mortality risks have comprised the largest share of regulatory benefits. The pivotal role of mortality risk reduction benefits is reflected in the fact that recently Environmental Protection Agency (EPA) regulations have accounted for 80% of the benefits of all federal regulations (Aldy, Reference Aldy2020). Regulation of fine particulate matter (PM 2.5) alone accounts for one-half of the monetized benefits of all federal regulations. For all major Clean Air Act regulations from 1997 to 2020, 70% of the environmental benefits are from fine particulate matter (Aldy, Reference Aldy2020). Almost all these benefits—99% in the 2024 revision of the National Ambient Air Quality Standards—involve monetizing the value of mortality risks (Aldy et al., Reference Aldy, Kotchen, Evans, Fowlie, Levinson and Palmer2021). Even recent calculations of the social cost of greenhouse gas emissions found that mortality-related impacts may comprise as much as three-fourths of the global costs of climate change. Mortality risk reductions have a prominent role in other regulatory efforts, such as health and safety regulations related to transportation, occupations, and health care. Any meaningful assessment of the role of the OMB distributional weights necessarily must examine the implications for how such weights would affect mortality risk benefits if one adopted the economic formulation that OMB specified as underlying the structure of the weights.
Section 2 begins with an elaboration of the practical implications of the OMB formula. Although the OMB weighting equation is quite explicit, it is likely that few observers will be able to translate the opaque weighting formula into numerical weights that apply to impacts on different population groups. Quite simply, the implications of the weights are not transparent. My calculations in Section 2 indicate the far-reaching practical consequences of the weights. Illustrative calculations of the weights derived from the OMB formula reveal the stark, and surely controversial, distributional impacts that the procedure will generate. Section 3 examines the three different assumptions that underlie the specific aspects of the OMB weighting formula: the underlying conception of the social welfare function, the characterization of individual utility functions that are components of the social welfare function, and the responsiveness of the marginal utility of income to differences in income levels. There is no compelling basis for concluding that this set of assumptions reflects society’s social welfare function. The relationship between the income elasticity of the marginal utility of income and the income elasticity of the value of a statistical life is consequential in that it drives the impact of the weights on the valuation of mortality risks. Although the OMB guidance seeks to avoid this issue by exempting mortality risks from the weights, the stated rationale for the exemption is inconsistent with the empirical evidence on the income elasticity of the value of a statistical life.
Whether there is a rationale for any broadening of the perspective of benefit-cost analyses to incorporate equity concerns is the focus of Section 4. In much the same way that OMB urges regulatory agencies to inquire what is market failure, it is also instructive to begin by inquiring what is the analytical failure of benefit-cost analyses. Does such a purported shortcoming justify a revamping of the benefit-cost approach to incorporate distributional weights? Despite the strengths of efficiency-oriented benefit-cost analyses, it might be desirable to bolster the role of equity concerns while also maintaining the integrity of benefit-cost analyses. Alternative approaches to promoting equity range from amendments to ensure that distributional impacts become more apparent to the development of explicit social welfare functions. The concluding Section 5 discusses what the proper role of economic analyses is with respect to recognizing distributional concerns.
2. What the OMB formula means
2.1 Weights at different income levels
Translating the OMB formula into numerical weights indicates the magnitude of the consequences of the OMB weighting approach. The weights determine the relative value that agencies can place on benefits and costs to those in different income groups. For example, a weight of 0.5 implies that the benefits and costs to that group would count for half of the amount that would be calculated in a standard benefit-cost analysis. For purposes of this illustration, I will set the median household income to be used in implementing the OMB formula at $75,000. This value is only slightly higher than the $74,500 median household income value for 2022 and yields results that are quite similar to the values using $74,500. For example, the distributional weight at the $75,000 income level is 1.0 using the $75,000 median income and is 0.99 based on the $74,500 median income value for the weights. Table 1 presents the applicable weight for households at each of the different income levels. The indicated income values that I selected for this illustration range from $25,000 to $1 million, along with 5 focal income levels between these extremes. Because of the skewed distribution of income, there is a long upper tail of household income levels. The $400,000 income level is of particular interest since President Biden indicated that there would be no future income tax increases for households with a total household income level below $400,000. This income level also is both the president’s current annual salary as well as the upper bound on family income to qualify for what has been framed as a prospective middle-class tax cut. This number has become a focal policy-relevant figure for what income level is needed to be relatively affluent.
Implied weights with median income = $75,000

Notes: Weights are based on the OMB formula. The critical B-C ratio is 1/ $ {w}_i $
.
$ {w}_i $
.
The first column of statistics in Table 1 indicates the value of the weights at different income levels. The OMB formula generates an up-weighting of impacts on households below the median-income level and a down-weighting of impacts on households with income levels above the median. The substantial differences in the applicable weights imply that the weights will produce a dramatic change in the overall targeting of government programs if agencies choose to base policies on these weights. Impacts on those with a household income of $25,000 will receive a weight of 4.7. In effect, one dollar in benefits and costs to this group count as being almost five times greater than the actual monetary value. Impacts on households with an income of $50,000 have a value almost double the usual monetized amount. The calculus becomes reversed for those with household incomes above $75,000. By the $200,000 income level, impacts only count for one-fourth of their monetized value, as their weight is 0.25.
Once the income level of $400,000 is reached, all impacts on those at this income level will count for just under 10% of their monetized value. It is difficult to reconcile the extent of the redistributive impact generated by the application of these weights with Biden’s tax policy pledge. If a presidential administration only believes that it is appropriate to raise taxes on households with income levels in excess of $400,000, why is it appropriate to discount their willingness-to-pay amount for benefits from government policies by over 90%? For the tax policy approach to be consistent, should not there be huge increases in taxes on those with income levels of $400,000? After all, given the OMB formula, the value that they place on money is less than 10% as great as that at the median-income level.
Matters become increasingly dire for those with even higher-income levels. At the income level of $1 million, the distributional weight plummets to under 0.03. In effect, any monetized impacts on this group will drop out of almost any benefit-cost analysis. From an income redistribution standpoint, it would be desirable to take $1 from a millionaire if doing so would boost the income of those in the median household by three cents. A benefit amount of under one cent to those with income levels of $25,000 would be more than sufficient to warrant a $1 transfer from a millionaire. There would need to be a 2-cent benefit to those at the $25,000 level to warrant a transfer of $1 from the $400,000 group at the income tax increase threshold.
2.2 Implications for critical benefit-cost ratios
The weights also have implications for assessing whether a policy meets the usual benefit-cost threshold, which is a benefit-cost ratio of at least 1.0 to warrant proceeding with the policy. Suppose the analysis is undertaken in the traditional way, valuing benefits and costs based on economic efficiency criteria. Also, it is assumed that the costs of the policy are borne by the median household so that there is no additional weight applied to the cost component. Let us consider a series of policies, each of which has benefits to only a single income group in Table 1. The second column of statistics in Table 1 provides the critical benefit-cost ratio that would apply to each of these income groups after adjusting for the OMB distributional weighting. For the $25,000 income group, the critical ratio need only be 0.22. Even if the standard efficiency-based calculation of benefits indicates that the benefits that are just over one-fifth of the costs, the policy would pass a benefit-cost test after the distributional weights are applied. When the target beneficiary group is $50,000, the critical benefit-cost ratio rises to 0.57. Although policies with this performance level would have failed a standard benefit-cost test, so long as the benefits are at least 57% of the value of the costs, the policy will pass the post-weighted test. At the median-income level of $75,000, the critical benefit-cost cutoff value remains at 1.0 and is unaffected by the weights.
The demands placed on policy performance escalate for income levels in excess of the median. The required benefit-cost ratio is 1.5 for those with an income of $100,000, 3.95 for those with an income of $200,000, 10.42 for households with an income of $400,000, and 37.58 for households with an income of $1,000,000. Note that the required level of policy performance required by the critical benefit-cost ratio increases more than proportionally with changes in the income level. Doubling the income from $100,000 to $200,000 leads to a critical benefit-cost ratio that is 2.6 times as great as it was in the base income level of $100,000. Similarly, doubling the income level from $200,000 to $400,000 leads to a benefit-cost ratio that is 2.6 times as great as it is at the income level of $200,000. The tenfold increase in income from $100,000 to $1,000,000 produces a critical benefit-cost ratio that is about 25 times as great. The more than proportional impacts of the response of the calculated weights to increases in the income level are a consequence of the assumed structure of the weighting scheme, which will be examined in greater detail in Section 3.
2.3 Examples of financial stakes
The consequences of the weights will affect every component of the benefit-cost analysis. Although all property losses will be treated similarly, for concreteness, consider a situation in which households at each income level have a house that equals the value of their household income. Table 2 summarizes the impact of the weights on the value that will be assigned to risks to these houses in a benefit-cost analysis. The government is considering protective measures to reduce hazards such as fires and floods that may damage the house. In the usual benefit-cost analysis, the analyst would assign the market value as the monetary amount that is being protected by the policy. Thus, a house with a market value of $25,000 has a value in the benefit-cost analysis of $25,000. Given the OMB weighting scheme, the values assigned to the houses will be quite different. After applying the distributional weights, the $25,000 house now has a value of $116,400; the $50,000 house now has a value of $88,200; and the value of the $75,000 home is unchanged.
Weighted value of property equal to household’s income level

Notes: Weighted values are based on the weights from Table 1 and the assumption that the house has a market value equal to the household’s income.
Policies that are based on these numbers will be a very inefficient mechanism for income redistribution. Rather than spending up to $116,400 to save a home that is worth $25,000, it would be preferable both for the recipient as well as for those bearing the cost of the policy to pay the homeowner some amount greater than $25,000 and less than $116,400 instead of valuing the house at its weighted value. If the homeowner and the party bearing the costs split the potential savings, the homeowner could be paid $70,700, making a profit of $45,700, and those bearing the costs would save $45,700.
Weighting has the opposite effect for houses owned by those with incomes above the median. Houses owned by those at higher-income levels become increasingly discounted. The value of the house declines to levels that may be far below those of lower-priced houses even though their actual market value is much greater. Somewhat paradoxically, market house values go up at higher-income levels, but the weighted house values go down. After applying the distributional weights, the $100,000 house is now worth $66,800; the $200,000 house is now valued at $50,600; the $400,000 house is now valued at $38,400; and the $1,000,000 house has a weighted value of only $27,000. If we compare the extreme income group categories from Table 1, the house with a market value of $25,000 has a weighted value that is more than four times as great as the $1,000,000 house even though the million-dollar house has a market value that is 40 times as much.
Even with less extreme comparisons than those involving certain losses, the consequences of the weighting are profound. Let the risk of a natural disaster threatening all houses be 1/100. From the standpoint of private valuations, a risk-neutral household would be willing to pay $4,000 to prevent this risk for a $400,000 house and $500 to prevent this risk for a $50,000 house. If the houses were located on the same block, the total value that policy analysts would assign to protecting the two houses based on the expected losses involved would be $4500, or $2250 per house. If instead, the town was divided into two separate areas with houses of each type, it would be worth $4,000 times the number of homes to protect the more affluent area where the income level and house values are $400,000, and $500 times the number of homes to protect the less affluent area where the income level and house values are $50,000. Application of the average expected house damage of $2,250 per house that is pertinent when there is an equal number of houses of each type on the block to the situation in which the rich and poor households are geographically separate would lead to suboptimal protection of the more expensive houses and excessive protection of the less expensive houses.
Excessive valuation of property losses by distributional weights that assign a premium to the market value of property owned by those with below-average income levels also may have adverse effects on incentives for self-protection. Insurance companies do not write coverage for more than the value of the property at risk to avoid the moral hazard effect caused by the payoff after a loss exceeding the market value of the property. The OMB distributional bonus is potentially substantial even for households with income levels of $50,000, which is two-thirds of the median-income level but generates a 76% property value bonus after application of the weights. The moral hazard problem is especially evident in recurring natural disasters. If the government pays more than the property is worth after the property is lost from a flood, it will create an incentive to rebuild the house in a flood-prone location and potentially earn a future bonus if there is another flood. A preferable societal outcome in high-risk locales is for people to move rather than rebuild and anticipate another windfall disaster insurance payout. Although one might expect that reimbursements would be capped at the unweighted value of the house, protective measures by the government would be based on the weighted values.
OMB weights also distort other calculations involving group protections. There could be a bizarre outcome, whereby having more expensive houses in one’s neighborhood reduces rather than increases the value of protecting the houses in the neighborhood, as the following example shows. Suppose that protecting the block of houses with one house of each type would have a value of $384 for the $400,000 house and $882 for the $50,000 house, for a total of $1,266, which is $633 per house. If both houses were $50,000 houses, it would be worth paying $882 per house for protection. The result of pooling the weighted higher-income houses with the lower-income houses is that it is now less desirable to provide protection for the $50,000 houses than it would be under the market-based approach. Weighting coupled with pooling will have an adverse effect on the lower-income household because the weighting penalty on the more affluent household has dragged down the average overall valuations.
The group externalities problem would not arise if the houses were in different areas of town and protected by separate policies. Under the OMB weighting scheme, the value of protecting the $400,000 home area would be $384 times the number of such homes, and the value of protecting the $50,000 home area would be $882 times the number of such homes. While the more affluent homeowners fare poorly whether they share a neighborhood with less affluent households or are in a separate neighborhood, the less affluent households benefit if they are in a distinct neighborhood and can reap the gains of the distributional weighting premium. But the lower-income households are harmed by weighting if they are located in a mixed neighborhood, as gentrification drags down the average value of protection.
2.4 Examples involving mortality risks
The unit benefit measure for valuing mortality risks is the value of a statistical life (VSL). The VSL corresponds to the money-risk tradeoff for small changes in the risk level. Government agencies use the VSL to assign a monetary value to each expected death that is prevented by government policies. Most of the reliable evidence on the VSL in the economics literature is from the labor market. Suppose that workers are paid an average of $1,200 per year to incur an annual fatality risk of 1/10,000. Then 10,000 workers would require a total of $12 million to incur a risk of one expected death for this group. A large literature has documented these wage-risk tradeoff rates, and the VSL figure used by some government agencies is in the $12 million (2022 USD) range. The discussion in this section takes as the starting point the current government practice of assigning the same VSL to all populations, irrespective of income. Section 3 examines the potential influence of heterogeneity in the applicable VSL.
Any application of weights to monetize mortality risks would mark a dramatic departure from current practices in which government agencies apply a uniform VSL to all lives, whether rich or poor.Footnote 2 The standard policy analysis valuation is consistent with what I have termed “equitable risk tradeoffs.” I have advocated what I have termed the “equitable risk tradeoffs” approach in all my research, particularly beginning with my article, “Risk Equity” (Viscusi, Reference Viscusi2000), and more recently in Viscusi (Reference Viscusi2018) and Kniesner and Viscusi (Reference Kniesner and Viscusi2023). My proposed risk equity concept is that there should be equalization of cost-risk tradeoff rates across the population rather than ensuring that everyone has the same mortality risk level. All lives matter, and they matter equally. The assumption underlying my approach is that when public rather than private funds are being expended to reduce mortality risks, society does not assign a value to these risks based on the individual’s income level. Adopting a comparable average value approach for property losses would not be appropriate given the aforementioned inefficiencies that would result, as well as what I consider to be the lack of societal consensus that differences in the values of property should be ignored.
The draft version of Circular A-4 made no provision for the fact that the application of average estimates of the VSL already incorporated a substantial distributional premium by valuing mortality risks the same for all those at risk. Government agencies do not assign a higher VSL to more affluent populations. In my comments as a member of the Circular A-4 peer review panel (Viscusi, Reference Viscusi2024), I indicated that OMB was remiss in failing to take this premium into account. The final version of Circular A-4 sought to amend this oversight by declaring that the absolute value of the income elasticity of the marginal utility of income value used in the weighting formula is the same as the income elasticity of the VSL so that the role of the weights would drop out for mortality risks. In discussing the implications of applying the same average VSL across the population, the final version of OMB (2023b) Circular A-4 concluded: “This amounts to weighting mortality risks by the income elasticity of the marginal utility (given that it is also the income elasticity of individuals’ valuation of mortality risk). In practice, therefore, you should not apply income weights to such values of mortality risk reductions; they have already been weighted by income.” Dismissing the weighting of the VSL as an issue does not mean that it was resolved satisfactorily if the solution is based on an incorrect empirical assumption that the income elasticity of the marginal utility of income and the VSL are fully offsetting. OMB (2023c) Circular A-94 was less explicit and did not fully embrace the full offset assumption: “For example, agencies may use a value of statistical life that does not depend on sub-population income or a population-average home value. Agencies should be cautious in applying income weights to such values since distributional considerations about income may have already been partly or fully addressed through the use of such values.” In Section 3, I review the empirical evidence on the income elasticity of the VSL and find that it does not imply that the role of distributional weights drops out of the analysis. That this is the case is also suggestive that either the extent of the distributional distinctions incorporated in the OMB weights are excessive or OMB should also be weighting mortality risk benefits.
The fact that the financial well-being of more affluent respondents is significantly disadvantaged by the weighting scheme may not be viewed as a cause for concern by observers favoring an aggressive effort to redistribute income. The rich usually have additional resources that they can draw upon to maintain a high level of well-being even in the absence of providing substantial protection from losses to their property. It is feasible to replace losses that are financial in character, and more affluent households are better able to undertake such efforts. While financial cost scenarios can serve as tidy illustrative examples of the role of distributional weights, these examples are not reflective of the risk-related focus of most government policies. What is at stake with respect to these policies is not a replaceable property loss or a financial setback but rather the loss of one’s life. The concern that people might have for differential impacts based on income groups may be quite different than for financial losses.
If agencies had applied the OMB weights to all policy impacts, as was indicated in the proposed Circular A-4, doing so would have generated a quite different valuation of mortality risks than under current agency practices in which the same VSL of about $12 million is applied to all income groups. Table 3 summarizes the resulting unit benefit values for reducing one expected death for each of the income groups if there was a straightforward application of the weights to the VSL. The weighted VSL levels range from $320,000 for those with a household income of $1 million to $55.87 million for those with an income of $25,000. Suppose that the government had $50 million to allocate for life-saving programs. Preventing one expected death for those with an income level of $25,000 would be warranted, as that effort would have a positive benefit-cost ratio. However, if the prevented deaths were in other income groups in Table 3, there would need to be greater mortality risk reductions than one expected death to warrant the $50 million cost. The number of required expected lives saved would be 156 lives for millionaires, 43 for those at $400,000, 16 for those at $200,000, 6 for those at $100,000, and 4 for the median household income of $75,000. Across the board, there will be a systematic devaluation of the lives of all those with above-average income, making it less worthwhile to pursue policies to save the lives of the more affluent. A differential impact across all groups will exist whenever the income elasticity of the VSL is below the absolute value of the income elasticity of the marginal utility of income used in the OMB formula. Given the adverse consequences that would result, OMB was understandably reluctant to extend the application of the weights to include the valuation of mortality risks in the final versions of Circular A-4 and A-94.
Weighted values of a statistical life
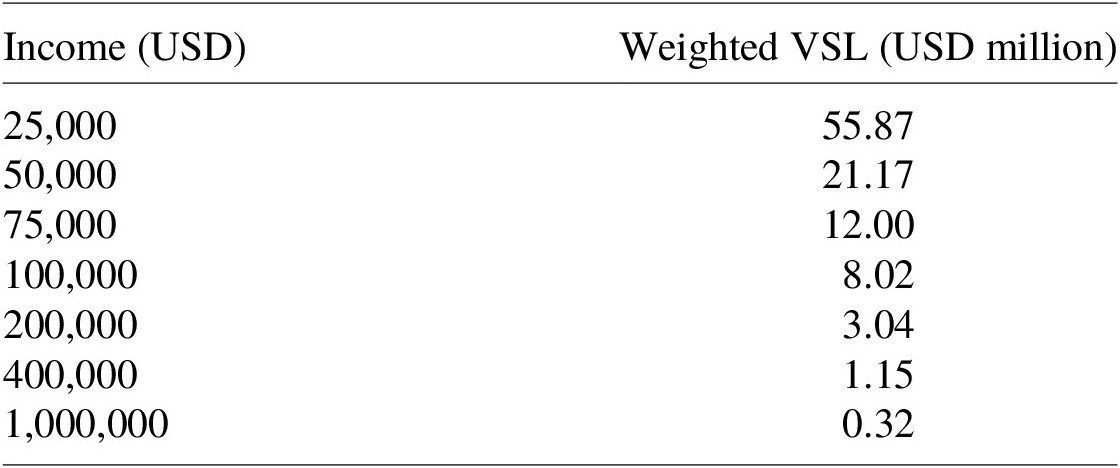
Notes: The weighted VSL is based on the weights from Table 1 and a base VSL of $12 million. For different base VSL levels, the weighted VSL levels are scaled up proportionally.
2.5 Summary assessment of the operational effects of the OMB formula
Reviewing the operational consequences of the OMB weighting formula provides five lessons. First, the formula produces explicit and operational distributional weights. There is no role for subjective judgments to intrude on the weights that are adopted. Second, the weights will have profound effects on benefit-cost analyses, which in turn will have ramifications if they are used for policy design. Application of the abstract weighting formula will have real and very consequential impacts on the structure, targeting, and evaluation of government policies. Third, as a method for promoting income redistribution, the application of the OMB weights is potentially very inefficient, particularly given the huge disparity in the weights across income groups. Going forward, it will be essential to calculate the efficiency losses associated with these transfers, as such adverse impacts have had a prominent role in analyses by Harberger (Reference Harberger1984), Kaplow (Reference Kaplow2020), Hemel (Reference Hemel2023), and Fraas et al. (Reference Fraas, Graham, Krutilla, Lutter, Shogren and Kip Viscusi2024). Fourth, even though lower-income groups benefit from preferential distributional weighting, the policies that affect them may be less protective if lower-income groups are part of a larger protected group that includes affluent households. The OMB weighting system heavily discounts the well-being of the more affluent households, which drags down the value for the entire protected group. As a consequence, the gentrification of poor areas that introduce higher-valued properties into the neighborhood may make policy protections less desirable because the property losses to those with above-average income are down-weighted. Fifth, any future application of the weights to the value of mortality risks will create inequitable risk protections.
A final complication is that the circulars include no discussion of how the weights will interact with other progressive elements of administration policy. President Biden issued the “Executive Order on Advancing Racial Equity and Support for Underserved Communities Through the Federal Government” on the first day of his administration.Footnote 3 The policy implementing this executive order was designated as Justice40, whereby 40% of all benefits of government programs must be targeted to specified disadvantaged groups. As the review of this policy in Kniesner and Viscusi (Reference Kniesner and Viscusi2023) indicates, the specification of the qualifying groups depends on a wide variety of attributes, which differ across agencies. Each agency in turn uses its own weights to determine whether the 40% constraint has been met, and these weights are not the same as those in OMB (2023b, 2023c) Circular A-4 and Circular A-94. Does the agency’s weighting of disadvantaged groups drop out of the analysis once the 40% target has been met? Can these weights be used in conjunction with the OMB income-based weights? If so, what is their role? The guidance documents are silent on such matters involving the coordination of the OMB weights and the Justice40 policy.
3. Is there a rationale for the OMB formula?
While neither Circular A-4 nor Circular A-94 fully articulate the rationale for the weighting formula, it is possible to determine the implicit assumptions that underlie the development of the formula. The basis for the overall approach is consistent with some analyses in the economics literature, but OMB provided no explicit justification for the most critical determinants of the weighting approach. The utility weighting formulation most closely follows the analysis in Acland and Greenberg (Reference Acland and Greenberg2023a). Liscow and Sunstein (Reference Liscow and Sunstein2024) provide an extensive analysis in support of the OMB weights. The discussion below breaks the apparent motivation for the approach into the different components.
3.1 Maximize social welfare
A common formulation for the objective of government policies is that they should maximize social welfare s. Social welfare is a function of the utility levels $ {u}_i $
of all individuals, leading to the form s(u
1, u
2,…, un) for the n members of the population. Beyond that general formulation, there are many different views as to what structure the social welfare function should take. What should society be optimizing? As will be discussed in Section 4, benefit-cost analysis is based on an analysis in which policies maximize social welfare based on private valuations that are conditional on the current distribution of income.
$ {u}_i $
of all individuals, leading to the form s(u
1, u
2,…, un) for the n members of the population. Beyond that general formulation, there are many different views as to what structure the social welfare function should take. What should society be optimizing? As will be discussed in Section 4, benefit-cost analysis is based on an analysis in which policies maximize social welfare based on private valuations that are conditional on the current distribution of income.
It is instructive to distinguish between normative proposals with respect to what society’s social welfare function should be and descriptive characterizations of what social welfare function best reflects society’s preferences. The position that I advocate is that policies should be based on what social welfare function best reflects society’s preferences. Researchers can and should opine as to what society’s social welfare function should be. However, unless those urgings are persuasive, policies need not be governed by the normative prescriptions that are advocated. My equitable risk tradeoff approach is a normative judgment, but it is also consistent with practices that government agencies have adopted. A prominent example of a normative prescription is Rawls’ (Reference Rawls1971) proposal that society’s objective should be to maximize the well-being of the least advantaged. Even if everyone was choosing the social welfare function behind a Rawlsian veil of ignorance in which your position in society was not known, embracing his lexicographic preference approach would only be rational if a person was risk-averse in the extreme. More recently, there has been a flurry of proposed social welfare functions, including many prioritarian approaches that place a greater weight on impacts on those in lower-income groups. Prominent examples of studies that address various approaches for placing a greater weight on benefits to the poor and sometimes advocate diminished weights for impacts on the rich include Adler (Reference Adler2012, Reference Adler2016), Acland and Greenberg (Reference Acland and Greenberg2023a, Reference Acland and Greenberg2023b), Graham (Reference Graham2022), and Liscow and Sunstein (Reference Liscow and Sunstein2024).
While social welfare functions may depend on the welfare levels of the individuals who comprise society, people’s conception of what policies should be optimized may be quite narrow. In the extreme case, they may value their own welfare, but place no weight on the well-being of others. In that case, their view is that the social welfare function is only dependent on their own utility function.
3.2 Utility-based social welfare function
The underlying assumption of the OMB formula is that not only is social welfare some mathematical function of the individual utilities, but social welfare s is the sum of the equally weighted individual utilities, or
 $$ s=\sum \limits_{i=1}^n{u}_i. $$
Let the utility function for income y be u(y). If all individuals i have the same utility functions but may have different income levels, one can calculate social welfare by simply adding the respective utility functions. This approach is implicit in OMB’s formulation and has been articulated by economists such as Acland and Greenberg (2023a)
Even if one assumes that the objective of social welfare is to maximize the sum of individual utility functions across society, undertaking such a calculation is challenging because utility functions are not the same for all people. There is substantial heterogeneity in preferences. For example, the estimates of worker utility functions in Viscusi and Evans (Reference Viscusi and Evans1990) differ depending on the person’s education and years of work experience. It is an oversimplification to assume that utility only depends on income or consumption levels. Moreover, from an empirical standpoint, it is not feasible to estimate a utility function that has cardinal significance and that can be part of a summation exercise to calculate total societal welfare levels. I have estimated numerous utility functions, as have other researchers, and I review many of these in Viscusi (Reference Viscusi2019). The most that can be done is to estimate the person’s utility up to a positive linear transformation of the form, a + bu(y), where a is some constant and b is a positive scale factor. This property holds for von Neumann-Morgenstern utility functions generally (Pratt et al., Reference Pratt, Raiffa and Schlaifer1995). Potential differences in the positive scale factor b are particularly problematic since such differences will affect both the level of utility and the marginal utility of income proportionally. Having a utility function with a high scale factor b should make one more deserving of government policies if marginal utility levels are the basis for the distributional weights as in the OMB weighting system. While the factor b drops out of the analysis of the ratio of marginal utilities at different income levels for a person’s different income levels, when making comparisons across people, differences in the structure of utility functions are consequential.
What other assumptions are embedded in the OMB weighting system? The assumption that marginal utility diminishes with increased income is usually valid, but it is not a requirement for economic rationality. People prefer more money to do less so that u′ > 0. For those who are risk-neutral and are willing to accept actuarially fair bets, u′′ = 0; for those who are risk-loving, u′′ > 0; and for those who are risk-averse, u′′ < 0. There is no requirement that people exhibit risk aversion, but most empirical estimates find that marginal utility levels diminish at higher levels of income so that u′′ is negative. Even for those who are risk-averse, for gambles involving small stakes people will be risk-neutral (Arrow, Reference Arrow1971). The OMB formulation is based on the reasonable assumption that for most people there is diminishing marginal utility of income when the stakes are substantial. In the case of many government policies, however, the stakes are not great, as the unit benefit amount for any individual household is small. At least within the range of impacts for that particular policy, people may be risk-neutral. The rationale for differing marginal utility levels then must be attributable to differences in baseline income levels rather than discrepancies in the size of policy impacts. If utility functions are identical for all and there are income differences, those with higher-income levels will have lower marginal utility levels. If one adopts the stronger assumption that everyone has the same utility function and their formulation of the social welfare function is the sum of the individual utility levels, transferring money from high-income people to low-income people will boost social welfare because it transfers funds to those with a higher marginal utility level. Setting aside incentive issues and costs of implementing income transfers, social welfare is maximized by equalizing the income levels for all.
Following the logic of this social welfare formulation, one can construct distributional weights based on the income group’s marginal utility of income. The social welfare weights for either benefits or costs are given by the ratio of the groups’ marginal utilities of income. These weights reduce the value placed on both benefits and costs in the calculations of the benefit-cost analysis. The desirability of providing benefits to the more affluent is diminished, and concern with imposing costs on the more affluent is diminished as well. The impetus is consequently to tilt the benefits to the less affluent and impose greater costs on the more affluent.
The mathematical form of the utility function selected by OMB is the power function presented in Section 1. This functional form is convenient if there is a constant income elasticity of the marginal utility of income. Empirical analyses have used other functional forms as well. For example, I have frequently estimated logarithmic utility functions, ln(y). For these utility functions, the marginal utility of income is 1/y, making the calculation of the weights straightforward. The ratio of the marginal utility of income at $200,000 to the marginal utility of income at $400,000 is (1/200,000)/(1/400,000) = 2. Doubling income levels leads to a 50% reduction in the marginal utility of income. As indicated in Table A.1, which is the ln(y) counterpart of Table 1, the logarithmic utility function leads to a less pronounced diminishing of marginal utility levels than the OMB weights, but the effect of any weighting approach is substantial.
3.3 Income elasticity figure for determining the distributional weights
The weights applied to each subgroup are derived using the formula presented in Section 1. The mathematical structure is a power function with a constant income elasticity $ \varepsilon $
for the marginal utility of income. There are many functional forms OMB could have adopted for such an analysis. OMB’s choice is convenient and operational. The pivotal assumption is the selection of the income elasticity of the marginal utility of income. OMB (2023b) Circular A-4 “determined that 1.4 is a reasonable estimate of the absolute value of the income elasticity of marginal utility for use in regulatory analysis.” OMB (2023c) Circular A-94 similarly concluded, “A default estimate of 1.4 can be used for the absolute value of the income elasticity of marginal utility.” A 1% increase in income reduces the marginal utility of income by 1.4%. This more than proportional reduction in the marginal utility of income embodies a steep drop in the marginal utility of income as income levels rise, which in turn generates a stark difference in the weights across income groups.
$ \varepsilon $
for the marginal utility of income. There are many functional forms OMB could have adopted for such an analysis. OMB’s choice is convenient and operational. The pivotal assumption is the selection of the income elasticity of the marginal utility of income. OMB (2023b) Circular A-4 “determined that 1.4 is a reasonable estimate of the absolute value of the income elasticity of marginal utility for use in regulatory analysis.” OMB (2023c) Circular A-94 similarly concluded, “A default estimate of 1.4 can be used for the absolute value of the income elasticity of marginal utility.” A 1% increase in income reduces the marginal utility of income by 1.4%. This more than proportional reduction in the marginal utility of income embodies a steep drop in the marginal utility of income as income levels rise, which in turn generates a stark difference in the weights across income groups.
Given its pivotal role in the analysis, one might expect that OMB would provide precise documentation of why it chose this value. As far as I can tell, there is no sound empirical basis for the assumption that there is a −1.4 income elasticity of the marginal utility of income. OMB (2023b, c) Circulars A-4 and A-94 do not document this value, but instead send readers on a quest to locate its justification. The text of OMB Circular A-94 (2023c, p. 16) is not much help, as it refers readers to OMB Circular A-4 for a justification of the income elasticity number. Despite dozens of references included in the 196 footnotes in Circular A-4, OMB (2023b) does not provide a basis for the −1.4 figure. Footnote 127 of OMB (2023b) Circular A-4 directs readers to OMB (2023a) Circular No. A-4: Explanation and Response to Public Input. The text of this OMB (2023a, p. 52) explanation document alludes to six lines of evidence that the agency considered in establishing the income elasticity number, with a wide variety of inputs, including three estimates of the income elasticity of the VSL in stated preference studies. The reliance on stated preference studies is surprising, both because stated preference estimates of the VSL are subject to rampant publication biases (Masterman and Viscusi, Reference Masterman and Viscusi2020), and the dominant VSL estimates used by government agencies are from revealed preference estimates in labor market studies. OMB also relied on a meta-analysis of the income elasticity of the marginal utility of income by Acland and Greenberg (Reference Acland and Greenberg2023b). That article estimated the income elasticity of the marginal utility of income of −1.6, but OMB did not use this result in formulating the elasticity estimate since it included 75 duplicate estimates. Based on OMB’s consideration of the six lines of evidence, it concluded that the income elasticity of the marginal utility of income is −1.4. Had OMB adopted the −1.6 figure, the distributional disparities of the weights would have been even greater.
Ultimately, the choice of the income elasticity of the marginal utility of income appears to be a judgment call by the OMB officials. It is not possible for any researcher to replicate their analysis. What were the specific studies that comprised the six types of evidence that the agency considered? Why did the agency select these studies? How did OMB combine the different types of evidence, and what is the rationale for this emphasis? Why should the −1.4 elasticity of marginal utility of income number be treated as a credible estimate?
Even if one adopts OMB’s overall conception of the social welfare function, the choice of the elasticity of the marginal utility of income matters. Table 4 indicates the magnitude that the weights would have if the income elasticity of the marginal utility of income was −1.0 or −0.6. Each of these alternative values reduces the weights placed on those with income levels below the median and boosts the weights for income levels above the median. The OMB weight of 4.72 at $25,000 income level drops to 3.03 with an income elasticity of −1.0 and to 1.94 with an income elasticity of −0.6. At the income level of $400,000, the OMB weight of 0.10 rises to 0.19 with an income elasticity of −1.0 and to 0.37 with an income elasticity of −0.6. The choice of the elasticity parameter is very consequential. But OMB’s overall conceptualization of what the social welfare function should be will continue to have a profound impact on the weights applied to different income groups even at other values for the income elasticity of the marginal utility of income.
Implied weights with different income elasticities of the marginal utility of income

Notes: Weights are based on the OMB formula with median income = $75,000 and elasticity values specified in the table.
3.4 Income elasticity of the VSL versus income elasticity of the marginal utility of income
How weights affect the unit benefit amount placed on mortality risks depends on whether there is heterogeneity in the VSL level and the extent of the income-related heterogeneity of the VSL. The combined influence of the income elasticity of the VSL and the income elasticity of the marginal utility of income depends on the order in which these adjustments are made, but I will set this complication aside. The discussion in Section 2 regarding the effect of the OMB weights on the value of mortality risks was based on the equitable risk tradeoff approach in which agencies adopt a common VSL independent of one’s income level. Application of the weights to the standard VSL leads to a lower valuation of the mortality risks to the affluent and a greater valuation of the risks to those with below-average income. There would be a less extreme impact if the VSL also exhibited a positive income elasticity. The final versions of OMB (2023b, 2023c) Circular A-4 and Circular A-94 sought to finesse this issue by assuming that the income elasticity of the marginal utility of income had the same absolute value as the VSL. If that is the case, the role of the weights would drop out.
Whether such an assumption is warranted is an empirical question. The most reliable empirical evidence of the income elasticity of the VSL is from the labor market evidence that is the principal basis for the VSL levels used by government agencies (Viscusi, Reference Viscusi2018; Aldy and Viscusi, Reference Viscusi2024). Most of the evidence regarding the income elasticity of the VSL based on revealed preference evidence from hedonic wage studies indicates an income elasticity below 1.0. The meta-analysis by Viscusi and Aldy (Reference Viscusi and Aldy2003) estimated four of the authors’ different model specifications, leading to income elasticity estimates ranging from 0.51 to 0.61. Using six other model specifications that have appeared in the literature on the income elasticity of the VSL yielded an income elasticity range from 0.46 to 0.60. A meta-analysis of income elasticities found in previous meta-analyses (i.e. a meta-analysis of meta-analyses) by Doucouliagos et al. (Reference Doucouliagos, Stanley and Viscusi2014) concluded that the VSL income elasticity range was 0.61 to 0.62. The meta-analysis by Viscusi and Masterman (Reference Viscusi and Masterman2017) estimated an income elasticity value for the U.S. VSL studies of 0.53 after correcting for publication selection effects and 0.72 without correcting for such biases.
Two other labor market studies yielded higher elasticity estimates based on more dated or more limited empirical evidence. Consideration of long-term historical trends from 1940 to 1980 by Costa and Kahn (Reference Costa and Kahn2004) yielded income elasticity values from 1.5 to 1.7. Kniesner et al. (Reference Kniesner, Viscusi and Ziliak2010) estimated the VSL income elasticity estimate based on differences in the VSL based on wage levels of workers in one sample involving a single year of data. While the estimated elasticities had a mean value of 1.4, the authors recommended the use of a 1.0 income elasticity of the VSL for policy analyses: “Because the VSL varies elastically with income, regulatory agencies should regularly update the VSL used in benefit assessments, increasing the VSL proportionally with changes in income over time.” The preponderance of the empirical evidence indicates that the income elasticity of the VSL is below 1.4 and does not fully offset the impact of the weights.
Government agencies frequently adopt a VSL income elasticity figure of 1.0, which makes income elasticity adjustments straightforward and intuitive. I have also used the 1.0 elasticity for expositional purposes. Agencies’ use of this income elasticity figure is not with respect to valuing risks to different population groups. There are no income-based adjustments across populations at a point in time, but rather agencies make adjustments to update the VSL in future years based on societal income growth.
If, however, one coupled such an income elasticity with the OMB weights, there would not be preferential treatment of higher-income populations. The OMB weights are based on the assumption that the marginal utility of income drops by 1.4% for every 1% increase in income. A VSL based on an assumed income elasticity of 1.0 would be unable to keep pace with the diminished unit benefit amount that would be assigned to mortality risks facing those in upper-income groups. The same kinds of differentials are evident in the discussion of the weighted VSL levels in Table 3 would remain, but the extent of the valuation disparity would be narrowed.
Matters would be different if the income elasticity of the VSL was considerably greater and if agencies made such income-based distinctions in formulating policies. Suppose that agencies assumed that the income elasticity of the VSL exceeded 1.4. If the income elasticity was at such a high level, the applicable VSL would be an increasing function of income even after applying the weights. What matters is whether the income-related boosting of the applicable VSL is occurring at a higher rate than the income-related extent of the diminishing of the applicable VSL based on the weights. If the applicable VSL levels escalated sufficiently, there could still be greater valuation of risks to more affluent populations after the application of the OMB weights, but the extent of such a premium would be substantially diminished because of the weights.
The extent of the income-related VSL augmentation that is required to equalize or more than offset the weights is considerable. Assume that the baseline VSL for the median-income household is $12 million. The requirements for the weighted VSL levels for more affluent households to be at least $12 million are quite stringent. Before the weighting is applied, agencies would need to assign populations with an income of $100,000 a VSL of at least $18 million. Populations with an income of $200,000 would require a VSL of $47 million. The required VSL to maintain parity with the median household VSL would rise to $125 million for households at the $400,000 level and $444 million for households with a $1 million annual income. Incorporating income-based heterogeneity that is this pronounced would enable households with above-median income levels to at least break even in terms of obtaining risk protections comparable to those at the median reference VSL level. The resulting unit benefit levels after applying the distributional weights would reflect some positive income-related premium for VSL levels above this amount, but would not lead to substantial differential protections of this group. Even the use of a VSL of a $1 billion VSL for households with an income level of $1 million would only give them a weighted VSL of $27 million, which is 2.25 times as great as the VSL for the median household.
The magnitude of these figures is reflective of the implausibly high level of income elasticity of the VSL that is needed to offset the role of the OMB distributional weights. Although OMB (2023b, 2023c) asserted in its revised final version of Circular A-4 that there is a direct offset of the weights by the positive income elasticity of the VSL, this is not the case based on most empirical estimates of the VSL. Examination of the VSL levels that are needed to offset the role of the weights is instructive in that they indicate the strong assumptions embodied in the OMB formula. It is unlikely that any empirically based income-related heterogeneity in the VSL would give above-average income households parity with the median-income VSL. The projected devaluation of the lives of those with above-average income would prevail, but to a reduced extent if agencies initiated income-related assessments of the VSL.
Complicating any assertion of the equivalence of the income elasticity of the VSL and the income elasticity of the marginal utility of income in the OMB formula is that these elasticities are measuring different, but related things. The income elasticity of the VSL is the income elasticity with respect to the individual worker’s earnings, while the elasticity in the OMB formula is based on household or family income.
3.5 Potential legal challenges to regulations based on distributional weights
Given the concerns raised above regarding the distributional weights, it is likely that there will be legal challenges to agencies that promulgate policies based on these weights. In the Catholic Church, there is deference to statements by the Pope on faith and morals that are made ex cathedra. However, there is no comparable requirement for U.S. courts to defer to policies based on the OMB distributional weights even though OMB issued these distributional weights in official guidance policy circulars. One might have confidence that the prescriptions in Circulars A-4 and A-94 have a sound legal basis since the Administrator of the OMB Office of Information and Regulatory Affairs, Richard Revesz, is an eminent legal scholar. However, recent court decisions have limited the discretion of regulatory agencies, making all innovative regulatory efforts possible targets for review. There are three possible areas of potential concern.
The most well-established of the three potential bases for challenging policy areas is the Administrative Procedure Act. Federal courts can set aside an agency action that is “arbitrary, capricious, an abuse of discretion, or otherwise not in accordance with the law.” These requirements are also applicable with respect to regulatory impact analyses, including court cases involving legal challenges to at least 38 benefitcost analyses (Cecot and Viscusi, Reference Cecot and Viscusi2015). It is essential for agencies to rely on relevant and reliable data and to demonstrate a link between this evidence to policy actions. Some might question whether the social welfare function implemented by OMB fulfills these requirements, for the types of reasons discussed in Section 3.1, 3.2, and 3.3. The inability of other analysts to be able to replicate the procedures that led to the specific weights that were implemented is an important concern.
That the weights are included in official OMB Circulars A-4 and A-94 is not sufficient to ensure that they will survive judicial review. The D.C. Circuit overturned a Department of Energy regulation that was based on the discount rate that the OMB specified in the 1971 edition of Circular A-94 since “OMB does not explain the reasoning behind the discount rate it recommends.”Footnote 4 The primary substantive concern with the current Circulars A-4 and A-94 is not with respect to the discount rate but with the distributional weights and the social welfare function that OMB has specified as being reflective of society’s preferences. Whether the justification of the implicit OMB social welfare function and the accompanying distributional weights is persuasive is the most traditional area of concern.
Recent court decisions have reflected a desire on the part of the judiciary to restrict the authority of regulatory agencies, and this shift in the legal environmental may be consequential. Most important is that the leeway that agencies had to promulgate innovative policies, such as those based on distributional weights, may be severely limited by the Supreme Court’s overruling of the deference by the courts to agency policies when statutes are ambiguous (i.e. Chevron deference)Footnote 5 in a 2024 decision (Loper Bright Enterprises v. Raimondo, 544 F. Supp.3d 82). The application of the OMB distributional weights will make policies more akin to social welfare programs than is specified in any of the statutes governing regulatory policies. This broadening of the scope of the rationale for regulatory interventions may not be viewed as a straightforward attempt to fulfill the agency’s statutory obligations.
A related question regarding the scope of an agency’s regulatory authority is whether the design of policies based on these distributional weights invokes the Major Questions Doctrine, which requires “Congress to speak clearly if it wishes to assign to agency decisions of vast ‘economic and political significance.’”Footnote 6 While the distributional weights may not be as consequential as Major Questions Doctrine issues, such as whether EPA can regulate greenhouse gas emissions under the Clean Power Plan, the Supreme Court has invoked this doctrine in a much less consequential context. During the COVID-19 epidemic, the Supreme Court rejected the Occupational Safety and Health Administration’s (OSHA’s) Vaccinate or Test Emergency Temporary Standard. This decision was surprising because there was a very reasonable risk-based rationale for the standard, and issuing emergency temporary standards to address emerging public health emergencies is clearly within the agency’s statutory authority (Gentry and Viscusi, Reference Gentry and Viscusi2024). Basing regulatory policy decisions on distributional weights might appear to be a greater departure from the agency’s statutory authority than OSHA’s emergency temporary standard. If the judiciary takes an expansive view of what constitutes a major question, the promulgation of policies based on distributional weights may be jeopardized.
4. What is the policy failure and how to address it
A critical component of any regulatory impact analysis is to evaluate the market failure that provides the rationale for the regulation. In the same vein, one might inquire what is the policy analysis failure that requires the introduction of distributional weights into benefit-cost analyses. Are current procedures tilted to disproportionately benefit the rich? Or, even if there is not a distributional bias in favor of the more affluent, does society want to provide greater emphasis on providing benefits to disadvantaged groups as a form of income redistribution or to reflect concerns with commodity-specific externalities, such as altruistic concerns regarding adequate health care? My overall assessment is that current benefit-cost analysis practices already provide some substantial preferential treatment of the poor.
Consider the valuation of mortality risk benefits, which comprise the majority of the benefits of all government regulations. Current practices are consistent with the approach that I have long advocated and which I have termed “equitable risk tradeoffs.” In particular, government agencies apply the same VSL to value the mortality risks faced by all income groups. There is, of course, no requirement that they do so. If agencies took into account the income-based heterogeneity of the VSL, there would be discrepancies in the VSL across the population. Fortunately, agencies have not chosen to make such distinctions in the four decades that they have used the VSL to monetize mortality risks, with the result being the value assigned to reducing mortality risks does not depend on income. Benefit assessment practices for mortality risks before the adoption of the VSL followed the practices in wrongful death damages assessments and were based on the present value of lost income, which made unit benefit amounts proportional to income levels.
The role of the distributional subsidy by applying a uniform VSL is potentially substantial. As documented in Kniesner and Viscusi (Reference Kniesner and Viscusi2023), many population groups receive a VSL premium relative to what they would receive had the VSL been based on their income levels. The dimensions on which people are accorded a VSL premium include income, race (i.e. Blacks), ethnicity (i.e. Hispanics/Latinos), and gender (i.e. females).
To see the combined influence of the income elasticity of the VSL and the weights in operation, consider a worker at the 25th percentile of the earnings distribution, which I will assume places the household income at the $50,000 level for my OMB weights in Table 1. Application of the income elasticity of the VSL to determine that worker’s personal VSL would reduce that worker’s VSL by 36% if the income elasticity of the VSL is 1.0 and by 25% if the income elasticity of the VSL is 0.6. If the average societal VSL is $12 million, the resulting baseline VSL amount for those at the $50,000 income level would be $7.7 million (income elasticity 1.0) and $9.0 million (income elasticity 0.6). After the application of the OMB weights, these two values would be $13.6 million and $15.9 million, respectively, each of which would exceed the average societal value of $12 million. Based on the high-end VSL income elasticity value of 1.0, coupled with the OMB weights, members of lower-income groups would receive greater protection than those at the median-income level. Following the same calculations as was done in earlier examples, those with income levels above the median would have their lives devalued by the weights.
Under current practices, there is no inequity in the valuation of mortality risks resulting from the application of a uniform VSL. That equity property also holds for the other less consequential benefit components for which average willingness-to-pay amounts or average market prices are used to value the benefits.
Rather than being the source of inequity, benefit-cost analyses can promote equity by providing comprehensive assessment of policy impacts. A prominent example is that of the cleanup of Superfund hazardous waste sites documented in Hamilton and Viscusi (Reference Hamilton and Viscusi1999) and Viscusi and Hamilton (Reference Viscusi and Hamilton1999). Although EPA policies were subject to President Clinton’s environmental justice Executive Order No. 12898, EPA policies did not adequately protect disadvantaged groups. Based on our benefit-cost analysis of 150 Superfund sites, we found that targeting cleanup decisions using a benefit-cost test would not only be less expensive than existing agency practices but also would be more protective and more equitable. Minorities especially would benefit. Benefit-cost analysis promotes equity.
There are several reasons for this constructive role. Benefit-cost analyses take into account the risks to all exposed populations rather than the EPA practice of implementing cleanups based on potential hypothetical risks as well as actual current risks. Risks to all people are included in the benefit-cost assessment, as are differences in the risk exposure levels. EPA officials viewed our calculation as being inconsistent with EPA’s aversion to what they regarded as the population risk approach rather than the individual risk approach in which the highest individual risk is instrumental rather than the total expected health risks. Because of the high risks posed to densely populated minority areas near Superfund sites, taking into account the overall health risks to the total population promotes equity. In the absence of benefit-cost analysis, the EPA cleanup decisions were governed by political factors and media attention rather than the expected risk reduction benefits and the cost-effectiveness of policy options. In effect, benefit-cost analyses can highlight flawed agency policies and promote a greater degree of inclusiveness in policy assessments.
An ongoing shortcoming of agency policies is that there is the potential for failing to adequately consider impacts on particular population groups that may be particularly disadvantaged by a policy or may have been overlooked in the policy design. Reviews of agency practices in assessing distributional impacts by Robinson et al. (Reference Robinson, Hammitt and Zeckhauser2016), Cecot (Reference Cecot2023a, Reference Cecot2023b), and Cecot and Hahn (Reference Cecot and Hahn2024) demonstrate that there is widespread inattention to providing distributional information on policy impacts. Undertaking such calculations may not always be feasible based on available information, but prospective analyses can address such concerns. In our analysis of Superfund sites, both EPA officials and trade associations claimed that such assessments were impossible. The main available building blocks were limited to the latitudes and longitudes of hazardous waste sites and the chemical concentrations at these sites. By coupling this information with dose-response estimates from EPA and the literature and population characteristics at the block group level, our geographic information systems analysis made it feasible to prepare a benefit-cost assessment and to identify impacts on minority groups. Similarly, there may not be off-the-shelf information that analysts can use in assessing the distributional impacts of other policies, but this does not imply that assessing distributional impacts is impossible. Undertaking such assessments with an expanded analysis is usually feasible.
The recognition by OMB (2023b) Circular A-4 of the importance of showing the distributional impacts of regulatory policies is a major, constructive contribution. From the standpoint of promoting such reporting, OMB did not go far enough. In my peer review comments (Viscusi, Reference Viscusi2024) on Circular A-4, I applauded OMB’s efforts to require such information and urged OMB to specify a standardized reporting system indicating the income groups for which agencies must report the impacts. Agencies would also be able to supplement such reports with additional information such as distributional impacts on other population groups of interest. Such standardization would facilitate efforts by OMB and economic analysts to make comparisons across agencies without potential manipulation of the categories by agencies seeking to promote a favorable, but biased assessment of the policy.
The role of the distributional information would be to inform government policymakers of the policy impacts. Should there be a desire to show a preference for a particular group, that would be a political decision rather than manipulating the benefit-cost analysis to incorporate such weights. This view is consistent with that expressed in Dudley and Viscusi (Reference Dudley and Viscusi2023) in which we indicated that agencies should have the leeway to target policies, but that it was not appropriate to incorporate such weights in benefit-cost analyses. This concern is especially great when there is no societal consensus that a particular set of weights is appropriate.
Having comparable information about the distributional impacts of policy options would have an additional dividend as well. Based on this information, it would be feasible to estimate the implicit distributional weights reflected in government decisions. These weights would have greater legitimacy with respect to their representation of societal preferences.Footnote 7 Analyzing the implicit weights reflected in government decisions may be instructive in designing a future system of distributional weights.
There also should be a broader consideration of other available policy instruments if one concludes that there is a policy failure, whereby benefit-cost analyses fall short in terms of promoting social welfare. The policy mechanism generally preferred by economists is to manipulate tax and income transfer policies because these are less distortionary. There also are policy remedies to address commodity-specific externalities that reflect broader societal concerns with the provision of health care, nutrition, education, housing, and safety. The net social costs are likely to be far higher if regulatory policies are designed based on the application of the OMB weights. As the weights summarized in Table 1 indicate, the departures from economic efficiency guidance are considerable at both tails of the income distribution. The weights produce a substantial boost in the valuation of the economic merits of impacts on those with below-average family income and a substantial discount on the impacts on households with above-average family income. Moreover, one can have greater confidence that tax and safety net policies are reflective of broader societal preferences since they are the result of laws. The provisions of these laws are drafted by Congress, undergo Congressional review, and are approved by Congress and the President. In contrast, the OMB weights are based on a mathematical formula for which the implications were not transparent and not subject to comparable review and approval.
5. The proper role of equity in a benefit-cost world
In the Carter Administration, I was the Deputy Director of the Council on Wage and Price Stability, which was responsible for White House oversight of all new federal regulations. On many issues, we worked closely with the Council of Economic Advisers, which was chaired by Charles Schulze. When distributional issues arose, he offered the following advice. The expertise of economists enables us to calculate the costs and benefits of policies and to assess the impacts on different groups. We have skills in estimating efficiency effects. However, economists have no special expertise in making judgments on matters such as whether the welfare of steelworkers in Pennsylvania or dairy farmers in Wisconsin should be accorded preference in policy design. Ultimately, these are political decisions.
Based on similar reasoning, OMB staff members have no special expertise in assigning different weights to impacts of population groups at different income levels. The distributional weights that were promulgated in Circular A-4 and Circular A-94 impose a myriad of assumptions about societal preferences. As my previous discussion indicates, the OMB weights are unfounded and lack empirical support. They will also generate clearly undesirable and unreasonable policy outcomes. The lack of a compelling justification and the potential mismatch of the weights with agencies’ statutory authority likely will lead to analyses based on the weights to be overturned by the courts. Should future administrations wish to pursue distributional weights of any kind, the rationale for the weights and the value of the weights should be transparent. There should also be a replicable empirical basis for judgments that are made, as well as a thorough examination of the rationale for applying the weights to monetary and nonmonetary impacts, including the VSL.
Opining about how society can best address distributional concerns is a worthwhile endeavor. There has been substantial economics literature on the distributional consequences of policies for over a half-century, and there continues to be flourishing literature on this topic. Researchers should continue to write books and articles to advocate their own perspectives on how society can best accomplish what they believe is in the public interest. However, OMB (2023b, 2023c) Circular A-4 and Circular A-94 do not represent the relatively harmless normative musings by academics. Rather, these are official government guidance documents that direct agencies on how to analyze proposed regulations and other government policies. The standard that official requirements for policy analyses should meet is more demanding than what is potentially publishable in the academic literature. There is no sound basis for concluding that OMB’s social welfare function as reflected in these weights corresponds to society’s welfare function. Future administrations should eliminate these weights.


 Open access