1. Fragile Foundations
The UK’s economic model is broken, stuck as it is in a low-productivity, low-wage and low-growth cycle whence it will not escape by way of disrupting the old orthodoxies alone. Higher levels of public spending and taxation are necessary but not sufficient conditions to address the profound problems that beset Britain, notably the deep disparities of wealth, power and social status across the country (Pabst, Reference Pabst2021a). Among the 38 industrial economies of the Organisation for Economic Cooperation and Development (OECD), the UK has some of the worst spatial inequalities both between and within the regions of the four home nations, especially England (Carrascal-Incera et al., Reference Carrascal-Incera, McCann, Ortega-Argilés and Rodrígez-Pose2020; Haldane, Reference Haldane2019).
Imbalances are not only confined to regional differentials such as productivity, growth, wages, employment and inactivity levels, but also extend to household-level inequalities in terms of income, assets and consumption (Bhattacharjee et al., Reference Bhattacharjee, Lisauskaite, Pabst and Szendrei2021a; Reference Bhattacharjee, Pabst and Szendrei2021b). Both regional and household-level disparities are similarly reflected in a whole host of other inequalities relating to health, life expectancy, quality of work, town centre viability and civic and philanthropic engagement (e.g. Case and Deaton, Reference Case and Deaton2020; Tanner et al., Reference Tanner, Blagden and Krasniqi2020). The UK’s lopsided development across its regions and communities is as much a social reality as it is an economic one, and more state spending alone will not rebalance the economy or society.
Fiscal policy over the medium-term continues to be too tight and not sufficiently focussed on investment. While the response to the Covid-19 pandemic involved a significant increase in public expenditure to avert a descent into depression, my colleagues and I at the National Institute of Economic and Social Research (NIESR) have shown that the Autumn 2021 Budget and the Spending Review fall short of the level of investment in national assets required to regenerate the regions (Chadha, Reference Chadha2021a; NIESR, 2021). The bulk of higher spending will be allocated to health and social care. Transport and R&D will also see sizeable increases. But in many other areas, public expenditure will rise modestly and total spending will be substantially less by the end of this Parliament in 2024/2025 than at the start of 10 years of fiscal consolidation in 2010. The decade of cuts may be over, but the damage is far from being undone.
As figures 1 and 2 show, the sharp slowdown in growth in 2023–2026 and the real wage squeeze will exacerbate existing economic and social imbalances.
GDP fan chart
Source: Bank of England, NIESR UK Economic Outlook Autumn 2021, OBR.

Average earnings adjusted for inflation
Source: NiGEM database, NIESR UK Economic Outlook Autumn 2021.

Faced with the growing headwinds from stuttering growth and rising prices, there is a strong case for greater fiscal expansion in a manner that targets investment in national assets. For example, spending on education will increase by only about 2 per cent per year compared with more than 4 per cent per year for health, with pupil spending in schools barely returning to 2010 levels by 2024—nearly 15 years of stagnant expenditure on school education despite economic growth. Moreover, spending per student in Further Education and vocational training will continue to fall short of 2010 levels. The £3 billion announced in the Budget and the Spending Review do not constitute so much a ‘skills revolution’ as a drop in the ocean—and certainly no gushing spring that will flow down every provincial gulley.
Local government, while seeing a real increase in spending, will also have to contend with further limits on increasing revenue from council tax, a freeze on grants, no changes to obsolete funding formulae and exponentially increasing demands on social care provision. Tight spending on education and on local government is at odds with attempts to raise regional productivity, boost growth and living standards and help re-balance Britain’s ‘geography of discontent’ (McCann, Reference McCann2016).
The total tax burden will rise to over 36 per cent of national income, but it conceals from view the distributional dimension (taxing work instead of assets) and the composition of spending (the shape of the state rather than simply its size)—welfare, pensions and health care now represent 20 per cent of GDP compared with 10 per cent in the past. An ageing population, combined with low growth and stagnating real wages, seems to be progressively eroding the low-tax, free-market state ushered in by the Thatcher government and consolidated by New Labour.
But talk about a radical shift to a high-tax, big-state economy misses the point that UK taxation and spending levels are low by international comparison. It also rests on a simplistic binary opposition between state and market when in reality both Britain’s central state and free market have failed to produce a booming economy based on high productivity, high skills and high wages. Both state and market mechanisms suffer from excessive short-termism, fragmentation and over-centralisation in London and the metropolitan South East (Pabst and Westwood, Reference Pabst and Westwood2021; McCann, Reference McCann2022). Public policy has made matter worse. NIESR has consistently argued that the fiscal-monetary mix has been wrong for the past decade, with fiscal policy too tight and monetary policy too loose (Chadha, Reference Chadha2021b; Chadha et al., Reference Chadha, Küçük and Pabst2021; NIESR, 2021). A lack of investment in productive activities and in higher-quality public services, combined with asset price inflation and unsustainable household debt levels, has meant that the British economy is over-dependent on finance, consumption spending and house prices.
The fragile foundations of the UK model are clear to see. The 2008–2009 financial crisis exposed the country’s over-reliance on the City of London as an engine of national growth, but our financial system remains as concentrated in the metropolitan South East as before and still fails properly to support productive activities elsewhere (Collier and Mayer, Reference Collier and Mayer2020). Brexit revealed the deep disparities between more metropolitan areas of prosperity and suburban, rural and coastal areas of deprivation, but we have not begun to rebalance wealth or power to the places ‘that don’t matter’ (Rodríguez-Pose, Reference Rodríguez-Pose2017). And Covid-19 exposed the dysfunctional government and governance system that is at once over-centralised and weak in terms of institutional effectiveness and policy implementation (Pabst and Westwood, Reference Pabst and Westwood2021).
2. Patterns of regional imbalance
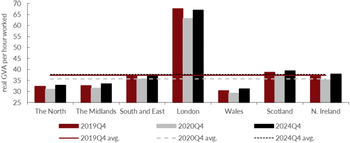
Britain’s unbalanced economy is not a simple story of north versus south or city versus province. Rather, the UK exhibits one of the highest inter-regional and intra-regional productivity differentials and income and asset inequalities of any advanced economy, coupled with many pockets of social deprivation. As McCann (Reference McCann2016; Reference McCann2020) has shown, the UK’s pattern of productivity differentials is fundamentally spatial. High-productivity cities tend to be clustered in certain regions in the South of England, especially London and parts of the South East, whereas low-productivity cities tend to be clustered in certain regions of the Midlands and the North, notably the North West. Research by NIESR highlights the sharp productivity imbalances across the UK’s devolved nations and regions (figure 3).
Regional labour productivity, in Gross Value Added per hour (£)
Source: NiReMS and NiGEM.

This spatial segregation between high- and low-productivity areas is a key defining feature of the UK economy that differentiates it from virtually all other advanced economies of the OECD where high- and low-productivity areas are much more evenly distributed (Carrascal-Incera et al., Reference Carrascal-Incera, McCann, Ortega-Argilés and Rodrígez-Pose2020). Connected with interregional segregation is intraregional clustering, that is, a concentration of high- and low-productivity places, including large metropolitan areas together with towns and rural areas that are booming or struggling as a result of agglomeration and spill-over effects—high-productivity areas lift their surrounding hinterland, whereas low-productivity places drag down their immediate neighbouring areas.
As McCann and Rodríguez-Pose argue, the UK’s regional disparities are first and foremost a core-periphery region versus region problem rather than a binary opposition of urban versus rural or city versus town. In short, Britain’s socio-economic landscape is a ‘geography of discontent’ (McCann, Reference McCann2016) composed of certain prosperous areas and other so-called ‘places that don’t matter’ (Rodríguez-Pose, Reference Rodríguez-Pose2017), which have been ignored and neglected for several decades.
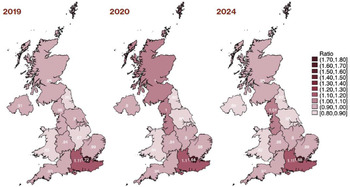
These disparities are widening (figure 4) and being compounded by differences in proximity to political and financial decisions, with government and finance over-centralised in London and the South East. For example, more than half of all Foreign Direct Investment (FDI) and two-thirds of venture capital investment for businesses big and small are in the South East, especially London (Collier and Tuckett, Reference Collier and Tuckett2020). It is the combination of centralised governance coupled with widening economic and social divergence that makes regional regeneration the principal priority besides a just transition to an ecologically sustainable economy. But so far centralised policy-making and finance have undermined efforts to foster structural changes to the UK’s city and regional economies, especially in England (figures 5 and 6).
Ratio of regional productivity to the UK average
Source: NiReMS and NiGEM.

Change in new company registrations by country
Note: Cumulative company registrations by country, 23 March 2020 to 15 March 2021 (percentage difference from cumulative change in 16 March 2019 to 15 March 2020). Source: www.ukfirmcreation.com.

Estimated connections between the devolved nations and regions
Abbreviations: NE, North East; NW, North West; YH, Yorkshire and the Humber; EM, East Midlands; WM, West Midlands; EA, East of England; LON, London; SE, South East; SW, South West; WA, Wales; SC, Scotland and NI, Northern Ireland. Source: NIESR.

Neither ‘trickle-down’ economics through the free market nor redistribution by the central state alone are effective engines able to reverse decades of centralising power or concentrating wealth. The three devolved nations, eight city regions and five mayoralties provide some counter-balance to the Westminster model (Richards and Smith, Reference Richards and Smith2016a; Reference Richards and Smith2016b), but the latter gives government—notably the Treasury—license to impose regional development top down, as with Northern Powerhouses and the city-region deals. Government defines the remit and terms of any local or regeneration while Treasury continues to control the purse strings (Coyle and Sensier, Reference Coyle and Sensier2019). At the heart of this control-and-cash nexus lies not only a specific institutional arrangement, but also a certain conception of politics—the centrism of a unitary state, which is associated with the British Political Tradition (BPT) and favours secrecy, lack of transparency and accountability, hierarchy, centralism, linearity, elitism, inflexibility and functionalism (Richards and Smith, Reference Richards and Smith2015).
Linked to this are several UK governance pathologies, including hyper-centralised decision-making, short-termist policy churn, siloised policy-making and the lack of effective joined-up government. With deep roots in 19th-century imperial expansion, the Westminster Model is singularly ill-suited to address the 21st-century task of sustained and balanced economic growth, combined with higher productivity and shared prosperity based on a transformation of the state in line with more pluralism, greater devolution and the capacity of local and regional government to adapt policies on skills, training, transport and housing to the conditions of places and the needs of the people who inhabit them.
In short, the current system is at once over-centralised and fragmented, with responsibilities for health, education, skills, and transport delegated to lower levels while authority over money and power lies in Westminster and Whitehall. Governments of different stripes have been short-termist and engaged in endless policy churn, with over 28 different policies on Higher Education and Further Education over the past 20 years and a succession of different institutional arrangements including Regional Development Agencies, Local Enterprise Partnerships or the creation and then abolition of the Industrial Strategy Council. Extra funding alone to sub-national authorities will not reduce regional disparities. Local delivery needs to be strengthened along with institutions that can sustain higher public spending and greater private investment over the long-term.
3. Principles, practices and policies for regional regeneration
Regional regeneration is the work of decades and therefore requires a set of robust principles, practices and policies. The principles on which reducing regional disparities should rest include a long-term outlook, which is at scale and recognises the complex interdependencies between different levels—national, regional and local, but also within each home nation, each region and each locality. In turn, this means that a serious approach to regional regeneration has to be joined up, to coordinate institutions and policies, and to design and deliver policy implementation at the appropriate level in accordance with the principle of subsidiarity.
In practical terms, a comprehensive programme has to involve a new institutional ecology that brings together finance, skills, innovation, infrastructure (physical, digital and social) as well as government and governance (Haldane, Reference Haldane2021). This extends to institutions required to support research and innovation across the whole economy, not simply high-performing firms—an institutional ecosystem in which all parts of the country can develop and flourish, including small towns as well as rural and coastal areas. Shared prosperity will not happen based on an economy deeply divided between high-productivity traded sectors and low-productivity non-traded sectors in which increasing inequalities of wages and job security persist.
Key to regional regeneration will be to raise productivity in what is called the ‘foundational’ or ‘everyday economy’ made up of services, production and social goods that sustain our daily lives (Froud et al., Reference Froud, Johal, Moran, Salento and Williams2018): retail, the food industry, hospitality, as well as manual jobs such as in construction, security or care. The Covid-19 pandemic has shone a light on just how important key workers employed in those sectors are for our wealth, health and wider well-being and how a lack of good training and poor working conditions have kept productivity and wage growth low (Haldane, Reference Haldane2019).
Connected with this is the need to spread firm births and the fruits of innovation to many more parts of the country than London, the South East and other metropolitan parts of the country. That, in turn, requires three fundamental institutional and policy actions to address the three gaps the UK faces: a gap in regional and local capital markets, a gap in regional and local labour skills, and a gap in regional and local government.
First, the UK needs to de-centralise capital markets. That should involve creating regional and sectoral banks constrained to lend within areas and sectors and expanding the remit of the National Infrastructure Bank (NIB) to a National Investment or National Development Bank. Germany’s system of Landesbanken, or regional banks, is an interesting example, and two more institutions of the German model can help close Britain’s capital market gap, which has widened since funding from the European Investment Bank ceased: Sparkassen (credit unions) and the Kreditanstalt für Wiederaufbau (KfW)—a national investment bank.
A more decentralised and sectorally differentiated financial system can increase resilience and reduce dependence on the City of London or central government subsidy by channelling funds to firms that are currently starved of credit on favourable terms. A new network of community banks with ownership ties to local government and in pursuit of both profit and social and ecological purpose can reduce borrowing costs by drawing local knowledge, crowding in alternative sources of funding and reinvesting profits in communities.
While the National Infrastructure Bank located in Leeds is a welcome addition to the financial landscape, its modest funding and restricted remit will limit the NIB’s capacity to boost investment and growth beyond a few signature projects. A national development bank would be better equipped to join up Britain’s unbalanced financial system, leverage investment in science, technology and know-how based on pooling risks and sharing rewards—combined with technology trusts to share knowledge as a common, public good.
Second, the gap in regional and local skills can only be filled by building partnerships between Higher Education and Further Educations institutions in order to foster hybrid skills (part academic, part vocational or technical) on which important subjects such as engineering, medicine, law, finance and banking depend—the ‘missing middle’ in the Augar Review. Creating 20 new technical institutes as announced in the Autumn 2021 Budget marks an important step in the right direction, but needs to be connected with a reform of HE and FE to get the right balance and quality of academic, hybrid and vocation or technical training.
Mixed FE and HE colleges in struggling towns such as Blackpool, Southend and Grimsby need a lot more funding than what is earmarked in the £3 billion spending envelope. Moreover, the UK needs institutionalised corporatist arrangements bringing together business, trade unions and local government to provide significantly more apprenticeships and more vocational entry opportunities to the labour market, especially in area of skills shortages such as health and social care but equally technical skills. And adults need a portable lifelong learning entitlement as part of a system that goes well beyond the sticking plaster of ‘skills bootcamps’.
Third, regeneration requires greater regional and local government capacity, which has to involve the provision of revenue streams that are not directly controlled by the Treasury. Local and regional authorities also have to be given the tools to adapt to the requirements of their areas for longer-term investment by linking issues of infrastructure to education, housing and training without central government interference (Pabst, Reference Bhattacharjee, Pabst and Szendrei2021b). For the needs and the potential of people in the places they live to be at the centre of regeneration has to include much more local and regional government accountability to their citizens and communities and not simply to central government.
4. Concluding reflections
Britain’s broken economic model shows no signs of turning into a high-wage, high-productivity, high-growth economy anytime soon. England’s regions and the three devolved nations are not catching up with London and the metropolitan South East but in many areas of economic activity falling further behind. After austerity, Brexit and Covid-19, regional disparities are widening while the poorest households risk sliding into destitution. However, both our national history and international comparison today provide examples of how regional regeneration can be done, by building institutions and devolving power and resource to lower levels than central government or the global free market. The task for policymakers is to raise regional productivity outside of metropolitan areas, connect London’s capital markets with regional and local capital markets, and devolve both power and resources to lower tiers, coupled with greater accountability. Better economic performance and greater social well-being requires a long-term strategy at appropriate level and scale, combined with much better local and regional capacity to design and deliver transformative policy.
Acknowledgements
This work was supported by UK ESRC grant no. ES/V002740/1.