


1 Introduction
Processing information is crucial for effective policymaking. If policies are to address societal issues, signals about the severity and nature of those issues, as well as the effects of existing policies on them, should somehow feed back into the policy process (Jones and Baumgartner Reference Jones and Baumgartner2005). The literature is divided, however, on how information processing takes place in policy processes. Punctuated equilibrium theory (PET) has argued that information processing tends to be disproportionate (see e.g. Jones and Baumgartner Reference Jones and Baumgartner2005; Jones et al. Reference Jones, Sulkin and Larsen2003). That is, policymakers tend to pay attention only to a limited set of incoming signals, ignoring others. Only when signals that were previously not taken into account become too strong to ignore, will policymakers turn to those signals. This typically leads to a stop-and-go pattern, in which long periods of relative policy stability are punctuated by brief periods of rapid change.
By contrast, theories of thermostatic policymaking, following in the footsteps of incrementalist theory, claim that policymakers respond to incoming signals in a much more piecemeal fashion (see e.g. Cashore and Howlett Reference Cashore and Howlett2007; Howlett Reference Howlett2009; Lindblom Reference Lindblom1979). Like a thermostat, they compare incoming signals to established policy objectives and take corrective action when the signals show a gap with those objectives. This leads to a more gradual pattern of policy change.
This paper aims to contribute to this debate by studying the way in which signals are processed in the European Union’s (EU) Common Fisheries Policy (CFP). Part of the CFP is a conservation policy, which is aimed at maintaining sustainable levels of commercial fish stocks. It does so primarily through the annual setting of Total Allowable Catches (TACs) for a range of fish species in different EU waters. In the paper, we analyse how incoming signals about the size of fish stocks are translated into TACs. Based on the development of TACs in the period 1987–2013, we will look at the extent to which the TACs that were adopted in the EU followed the scientific recommendations issued before adoption.
Our paper makes three contributions to the literature. First, methodologically, we introduce a new measure to study the (dis)proportionality of information processing. Rather than relying on an analysis of change distributions across large numbers of issue areas, this measure allows for an analysis of the level of (dis)proportionality between specific signals and specific outputs. Second, we show that the level of disproportionality in the setting of TACs has decreased considerably over time. This suggests that both approaches that predict disproportionate information processing and approaches that predict proportionate information processing may apply in different conditions, even under the same policy. Finally, we explore a number of potential explanations for this development over time, which may help to specify the relationship between the various approaches to information processing in the policy studies literature.
The remainder of the paper is structured as follows. In the next section, we outline the debate on information processing in the policy studies literature. Then, we sketch the main elements of the CFP and the way TACs are set. Subsequently, we introduce our measures of (dis)proportionality and present our dataset, which consists of TACs and the scientific recommendations on which they are based. This is followed by an analysis of the data, which show the (dis)proportionality of information processing in the setting of TACs over time. After that, we explore a number of potential explanations for the pattern we observe. In the final section, we draw a number of conclusions.
2 Patterns of information processing in policy settings
2.1 Disproportionate information processing
The processing of information by policymakers has become central to recent versions of Frank Baumgartner and Bryan Jones’ punctuated equilibrium theory. The key point made by PET, already from its inception, is that policy dynamics are characterised by long periods of relative stability, punctuated by brief periods of radical policy change. This pattern is explained in terms of the allocation of (scarce) attention by policymakers. Policymakers can only focus on a subset of all potentially relevant dimensions of policy issues. As a result, they will tend to ignore aspects of issues that fall outside of the consensus underlying a prevailing policy. This leads to (long) periods in which policies change only marginally, within the parameters set by the existing policy. Only when other dimensions become too salient to ignore (either because political actors are able to reframe the dominant understanding of an issue or because problems on the previously ignored dimensions become too large to ignore), will policymakers shift attention to these other dimensions. This, then, may result in a completely different approach to the issue and, hence, radical policy change in a relatively brief period of time.
According to Howlett and Cashore (Reference Howlett and Cashore2007), PET is part of a “new orthodoxy” in the policy studies literature, which assumes that policy change is typically not achieved endogenously, through adaptation by existing policy subsystems, but rather exogenously, through the radical disruption of existing subsystems by outside forces. In that regard, Baumgartner and Jones’ approach shows close affinity with Hall’s (Reference Hall1993) notion of “paradigmatic change”, as well as with Paul Sabatier’s insistence that dominant advocacy coalitions will normally not change the basics of existing policies and that more fundamental policy change can only occur through the displacement of dominant advocacy coalitions through external “system events” (see hypotheses 4 and 5 in Sabatier Reference Sabatier1998, p. 106).
Notions of information processing are inherent in each of these approaches, but most explicitly so in PET. Hall explains policy change in terms of policy learning at different levels of policymakers’ beliefs, but he does not describe these processes in terms of information processing per se. Sabatier’s Advocacy Coalition Framework (ACF) is based on a model of individual decisionmaking that can be reformulated in terms of information processing. As Sabatier and Weible (Reference Sabatier, Weible and Sabatier2007, p. 194) explain, “ACF stresses the difficulty of changing normative beliefs and the tendency for actors to relate to the world through a set of perceptual beliefs”. As a result, policymakers will tend to ignore incoming signals that do not fit into their perceptual beliefs.
This view resembles the account of information processing in later versions of PET, which makes an explicit link between policy dynamics and processes of (disproportionate) information processing (Jones and Baumgartner Reference Jones and Baumgartner2005; see also Baumgartner and Jones Reference Baumgartner and Jones2005; Workman et al. Reference Workman, Jones and Jochim2009). The argument then is that policymaking is a response to signals about (attributes of) issues. According to the definition given by Jones and Baumgartner (Reference Jones and Baumgartner2005, p. 43), policy responses are proportionate when “the size of any change in response [is] equal in proportion to the size of any change in incoming signal from the environment” (Jones and Baumgartner Reference Jones and Baumgartner2005, p. 43). If information processing is proportionate, any change in incoming signals will lead to an equally strong change in policy response. In the end, this will lead to a relatively smooth adjustment of policies to changes in incoming signals.
However, in reality, Jones and Baumgartner argue, information processing tends to be disproportionate. Rather than weighing each signal equally, policymakers focus on only a subset of signals, ignoring others. Political decisionmakers will only monitor and respond to signals that are directly relevant to the issues they give priority to. Because of limited attention spans, this prioritisation implies that other issues receive less attention simultaneously and that signals about those issues are all but ignored. Similar mechanisms operate within a single issue that includes several dimensions. At any given point in time, some dimensions of a policy issue will be predominant, while others receive less attention. This, too, translates into selective attention for some signals that relate to the policy, to the detriment of others.
According to Baumgartner and Jones, attention may shift from one (dimension of an) issue to another if a hitherto ignored issue or issue dimension suddenly comes onto the agenda. This is what happened, for instance, after the 9/11 attacks, when a flurry of policymaking on terrorism engulfed the US and many Western European countries. Terrorism had been there before 9/11, but the attacks suddenly highlighted its potential consequences and hence shifted attention to the issue. Besides such “focusing events” (Birkland Reference Birkland1998, Reference Birkland2006; Kingdon Reference Kingdon1995) sudden shifts may also occur when signals about an ignored issue (dimension) reach a certain threshold, beyond which they can no longer be ignored (Jones and Baumgartner Reference Jones and Baumgartner2005, p. 51ff.; Wood and Doan Reference Wood and Doan2003). This then underpins and explains the pattern of “punctuated equilibria”, which has been found in a wide range of countries and policy areas (Baumgartner et al. Reference Baumgartner, Breunig, Green-Pedersen, Jones, Mortensen, Nuytemans and Walgrave2009; Breunig et al. Reference Breunig, Koski and Mortensen2009; Jones et al. Reference Jones, Baumgartner, Breunig, Wlezien, Soroka, Foucault, François, Green-Pedersen, Koski, John, Mortensen, Varone and Walgrave2009; Jordan Reference Jordan2003; Robinson et al. Reference Robinson, Caver, Meier and O’Toole2007, Reference Robinson, Flink and King2014).
2.2 Thermostatic policy change
Others have challenged the underlying notion that policymaking is characterised by disproportionate information processing and the associated pattern of punctuated policymaking that results from it. Several authors have argued that policies develop in a stepwise or incremental manner, even though this may eventually lead to a major policy reorientation if change consistently moves in the same direction (Cashore and Howlett Reference Cashore and Howlett2007; Coleman et al.Reference Coleman, Skogstad and Atkinson1996; Howlett Reference Howlett2009; Kay and Ackrill Reference Kay and Ackrill2010; Lindblom Reference Lindblom1979, p. 520; Peters et al. Reference Peters, Pierre and King2005; Weiss and Woodhouse Reference Weiss and Woodhouse1992, p. 261). In this model, outside signals are incorporated into policies in a more piecemeal way.
Similar arguments have been made in the literature on historical institutionalism, which studies the ways in which policymaking builds on existing policies and their legacies. In historical institutionalist accounts, policymaking is much more a matter of new elements being “layered” on top of existing policies and (stepwise) shifts taking place within a policy than of policies being completely “overhauled” (Mahoney and Thelen Reference Mahoney, Thelen, Mahoney and Thelen2010; Streeck and Thelen Reference Streeck, Thelen, Streeck and Thelen2005). Likewise, studies in the field of policy history that engage with the theoretical debate on policy change have emphasised the evolutionary development of policies over time. As a result, seemingly radical changes are foreshadowed by and build upon longer-term and more slowly-moving processes (Henstra Reference Henstra2011; McGuinn Reference McGuinn2006 – but see Ceccoli Reference Ceccoli2003 for a historical study that supports PET).
Howlett and Cashore (Reference Howlett and Cashore2007) have explicitly linked these types of incremental approaches to an account of information processing in their model of “thermostatic policy-making” (see also Steinbruner Reference Steinbruner1974). In a thermostatic model, a policy changes as a result of responses to incoming signals in relation to the policy’s built-in policy objectives, just as a thermostat will adjust the level of heating in response to the temperature it records. In their case study of North-West Pacific forestry policy, incoming signals about the deteriorating condition of forest ecosystems caused policymakers to impose ever more stringent restrictions on logging in federal forests. Over time this led to a decrease in harvesting levels by more than 80%, even though no radical or fundamental policy overhaul had occurred. This would signify a much more proportionate processing of signals than expected by PET. Rather than a sudden shift when a neglected issue dimension is (re)discovered, policymakers adjust policies in response to the incoming signals about the nature and severity of the issues they are supposed to address.
The key question arising from the debate on (dis)proportionate information processing is which of these patterns will arise when. The literature offers empirical examples of and support for each of the models. Nevertheless, both approaches tend to present their account as somehow inherent in the way politics, institutions and/or policymakers work. It may well be, however, that some policy processes are punctuated and others thermostatic, depending on some contextual condition(s). Identifying these conditions would help to better understand how information processing in policy processes works.
Although the debate in the policy studies literature has largely focused on patterns of change in policies as a whole, these competing perspectives on information processing are equally important for understanding how decisions are made within a policy. In fact, in the thermostatic model, these two processes cannot be separated, since cumulative decisions within a policy may lead to change in the way the policy as such functions (as in the case of North West Pacific forestry policy). PET, too, has clear implications for information processing within existing policies, since the impetus for radical policy change stems from the cumulative effect of ignoring certain incoming signals within an existing policy.
Studying the way information is processed within a policy therefore offers a relevant approach to exploring the accounts given by the two sides in the debate. Through decisions on policy settings made within a policy, more insight can be gained into the way policymakers respond to incoming signals. This, in turn, allows for an assessment of one of the central elements in competing theories of policy change.
The CFP offers a good case for doing this, since it includes a string of annual decisions stretching back to the 1980s, combined with a clear and exclusive source of incoming signals on the status of fish stocks. To introduce this case, the next section will give some brief background on the CFP and the workings of its conservation regime.
3 How does the EU’s Common Fisheries Policy work?
3.1 The CFP’s conservation regime
The CFP was created in 1970, in the framework of the then European Economic Community (EEC). The initial CFP covered three elements: a regime for access to fishing grounds in one member state by fishermen from other member states, free trade in fisheries products, and subsidies for the fisheries industry (Holden Reference Holden1994; Leigh Reference Leigh1983; Lequesne Reference Lequesne2004). At the time, conservation of fish stocks played a small role in the policy.
In 1983, a conservation regime was added to the CFP. It aimed at managing and thereby conserving commercial fish stocks, as a complement to the access, free trade and subsidisation regimes in the policy. It relied, and still relies, on three main instruments:
-
Each year, maximum Total Allowable Catches are established. These are catch limits (expressed in tonnes or numbers of fish) for commercial species in given sea areas. TACs are subsequently divided into national fisheries quotas for individual member states and non-EU member states that have a fisheries agreement with the EU.
-
Technical measures are aimed at protecting fish by setting specifications for fisheries gear. The most widely-used form is the specification of minimum mesh sizes to prevent the catch of small or underage fish.
-
In certain sea areas and/or periods of the year, restrictions on fishing activities can be established.
In this paper, we will focus on the setting of TACs. TACs have been and continue to be the main instrument for conserving fish in the CFP (cf. Rozwadowski Reference Rozwadowski2002, p. 203). Moreover, the adoption of TACs involves the most direct and most easily quantifiable link between incoming signals and policy decisions, thereby allowing for a precise analysis of this link. In 2013, 24 species were covered by TACs (EU 2013). TACs are set for different fishing areas, following the area classification developed by the International Council for the Exploration of the Sea (ICES).Footnote 1
ICES is an organisation that predates the CFP (and the EU) by more than half a century. It was created in 1902 to conduct research into the marine ecosystems of the North Atlantic, as part of rising concerns over overfishing at the time. ICES is an organisation that brings together marine scientists from both sides of the Atlantic. It has been a focal point for marine science and also provides advice to a number of governments and regional fisheries management organisations, including the EU (Rozwadowski Reference Rozwadowski2002).
ICES started developing models for and giving advice on catch quotas in the context of North Atlantic fisheries management in the second half of the 1960s, a considerable time before TACs were adopted as an instrument in the CFP. The basis for ICES advice is the so-called maximum sustainable yield (MSY) for a species, which ICES defines as “maximizing the average long-term yield from a given stock while maintaining productive fish stocks within healthy marine ecosystems” (ICES 2018, p. 3). Although the exact methodology for determining MSY has evolved over the decades, the concept itself has been the basis for ICES advice since the rise of TAC-based stock management in the 1960s (Rozwadowski Reference Rozwadowski2002, p. 188ff.).
The setting of TACs in the CFP proceeds through a number of steps, three of which are important for this paper. To start with, based on scientific assessments of the condition of fish stocks, ICES each year publishes a set of recommended TACs. It does so on a stock-by-stock basis, as most of the stocks for which ICES provides advice are managed using stock-specific TACs. As a next step, the European Commission releases a proposal for TACs, which may deviate from ICES advice. In determining its proposed TACs, the Commission also takes into account socioeconomic assessments given by the EU’s Scientific, Technical and Economic Committee for Fisheries (STECF). Finally, on the basis of the Commission proposal, the Council of Ministers adopts the TACs for the next year. This is preceded by consultations of stakeholders (alongside informal lobbying by stakeholders and negotiations among member state governments). In adopting TACs, the Council can amend the proposed TACs as it likes (Da Rocha et al. Reference Da Rocha, Cerviño and Villasante2012; Villasante et al. Reference Villasante, do Carme García-Negro, González-Laxe and Rodrígues Rodríguez2011, Reference Villasante, Morato, Rodriguez-Gonzalez, Antelo, Österblom, Watling, Nouvian, Gianni and Macho2012).
We can therefore distinguish between three stages: recommended TACs by ICES, proposed TACs by the Commission and adopted TACs by the Council. For the purpose of our analysis, we can treat ICES’ recommended TACs as incoming signals for EU policymakers on the status of fish stocks, as these recommended TACs are determined independently and are directly based on scientific estimates of fish stock conditions in a given year. Adopted TACs are the policy outputs. The Commission’s proposed TACs are an intermediate step in this process. In terms of (dis)proportionate information processing, the most relevant comparison is therefore between recommended TACs and adopted TACs. We may say that information processing is more proportionate vis-à-vis ICES advice, the more closely adopted TACs conform to recommended TACs.
3.2 Balancing interests in the CFP
The CFP seeks to balance three objectives: the conservation of fish stocks (the conservation objective), the economic development of the fisheries sector (the economic objective) and the protection of vulnerable fisheries communities (the social objective) (Princen Reference Princen2010, p. 37). The objectives have different implications for the setting of TACs: the conservation objective leads to lower levels of TACs, while the economic and social objectives tend to produce higher TACs.
In the decision-making process described above, this tension is acutely relevant. The TACs recommended by ICES are strictly based on a biological assessment, using MSY as its benchmark. The concept of MSY itself already combines a conservationist and an economic objective, as it aims to protect the (long-term) health of fish stocks, while allowing for (maximum) use of “excess” fisheries resources (Rozwadowski Reference Rozwadowski2002, p. 190). Nevertheless, biological concerns are central to the determination of MSY and cannot be overridden by economic or social considerations.
By contrast, for the fisheries industry and fisheries ministers, economic and social considerations often outweigh biological and conservation objectives. As a result, TACs have usually been set (quite far) above the levels recommended by ICES or proposed by the Commission (Aranda et al. Reference Aranda, Murillas, Motos, Motos and Wilson2006; Da Rocha et al. Reference Da Rocha, Cerviño and Villasante2012; Villasante et al. Reference Villasante, do Carme García-Negro, González-Laxe and Rodrígues Rodríguez2011, Reference Villasante, Morato, Rodriguez-Gonzalez, Antelo, Österblom, Watling, Nouvian, Gianni and Macho2012). The CFP’s conservation regime has therefore been criticised as inadequate by a wide range of observers (Da Rocha et al. Reference Da Rocha, Cerviño and Villasante2012; Daw and Gray Reference Daw and Gray2005, p. 190; Holden Reference Holden1994, p. 167; Karagiannakos Reference Karagiannakos1996; Khalilian et al. Reference Khalilian, Froese, Proelss and Requate2010; Payne Reference Payne2000, p. 306; Symes Reference Symes1997, p. 139; Villasante et al. Reference Villasante, do Carme García-Negro, González-Laxe and Rodrígues Rodríguez2011).
Much of this failure is attributed to the role of the Council of (Fisheries) Ministers in setting TACs. Looking at the period 1985–1999, Franchino and Rahming (Reference Franchino and Rahming2003, p. 24) found that the difference between Commission proposals and ICES recommendations was negligible, while the TACs adopted by the Council considerably exceeded those proposed by the Commission. According to several observers, the pattern of adopted TACs exceeding recommended TACs continued in the 2000s (Da Rocha et al. Reference Da Rocha, Cerviño and Villasante2012; Daw and Gray Reference Daw and Gray2005, p. 190; Khalilian et al. Reference Khalilian, Froese, Proelss and Requate2010, p. 1181).
This mechanism is usually attributed to the fact that fisheries ministers are more responsive to (short-term) interests of fishermen in their countries than to the (long-term) sustainability of fish stocks (see e.g. Daw and Gray Reference Daw and Gray2005, p. 191; Khalilian et al. Reference Khalilian, Froese, Proelss and Requate2010, pp. 1181–1182; Payne Reference Payne2000, p. 315). In addition, Franchino and Rahming (Reference Franchino and Rahming2003, p. 20ff) argue that members of the Fisheries Council are preference outliers, in the sense that they tend to come from parties that are less concerned about environmental issues than the average minister in the government they are part of. These preferences affect the degree to which TACs adopted by the Council exceed Commission proposals (Ibid.: 27).
In terms of (dis)proportionate information processing, the literature on the CFP therefore suggests that (1) the Council of Ministers will engage in disproportionate information processing, since not all incoming signals weigh equally and (2) signals about socioeconomic effects of TAC decisions will outweigh ICES recommendations. As a result of this (3) adopted TACs will be set higher than the level recommended by ICES.
4 Measuring (dis)proportionality
In the PET literature, the level of disproportionality of information processing has been studied in various ways. Two main approaches stand out. First, some authors have defined cut-off points above which a certain case of policy change can be considered a “punctuation”. For instance, in their analysis of budgetary change, John and Bevan (Reference John and Bevan2012) take a change in output from one year to the other that exceeds 200% as the cut-off point for identifying punctuations.
The second approach, which has been most common, assesses the level of disproportionality by looking at distributions of policy change over time (and across large numbers of issues) (see e.g. Baumgartner et al. Reference Baumgartner, Breunig, Green-Pedersen, Jones, Mortensen, Nuytemans and Walgrave2009; Breunig et al. Reference Breunig, Koski and Mortensen2009; Jones et al. 2003; Reference Jones, Baumgartner, Breunig, Wlezien, Soroka, Foucault, François, Green-Pedersen, Koski, John, Mortensen, Varone and Walgrave2009). The argument behind this is that disproportionality does not show up at a specific moment. Since it is associated with stability most of the time, punctuated by radical change at some points in time, the level of disproportionality can only be determined on the basis of an analysis of overall patterns. As information processing becomes more disproportionate, periods of stability will tend to become longer and punctuations more pronounced. As a result, it is impossible to say beforehand when a punctuation will occur.
For these reasons, most of the PET literature has moved away from seeking to explain single cases and has instead focused on distributions of (large numbers of) changes. From the change distributions, inferences are then made about the underlying pattern of information processing. Jones and Baumgartner (Reference Jones and Baumgartner2005, pp. 119–121) argue that if information processing is proportionate, giving equal weight to incoming signals, this will result in a normal distribution of changes. To the extent that information processing is disproportionate, the distribution of changes will become more leptokurtic, that is, it will exhibit both a higher central peak (reflecting greater resistance to change) and fatter tails (reflecting the punctuations that “correct” for earlier periods of stasis). In this way, the level of disproportionality of information processing by or in an actor or institution can be inferred from the level of leptokurtosis of the change distribution of outputs from that actor or institution.
Both approaches have their specific weaknesses. The weakness of approaches using cut-off points or categories is that the specification of these points or categories is always arbitrary. It is unclear why some cut-off point would be the most appropriate for distinguishing punctuated from nonpunctuated change. The main weakness of approaches using change distributions is that they no longer allow for inferences about individual cases. After all, individual cases are only meaningful in the context of the overall change distribution. Most important for the purpose of our paper, a weakness of distributional approaches is that the actual link between incoming signals and outputs is not examined directly. Rather, a leptokurtic change distribution is taken to imply a disproportionate processing of signals, without specifying specific signals and their relation to outputs.
In this paper, we use two measures that both focus on individual cases and include a direct link between signals and output, while they do not rely on some (inherently arbitrary) cut-off point. Such an approach is feasible for a policy such as the CFP’s conservation policy because it shows three characteristics. First, ICES recommendations are independent from the decision-making process within the EU, since ICES determines scientifically appropriate levels of TACs without input from EU institutions. Second, ICES recommendations are authoritative, since there are no alternative sources of information on the status of fish species with equal weight. Of course, fishermen and environmental NGOs make claims about the state of fish stocks, but given the high costs of gathering systematic data, ICES is the only institution to offer a comprehensive overview in this regard. Third, the setting of TACs and the associated release of ICES recommendations take place annually, making it possible to trace the processing of signals over time.
Our analysis approaches the proportionality of information processing in two ways: through the relationship between recommended and adopted TACs in a given year and through the relative change in recommended and adopted TACs between years. To determine the relationship between recommended and adopted TACs in a given year, we introduce a new measure, which we label the disproportionality score. For a specific species in year t, the disproportionality score is calculated as follows:
 $$D - scor{e_t} = {{{RTA{C_t} - ATA{C_t}}}\over{{AvgTAC}}$$
D – score t denotes the disproportionality score, RTAC t is the TAC recommended by ICES, ATAC t denotes the TAC adopted by the Council, and AvgTAC denotes the average TAC over the entire period of time.
We do not simply use the difference between recommended TAC and adopted TAC because the absolute difference is a worse indicator for the degree of disproportionality than the relative difference (relative, that is, to the total volume of the TAC). We chose to divide by the average TAC for a species in a given ICES zone over the entire period under study, rather than the adopted TAC in a given year, since a TAC in a given year may equal zero. The resulting score has a negative value if the adopted TAC is higher than the recommended TAC. It has a positive value if the adopted TAC is lower than the recommended TAC. If the value is 0, the adopted TAC is equal to the recommended TAC. Hence, the closer the disproportionality score is to 0, the more proportionate information processing is.
In addition to the disproportionality score, we also look at the relative change in recommended and adopted TACs between years.Footnote 2 As was noted above, if information processing is fully proportionate, a change in incoming signals will lead to an equally strong change in policy response. Hence, the correlation between the year-to-year changes in recommended and adopted TACs is a measure for the proportionality of information processing.
For both the ICES advice and the levels of TAC, we focus on the 11 commercially most important species under the CFPFootnote 3 , for three reasons. First, these species have been subject to TACs since the inception of the CFP’s conservation policy in 1983. Second, they account for most of the commercial catches in the 1983–2013 period in EU waters made by EU fishing vessels. And third, ICES data provide full information about recommended and adopted TACs for these species for the entire period analysed. We look separately at TACs in each of the ICES regions for which they are set. Our dataset covers the period 1987–2013. This leads to a total of 663 TAC decisions for which a disproportionality score can be calculated.
5 Disproportionality in the CFP
Based on the formula introduced above, we calculated the disproportionality scores for 663 TAC decisions. Figure 1 gives a scatter plot of these disproportionality scores, ordered by year.
Disproportionality of TAC decisions (1987–2013).
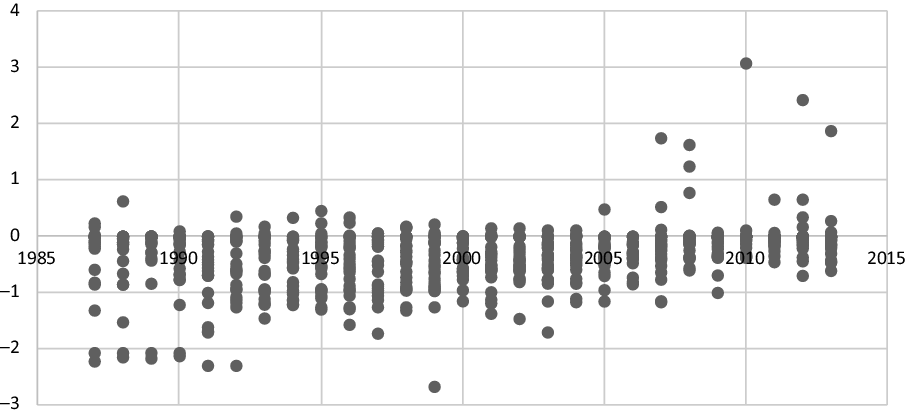
As can be seen from Figure 1, the actual values on the disproportionality score range from a bit under −2.5 to just over +3.0. Most of the lower values are recorded in the late 1980s and early 1990s, while the highest values occur after 2005. This first impression is borne out by Figure 2, in which the average degree of disproportionality has been calculated for each year.
Average degree of and standard deviation in disproportionality in TAC decisions (1987–2013).
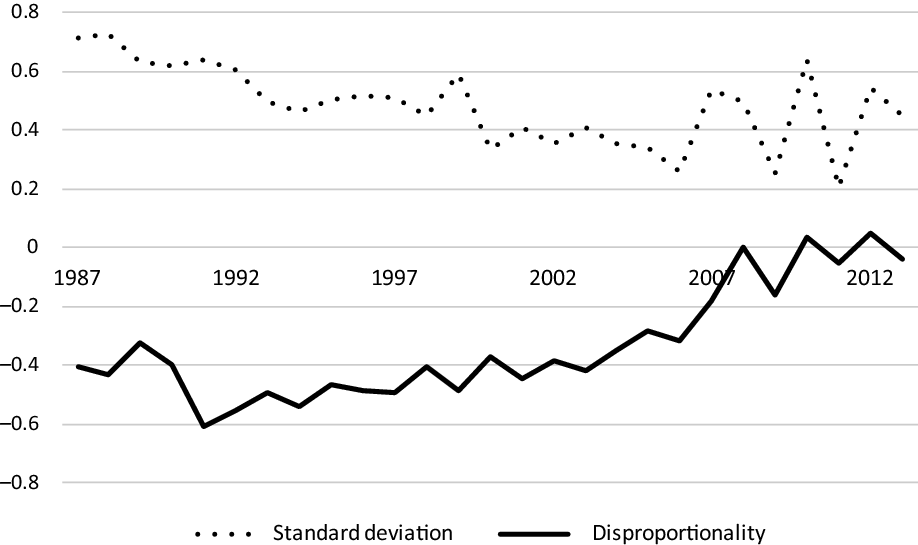
Figure 2 shows a gradual reduction in disproportionality after 1991, with a further acceleration after 2006. From 2007 onwards, the average degree of disproportionality is close to 0. This means that over time, average TAC levels have been set increasingly close to the levels recommended by ICES. Even though Figure 1 shows the continuing underlying variation in terms of specific TACs for species in given ICES regions, the standard deviation of disproportionality shows a declining trend over time, indicating that the variation in disproportionality among different TAC decisions in a given year has decreased.
In addition to the disproportionality score, we also calculated Pearson’s r between the relative (i.e. percentage) change in recommended and adopted TACs in a given year. Because percentage changes could not be calculated for the first year in our dataset and for cases in which the recommended or adopted TAC went from 0 to a positive figure, this analysis is based on 607 observations.Footnote 4
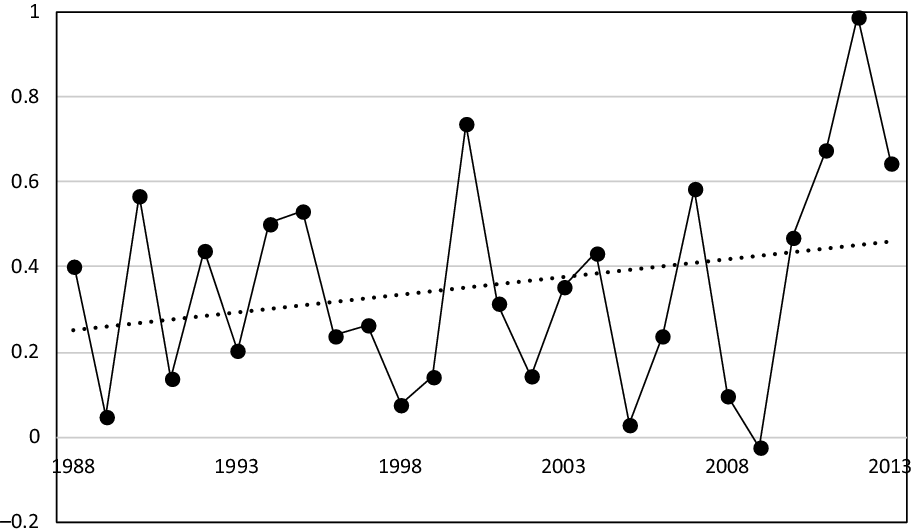
Figure 3 shows the correlation between the percentage change in recommended and adopted TACs per year from 1988 to 2013. The dotted line indicates the trend line. This figure shows a gradual increase in correlation during this period, albeit with large fluctuations between years. These fluctuations are partly due to the relatively small numbers of observations per year, which make the outcomes vulnerable to single extreme observations. Nevertheless, the overall trend is upward, with four of the five highest correlation coefficients appearing between 2007 and 2013. This largely confirms the pattern found with the proportionality score: the processing of ICES recommendations in the setting of TACs has become more proportionate over time, with the highest levels of proportionality occurring in the last part of the period under study.
Correlation between percentage change in recommended and adopted TACs by year (1988–2013).
6 Why more proportionate information processing?
The findings presented in the previous section present a distinct puzzle for theories of information processing. The main question in this regard is: how can it be that information processing has become more proportionate? Theories tend to assume that the pattern of information processing is more or less fixed, embedded in characteristics of policymakers and policymaking institutions. These accounts do not allow for shifts from disproportionate to proportionate information processing. In this section, we explore a number of potential explanations for this pattern, which shed different lights on the relationship between punctuated and thermostatic accounts of policy change.
6.1 Changes in the advice process
First, we check whether our assumption holds that adopted TACs have come to conform more closely to recommended TACs, rather than the other way around. Similar outcomes in terms of disproportionality could also arise under an alternative scenario, in which recommended TACs are adjusted to adopted TACs. This could happen if ICES anticipated the increases made by the Council of Ministers and adjusted its recommended TACs to decrease the gap.Footnote 5 Disproportionality would then also decline, but not as a result of a change in information processing by EU decisionmakers.
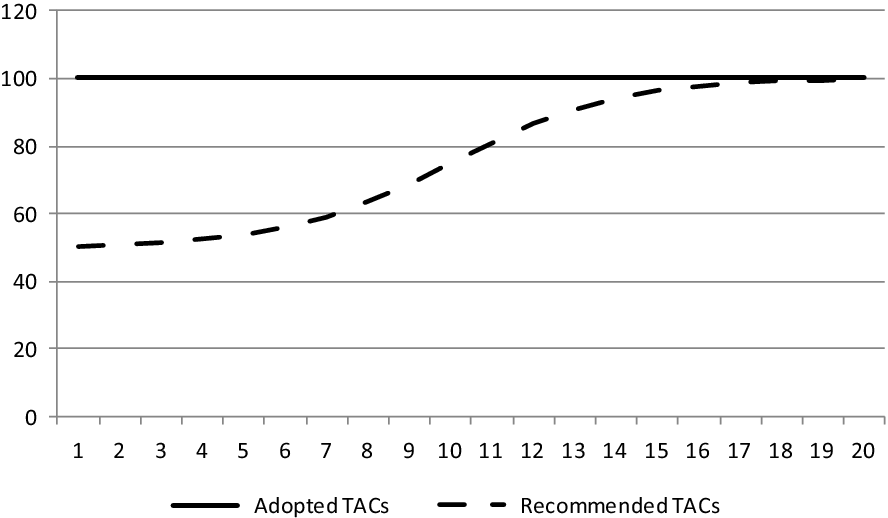
In this alternative scenario, we would have to see a pattern in which recommended TACs develop towards adopted TACs, such as the hypothetical pattern depicted in Figure 4.
Hypothetical scenario in which recommended TACs rise towards adopted TACs.
To see if this scenario actually occurred in our data, we analysed the development of recommended and adopted TACs for each of the 11 species in our dataset individually. For anchovy and hake, we find a rise of recommended TACs over time, which at least makes it possible that the reduction of disproportionality is the result of an alignment of ICES advice with adopted TACs rather than the other way around. Yet, for the other nine species no such pattern can be discerned. Rather, the trend in both recommended and adopted TACs is downward, with adopted TACs “closing in” on recommended TACs rather than the other way around. This is not consistent with the hypothesis that recommended TACs have developed in such a way that they conform more closely to adopted TACs, rather than the other way around.
6.2 Changing economic and social conditions
Changes in economic and social conditions offer a second potential explanation for the observed trend toward higher degrees of proportionality. This explanation relies on a change in the nature of the trade-off between different considerations in the setting of TACs. The adoption of TACs that exceed scientific recommendations has been explained with reference to economic and social concerns, as a way to placate the fisheries industry and/or protect coastal communities dependent on fisheries. To the extent that socioeconomic and environmental considerations become mutually less exclusive, policymakers need to make less of a choice between them. If this is the case, socioeconomic and environmental concerns increasingly point towards similar levels of TACs, which would lead to TACs being set closer to environmentally sustainable levels.
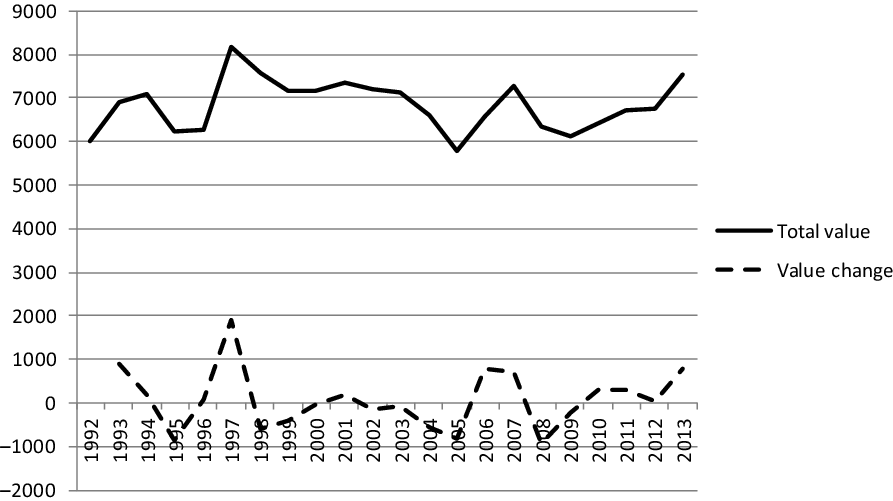
In this section, we therefore explore whether changes in economic and social conditions can explain the observed trend toward higher degrees of proportionality. To assess the economic development of the EU fishing industry, Figure 5 shows the volume of landed fish of the EU-12Footnote 6 in the period 1992–2013 in nominal terms (upper line) and the change compared to the previous year (lower line).Footnote 7 Both lines show no clear pattern, with increases and decreases alternating from year to year and the overall value of landings hovering between 6 and 8 billion Euros for 19 out of the 22 years.
Values of landings and annual changes in the EU-12 between 1992 and 2013 (in millions of Euros).
Another indicator, which relates more closely to the social aspects of fisheries policy, is the level of employment in EU fisheries. Unfortunately, no uninterrupted set of employment data is available for the period under study. However, those data that are available show a sustained decrease in employment over time.
A study commissioned by the European Commission and published in 2006 shows that between 1997 and 2003, employment in the fishing fleet decreased from 241,000 to 193,000 workers. This was partly offset by an increase in employment in the fish processing industry (from 102,000 to 118,000) but also (albeit slightly) reinforced by a reduction of the workforce in aquaculture (from 61,000 to 58,000) (Salz et al. Reference Salz, Buisman, Smit and de Vos2006, p. 18). STECF reports show a further decrease in employment in the fishing fleet to a bit over 150,000 workers in 2012 (STECF 2014, p. 80; see also STECF 2009, p. 18).
The implications of this for the setting of TACs in light of social considerations are ambiguous. On the one hand, if maintaining employment is an important objective for policymakers, one would expect TACs to rise in order to compensate for the greater productivity. This is not what happened, as is borne out by the decreasing degree of disproportionality without a rise in recommended TACs.
On the other hand, decreasing employment could also lessen the pressure of social concerns on the setting of TACs, as an ever smaller number of fishermen are affected by decreases in TACs. The social impact (as well as the political costs) of reducing TACs becomes smaller as fewer fishermen are affected, which could account for the decrease in disproportionality. A caveat with this argument is that it is difficult to disentangle cause and effect here. Decreasing levels of employment may have made it easier for politicians to adopt stricter policies, but at the same time, the decrease in employment may also (at least partly) be a result of stricter policies. Based on the data we have, the relative importance of these two directions of influence cannot be assessed. Nevertheless, either way it seems reasonable to conclude that the reduction of employment in fisheries has lessened the pressure on ministers to take into account social considerations when setting TACs.
6.3 Developments in the CFP itself
A third set of potential explanations is located in the CFP itself. Changes in the setup of the policy or the decision-making process around TACs may account for the decreased disproportionality we observe. One obvious change over time is the number of EU member states. With subsequent rounds of enlargement, the EU has gone from 12 to 27 member states over the period we studied. This could have affected the decision-making dynamics around the setting of TACs. However, this effect, if there is any, is unlikely to account for the trend of increasing proportionality that we found. In their analysis of decisionmaking on TACs, Franchino and Rahming (Reference Franchino and Rahming2003) found that an increase in the number of member states leads to less “efficient” (in terms of resource conservation) policies. In light of this, they were pessimistic about the impact of the (then) upcoming 2004 enlargement, as “[a]n increase in the number of interests involved tends to expand the perverse patterns of decision-making” they observed, thereby increasing “the risk of overexploitation” (Ibid.: 32). Our data suggest that, at least when it comes to the alignment of adopted with recommended TACs, these predictions have not materialised.Footnote 8
Another important trend in the CFP, which has been described extensively in the literature, is the move in leading paradigm from a “traditional” fisheries management approach to a more environmentally focused approach (Princen Reference Princen2009, p. 139ff.). In a traditional fisheries management approach, the conservation of fish stocks is important as a way to safeguard future fisheries activities. In this approach, conservation is therefore instrumental and, eventually, subordinate to economic considerations. In the alternative “ecosystem approach” to fisheries, fisheries conservation is not just a way to preserve fish stocks for future fishermen but an end in itself. Moreover, the conservation of fish stocks is not seen in isolation but as part of the protection of wider marine ecosystems, of which fish form an integral part and which are therefore also affected by fishing activities.
Over time, environmental and ecosystem concerns have become more prominent in EU fisheries policy, mainly as a result of activism on the part of environmental NGOs (Princen Reference Princen2009, p. 142ff., Reference Princen2010). In decisionmaking on TACs, this changing focus led to a number of important developments. First, since the 2002 reform of the CFP, an increasing number of fish stocks is managed under multi-annual plans, with endangered stocks being managed under special recovery plans. TACs are still set annually, but this is constrained by the objectives laid down in these multi-annual plans (Fernandes and Cook Reference Fernandes and Cook2013, p. 1434; Penas Reference Penas2007, p. 589).Footnote 9
Second, as Gray and Hatchard (Reference Gray and Hatchard2003, p. 550) note, the Commission has become more assertive in its dealings with the Council of Fisheries Ministers. Under the CFP, the Commission has the possibility to take emergency measures if fish stocks fall below sustainable levels. From the (late) 1990s onwards, the Commission became more active in threatening to use this instrument. As a result, and further supported by increasing NGO activism and public concern over overfishing, fisheries ministers felt more pressure to not deviate too much from the TACs as proposed by the Commission (and thereby: as recommended by ICES).
All in all, a clear trend can be observed towards a greater emphasis on environmental objectives in the CFP, both rhetorically (the use of “environmental language” in policy documents; see e.g. Princen Reference Princen2009, p. 146) and in terms of institutional processes (a more assertive role for the Commission and the use of multi-annual plans). In terms of information processing, this may have led to a greater emphasis on signals about the ecological condition of fish stocks as expressed through ICES recommendations.
7 Conclusions
Our results show that the processing of ICES recommendations in setting TACs under the CFP has become more proportionate over time. We explored several potential explanations for this pattern. This analysis has a number of implications for the literatures on information processing, policy dynamics and EU fisheries policy.
First, we sought to introduce a new way of measuring the level of (dis)proportionality in information processing by policymakers, which links incoming signals and policy outputs. In this way, the relationship between incoming signals and policy outputs can be observed directly so that information processing dynamics need not be inferred from outputs alone.
As was noted above, this measure was particularly suited to the context of the CFP because of a number of specific characteristics of the issue area: the existence of an independent and exclusive signal for the environmental status of commercial fish stocks and the recurrence of easily quantifiable annual decisions on TACs. In many policy areas, these conditions do not hold, making it more difficult to apply the disproportionality score. Nevertheless, several policy areas would potentially lend themselves to the application of our measure, for instance in monetary policy (the setting of interest rates) or trade policy (the setting of tariffs). As a result, the disproportionality score forms a useful complement to existing ways of studying information processing.
Second, the substantive findings of our analysis have implications for the wider debate on information processing in policy processes. Although, as any policy area, the CFP represents a distinct set of institutions, procedures and debates, the underlying dynamics of information processing and policymaking show many similarities with other areas: a struggle for attention and resources by (roughly) two opposing sets of actors (“advocacy coalitions”, in Sabatier’s terminology), limited agenda space on the part of key decisionmakers (here: the Council of Ministers) and trade-offs between different objectives underlying the policy. The shifting balance of attention to these objectives under the influence of discursive and institutional developments is therefore likely to apply to other policy areas and policymaking institutions as well, although further empirical research is needed to tease out the specifics of these dynamics in different contexts.
Third, related to the previous point, our study may shed light on the broader debate between PET and the thermostatic model of policymaking, as both are based on distinct assumptions about the way information is processed by policymakers. Our analysis suggests that over time patterns of thermostatic policy change and punctuated equilibrium may both occur within the same policy. Arguably, the setting of TACs under the CFP has become more “thermostatic” as adopted TACs have tended to follow recommended TACs more closely.
This offers a way to more precisely define the scope of conditions under which each of these models holds. In a thermostatic model of policy change, policymakers respond to signals in relation to the established goals of a policy (Cashore and Howlett Reference Cashore and Howlett2007, p. 543). The extent to which policy settings evolve in a thermostatic way therefore depends on the specific objectives that policymakers take into account when making decisions. What we can observe in the CFP is a gradual shift in emphasis towards one of the policy’s underlying objectives (i.e. conservation). This, in turn, has led to a greater degree of proportionality in the processing of signals relating to that objective (i.e. ICES recommendations). Our analysis suggests that such a shift in emphasis was built into the CFP by a combination of changing discourses around fisheries conservation (a greater emphasis on the ecosystem approach) and institutional adjustments (e.g. the use of multi-annual plans). As we noted above, this shift may have been facilitated or reinforced by the declining levels of employment in the fisheries industry. This implies that over time policies can become more (or less) thermostatic in relation to a specific set of signals by political activism and/or institutional design.
At the same time, it may also be that the long-term dynamic underlying the allocation of attention in the CFP is best explained by theories of disproportionate information-processing, which account for shifts of attention between different incoming signals. Moreover, the decrease in disproportionality in relation to ICES advice does not imply that there has been a decrease in overall disproportionality in the CFP. It may well be that the increasing proportionality vis-à-vis ICES recommendations has been counterbalanced by decreased proportionality vis-à-vis other (e.g. socioeconomic) signals. If this is the case, then thermostatic responses to one set of signals can exist alongside disproportionate responses to other sets of signals within the same policy.
Fourth, and finally, our analysis has implications for important claims in the literature on the CFP. Despite pessimistic assessments (Daw and Gray Reference Daw and Gray2005; Franchino and Rahming Reference Franchino and Rahming2003; Khalilian et al. Reference Khalilian, Froese, Proelss and Requate2010), the trend of setting TACs above ICES recommendations has changed over time. This also suggests that the move towards a more environmentally focused CFP, as it was most ambitiously pronounced in the 2002 reform of the CFP, has been more than rhetoric, at least when it comes to the setting of TACs. It seems that, when it comes to the setting of TACs, the CFP has indeed gradually moved towards a greater emphasis on the (environmentally informed) signals provided by ICES.
This ties in with recent studies that show that fish stocks under the CFP have been improving since 2000 (Fernandes and Cook Reference Fernandes and Cook2013). Of course, this trend cannot be attributed to the setting of TACs alone. The CFP uses a range of instruments besides TACs. Moreover, the enforcement of policies, which has always been a weak spot in the CFP, plays a major role in producing outcomes (Da Rocha et al. Reference Da Rocha, Cerviño and Villasante2012). Finally, the condition of fish stocks does not only depend on policies but also on natural developments that are beyond the reach of the CFP. Nevertheless, the pattern of TACs following ICES recommendations more closely may have contributed to the overall trend of improving fish stocks. This makes it an important part of the puzzle in attempts to move the CFP into a more sustainable direction.
Acknowledgements
Previous versions of this article were presented at the 2015 Annual Conference of the Comparative Agendas Project (Lisbon, 21–24 June 2015), the 2015 Annual Research Day of the Institute for Management Research (Nijmegen, 25 June 2015), the 2015 Conference of the Netherlands Institute of Governance (Nijmegen, 5–6 November 2015) and the 2017 ECPR Joint Sessions of Workshops (Nottingham, 26–29 April 2017). The authors would like to thank Jeroen Candel, Laura Chaqués Bonafont, Judith van Erp, Frédéric Varone and the participants at these events, as well as three anonymous reviewers for JPP, for their valuable comments and suggestions.
Funding sources
S. V. acknowledges funding from the EU COST Action “Ocean Governance for Sustainability - Challenges, Options and the Role of Science” and the ICES Science Fund Project “Social Transformations of Marine Social-Ecological Systems”.
Data availability statement
Replication materials are available in the Journal of Public Policy Dataverse at https://doi.org/10.7910/DVN/BUXAWS.


 Open access

