


Value of Data/Highlights
-
• First available data to reveal the effect of sustainable aviation fuel and/or its blends on ice formation and pressure drops across the strainer mesh in a simulated aircraft fuel system (AFS).

-
• Data is essential to establish confidence in the safe operation of future AFS that will potentially be compatible with 100% SAF.
-
• To achieve the target of introducing an entirely new sustainable fuel composition, it is important to understand the effect of these icing characteristics on the existing SAF types.
-
• This information is useful as it helps the aerospace industry to predict the temperature ice will start to build up or potentially lead to blockage with a particular fuel type.
Nomenclature
Definitions/Abbreviations
- AAIB
Air Accidents Investigation Branch
- AFS
Aircraft fuel systems
- ASTM
American Society for Testing and Materials
- ATJ
Alcohol to jet fuel
- ATEX
Abbreviation for two European Directives for controlling safety in potentially explosive atmospheres
- Cxx
-
C followed by one or two digits represents the number of carbon atoms in an organic molecule. It gives no information about the molecular structure or degree of saturation, ie, whether there are only single bonds between carbon atoms
- FT
-
Fischer Tropsch
- GUI
-
Graphical user interface
- HEFA
-
Hydroprocessed esters and fatty acids
- KF
-
Karl Fischer
- LabVIEW
-
Laboratory Virtual Instrumentation Engineering Workbench
- NumPy
-
Numerical Python
- OEM
-
Original Equipment Manufacturer
- Paraffin
-
The historic name for an acyclic saturated hydrocarbon; the equivalent modern name is alkane. In jet fuel, the alkanic fraction is mainly composed of C8 – C16 molecules
- ppm
-
Parts per million. Water in fuel can be expressed on a volume by volume (v/v) or mass by mass (m/m) basis
- RPM
-
Revolutions per minute
- SAF
-
sustainable Aviation Fuel
- SASOL
-
Suid-Afrikaanse Steenkool-, Olie- en Gasmaatskappy - South African synthetic oil
- SPK
-
Synthetic paraffinic kerosene
- V
-
Terminal velocity
- ΔP
-
Pressure differential
1.0 Background to study
The aviation industry is currently facing increasing environmental and energy challenges regarding its fuel use [Reference Pires, Han, Kramlich and Garcia-Perez1–Reference Naya, Cao, Francisco-Fernández, Tarrío-Saavedra, Brage and Cancelo5]. Research is currently in progress to develop sustainable alternatives. Hence, an understanding of the properties of new SAF is required to understand their impact on aircraft fuel systems (AFS) [Reference Gutiérrez-Antonio, Gómez-Castro, de Lira-Flores and Hernández6–Reference Hari, Yaakob and Binitha9]. Water solubility, water settling and ice formation, amongst others, are some such properties of interest [Reference Ugbeh Johnson, Carpenter, Williams, Pons and McLaren10, Reference Ugbeh, Carpenter and Pons11]. The behaviour of water and ice in AFS has been studied from different perspectives [Reference Baena, Repetto, Lawson and Lam3, Reference Schmitz and Schmitz12–Reference Maloney, Diez and Rossmann18]. This has resulted in a large number of systems being employed for preventing the build-up of ice in AFS [Reference Marechal, Khelladi and Ravelet19–21]. Most OEMs protect their fuel feed pumps with mesh strainers, and pressure relief bypasses on the fine fuel system filters and fuel oil heat exchangers (FOHE). The latter ensures uninterrupted fuel flow to the engine in the event of ice build-up and filter or FOHE blockage [Reference Lam and Woods17]. Ice formation will occur when an aircraft is at altitude for a prolonged period. Ice accretion has been shown to be influenced principally by fuel velocity, turbulence and temperature [Reference Ugbeh Johnson, Carpenter, Williams, Pons and McLaren10, 21, Reference Ugbeh-J, Carpenter, Okeke, Nnabuife and Mai22]. Lower flow velocities bring both reduced shear rates as well as less rapid mixing. On the other hand, shear rate and mixing rate both increase with flow velocity, potentially leading to reduced ice accretion [Reference Baena, Lam and Lawson16, Reference Maloney, Diez and Rossmann18]. For some users, an anti-icing additive (Fuel System Icing Inhibitor (FSII)) is mixed with the jet fuel in small quantities to depress the freezing point of free water in the fuel and minimise the risk from hard ice bodies. FSII is mostly required in military aviation fuels, but FSII is also permitted in commercial jet fuel (Jet A or Jet A-1) with the approval of the end-user and is mandated for certain small turbojet and turboprop aircraft [Reference Baena, Lam and Lawson23], such as those manufactured by Bombardier Learjet, Cessna Citation, Daher TBM, Mitsubishi and Raytheon Beechcraft. Ice accretion on the surface of filter mesh screens and other parts of the engine fuel system has operational implications as it can cause a significant decrease in fuel flow to the engine [Reference Baena, Lam and Lawson16, Reference Baena, Lam and Lawson23]. As well as impeding fuel flow, any blockage on the inlet of the feed pumps could affect pump output. If inlet feed is reduced significantly, then cavitation within the pump body may occur, leading to erosion damage of close-fitting parts, such as pump impellers, gear teeth and housings. To ensure fuel system reliability under cold conditions, EASA CS 25.951(c) requires that ‘Each (aircraft) fuel system must be capable of sustained operation throughout its flow and pressure range with fuel initially saturated with water at 26.7°C (80°F) and having 0.20cm3 of free water per litre (0.75cm3 per US gallon) added and cooled to the most critical condition for icing likely to be encountered in operation’. This water supplement, in addition to the water contained in water-saturated fuel, equates to approximately 260ppm of water on a v/v basis [24, 25]. This is equivalent to about 325ppm water on a m/m basis; the exact value depends on the fuel density.
The UK Air Accidents Investigation Branch (AAIB) has released safety recommendation statements for research to be conducted to better understand ice accumulation and release within AFS. With the emerging new fuels, it is currently not known whether ice crystals in alternative fuels that conform with ASTM D7566 [24] can cause a measurable pressure difference across a pump strainer and affect pump performance. Therefore, it is necessary to understand the types and amounts of ice that can be produced from these SAF blends. The objective of this work was to demonstrate whether ice formed from SAF, or its blends could lead to ice blockage. The scope of work involved the design, build and commissioning of a test rig at an Airbus facility to simulate conditions seen in flight operations as closely as possible.
2.0 Materials and method
2.1 Rig overview
A schematic of the test rig is shown in Fig. 1 and in pictorial form in Fig. 2. The rig consisted of a storage tank, 1" nominal bore insulated pipework (total length of pipework was approximately 4.4m), centrifugal pump and ancillary parts to allow controlled circulation of jet fuel around a closed loop. The rig maximum fuel capacity was approximately 50L and the estimated volume of fuel within the pipework, pump and fittings was 2.5L; the system could achieve flow velocities of between 0.1 and 1.0m/s. The tank was situated within a controlled-temperature cabinet with PID control so that exposure to different external atmospheric conditions could be simulated. Fuel temperature could be controlled between −30 and +30°C; the rig was largely intended to simulate steady-state conditions but was capable of cooling 40L of fuel from ambient to −30°C within 4h. The rig was instrumented, and data acquisition and capture were handled within LabVIEW on an associated computer.
Cold fuel test rig schematic.

Cold fuel test rig with fuel tank in the environmental chamber.

The rig was fitted with an ATEX-rated pump motor, protective extra-low voltage instrumentation and full bunding. It had no exposed moving parts, and thermal insulation was applied to most cold surfaces to improve thermal performance and minimise atmospheric condensation. The test rig was designed to be compatible with aviation jet fuels.
The test section is composed of two parts: a removable length of aluminium tube (Fig. 2, component 6) that allowed inspection internally for accreted ice and a transparent viewing section (Fig. 2, component 5) to allow assessment of ice accumulation across a strainer mesh. This latter section was also removable, housing a mesh strainer/ice catcher, to investigate the effects of particulate or ice build-up and blockage. The ice catcher assembly is shown in Fig. 3(a) and (b). As seen in Fig. 3(d) and (e), a conical wire mesh of 20 holes per inch was utilised. The mesh was supported by a perforated metal cone (Fig. 3(c) and (e)) with 3mm diameter holes.
Strainer section in flowing fuel at; (a) room temperature and; (b) after an icing experiment; (c) strainer section removed after an icing experiment; (d) after an icing experiment (inside view); (e) after an icing experiment, removable mesh and outer support cone; (f) fuel sample point.
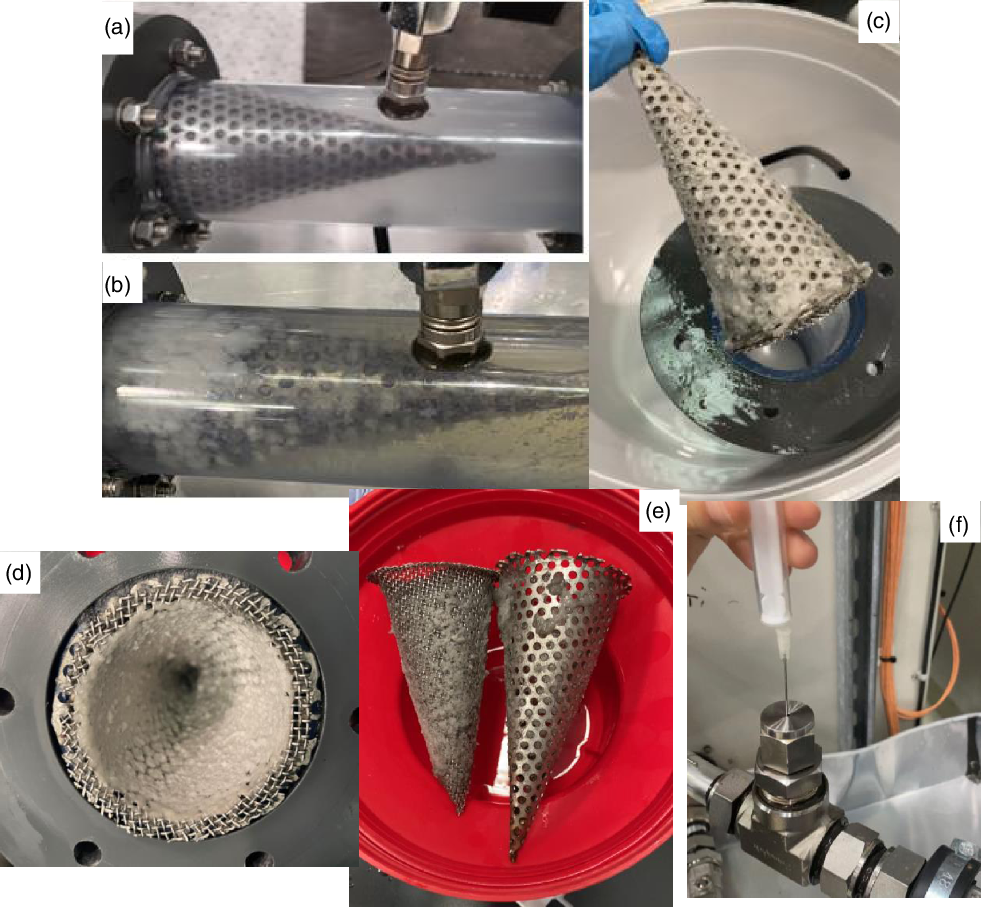
Pressure transducers were situated before and after the test section to measure pressure drop across the strainer. Temperature sensors were located at four points around the test loop (PT100-1 - PT100-4) and within the fuel tank (PT100-5 and 6); the air temperature within the environmental chamber was monitored with sensor PT100-7. 2.5mL fuel samples were taken at regular intervals to allow total water content determination; one of the sampling points is shown in Fig. 3(f). The sampling points were sealed with Viton A rubber (70 Shore A) septa to allow extraction of fuel samples whilst the rig was operating.
2.2 Description of test equipment and instruments
A Mettler Toledo MS105DU semi-microbalance was employed for accurate weighing of fuel samples before KF water determination. The balance can weigh up to a maximum of 120g with 0.001g precision. A Mettler Toledo C30 Coulometric Karl Fischer Titrator was used for the total water determination. The KF titration cell was filled with Honeywell Hydranal Coulomat AG-H from Fisher Scientific; previous test experience has shown that this is the most appropriate solution for evaluation of water content in kerosene fuels by coulometric KF titration. A high-speed stirrer is used in the titration vessel for rapid distribution of generated iodine to react with the water present in the test sample. The KF results were expressed on a m/m basis.
The Weiss environmental chamber shown in Fig. 2 is a large piece of ATEX approved test apparatus used within a secured segregated area. The chamber has an associated exterior cooling system outside the building for cooling the chamber to sub-ambient temperatures; it is used for chilling test specimens and/or chamber contents. The chamber has the capability to safely house fuels or other equipment under test and may hold flammable liquids at temperatures ranging between 70°C and 100°C. The quantity of fuel held within the Weiss chamber is limited for safety reasons. Therefore, a maximum of only 50L of flammable liquids is permitted within the segregated area, without the need to employ additional fire detection and suppression.
Data acquisition from the various test rig transducers was handled by a system, developed in-house by Airbus, from components supplied by National Instruments. The system is composed of signal conditioning modules, A to D convertors and a graphical user interface (GUI) developed in LabVIEW. This gave a functional output to the laboratory PC using ‘virtual instrumentation’ and a data logging function. As part of the GUI, there was a warning light that flashed on the display screen if the environmental chamber temperature exceeded 30°C whilst there was fuel inside. This alerted operators of the potential for fire and human health risks associated with fuel vapour if the chamber door was opened.
2.3 Rig materials and features
Materials used for the rig were the same as those found in a typical aircraft fuel system. Since fuels of different compositions with different aromatic contents were to be tested, materials compatibility, with regard to the fuel aromatics properties, was evaluated beforehand. Small-scale laboratory experiments tested three elastomers (silicone rubber, Suba-seal natural red rubber and Viton A – synthetic fluoropolymer rubber) and fuel compatibility. Observations from the small-scale compatibility tests indicated that Viton A rubber would be generally suitable for sealing the sample points but would need replacement when fuel changes were made. Limitations noticed while using the Viton rubber are described in the Discussion section.
Other fuel-wetted components included the main storage tank (5,251 aluminium alloy), pipework (5,052 aluminium alloy), polycarbonate transparent viewing section, and the fuel sampling points and valves (316 stainless steel). A Finnish Thompson AC4 pump was used to circulate fuel around the test loop; the pump body and impeller were made from 316 stainless steel. Flanged pipe joints were sealed with flat Viton rubber-bonded cork gaskets. Valving facilitated filling, air release, draining and control of flow rate, fuel drainage and general maintenance. Flow was monitored with a Gems FT-110 series turbine flow sensor from RS Components. Some of the limitations of using this transducer are highlighted in the Discussion section. The rig had a 500mm length of removable 1" 5,052 aluminium tube; this was used to investigate the effects of materials and surface finish on ice adhesion and build up.
An external vessel (fuel/water addition point) was fitted just upstream of the circulation pump, to allow the introduction of fuel/water mixture into the loop. A low speed (approximately 200 RPM) stirrer was installed in the conditioning tank to mix the fuel and help keep water droplets suspended.
Fuel sampling was achieved with a polypropylene 5mL luer lock syringe fitted with a 120mm long × 21-gauge stainless steel needle and 15mm thick stop collar to always guide the needle to the same depth (centre of the fuel stream).
2.4 Fuels
The fuels employed for this work were:
-
(a) SASOL (South African synthetic oil) is a Fischer-Tropsch synthesised paraffinic kerosene (FT-SPK) derived from coal and synthesised via the FT process using an iron or cobalt catalyst. SASOL synthetic fuels are designed to have properties similar to those of conventionally refined jet fuels and mainly composed of n-alkanes, iso-alkanes and cycloalkanes, with low levels of aromatics.
-
(b) The hydroprocessed esters and fatty acids fuel (HEFA SPK), supplied by SkyNRG is derived from deoxygenation and hydrogenation of fatty or oily materials of vegetable or animal origin. The precursor molecules are triglycerides: three fatty acids of carbon numbers between C8 and C24, linked together by a glycerol backbone. Apart from pre-treatment, the main process step is hydrotreatment to break the glycerol linkage, remove oxygen and open residual double bonds. The fuel can then be fractionated in the normal way to give appropriate length molecules for jet fuel. The products of the hydrotreated esters are mainly n-alkanes and iso-alkanes.
-
(c) The alcohol to jet synthetic paraffinic kerosene (ATJ-SPK), supplied by Gevo is derived from isobutanol (or butanol), produced by fermentation of sugars and/or cellulosic materials. The fundamental conversion steps are compose of an initial dehydration stage to create butenes, followed by oligomerisation to increase the molecular chain lengths to those required for jet fuel; the fuel is then hydrogenated to remove residual unsaturated molecules and fractionated by distillation. The product is mainly composed of n-alkanes and iso-alkanes; ATJ-SPK specifically refers to fuel not containing aromatics. A further limitation is that only C8, C12 or C16 hydrocarbon chain lengths may result when the molecules are oligomerised, which may be less than ideal for jet fuel.
-
(d) Conventional Jet A-1, used as a benchmark in these tests, was supplied by Advanced Fuels. Conventional jet fuels are mainly distilled from natural crude oil but may contain some reprocessed hydrocarbon fractions. They form a complex but chemically undefined hydrocarbon mixture of n-alkanes, iso-alkanes, cycloalkanes, aromatics of carbon numbers mostly in the range C8 – C16; <5% polycyclic aromatics and <1% olefins may also be present.
2.4.1 Experimental procedure
To define the optimum experimental procedure, some initial tests were done with Jet A-1. Checks were carried out to evaluate rig physical parameters such as leak tightness, residual air release, cooling profile, flow rates, data sampling, fuel sampling and water addition. The operating parameters were refined to give the generic procedure described below.
The Weiss altitude chamber was set to 28°C before introducing any fuel or water into the system. The fuel storage tank was filled with approximately 35L of test fuel. Valves were gradually opened to allow the flow loop to fill; then, the PC was switched on to begin data logging with LabVIEW. The pump was switched on to displace residual air, stir fuel and recirculate fuel flow back to the conditioning tank. Fuel samples were collected before and after fuel/water introduction into the rig, for coulometric Karl Fischer water content determination. Fuel samples were needed before water was introduced to determine the quantity of de-ionised water required to be added to attain the desired total water content and then samples were taken at regular intervals (at the start of the experiment and at 30-minute intervals).
The standard Airbus water introduction method is described by Ref. (Reference Lam and Woods17) and was adopted with slight modifications for this project. This method requires thorough mixing of calculated volumes of water and fuel at room temperature using an ultrasonic bath, and eventually introducing it into the system before cooling begins; at this stage, the bulk fuel temperature was set to 28°C. No water was added after cooling commenced.
The required quantity of water was calculated, and a master fuel/water mix solution was prepared using a Branson 1,510 ultrasonic bath. The master fuel/water mix was prepared in a clean, oven-dried 300mL beaker. Typically, 10mL of water would be mixed with about 200mL of fuel. Using the ultrasonic bath, the fuel/water solution was mixed for at least 40min. A thermocouple was present in the fuel at all times to monitor the temperature; this was not allowed to exceed the flash point of the test fuel (38°C for Jet A-1 was adopted for safety). Immediately after conditioning, the master solution was transferred to the external fill vessel. The fuel/water mixture was added over a 5min period via the fill vessel; when added to the bulk fuel, the aim was to achieve an overall concentration of about 260 ± 50ppm water v/v, based on EASA requirements [25]. In practice, it was found difficult to achieve exactly the right water concentration due to the dynamic nature of the test rig, and some undershoot or overshoot occurred with some experimental runs.
The ideal was to create a dispersion of small water droplets (<20µm) in the fuel stream, without introducing large globules of water (greater than 1mm diameter). After completing the fuel/water addition, the environmental chamber cooling system was switched on. The temperature was typically set to −70°C (thermocouple point labelled as PT100-7) to give the desired cooling rate and end temperature of −30°C after fuel circulation. From Fig. 4, it can be seen that the rig is capable of cooling 35L of fuel from ambient to −30°C within 4h while circulating round the flow loop.
Fuel samples were taken at intervals for Karl Fischer analysis (adopting the procedure given in ASTM D6304) using a Mettler Toledo C30 coulometer.
Different actions were required on completion of a test run. Typically, the pipework loop was isolated and then drained; the relevant pipe sections were unbolted, so that the mesh strainer and test section of tube could be removed to allow internal inspection and photographs taken of the ice accreted. Since the volumes of ice formed were relatively small and have low thermal mass, it was important to try to inspect and record observations as quickly as possible.
On completion of testing with one fuel type or mixture, logged data was extracted. Test fuel was drained, and the fuel tank wiped with an absorbent to prepare for testing the next fuel. It was impossible to drain all the existing fuel unless the rig was completely dismantled to drain and dry. Therefore, the sequence of testing highlighted in Section 2.4.2 was adopted, so that any fuel residues would have minimal impact on the new fuel/fuel blend to be tested.
2.4.2 Systematic set of test conditions
A systematic set of test conditions was proposed and is shown in Tables 1 and 2. At least three repeat tests were performed for each test condition. The sequence of testing for sustainable aviation fuels was from 25% to 50% to 100% of the same fuel in a given period, when fuel mixtures were being evaluated. Although the test rig employed for this work is not fully representative of an AFS (fuel tank capacity of 40L, limitations of rig design, and setup), at least it could maintain identical conditions from one test to the next.
Phase 1: initial set of test conditions cooling from $20^{\circ}\rm{C}$
to
$20^{\circ}\rm{C}$
to $18^{\circ}\rm{C}$

Temperature profile for flowing fuel.

Phase 2: influence of fuel composition and flow rate on cooling from $20^{\circ}\rm{C}$
to
$20^{\circ}\rm{C}$
to $18^{\circ}\rm{C}$

*As-supplied fuel to be tested as a baseline.
**Additional data to assess any trends between blend ratio and ice formation.
***To provide worst-case scenario (max difference in ice formation) for alternative fuels currently approved for use.
#Total aromatics content calculated from aromatics contributions of the two blended fuels.
To amplify ice formation based on the test rig conditions, the flow rate was varied to investigate the effect flow rate has on ice accumulation. The appropriate flow rate that produced measurable ice further testing was chosen based on the outcome of the initial test results. This was the primary objective of phase 1.
The primary objective of the phase 2 test campaign was to investigate the effect of fuel type on ice formation. It was also necessary to determine whether ice accumulation may cause a measurable pressure drop across a pump mesh when operating with SAF. Cooling rate, flow velocity and test section pipe surface were all kept constant during these tests after preliminary tests were completed.
The alternative fuels presented in Table 2 are not currently considered approved for aviation service unless blended with conventional jet fuel or conventional blending components. Aircraft engines are designed to burn only a narrow range of fuels; therefore, using fuels with characteristics that fall outside this range may detract from safety, efficiency, and/or operability. A strategy of blending such fuels with conventional Jet A-1 has been adopted by the aviation industry to ensure fuel properties such as density, volatility, and thermal stability are controlled and conform to detailed requirements. This is formalised in ASTM D7566, which controls the blending limits of these alternative fuels. It is therefore of interest to determine what effect the blending ratio has on ice formation.
3.0 Results
A total of 84 individual experiments were carried out to evaluate the effect of various fuel blends on the ice accretion process. The first set of experiments was conducted with Jet A-1, as received, without any water added. The subsequent results were the average of at least three individual experimental runs on a fuel or fuel blend, with a water concentration of approximately 260ppm. Difficulty was experienced with achieving identical system water concentrations across all tests, and sometimes an individual test exceeded ±50ppm.
The typical form of pressure measurements against temperature are given in Fig. 5. The system took approximately 4h to cool from ambient to −30°C. The plot in Fig. 5 shows that the pressure upstream of the conical mesh strainer was constant (Pressure_1) on cooling from ambient to −35°C, but a pressure drop downstream of the strainer was noticed as flow restriction occurred; pressure changes became apparent below: −12°C when testing unblended Jet A-1, and at slightly higher temperatures when testing other fuels or fuel blends. However, little impact was noticed on ΔP below approximately −23°C because the critical icing temperature has been achieved where most of the water present has formed ice and there will be little further restriction of flow. The scatter of ±1.5 psi observed in Fig. 5 is partly caused by the temporal resolution of the sensor picking up genuine turbulent fluctuations in flow pressure. It is, however, also caused by signal quantisation effects related to the resolution of the analogue-to-digital converter. Since it is the time-averaged pressure that is of principal interest, both of these effects were removed by applying a filter, as illustrated by the red line in Fig. 6.
Jet A-1 containing 260ppm water. Typical form of pressure measurement data, showing measurement scatter, for pressure across the strainer wrt temperature. Pressure_1 – upstream pressure; Pressure_2 – downstream pressure.

The red curve illustrates the best fit curve of the pressure difference.

The filtered results were fitted with the help of the sigmoid activation function using Numerical Python (NumPy). For this work, the generalised sigmoid function was given by:
 \begin{align}s\!\left( x \right) = \frac{a}{{b{\rm{\;}} + {\rm{\;}}\exp\!\left( {cx + {\rm{\;}}d} \right)}}\end{align}
Equation (1) was used for all comparative analyses. The filtered smoothed curve equations for the pressure drop data in individual experimental runs is given in Appendix 3.
3.1 Influence of stirring effect and bulk fuel flow velocity
Results from the experimental runs show that flow restriction due to ice formation increased in the range −6°C ≥ T ≥ −18°C. Since water content could not be controlled precisely, an investigation was undertaken to examine the effect of using or not using the stirrer within the fuel tank (Fig. 7(a)). In general, bulk fuel stirring led to the onset of strainer blockage at higher temperatures for all fuels tested.
Jet A-1 containing different total added water content. (a) ΔP against T with and without stirrer, N and NS respectively; (b) ΔP against T for Jet A-1 fuel at different at different flow velocities.

Figure 7(b) shows the effect of fuel velocity in the repeat fuel tests. Experiments were conducted at different flow velocities to assess their impact on ice accretion, before establishing the ideal test conditions for other test scenarios. In the report on the G-YMMM accident [21], AAIB suggested a flow velocity range between 0.2 and 0.6m/s when evaluating icing in aviation fuel test rigs. For this work, testing was conducted at two different flow velocities (0.4 and 0.6) that are representative of aircraft fuel flows in service. The results show that ice accumulation increases at a lower velocity of 0.4m/s and decreases at velocities above 0.6m/s; the possible reason for this is covered in the discussion section. A flow velocity of 0.4m/s was therefore adopted for the majority of the rig tests to represent more challenging conditions and help differentiate between the fuel types.
3.2 Influence of SAF blends
Figures in this section show a repeat set of experiments for the different fuel blends explored in this work. Repeatability was shown to exist with the pressure increase measurement curves shown in Figs 8, 9, 10 and 11, giving confidence in the data reported. Figure 8(a) and (b) show that higher total water content is more likely to create ice rapidly in comparison to lower water content. Comparing data from 100% Jet A-1% and 100% SPK, as illustrated in Fig. 8(b.1), it can be seen that the SPK exhibits a lower tendency towards strainer blocking. The photographs in Figs. 8(a.1) and (b.1) illustrate that the blocking potential of 100% Jet A-1 at 300ppm is higher in comparison to that of 100% SPK at 450ppm. Figure 8(a.1) shows fuel vapour bubbles forming because of flow restriction, which occurred as a result of pressure differential across the strainer. Vapour bubbles occur because flow restriction, due to strainer blockage, causes the local static pressure to fall below the fuel saturation vapour pressure, and vapour bubbles appear above the liquid. The vapour bubbles eventually collapse as the flow progresses downstream. This can be potentially detrimental to fuel flow as system efficiency has been impaired. In the SPK fuel test, ice was seen to be entrained in the fuel flow but, except for the highest water content, did not cause measurable increase in pressure drop across the strainer.
Sequential tests of ΔP against T for (a) 100% Jet A-1; (b) and 100% SPK. Mesh section during an icing experiment in: (a.1) 100% Jet A-1 fuel and (b.1) 100% SPK fuel.

Sequential tests of ΔP against T for (a) 100% HEFA; and (b) 100% ATJ. Mesh section after an icing experiment in: (a.1) 100% HEFA fuel and: (b.1) 100% ATJ fuel.

Comparative plots of ΔP against T for (a) 100% SAF and 100% Jet A-1; and (b) 25% SAF and 100% Jet A-1 (c) 50% SAF and 100% Jet A-1.

(a) Average ΔP at −6°C: SAF, SAF blends with Jet A-1 and Jet A-1 fuel; (b) average ΔP at −16°C: SAF and conventional Jet A-1 fuels.

Figure 9 shows data from 100% HEFA and 100% ATJ; it can be seen that the HEFA exhibits a higher blocking potential in comparison to ATJ fuel even though ice was seen through the viewing section, as illustrated in Fig. 9(b.1). Although ice was seen adhering to the mesh, it was not enough to cause significant flow restriction compared to the 100% HEFA and 100% Jet A-1 experimental runs.
Figure 10 shows ΔP against T data for all SAF plotted against Jet A-1 fuel in separate plots for 100%, 50% and 25% blends. The comparative plots in Fig. 10 show that some SAF blends explored appear to be less problematic from an icing point of view. In particular, ATJ shows less propensity to filter blocking with ice than the other fuels.
Appendix 1 compares blends of a particular fuel type with 100% Jet A-1 fuel. As shown, the ΔP of HEFA reduces on blending with Jet A-1 and increases on blending with SPK.
A bar chart (Fig. 11) helps to compare the ΔP measurements for the different fuels and blends. This chart reveals that all fuels behaved differently, with the blending ratio having a different impact on the ΔP at −6°C and −16°C, as the blending ratio had a different impact on the ΔP at −6°C and −16°C. For example, ΔP of HEFA shows a small but measurable increase in blocking tendency on blending with Jet A-1 at −6°C. However, the opposite occurs at −16°C Reducing temperature from −6°C to −16°C increases ΔP only a small amount for 100% SPK but causes a much larger increase in ΔP for 100% HEFA.
4.0 Discussion
Literature has established that the size of water droplets, temperature, water content and level of impurity are the predominant factors influencing the formation of ice in jet fuel. A cold fuel test rig has been developed that attempts to emulate the conditions that might lead to the nucleation of water and ice in an aircraft fuel system. The idea was for these conditions to simulate a worst-case icing scenario, and amplify the effect of ice formation, so that ice development could be measured and compared. A typical conventional jet fuel will dissolve around 40–70ppm water at 25°C. At this water concentration, ice crystals may start to be formed when the bulk fuel temperature drops below 0°C; however, under these conditions, the crystals will be small and hard to detect in an accelerated simulation test; they are unlikely to block a filter or strainer. For this reason, the water content for these tests was increased by about six times to 260ppm, to allow assessment of icing performance within a reasonable timeframe. Stirring of fuel in the bulk tank enhanced the strainer blocking effect as it helped to keep tiny ice crystals in suspension. This explains why a greater pressure differential was seen in Fig. 8(a) as the mesh collected more floating crystals that had been carried through from the tank to the pipe loop.
Jet fuels are mainly specified to meet certain physical characteristics, but it is known that subtle variations in chemical composition can affect the development and formation of ice in a cold fuel system. It is difficult to isolate the individual contributions from the many constituents in a fuel and, from a practical viewpoint, it is easier to test the overall effect of a new fuel and compare that with a well-characterised benchmark fuel. Apart from chemical composition, factors such as the total water content, distribution of water droplets, thermal gradients and degree of mixing/flow will all play a significant role in ice formation in a cold fuel icing simulation. The tests were designed to evaluate the icing differences between three sustainable aviation fuels and a conventional Jet A-1, and then examine blends of these sustainable fuels with Jet A-1. Other variables that the rig could evaluate included the rate of cooling, the amount of water addition, the effect of bulk fuel stirring and the effect of flow through external pipework. To simplify results evaluation, the cooling profile and nominal water addition were kept constant for all the main tests, and trials were carried out on the effects of bulk fuel stirring and velocity. It should be noted that the rig operates under quasi steady state conditions, which means that these results form an internally consistent data set but may not be able to predict exactly how and when ice will develop in a particular aircraft fuel system. Novel features of the rig design included a removable pipe section to evaluate the effect of surface finish on system icing under dynamic conditions and inline test points for fuel sampling by KF analysis.
Observations from the experiments showed that each of the fuels behaved differently after blending with conventional jet fuel. This could be because of the physical characteristics of the fuels or effects attributable to molecular structure. For instance, Jet A-1 exhibited the greatest potential for ice formation; this is possibly a consequence of its high aromatics content. Whilst the general rule is that oil and water do not mix, nonetheless kerosene fuels will absorb small amounts of water from the air, typically in the range 30–100ppm, until the mixture reaches an equilibrium value depending on the temperature and relative humidity; water uptake is greater at higher temperature and higher relative humidity. In general terms, the solubility of water in pure hydrocarbons tends to decrease slightly with increasing carbon number, but practical experience with commercial fuels has shown that total water content is greater in diesel than in kerosene, which is in turn greater than in gasoline [Reference Holladay, Abdullah and Heyne26] i.e. in this case there seems to be a positive correlation with carbon number and, indirectly, with fuel density. Several studies have emphasised that total aromatics content plays a role in water solubility [Reference Baena, Repetto, Lawson and Lam3, Reference Ugbeh Johnson, Carpenter, Williams, Pons and McLaren10, Reference Maloney, Diez and Rossmann18, Reference West, Yamada, Bruening, Cook, Mueller, Shafer, Dewitt and Zabarnick27–Reference Wu, Zong, Hu and Ma30] in jet fuels, since these species tend to hold about five to eight times more water than equivalent carbon number n-alkanes or iso-alkanes. However, this is probably not the whole answer since, of the three main hydrocarbon fuel groups, gasoline usually has the highest aromatics content, which implies that fuel density may be a more significant factor, particularly in relation to settling rates of tiny water droplets.
Detailed chemical analyses were not undertaken for the fuels used for these tests, but it is possible that water uptake and holdup was influenced by polar compounds in the fuel. Some of these materials can be naturally occurring and are passed through into finished fuel from the feedstock materials, but also may be a result of fuel ageing processes or may have been introduced through inadvertent contamination.
In the SPK fuel test (result illustrated by Fig. 8(b)), the reason ice could be seen floating around the system without causing any flow restriction could partly be attributed to its low aromatics content. This result is similar to results from previous work conducted by Ugbeh et al. assessing the water settling characteristics in SAF [Reference Ugbeh, Carpenter and Pons31]. Observations from this study showed that the fully synthetic fuels analysed (SPK and GTL S-8) exhibited the highest water settling rates; these fuels were less dense and consequently yielded higher theoretical terminal velocities for water droplet settling based on Stokes’ law. This implies that the SPK does not hold up water and has a strong tendency to shed water quickly. Variations noted in Fig. 10 could be attributed to the fact that the quantity of water dissolved in jet fuels is dependent on the hydrocarbon composition of that fuel. Other contributing factors could be related to molecular polarity, natural surfactants (that may exist in Jet A-1 fuel) and trace hetero-atomic species (sulphur, oxygen, nitrogen). It has not been possible to identify which was the most dominant effect leading to ice formation in these tests, but aromatics content and fuel density are believed to be the two leading causes.
On the question of bulk fuel velocity in the external pipework, results shown in Fig. 7(b) suggest that, at higher flow rates, the soft ice that develops from micron-sized water droplets in cold fuel is being squeezed through the strainer mesh, so that blockage is less likely to occur. A flow velocity of 0.4m/s was adopted for the majority of tests, to minimise circulation of small ice crystals and also to avoid ice scrubbing/shedding as a result of high velocity.
The peak differential measurements for all fuel types and blends explored is shown in Table 3. The peak ΔP for HEFA was noted to reduce with the addition of Jet A-1 reaching a minimum within these tests at a mixture with 75% Jet A-1, whilst the peak ΔP of SPK increased with the addition of Jet A-1. The reason for this may be as a result of the increased aromatics content for the blended SPK fuel; however, it is unclear why a decrease in ΔP was observed for the middling HEFA mixtures.
Peak ΔP measurements for all fuel types explored for this work

ATJ data were not included in Table 3 because the tests were conducted with a faulty flow sensor; however, it is unclear why anomalies were noticed and repeat experiments will be needed for data validation. For instance, Fig. 9(b.1) shows significant ice accumulation on the mesh for the synthetic bio-derived fuel (ATJ) test compared to that of HEFA seen in Fig. 9(a.1). However, HEFA exhibited a higher ΔP than ATJ as seen in Fig. 10(a) and (b), respectively. From this observation, it is suggested that finer dissolved water droplets might have formed, yielding reduced ice accumulation as there was easier ice passage through the mesh.
Finally, 100% Jet A-1 has the highest ΔP compared to all other fuels as discussed earlier. Therefore, it is suggested, based on observations from this study, that SAF blends will pose less of a safety issue from an icing point of view.
5.0 Conclusions and recommendations
A cold fuel test rig was designed to simulate a small-scale aircraft fuel system in service. Ice accretion was characterised by measuring the pressure differential across a conical mesh for the different SAF blends investigated for this study.
For this work, it was observed that the rate at which ice crystallisation occurs strongly depends on the temperature and type of fuel/fuel blend employed. Results for the fuel combinations tested revealed that 100% conventional fuel, Jet A-1, exhibited the greatest potential for ice formation and fuel system blockage whilst 100% SPK exhibited the lowest risk in this respect. Furthermore, analysis showed that pressure differential measurements for HEFA reduced on blending with 75% Jet A-1 whilst the pressure differential measurement of SPK increased after blending with Jet A-1. Thus was attributed to the increased aromatics content for the blended SPK fuel mixture.
Experimental results from this work will help the aerospace industry predict the temperature ice will potentially lead to blockage for a particular fuel type and to understand the ice accretion process in fuel systems containing SAF. Recommendations for future work include investigating the role surfaces and flow rate play on the accretion and release of ice in different SAF blends.
Funding sources and acknowledgment
This work was funded by EPSRC-UKRI (Reference ID: EP/N509127/1) and Airbus Operations, Filton, Bristol, United Kingdom (Reference ID: 1100152106). The authors wish to express gratitude to the entire Airbus Operations team for assisting in building and commissioning the rig and providing access to their test area and equipment.
The authors also acknowledge and extend recognition to Engr. Ime Johnson, Dr Colleen Williams, Dr Mike Williams, Dr Nonso Evaristus Okeke, Dr Wale Gabriel, Dr Alozie Ogechukwu, Dan Mclaren, Solange Baena, Dave Pace, Michael O’Meara, Steve Withers, Moreton Sandford, Adam Coles, Toby Wells, James Barnes and Felix Gray for their expertise and relentless support throughout this work.
Data Availabilty Statement
The data that support the findings of this study are openly available in Cranfield Online Research Data (CORD) repository at https://doi.org/10.17862/cranfield.rd.21954371.
Appendix 1
It can be seen from Fig. A2 that the ΔP of HEFA reduces on blending with Jet A-1 and increases on blending with SPK.
Comparative analysis: Separate plots of SPK blends, HEFA blends and ATJ blends with 100% Jet A-1.

Appendix 2. Repeat test for SAF blends
Repeat tests for SAF blends explored.

Raw data plots for ATJ 25% blend.

Appendix 3. Fitted curve formulae for individual experimental runs


 Open access