Preface
The following set of papers describe in detail the science goals of the future Space Infrared telescope for Cosmology and Astrophysics (SPICA). The SPICA satellite will employ a 2.5-m telescope, actively cooled to around 6 K, and a suite of mid- to far-IR spectrometers and photometric cameras, equipped with state of the art detectors. In particular, the SPICA Far Infrared Instrument (SAFARI) will be a grating spectrograph with low (R = 300) and medium/high (R ≃ 3000–11000) resolution observing modes instantaneously covering the 35–230 μm wavelength range. The SPICA Mid-Infrared Instrument (SMI) will have three operating modes: a large field of view (12′ × 10′) low-resolution 17–36 μm spectroscopic (R ~ 50–120) and photometric camera at 34 μm, a medium resolution (R ≃ 2000) grating spectrometer covering wavelengths of 17–36 μm and a high-resolution echelle module (R ≃ 28000) for the 12–18 μm domain. A large field of view (80″ × 80″), three channel (110, 220, and 350 μm) polarimetric camera will also be part of the instrument complement. These articles will focus on some of the major scientific questions the SPICA mission aims to address, more details about the mission and instruments can be found in Roelfsema et al. (Reference Roelfsema2017).
1 INTRODUCTION
Over the past three decades, we have learned that at least half of the energy ever emitted by stars and accreting black holes in galaxies is absorbed by dust, and re-radiated in the infrared (e.g., Hauser & Dwek Reference Hauser and Dwek2001; Lagache, Puget, & Dole Reference Lagache, Puget and Dole2005; Franceschini, Rodighiero, & Vaccari Reference Franceschini, Rodighiero and Vaccari2008). We now know that the peak in the growth of galaxies occurs at redshifts of z ~ 1–3 (Lilly et al. Reference Lilly, Le Fevre, Hammer and Crampton1996; Franceschini et al. Reference Franceschini, Hasinger, Miyaji and Malquori1999; Madau & Dickinson Reference Madau and Dickinson2014; Rowan-Robinson et al. Reference Rowan-Robinson2016), when the Universe was roughly 3 Gyr old—a result achieved primarily through deep and wide-field observations with previous IR space observatories, namely the IR Astronomical Satellite (IRAS, Neugebauer et al. Reference Neugebauer1984), the IR Space Observatory (ISO, Kessler et al. Reference Kessler1996), Spitzer (Werner et al. Reference Werner2004), AKARI (Murakami et al. Reference Murakami2007), Herschel (Pilbratt et al. Reference Pilbratt2010), and the Wide-field IR Survey Explorer (WISE, Wright et al. Reference Wright2010). Despite their successes, these observatories had either small cold telescopes, or large, warm mirrors, ultimately limiting their ability to probe the physics, through spectroscopy and deep photometry, of the faintest and most distant obscured sources in our Universe.
Due to the progress in detector performance and cryogenic cooling technologies, great advances in our ability to study the hidden, dusty Universe can be made through observations in the thermal infrared. The SPace IR telescope for Cosmology and Astrophysics (SPICA, Swinyard et al. Reference Swinyard2009; Nakagawa et al. Reference Nakagawa, Shibai, Onaka, Matsuhara, Kaneda, Kawakatsu and Roelfsema2014) will achieve a gain of nearly two orders of magnitude in spectroscopic sensitivity in the mid/far-IR compared to Herschel and Spitzer. SPICA will provide access to wavelengths well beyond those reachable with the James Webb Space Telescope (JWST, Gardner et al. Reference Gardner2006) and the new generation of extremely large telescopes (ELTs), and at wavelengths shortward of those accessible by the Atacama Large Millimeter/Submillimeter Array (ALMA, Wootten & Thompson Reference Wootten and Thompson2009). It will enable the discovery and detailed study of normal galaxies across their key phases of evolution, as well as probing the earliest forming galaxies and supermassive black holes (SMBHs).
A description of the SPICA mission was originally presented in Swinyard et al. (Reference Swinyard2009) and recent updates can be found in Nakagawa et al. (Reference Nakagawa, Shibai, Onaka, Matsuhara, Kaneda, Kawakatsu and Roelfsema2014), Sibthorpe et al. (Reference Sibthorpe, Helmich, Roelfsema, Kaneda, Shibai, Simon, Schaaf and Stutzki2016), and in Roelfsema et al. (Reference Roelfsema2017). The two primary instruments sharing the focal plane are the SPICA Far-IR Instrument (SAFARI) and the SPICA Mid-IR Instrument (SMI): a description of the SAFARI instrument can be found in Roelfsema et al. (Reference Roelfsema2017) and its optical system architecture and design concept is given in Pastor et al. (Reference Kaneda and MacEwen2016), while a description of the SMI instrument can be found in Kaneda et al. (Reference Kaneda and MacEwen2016) and in Roelfsema et al. (Reference Roelfsema2017).
This article describes how SPICA will be able to address the study of galaxy formation and evolution, while a companion article focuses on the studies of the ISM in nearby galaxies (van der Tak et al. Reference van der Tak2017). It is organised as follows. Section 2 introduces the current knowledge that has been accumulated so far in studying galaxy evolution and identifies a number of open questions that can be addressed and answered with high sensitivity IR spectroscopic and photometric observations. We show in Section 3 how IR spectroscopy is able to separate the two main energy production mechanisms of star formation and black hole accretion driving galaxy evolution up to redshift of z = 3–4. Finally, Section 4 illustrates the synergies of the SPICA observations with current and future facilities at other frequencies and Section 5 gives the conclusions.
2 THE RISE AND FALL OF GALAXY FORMATION
The bulk of star formation and SMBH accretion in galaxies appears to have taken place more than six billion years ago, dropping sharply towards the present epoch (e.g., Madau & Dickinson Reference Madau and Dickinson2014, and references therein, see Figure 1). The Madau and Dickinson compilation indicates that most of the UV/optical photons, arising from hot young stars characteristic of the active star-forming areas that combine to make star-forming galaxies, have been absorbed by dust and re-radiated. Thus, as a general condition, rest-frame ultraviolet (UV) and optical observations do not access these crucial regions where gas forms massive stars and vice versa. Moreover, since around half of the energy emitted by stars and accreting SMBH is absorbed and re-emitted by dust (e.g., Hauser & Dwek Reference Hauser and Dwek2001), understanding the physics of galaxy evolution requires IR observations of large, unbiased samples of galaxies spanning a wide range in luminosity, redshift, environment, and nuclear activity. From Spitzer and Herschel photometric surveys, the star-formation rate (SFR) and black-hole accretion rate (BHAR) density functions have been estimated through the bolometric luminosities of galaxies (Le Floc’h et al. Reference Le Floc’h2005; Gruppioni et al. Reference Gruppioni2013; Delvecchio et al. Reference Delvecchio2014). However, these estimates should be treated with caution, because they are typically based on observations of only a few, broad IR bands (see, e.g., Pérez-González et al. Reference Pérez-González2005), making the IR luminosities and the relative contribution of star formation and SMBH accretion, highly uncertain. This crucial separation has been attempted so far through modelling of the spectral energy distributions (SEDs) (see, e.g., Mullaney et al. Reference Mullaney, Alexander, Goulding and Hickox2011) and relies on model-dependent assumptions and local templates, with large uncertainties and degeneracies. Indeed, Spitzer- and Herschel-based studies have been successful in estimating counts and evolving galaxy luminosity functions (Le Floc’h et al. Reference Le Floc’h2005; Pérez-González et al. Reference Pérez-González2005; Oliver et al. Reference Oliver2012; Magnelli et al. Reference Magnelli2013; Lapi et al. Reference Lapi2011), but only through statistical techniques applied to bulk galaxy population as a function of redshift.
Estimated star-formation rate densities from the far-ultraviolet (blue points) and far-IR (red points) photometric surveys (adapted from Madau & Dickinson Reference Madau and Dickinson2014). The estimated BHAR density, scaled up by a factor of 3 300, is shown for comparison (in green shading from X-rays and light blue from the IR). For redshifts above z = 2, very little IR data on the SFR density exist, making its determination rather poor. The redshift ranges probed with SPICA spectroscopy (up to z ~ 4) and photometry (up to z ~ 6) are also shown.
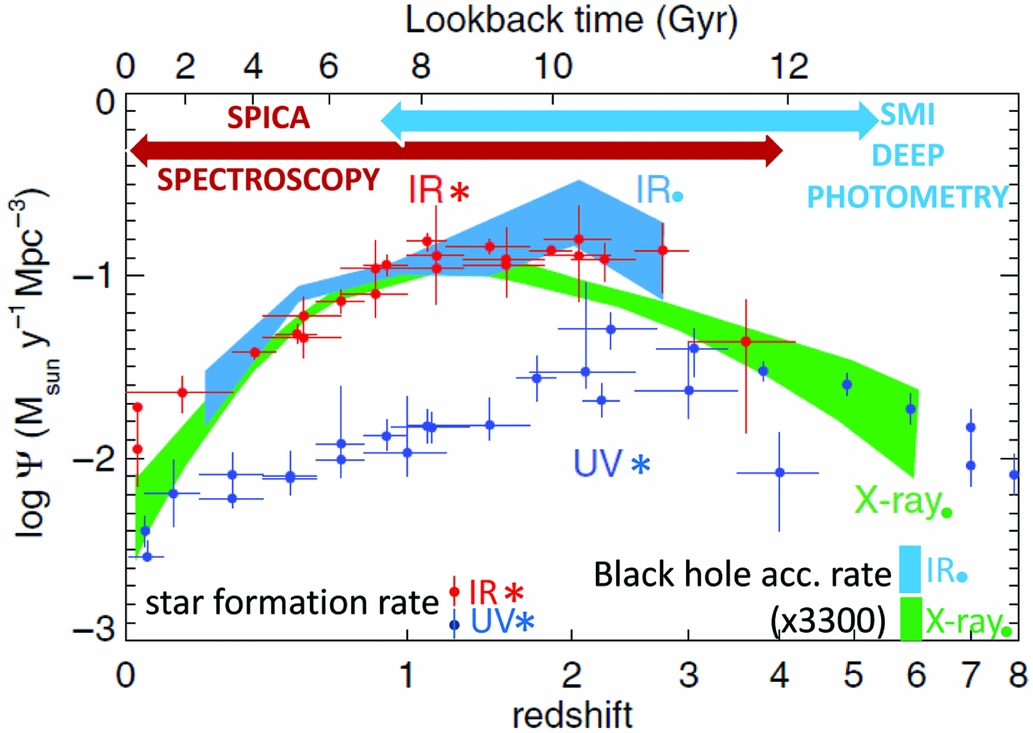
Determinations of the SFR from UV (e.g., Bouwens et al. Reference Bouwens, Illingworth, Franx and Ford2007) and optical spectroscopy (e.g., from the Sloan Digital Sky Survey, Eisenstein et al. Reference Eisenstein2011) are based on measurements of only around 10% of the total integrated light, which escapes the dust absorption. These must therefore be corrected upwards by large, uncertain extinction factors (Figure 1). X-ray analyses of the BHAR, similarly, are prone to large uncertainties, because deriving the bolometric luminosity from the X-ray luminosity depends on uncertain bolometric corrections (e.g., Vasudevan & Fabian Reference Vasudevan and Fabian2009) and on estimates of the Compton-thick population contribution (Frontera et al. Reference Frontera2007; Treister, Urry, & Virani Reference Treister, Urry and Virani2009).
IR emission line spectra can be used to physically separate through spectroscopy (see, e.g., Spinoglio & Malkan Reference Spinoglio and Malkan1992) these contributions to the total integrated light on a galaxy-by-galaxy basis, directly measure redshifts, SFRs, BHARs, metallicities, and physical properties of gas and dust in galaxies. With SPICA, we will be able to do this for lookback times up to about 12 Gyrs.
With its large, cold telescope, and powerful instruments, SPICA will peer into the dust-enshrouded phases of galaxy formation and evolution, revealing the physical, dynamical, and chemical states of the gas and dust. With such a unique power, SPICA will probe the histories of SFRs and BHARs through cosmic time and how these processes drive galaxy evolution. It will provide detailed answers to the following questions:
-
(1) How does accretion and feedback from star formation and AGN shape galaxy evolution? (see section 2.1)
-
(2) How are metals and dust produced and destroyed in galaxies? What is the metallicity evolution in galaxies as a function of redshift? (see section 2.2)
-
(3) How and when do early black holes and starburst appear close to the epoch of re-ionisation? (see section 2.3)
-
(4) How did primordial gas clouds collapse into the first galaxies and black holes? (see section 2.4)
In the following four sections, we briefly address each of the first four questions, reserving detailed analysis of the role of SPICA in answering these to four companion articles: (i) the role of AGN feeding and AGN feedback in galaxy evolution (González-Alfonso et al. Reference González-Alfonso2017b); (ii) the chemical evolution of galaxies and the rise of metals and dust (Fernández-Ontiveros, et al. Reference Fernández-Ontiveros2017); (iii) dust obscured star formation and accretion histories from re-ionisation using SPICA unbiased photometric (Gruppioni et al. Reference Gruppioni2017) and low spectral resolution spectroscopic surveys (Kaneda et al. Reference Kaneda2017); (iv) the first stars and galaxies (Egami et al. in preparation). We will detail in Section 3 the power of using the many IR fine structure lines which fall in the wavelength range of the SPICA instrument for distant AGN and starbursts up to a redshift of z = 4.
2.1. AGN feeding and feedback in the context of galaxy evolution
The correlations between SMBH masses and their host galaxy properties (Magorrian et al. Reference Magorrian1998; Ferrarese & Merritt Reference Ferrarese and Merritt2000; Gebhardt et al. Reference Gebhardt2000), and the bimodality of the colour distribution of local galaxies (e.g., Strateva et al. Reference Strateva2001; Baldry et al. Reference Baldry, Glazebrook, Brinkmann, Ivezić, Lupton, Nichol and Szalay2004; Wyder et al. Reference Wyder2007), suggest that the growth of BH and stellar mass are related throughout the lifetime of a galaxy. In other words, feedback between SMBH and galactic star formation may be in part responsible for the M BH–σ relationship seen in the local Universe (e.g., Silk & Rees Reference Silk and Rees1998; Di Matteo, Springel, & Hernquist Reference Di Matteo, Springel and Hernquist2005; Springel, Di Matteo, & Hernquist Reference Springel, Matteo and Hernquist2005). It is precisely this feedback on the dense, circum-nuclear ISM that we can study with SPICA in the far-IR.
Herschel spectroscopic observations of far-IR OH lines (Fischer et al. Reference Fischer2010; Sturm et al. Reference Sturm2011; González-Alfonso, et al. Reference González-Alfonso2014, Reference González-Alfonso2017a) have shown that fast, molecular outflows are common among AGN-powered local ULIRGs. SPICA spectroscopy will allow us to search for these outflows well beyond the nearest galaxies, reaching up to z = 1–2, and therefore providing an estimate of the impact of AGN-driven feedback at the peak epoch of star formation. With the SAFARI instrument on SPICA, we will be able to detect the spectral signatures of outflowing dense molecular gas (through P-Cygni profiles on the OH 79 and 119 μm lines and blue-shifted high velocity wings in the OH 65 μm line) in ULIRGs like Mrk 231 out to z = 1.5 in a few hours of integration. This will enable surveys of hundreds of galaxies at these redshifts, providing a measure of the demographics of molecular feedback in IR-luminous galaxies at the peak of the SFR density.
Far-IR spectroscopy can also provide direct evidence for the feeding of the SMBHs and central starbursts. Inflowing gas can be identified through inverse P-Cygni profiles or redshifted absorption wings of OH and [OI]63 μm, as shown by Herschel (González-Alfonso, et al. Reference González-Alfonso2012; Falstad et al. Reference Falstad2015). SPICA will therefore be able to measure the dynamics of the molecular gas in and around the nuclei of rapidly evolving, dusty galaxies and study both AGN accretion and energetic feedback in significant samples of dusty galaxies over the past 10 Gyr. For a more detailed discussion of the capabilities of SPICA to detect galaxy feedback, see the companion paper by González-Alfonso et al. (Reference González-Alfonso2017b).
2.2. The rise of metals and dust
Galactic evolution is intimately tied to the production of metals and dust. Elements heavier than He (i.e., ‘metals’) play a major role in gas cooling and, as a consequence, they are critical in determining the conditions of cloud collapse and ultimately of star and planet formation. The metallicity in galaxies is determined by the cumulative effects of star formation, outflows, accretion, and the radial redistribution of matter. Traditional metallicity diagnostics, based on optical lines, are biased towards dust-free regions, yielding metallicities significantly lower than those inferred from the dust mass or IR lines (e.g., Pereira-Santaella, Rigopoulou, Farrah, Lebouteiller, & Li Reference Pereira-Santaella, Rigopoulou, Farrah, Lebouteiller and Li2017; Santini et al. Reference Santini2010; Croxall et al. Reference Croxall2013). Furthermore, temperature variations within galaxies, which can strongly influence optically derived abundances, have little effect on IR-derived values, which are determined from lines lying close to the ground state (Bernard Salas et al. Reference Salas, Pottasch, Beintema and Wesselius2001). IR fine-structure lines observed with SPICA provide extinction-free measurements of the metallicity of galaxies, nearly independent of ionisation, density, and temperature out to redshift z ~ 3. Moreover, SPICA can detect mid-IR Hydrogen recombination lines in galaxies at intermediate redshifts (z ~ 1.5–2), which, together with the forbidden lines, allow for direct determination of the Ne, S, N, O, and Fe abundances.
Dust also plays a critical role in heating and cooling the ISM in galaxies. It forms in the dense, enriched atmospheres of evolved stars, novae, supernovae, and dense molecular clouds (Valiante et al. Reference Valiante, Schneider, Bianchi and Andersen2009; Zhukovska & Henning Reference Zhukovska and Henning2013; Marassi et al. Reference Marassi, Schneider, Limongi, Chieffi, Bocchio and Bianchi2015; Bocchio et al. Reference Bocchio, Marassi, Schneider, Bianchi, Limongi and Chieffi2016) and is destroyed by shocks, sputtering, and intense radiation fields. However, its dominant formation and destruction channels in different environments are poorly understood (Kemper Reference Kemper2015; Matsuura et al. Reference Matsuura2011; Micelotta et al. Reference Micelotta, Dwek and Slavin2016). IR spectroscopy can uniquely measure the dust mass produced by evolved stars and supernovae in nearby galaxies, allowing a detailed study of the dust mineralogy and composition, via the mid-IR SiO2 , FeO, FeS, and crystalline silicate features (see e.g., Spoon et al. Reference Spoon2006; Rho et al. Reference Rho2008). SPICA will trace the abundance and evolution of the dust components within galaxies, constraining the local conditions, such as ioniszation, radiation field, dust structures, and overall dust-to-gas ratios, giving us clues to the chemical evolution of galaxies (Sandstrom et al. Reference Sandstrom2012; Rémy-Ruyer et al. Reference Rémy-Ruyer2014). For the details of these investigations and the assessment of the SPICA observations, we refer to the companion papers by van der Tak et al. (Reference van der Tak2017) and Fernández-Ontiveros et al. (Reference Fernández-Ontiveros2017), for local and distant galaxies, respectively.
2.3. Towards the epoch of re-ionisation: early black holes and starbursts
The deepest cosmological surveys with Herschel (e.g., Oliver et al. Reference Oliver2012; Gruppioni et al. Reference Gruppioni2013; Magnelli et al. Reference Magnelli2013; Lutz Reference Lutz2014) mapped out the SFR density to z ~ 3 for the first time, but detected only small numbers of the most luminous (L ≳ 1012L⊙) star-forming galaxies at z > 3. High redshift (z > 6) quasars have been detected, containing black holes as massive as 1010M⊙ (Wu et al. Reference Wu2015; Jun et al. Reference Jun2015), but their origin, demographics, and role in re-ionisation are still unclear. Deep SPICA/SMI photometric surveys will extend the study of the BHAR and SFR density well beyond z ~ 3, detecting, in the 34 μm observed wavelength, the hot dust around high-redshift QSOs, as well as starburst-dominated galaxies at redshifts out to z ~ 6. Due to its large field of view of 10 arcmin × 12 arcmin, SMI will map large sky areas to the confusion limit (around 5 μJy) in relatively short times, with an effective surveying speed hundred times faster than JWST.Footnote 1 Deep and wide photometric surveys with SPICA will allow us to study the build-up of the progenitors of the elliptical galaxies dominating local galaxy clusters, and thus to probe environmental-dependent evolution (e.g., Dannerbauer et al. Reference Dannerbauer2014; Clements et al. Reference Clements2016). For a more detailed description of potential photometric surveys with SPICA, and their role in extending our knowledge of the population of IR-bright galaxies at z > 3, we refer to the companion paper by Gruppioni et al. (Reference Gruppioni2017).
2.4. The first stars and galaxies
Through chemical enrichment and the production of dust, the earliest stars imprint their signature on the ISM of high-redshift galaxies. The first generation of quiescent, self-gravitating primordial, or metal-poor gas clouds may be too faint to be detected directly with SPICA (e.g., Mizusawa, Omukai, & Nishi Reference Mizusawa, Omukai and Nishi2005; Santoro & Shull Reference Santoro and Shull2006; Gong, Cooray, & Santos Reference Gong, Cooray and Santos2013). However, during the hierarchical structure formation process, both the merging of primordial clouds and feedback due to supernovae and stellar winds can produce pockets of shock-heated gas. It is postulated that molecular clouds can be efficiently formed in the cooling gas behind these shocks (Ferrara Reference Ferrara1998; Ciardi & Ferrara Reference Ciardi and Ferrara2001). If these H2 clouds are warm and massive enough, (e.g., 1010 M⊙ of T = 200 K gas and 108 M⊙ of T = 1000 K gas), they are detectable in their shock-excited H2 line emission with SAFARI. Such systems of warm massive H2 gas reservoirs are already known at lower redshift (Egami et al. Reference Egami, Rieke, Fadda and Hines2006; Ogle et al. Reference Ogle, Davies, Appleton, Bertincourt and Helou2012), but can be detected by SPICA out to z ~ 10.
The ultimate challenge for SPICA will be to catch a glimpse of the first (i.e., Pop III) galaxies. Theoretical models predict that Pop III star clusters should produce a large amount of dust quickly, as massive pair instability supernovae (PISNe) explode (e.g., Schneider, Ferrara, & Salvaterra Reference Schneider, Ferrara and Salvaterra2004). When the dust is released and heated by hot, main sequence Pop III stars, the resultant mid-IR spectra exhibit strong quartz (SiO 2 ) emission features (Schneider et al. in preparation), which SPICA may detect. This will give a rare glimpse into the dust-production mechanism of Pop III stars and provide strong constraints for their evolutionary models. For a detailed discussion of the potential for SPICA to detect the cooling signatures of young, luminous galaxies at high redshift, see the companion paper by Egami et al. (in preparation).
3 INFRARED SPECTROSCOPIC PROBES OF STAR FORMATION AND BLACK HOLE ACCRETION
To understand galaxy evolution, we need to measure the rate at which stars form and black holes accrete matter as a function of time. The apparently similar shapes of the histories of star formation and black hole accretion with redshift (see Figure 1), the fact that most AGN also display enhanced star formation, along with the black hole-stellar mass correlation seen in the local Universe (Magorrian et al. Reference Magorrian1998; Ferrarese & Merritt Reference Ferrarese and Merritt2000; Gebhardt et al. Reference Gebhardt2000), all suggest that the two processes are physically linked.
The mid- to far-IR spectral range includes a suite of atomic and molecular lines and features, covering a wide range of physical conditions (excitation, density, ionisation, radiation field, metallicity, and dust composition) in galaxies (Figure 2, and Spinoglio & Malkan Reference Spinoglio and Malkan1992). Table 1 lists the set of atomic and ionic fine structure lines that will be covered by the SMI and SAFARI spectrometers onboard SPICA, for the top nine most abundant elements in the universe after H and He (the so-called ‘metals’). These lines reveal the detailed physics in the various phases of the interstellar medium (ISM), from H ii and photo-dissociation regions (PDR), to the narrow line regions excited by AGN. In the highly opaque, dust obscured ISM of actively star-forming galaxies and AGN, the IR lines are among the few probes of the physical conditions in the gas and dust clouds surrounding the SMBH or young, hot stars.
Critical densities for collisional de-excitation versus the ionisation potential of the IR fine-structure lines (adapted from Spinoglio & Malkan Reference Spinoglio and Malkan1992).
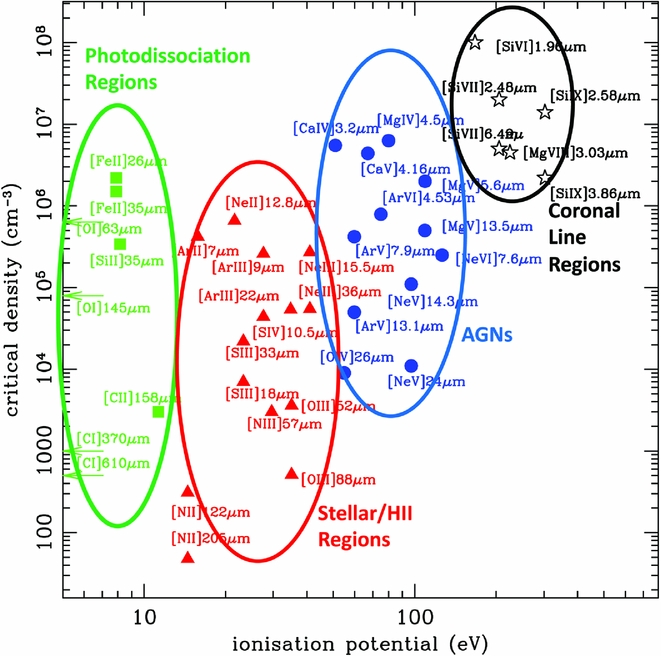
For the top nine most abundant metals in the universe, this table gives the fine-structure lines that will be observed by SPICA in the redshift range 0 < z < 4. I.P. denotes the ionisation potential of each transition. Solar abundances (written as log X/H + 12, from Grevesse, et al. Reference Grevesse, Asplund, Sauval and Scott2010) and critical densities for collisional de-excitation have been taken from Tielens & Hollenbach (Reference Tielens and Hollenbach1985), Genzel (Reference Genzel, Burton, Elmegreen and Genzel1992), and Greenhouse et al. (Reference Greenhouse, Feldman, Smith, Klapisch, Bhatia and Bar-Shalom1993).
The neutral gas surrounding star-forming regions can be traced using the temperature sensitive [O i] lines at 63 and 145 μm, while the ionised gas can be studied using many different tracers to measure temperature, density, and abundances. The [N ii]122/205 μm, [O iii]52/88 μm, [S iii]18.7/33.5 μm, and [Ne iii]15.6/36.0 μm line ratios are individually sensitive to the density; since the electron temperatures are generally higher than the excitation states of the lines connecting these line ratios, they are not sensitive to the temperature.
The strength and hardness of the radiation field can be derived from line pairs of the same element in different ionisation states and here again the SPICA wavelength range is ideal. Examples are the [N iii]57 μm to [N ii]122 or 205 μm ratio, the [Ne iii]15.6 μm to [Ne ii]12.8 μm ratio and the [O iv]26 μm to [O iii]52 or 88 μm ratio. The ratio of the [O iii] to [N iii] lines can be used to derive relative abundances of O and N, two key elements in the gas chemistry (see Fernández-Ontiveros, et al. Reference Fernández-Ontiveros2017). Other strong lines, such as [Si ii]34.8 μm or [C ii]158 μm, probe the interface between the neutral and ionised gas.
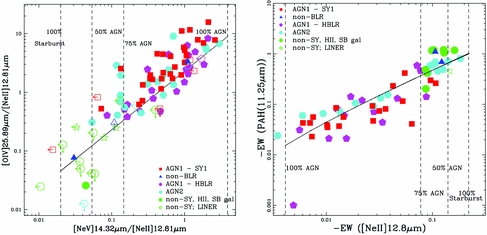
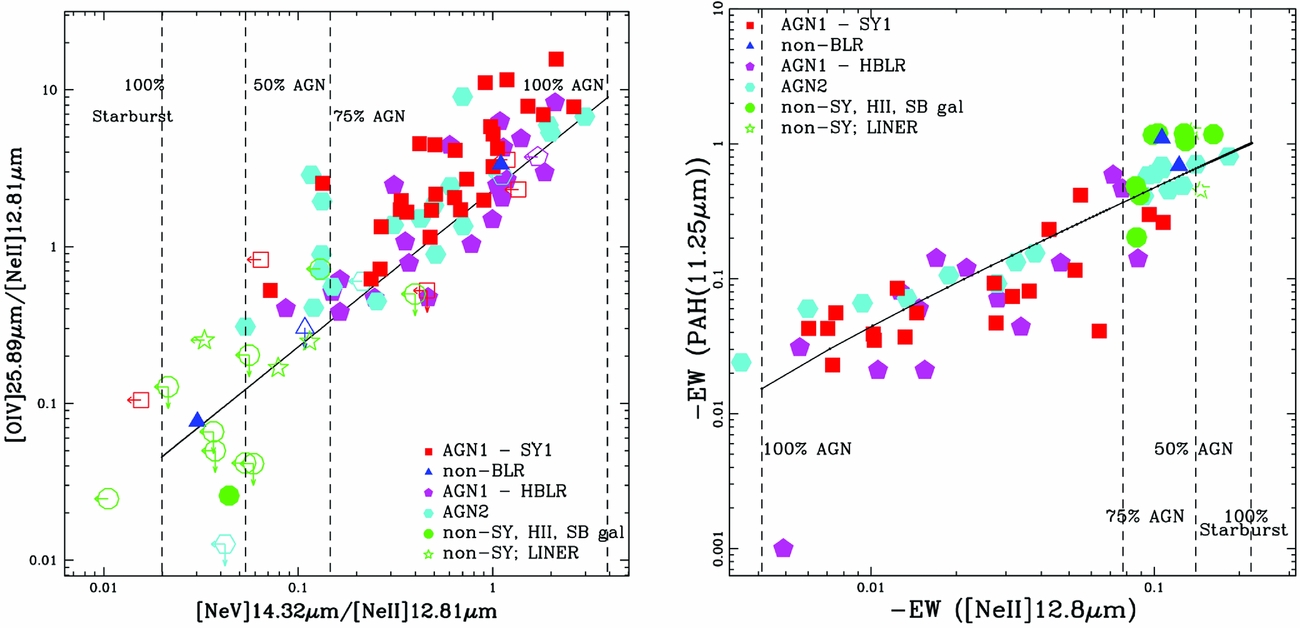
The SFR can be obtained via low-ionisation lines (e.g., [Ne ii]12.8 μm, [Ne iii]15.5 μm, [S iii]18.7 μm), while the AGN accretion rate can be measured via high-ionisation lines (e.g., [O iv]25.9 μm, [Ne v]14.3 and 24.3 μm). To disentangle emission from an AGN and that of star formation (Spinoglio et al. Reference Spinoglio, Malkan, Smith, González-Alfonso and Fischer2005; Armus et al. Reference Armus2006; Ho & Keto Reference Ho and Keto2007; Schweitzer et al. Reference Schweitzer2008; Alonso-Herrero et al. Reference Alonso-Herrero, Pereira-Santaella, Rieke and Rigopoulou2012; Stierwalt et al. Reference Stierwalt2014; Spinoglio et al. Reference Spinoglio, Pereira-Santaella, Dasyra, Calzoletti, Malkan, Tommasin and Busquet2015; Fernández-Ontiveros et al. Reference Fernández-Ontiveros, Spinoglio, Pereira-Santaella, Malkan, Andreani and Dasyra2016), studies have exploited fine-structure lines and the characterisation of the broad emission features arising from polycyclic aromatic hydrocarbons (PAHs) and the mid-IR thermal dust continuum (Genzel et al. Reference Genzel1998; Armus et al. Reference Armus2007; Farrah et al. Reference Farrah2007; Spoon et al. Reference Spoon, Marshall, Houck, Elitzur, Hao, Armus, Brandl and Charmandaris2007; Lutz et al. Reference Lutz2008; Tommasin et al. Reference Tommasin, Spinoglio, Malkan, Smith, González-Alfonso and Charmandaris2008; Veilleux, Rupke, & Swaters Reference Veilleux, Rupke and Swaters2009; Tommasin et al. Reference Tommasin, Spinoglio, Malkan and Fazio2010; Petric et al. Reference Petric2011). In Figure 3, we show the line ratios of [O iv]25.9 μm/[Ne ii]12.8 μm versus [Ne v]14.3 μm/[Ne ii]12.8 μm, for a sample of local active galaxies. Both these ratios measure the strength of the AGN. We also show the equivalent width of the PAH emission feature at 11.25 μm, as a function of the equivalent width of [Ne ii]12.8 μm, which measure the strength of the starburst component in galaxies (Tommasin et al. Reference Tommasin, Spinoglio, Malkan and Fazio2010).
Left panel: [Ne v]14.3 μm/[Ne ii]12.8 μm line ratio versus [O iv]25.9 μm/[Ne ii]12.8 μm line ratio. Both axes correlate with the strength of the AGN. The black line shows the behaviour of the analytical model (Tommasin et al. Reference Tommasin, Spinoglio, Malkan and Fazio2010). Right panel: [Ne ii]12.8 μm equivalent width versus PAH 11.25 μm equivalent width. Both quantities in this plot correlate with the strength of the star-formation component in each galaxy. The black line shows the behaviour of the analytical model (Tommasin et al. Reference Tommasin, Spinoglio, Malkan and Fazio2010).
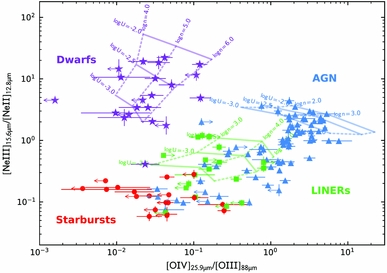
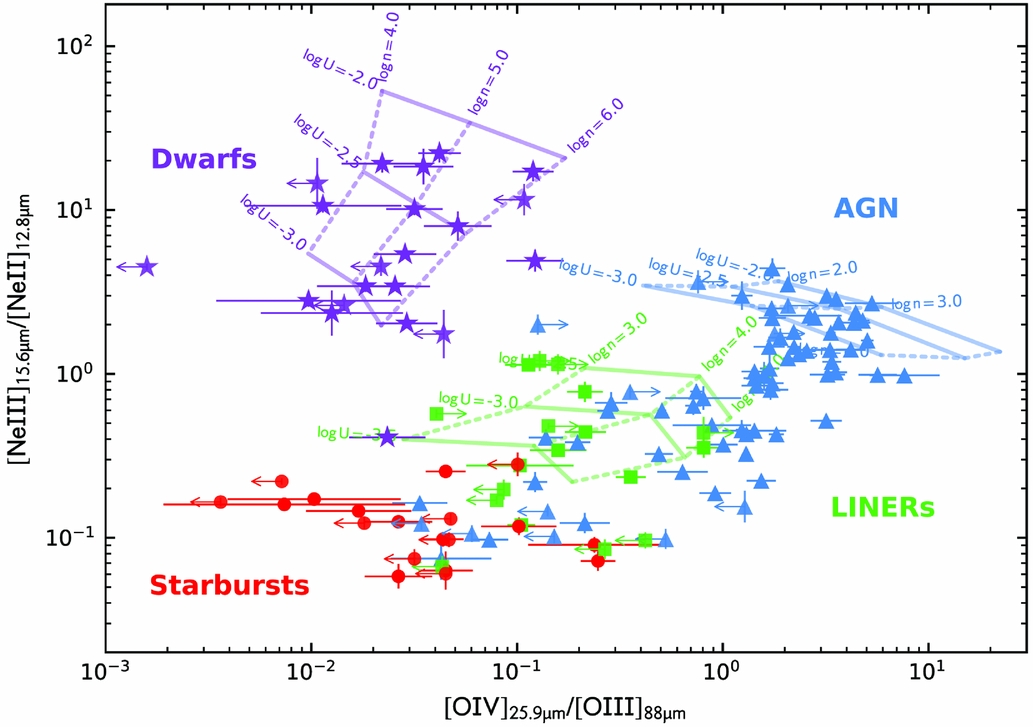
Where Spitzer and Herschel detected only the brightest galaxies at redshifts z > 0.5 (Valiante et al. Reference Valiante, Lutz, Sturm, Genzel, Tacconi, Lehnert and Baker2007; Pope et al. Reference Pope2008; Menéndez-Delmestre et al. Reference Menéndez-Delmestre2009; Sturm et al. Reference Sturm2010; Riechers et al. Reference Riechers2014; Zhao, Yan, & Tsai Reference Zhao, Yan and Tsai2016), SPICA will reveal the properties of the bulk of the IR galaxy population up to redshifts of z ≃ 4 (Spinoglio et al. Reference Spinoglio, Dasyra, Franceschini, Gruppioni, Valiante and Isaak2012). The detected lines and dust features will allow us to unambiguously quantify the contribution of star formation and AGN to the bolometric luminosity in each galaxy. In Figure 4, we illustrate how specific IR line ratios can discriminate between nuclear activity from AGN, normal star formation, and also low metallicity star formation. The line ratios differ by orders of magnitude for the different objects, making this diagram very powerful, i.e., it is the analogue of the classical optical BPT diagram (Baldwin, Phillips, & Terlevich Reference Baldwin, Phillips and Terlevich1981), but using extinction-free IR lines.
Line ratio diagram of [Ne iii]15.6 μm/[Ne ii]12.8 μm versus [O iv]26 μm/[O iii]88 μm, showing the comparison of the data for local Universe AGN, LINERs, starburst galaxies, and dwarf galaxies with models including a range of the ionisation parameters U and number densities n. This diagram is able to disentangle nuclear activity from AGN, from normal star formation, as well as from low metallicity star formation, in e.g., dwarf galaxies (Fernández-Ontiveros et al. Reference Fernández-Ontiveros, Spinoglio, Pereira-Santaella, Malkan, Andreani and Dasyra2016). SPICA will be able to measure these line ratios and separate the power sources in active galaxies out to z ~ 4.
The SAFARI grating spectrometer at low resolution (R ~ 300) will detect [O iv]26 μm at z = 1 in galaxies with L ~ 1011 L⊙, at z = 2 in galaxies with L ~ 3 × 10¹¹ L⊙, and at z = 3 in galaxies with L ~ 1012 L⊙ in a few hours. These luminosities correspond to the knee of the luminosity function, L* (or characteristic luminosity, Schechter Reference Schechter1976), at each redshift. Simultaneously, SAFARI will detect many other diagnostic lines of the ionised and neutral ISM, such as the star formation tracers of [Ne ii]12.8 μm, [Ne iii]15.5 μm, [S iii]18.7 and 33.4 μm, and at longer wavelengths the PDR tracers of [O i]63 and 145 μm and [C ii]158 μm.
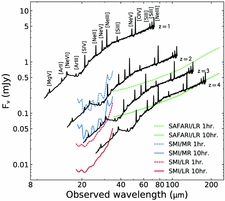
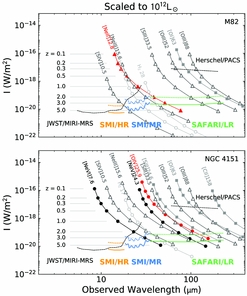
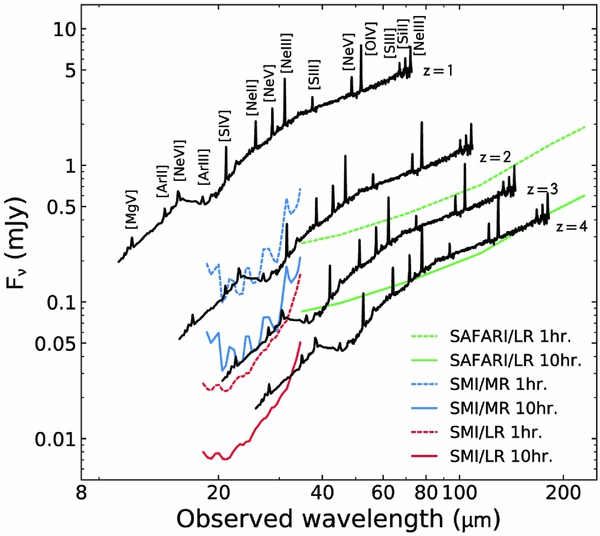
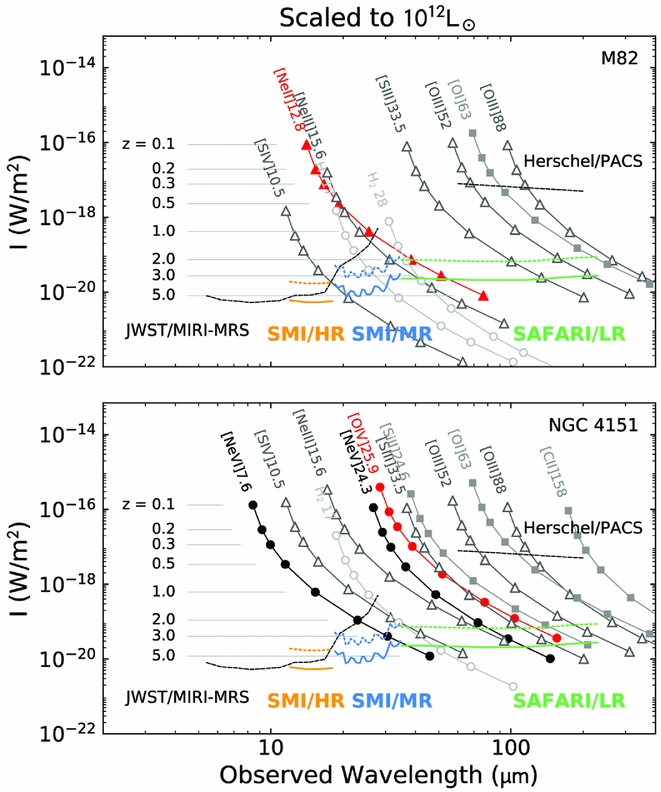
Figure 5 shows the IR spectrum of the local active galaxy MCG-3-34-64, re-scaled to a luminosity of L = 1012 L⊙ at redshifts z from 1 to 4. This illustrates that the SPICA spectrometers will be able to detect both the continuum and the brightest lines in such a galaxy up to z ≃ 4 in a few hours. Figure 6 shows the predicted intensities for the strongest mid- and far-IR lines in the nearby starburst galaxy M82 and in the AGN NGC 4151. For all galaxies, the line intensities have been scaled to a luminosity of L = 1012 L⊙. The lines of [Ne ii]12.8 μm, [O iii]52, 88 μm, [O iv]25.9 μm, [Ne v]14.3, 24.3 μm, and [Ne vi]7.6 μm will be detected in less than a few hours for the bulk of both starburst galaxies and AGN (L ~ 1012 L⊙) at the peak of star formation and SMBH accretion activity (1 < z < 3).
IR spectrum of MCG-3-34-64, a nearby active galaxy, re-scaled to a luminosity of L = 1012 L⊙ at redshifts from 1 to 4. At z=3, the knee luminosity is L* = 1012 L⊙, implying that SPICA will be able to map the bulk of the galaxy population up to this redshift. The 5σ sensitivities of SAFARI (in low resolution mode, LR) and SMI (in medium and low resolution, MR and LR) are shown for integration times of 1 and 10 h.
Predicted intensities for the mid- and far-IR fine-structure lines covered by SPICA for the starburst galaxy M82 (upper panel) and the AGN/Seyfert type 1 galaxy NGC 4151 (lower panel), scaled to a luminosity of 1012 L⊙. Filled circles correspond to tracers of AGN activity, triangles to lines typically dominated by star formation, squares to typical PDR lines, and open circles to transitions of warm molecular gas. The predicted line intensities are compared to the 5σ, 1 h (dotted lines) and 10 h (solid lines) sensitivities for SMI/HR (in yellow), SMI/MR (in blue), and SAFARI/LR (in green). Additionally, black-dashed lines indicate the sensitivities for JWST/MIRI-MRS (10σ, 2.8 h, from Glasse et al. Reference Glasse2015) and Herschel/PACS (5σ, 1 h). In less than few hours, SPICA will be able to detect the main star-formation and AGN tracers (e.g., [Ne ii]12.8 μm and [O iv]25.9 μm) at the peak of star formation and SMBH accretion activity (1 < z < 3), for starburst galaxies and AGN at the knee of the luminosity function.
SPICA will also obtain deep 34–230 μm low-resolution spectra of around 1 000 galaxies, equally spaced in luminosity and redshift bins, up to a redshift of z = 3.5 in a total integration time of around 2 000 h. Unbiased, deep low-resolution (R ~ 50–120) SMI spectrophotometric surveys will be able to cover 10 deg2 in 600 h and detect 30 000 galaxies (Kaneda et al. Reference Kaneda2017).
JWST will not cover wavelengths above λ = 28.8 μm, limiting its capability to measuring spectra of galaxies and AGN above z ~ 2 in the rest-frame mid-IR. This can be done with JWST with the [Ar ii]7 μm and [Ne vi]7.6 μm lines, but these will be a factor of 3–4 fainter than the mid-IR lines accessible to SPICA. As a consequence of this, and incorporating the degradation of JWST MIRI sensitivity towards its long-wavelength band edge, we expect that SPICA will be 25 to 2 000 times faster than JWST at diagnosing the power sources in dusty galaxies at z = 2 and 3, respectively.
ALMA cannot trace far-IR cooling lines (e.g., the [O iii]88 μm) at redshifts lower than 3, and cannot probe the dust and gas spectral features shortwards of 300 μm, leaving for SPICA the unexplored territory which covers the peak of the SFR and BHAR density functions (1 < z < 3), at mid- to far-IR wavelengths.
3.1. Measuring the primary ionising spectrum of AGN and starburst galaxies
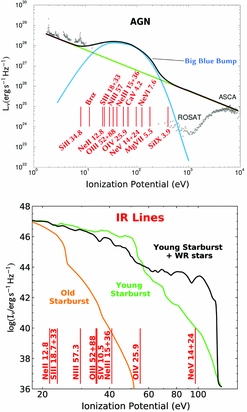
The intrinsic primary unattenuated ionising spectrum of AGN or starburst galaxies cannot be observed from the Lyman limit up to several hundred eV, because of Galactic and intrinsic absorption. Fortunately, for any region for which the ionisation structure is dominated by photons, the primary ionising spectrum can be inferred from the suite of mid- and far-IR emission lines from the various ions, largely unaffected by dust. In the nearby Universe, SPICA will detect the full range of mid- to far-IR fine-structure lines, providing a powerful probe of the intrinsic, ionising spectrum. Meanwhile, at higher redshift, (e.g., z ~1–2, depending on the luminosity of the galaxy), SPICA will still be able to detect the brightest lines of e.g., [Ne ii]12.8 μm, [Ne iii]15.5 μm, [O iii]52 and 88 μm, [O iv]26 μm, and [Ne v] 14.3 and 24.3 μm, whose ionisation potentials are positioned to properly sample the ionising spectrum.
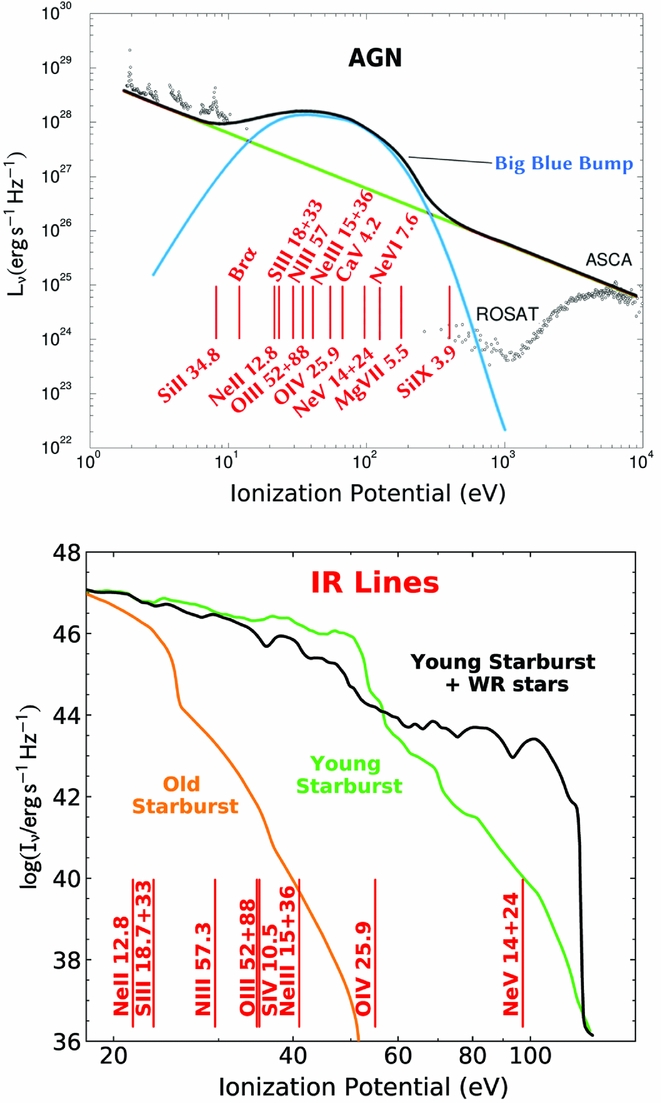
Figure 7 (upper panel) shows how the observed IR emission lines trace the primary spectrum of the Seyfert galaxy NGC4151, which is not directly observable from 10 to 200eV, where the signature of the BH accretion disk (big blue bump) should become prominent (Malkan & Sargent Reference Malkan and Sargent1982). This method has been applied to ISO spectra of bright Seyfert galaxies, e.g., NGC4151 and NGC1068 (Alexander et al. Reference Alexander, Sturm, Lutz, Sternberg, Netzer and Genzel1999, Reference Alexander, Lutz, Sturm, Genzel, Sternberg and Netzer2000), and Spitzer spectra of local AGN (Meléndez, et al. Reference Meléndez, Kraemer, Weaver and Mushotzky2011). Figure 7 (lower panel) shows a similar plot for starburst galaxies, where the stellar spectrum can be traced by the IR lines, free from dust extinction. This often leads to unexpected results. For example, observations of the [O iv]26 μm line have revealed that starburst and dwarf galaxies can have, in particular conditions, a significant contribution of ionising photons with energies above 50 eV (Lutz et al. Reference Lutz, Kunze, Spoon and Thornley1998; Schaerer & Stasińska Reference Schaerer and Stasińska1999; Fernández-Ontiveros et al. Reference Fernández-Ontiveros, Spinoglio, Pereira-Santaella, Malkan, Andreani and Dasyra2016), which is difficult to reconcile with current stellar population models (Stasińska et al. Reference Stasińska, Izotov, Morisset and Guseva2015). Observations of low-redshift starburst and dwarf galaxies with SPICA will have the potential to reveal the physical mechanisms (e.g., strong winds or shocks, associated with very high mass stars) responsible for the high ionisation tail of the underlying ionising spectrum, constraining the upper mass cut-off and the stellar initial mass function.
Diagrams showing how IR lines, which can be measured by SPICA up to z ~1–2, can map the intrinsic ionising spectra of both AGN and starburst galaxies. Upper panel: Overlay of the NGC4151 primary ionising spectrum (black points) with a schematic ‘blue bump’ and power law (adapted from Alexander et al. Reference Alexander, Sturm, Lutz, Sternberg, Netzer and Genzel1999). The IR lines will trace the unobserved primary spectrum at the energies of their ionisation potentials. Lower panel: IR lines probe the starburst’s primary ionising spectrum, which is sensitive to the presence of Wolf-Rayet stellar winds or shocks and to the starburst age (models from Leitherer et al. Reference Leitherer1999).
3.2. Finding AGN in dwarf galaxies
It has been recently recognised that finding and characterising AGN in dwarf galaxies is a unique way to infer the properties of high-redshift BH seeds (z > 5), i.e., accreting BHs with masses of 105–106 M⊙, which are probably associated with low-metallicity environments (Baldassare et al. Reference Baldassare, Reines, Gallo and Greene2016a). Furthermore, dwarf galaxies are thought to be the local analogues of the high-redshift galaxies responsible for cosmic reionisation, due to escaping photons produced by strong star formation (Ly α emitters; Sharma et al. Reference Sharma, Theuns, Frenk, Bower, Crain and Schaye2016; Izotov et al. Reference Izotov, Schaerer, Thuan, Worseck, Guseva, Orlitová and Verhamme2016; Schaerer et al. Reference Schaerer, Izotov, Verhamme, Orlitová, Thuan, Worseck and Guseva2016) and/or by AGN activity from accreting BH of 105–106 M⊙ (Madau & Haardt Reference Madau and Haardt2015). The IR line ratio diagram shown in Figure 3, which will be populated with SPICA spectroscopic observations, is ideal for measuring the AGN contribution in dwarf galaxies; this is because dwarf AGN are elusive in X-ray surveys and many of them are contaminated by strong star formation in classical optical ‘BPT’ (Baldwin, et al. Reference Baldwin, Phillips and Terlevich1981) diagnostics (Baldassare et al. Reference Baldassare2016b; Simmonds et al. Reference Simmonds, Bauer, Thuan, Izotov, Stern and Harrison2016). The [Ne ii] and [Ne iii] lines will be detected at low redshift with SMI at high spectral resolution and at increasing redshift with SMI at medium resolution as well as with SAFARI.
4 SYNERGIES WITH FUTURE FACILITIES
SPICA will study the physical processes driving galaxy evolution, through sensitive mid- to far-IR observations of deeply embedded regions that characterise galaxy formation and evolution at the peak of the SFR and BHAR (1 < z < 4). JWST, due to its shorter wavelength range, will cover the same redshifts at shorter rest-frame wavelengths (e.g., at z = 3 for λ < 7 μm and at z = 2 for λ < 9 μm), missing most of the fine-structure diagnostic lines of Table 1 and having a greatly reduced ability to detect most dust-enshrouded and obscured galaxies and AGN, due to the increasing extinction at shorter wavelengths. SPICA will be able to survey large areas of the sky, and find new samples of IR-bright, high-redshift galaxies. JWST will be able to study in greater spatial detail the low-redshift Universe (z < 1) and perform cosmological studies of the high-redshift Universe in the UV/optical rest-frame. In the submillimeter, ALMA and the NOrthern Extended Millimeter Array (NOEMAFootnote 2 ), will map lower excitation emission-line processes and colder dust continuum, with respect to SPICA. Ground-based interferometry with ALMA and the NOEMA can complement far-IR spectroscopy in tracing molecular outflows with CO (Feruglio et al. Reference Feruglio, Maiolino, Piconcelli, Menci, Aussel, Lamastra and Fiore2010; Feruglio et al. Reference Feruglio2015; Cicone et al. Reference Cicone, Feruglio, Maiolino, Fiore, Piconcelli, Menci, Aussel and Sturm2012; Cicone et al. Reference Cicone2014; García-Burillo et al. Reference García-Burillo2015) and HCN-HCO+ (e.g., Sakamoto et al. Reference Sakamoto2009; Aalto et al. Reference Aalto, Garcia-Burillo, Muller, Winters, van der Werf, Henkel, Costagliola and Neri2012; Imanishi, Nakanishi, & Izumi Reference Imanishi, Nakanishi and Izumi2016). SPICA will, however, work in synergy with these facilities and the new generation ELTs, as well as with the X-ray telescope Athena, the Advanced Telescope for High ENergy Astrophysics (Nandra et al. Reference Nandra2013). This latter observatory will measure, in synergy with SPICA, the BHAR history as a function of cosmic time. However, it will be mostly limited to Compton thin sources, needing SPICA observations to access the obscured BHAR density. On AGN feedback, Athena will detect the high energy ionic winds in synergy with SPICA observations of massive molecular outflows.
If approved, SPICA will be operational in the late 2020s in the era of the ELTs and at the dawn of the Square Kilometer Array (SKA; Dewdney et al. Reference Dewdney, Hall, Schilizzi and Lazio2009). SPICA will operate at the same time as Athena in the X-ray range. By then, both Euclid (Maciaszek et al. Reference Maciaszek and MacEwen2016) and the Wide Field IR Survey Telescope (WFIRST; Spergel et al. Reference Spergel2013) will have brought a vast legacy of deep near-IR images and spectra over large fields, reaching the peak of star formation and SMBH accretion activity for 1 <z<3, but limited to the unobscured populations of galaxies and AGN. From these large surveys, follow-up spectroscopic observations will be collected by SPICA mid- and far-IR low-resolution (R ~ 50–300) spectroscopy, enabling a full characterisation of the physical state of very large samples of galaxies.
5 CONCLUSIONS
The SPICA mission, with its 2.5-m actively cooled telescope and powerful mid- and far-IR instrumentation, will represent a huge step forward in understanding galaxy formation and evolution, through IR spectroscopy of individual galaxies and deep photometric and spectrophotometric surveys for large statistically significant samples. The mid- and far-IR spectral range is host to a powerful suite of diagnostic tools, able to penetrate even the dustiest regions. With SPICA, astronomers will use this toolset to probe galaxy evolution in several unique ways, including:
-
(i) obtaining the first physical determination through IR spectroscopy of the SFR and of the BHAR histories across cosmic times up to a redshift of z ~ 4;
-
(ii) studying AGN accretion and feedback and their impact in the evolution of star formation, through detection and characterisation of far-IR molecular and atomic line profiles;
-
(iii) measuring the rise of metals from the distant Universe to the present day through spectroscopy of IR lines, which minimises the effects of dust extinction and eliminates those due to temperature uncertainties and fluctuations in the ionised gas;
-
(iv) studying early AGN and starburst-dominated galaxies in significant samples of dusty galaxies up to z ~ 6, through deep (spectro)-photometric surveys;
-
(v) detecting and characterising some of the youngest and most luminous galaxies in the early Universe when it was only half a billion years old.
With a large 2 000-h. spectroscopic survey, SPICA/SAFARI will obtain individual high S/N spectra of over 1 000 galaxies to z ~ 4. These observations will simultaneously detect diagnostic lines of the ionised and neutral ISM, characterising the local environment and quantifying the contribution from young stars and AGN to the bolometric luminosity. SPICA/SMI will perform similar spectroscopic studies at lower redshifts (z < 2) with low resolution, wide field surveys, to detect and characterise thousands of dusty galaxies via their PAH features and hot dust emission. No other currently planned telescope will be able to perform this type of detailed spectroscopic and wide-area spectro-photometric investigation. SPICA will fill the wide spectral gap left between ALMA (observing above 300 μm) and JWST (below 28 μm). In this spectral range, SPICA will observe the ionic fine structure lines, the H2 as well as many other molecular lines (e.g., from H2O, OH, and CO) and PAH features in the rest-frame mid-IR in galaxies at the peak epoch of star formation, as well as those from the molecular gas and PDRs in the far-infrared.
ACKNOWLEDGEMENTS
This paper is dedicated to the memory of Bruce Swinyard, who initiated the SPICA project in Europe, but unfortunately died on 2015 May 22 at the age of 52. He was ISO-LWS calibration scientist, Herschel-SPIRE instrument scientist, first European PI of SPICA and first design lead of SAFARI. We acknowledge the SAFARI Consortium and the full SPICA Team, without whose work this project would not have been possible. F.J.C. and A.A.-H. acknowledge financial support through grant AYA2015-64346-C2-1-P (MINECO/FEDER). H.D. acknowledges financial support from the Spanish Ministry of Economy and Competitiveness (MINECO) under the 2014 Ramn y Cajal program MINECO RYC-2014-15686. T.N. acknowledges financial support by JSPS KAKENHI Grant Number 27247030. F.N. acknowledges Spanish grants FIS2012-39162-C06-01, ESP2013-47809-C3-1-R, and ESP2015-65597-C4-1-R. Basic research in IR astronomy at NRL is funded by the US ONR. We thank the anonymous referee, who helped improving the readability of this article.