


Introduction
Myalgic encephalomyelitis or chronic fatigue syndrome (ME/CFS) is characterized by extreme fatigue that significantly interferes with social, professional, and daily life activities. Besides disabling fatigue symptoms, ME/CFS patients often experience high comorbidity of pain disorders and hyperalgesia, such as fibromyalgia or irritable bowel syndrome (Aaron et al., Reference Aaron, Herrell, Ashton, Belcourt, Schmaling, Goldberg and Buchwald2001; Buchwald, Pearlman, Kith, Katon, & Schmaling, Reference Buchwald, Pearlman, Kith, Katon and Schmaling1997; Castro-Marrero et al., Reference Castro-Marrero, Faro, Aliste, Saez-Francas, Calvo, Martinez-Martinez and Alegre2017; Krupp, Jandorp, Coyle, & Mendelson, Reference Krupp, Jandorp, Coyle and Mendelson1993; Surian & Baraniuk, Reference Surian and Baraniuk2020). Current treatments are often aimed at either fatigue or pain, while it is not given that treating one symptom will also resolve the other. However, the high comorbidity of fatigue and pain, as well as the similarities in their subjective, self-reported, and multidimensional character, make it hard to provide empirical arguments to guide treatment toward one or another. At the brain level, fatigue and pain both involve sensory, affective, and cognitive processes that are supported by distributed and overlapping neural circuits (Apkarian, Bushnell, Treede, & Zubieta, Reference Apkarian, Bushnell, Treede and Zubieta2005; Buchel, Geuter, Sprenger, & Eippert, Reference Buchel, Geuter, Sprenger and Eippert2014; Davis, Reference Davis2000; Maksoud et al., Reference Maksoud, du Preez, Eaton-Fitch, Thapaliya, Barnden, Cabanas and Marshall-Gradisnik2020; Muller & Apps, Reference Muller and Apps2019; Song et al., Reference Song, Yao, Kemprecos, Byrne, Xiao, Zhang and Chen2021; Stephan et al., Reference Stephan, Manjaly, Mathys, Weber, Paliwal, Gard and Petzschner2016). It might be possible to leverage those neural circuits to better differentiate these symptoms experienced by ME/CFS patients. Accordingly, the current study used resting-state functional magnetic resonance imaging (fMRI) to disentangle the neural networks associated with pain and fatigue symptoms in ME/CFS patients and test whether and how they are affected by cognitive behavioral therapy (CBT) for ME/CFS. The results of this study may provide new insights into the symptom specific neural pathology of pain and fatigue, to ultimately better target and individualize both medical and behavioral treatments in ME/CFS.
Previous studies have used resting-state fMRI to investigate the neural network characteristics of either fatigue symptoms (for a systematic review, see Maksoud et al. (Reference Maksoud, du Preez, Eaton-Fitch, Thapaliya, Barnden, Cabanas and Marshall-Gradisnik2020)) or pain symptoms (for a systematic review see Apkarian et al. (Reference Apkarian, Bushnell, Treede and Zubieta2005)). Using various methodological approaches (e.g. seed-based connectivity, principal component network analysis, graph theory), both fields indicate remarkable overlapping involvement of sensory, motor, prefrontal and fronto-parietal networks. Specifically, two studies that compared seed-based connectivity between ME/CFS patients and healthy controls (HC) report altered connectivity between the precuneus (=posterior default mode network [DMN]) and clusters in the primary motor area (precentral-gyrus), supplementary motor area (SMA), and prefrontal cortex (superior and medial frontal gyrus and anterior cingulate) which scaled with fatigue severity (Boissoneault et al., Reference Boissoneault, Letzen, Lai, O'Shea, Craggs, Robinson and Staud2016; Kim et al., Reference Kim, Namkoong, Kim, Lee, Yoon, Choi and Jung2015a). Additionally, Gay et al. (Reference Gay, Robinson, Lai, O'Shea, Craggs, Price and Staud2016) reported altered connectivity between the nodes of the frontoparietal network (FPN) and between the sensorimotor network (SMN) and cingulate cortex in ME/CFS compared to HC. Similarly, studies comparing chronic pain populations with HC, report differences in connectivity of sensorimotor network (i.e. SMN), supplementary motor cortex, anterior and posterior cingulate, insula, and amygdala (Apkarian et al., Reference Apkarian, Bushnell, Treede and Zubieta2005; Baliki, Mansour, Baria, & Apkarian, Reference Baliki, Mansour, Baria and Apkarian2014; Buchel et al., Reference Buchel, Geuter, Sprenger and Eippert2014; Farmer, Baliki, & Apkarian, Reference Farmer, Baliki and Apkarian2012; Pfannmoller & Lotze, Reference Pfannmoller and Lotze2019; Sandstrom et al., Reference Sandstrom, Ellerbrock, Lofgren, Altawil, Bileviciute-Ljungar, Lampa and Kosek2022; Song et al., Reference Song, Yao, Kemprecos, Byrne, Xiao, Zhang and Chen2021). Moreover, a review of longitudinal studies by (Pfannmoller & Lotze, Reference Pfannmoller and Lotze2019) suggests that alterations in particularly DMN and FPN connectivity are involved in the chronification of pain conditions.
However, these studies did not directly compare pain and fatigue conditions or symptoms, or took into account its comorbidity. Accordingly, the question remains whether these networks play specific or common roles in fatigue or pain. So far, only a few studies did compare pain and fatigue-related connectivity patterns within one patient population. Specifically, using graph theoretical measures a recent study assessed symptom-specific associations in patients with ankylosing spondylitis and showed a partial network-level dissociation between fatigue- and pain-related brain connectivity (Liu et al., Reference Liu, Liao, Zhang, Lin, He, Fang and Gu2020). While functional connectivity of the DMN nodes with the rest of the brain was associated with both pain and fatigue, connectivity of the pre-central gyrus (part of the SMN) and superior parietal gyrus were only associated with fatigue. In line with this, two other studies in ME/CFS patients revealed that functional connectivity between the sensorimotor cortex and the SMA during preparation of effortful exertions was associated with fatigue (van der Schaaf et al., Reference van der Schaaf, Roelofs, de Lange, Geurts, van der Meer, Knoop and Toni2018), while structural integrity of the dorsolateral-prefrontal cortex was associated with pain and not fatigue symptoms (van der Schaaf et al., Reference van der Schaaf, De Lange, Schmits, Geurts, Roelofs, van der Meer and Knoop2017). Together, this suggest that networks involving sensory-motor regions may play a specific role in fatigue symptoms, networks involving dorsolateral prefrontal cortex may play specific role in pain symptoms and that the DMN may be involved in both pain and fatigue symptoms.
Here we build on these findings and use resting state connectivity in ME/CFS patients to test the hypothesis that fatigue and pain involve partly dissociable patterns of neural connectivity, focusing on four networks that have previously been associated with fatigue or pain: the FPN, (related to pain [van der Schaaf et al., Reference van der Schaaf, De Lange, Schmits, Geurts, Roelofs, van der Meer and Knoop2017]); the SMN and the premotor/supplementary motor network (PMN) (related to fatigue [van der Schaaf et al., Reference van der Schaaf, Roelofs, de Lange, Geurts, van der Meer, Knoop and Toni2018]), and the DMN (the most commonly reported network to be involved in both fatigue (ME/CFS) and pain (fibromyalgia) conditions (Fallon, Chiu, Nurmikko, & Stancak, Reference Fallon, Chiu, Nurmikko and Stancak2016; Kim et al., Reference Kim, Namkoong, Kim, Lee, Yoon, Choi and Jung2015a, Reference Kim, Loggia, Cahalan, Harris, Beissner, Garcia and Napadow2015b; Kong et al., Reference Kong, Spaeth, Wey, Cheetham, Cook, Jensen and Gollub2013; Maksoud et al., Reference Maksoud, du Preez, Eaton-Fitch, Thapaliya, Barnden, Cabanas and Marshall-Gradisnik2020; Shan et al., Reference Shan, Finegan, Bhuta, Ireland, Staines, Marshall-Gradisnik and Barnden2018, Reference Shan, Barnden, Kwiatek, Bhuta, Hermens and Lagopoulos2020). To investigate this hypothesis, we first performed a network-based analysis, using the four major networks described above, to assess relationships between pain or fatigue symptoms and within and between network connectivity within the ME/CFS group, followed by post-hoc seed-based analyses to anatomically qualify the network-based results. More specifically, we hypothesize that pain symptoms are associated with connectivity of the FPN, fatigue symptoms are associated with connectivity of the SMN and PMN and both symptoms are associated with connectivity of the DMN.
CBT for ME/CFS aims to reduce fatigue by improving the sleep-wake cycle, regulation, gradual increase of (physical) activities and changing fatigue-related cognitions and behaviors in 12–14 individual sessions over a period of 6 months with a trained cognitive behavioral therapist. It has shown to successfully reduce fatigue and pain in a substantial subgroup of treated patients (Knoop, Bleijenberg, Gielissen, van der Meer, & White, Reference Knoop, Bleijenberg, Gielissen, van der Meer and White2007; Malouff, Thorsteinsson, Rooke, Bhullar, & Schutte, Reference Malouff, Thorsteinsson, Rooke, Bhullar and Schutte2008). However, it remains unclear what neurobiological mechanisms may underlie these clinical improvements and whether they involve general or domain specific networks. Accordingly, we tested whether symptom improvements in pain and fatigue after CBT (compared to waiting list and healthy controls) were associated with changes in neural connectivity. We hypothesize that CBT-induced improvements in pain are associated with changes in FPN connectivity while improvements in fatigue are associated with changes in SMN and/or PMN connectivity. Results of this study will provide insight into the neural mechanisms underlying fatigue and pain symptoms and whether or not these mechanisms are modulated by CBT.
Methods
Participants
Ninety-four female ME/CFS patients, between 18 and 65 years old, that met U.S. Centers for Disease Control (CDC)-criteria for ME/CFS (revised in 2003) (Fukuda et al., Reference Fukuda, Straus, Hickie, Sharpe, Dobbins and Komaroff1994; Reeves, Lloyd, & Vernon, Reference Reeves, Lloyd and Vernon2003) and scored ⩾40 on the subscale fatigue of the checklist individual strength (CIS-fatigue) (Vercoulen et al., Reference Vercoulen, Swanink, Fennis, Galama, van der Meer and Bleijenberg1994; Worm-Smeitink et al., Reference Worm-Smeitink, Gielissen, Bloot, van Laarhoven, van Engelen, van Riel and Knoop2017), and ⩾700 on the Sickness Impact Profile-8 (SIP8total) (Bergner, Bobbitt, Carter, & Gilson, Reference Bergner, Bobbitt, Carter and Gilson1981) and thirty gender, age and education-matched healthy controls (HC)(<35 on CIS-fatigue, and no chronic medical condition) were included. For a complete list of in- and exclusion criteria see Supplement.
Procedure, randomization and intervention
Patients were informed about the study by their treating psychologists at the Expert Centre of Chronic Fatigue in Nijmegen, The Netherlands. Eligible patients were invited for a first baseline assessment (T0), after which they were randomly assigned to CBT (n = 59) or waiting list (WL; n = 29) by supporting staff who were not directly involved in the study. Six eligible patients declined from randomization but were included in the baseline analysis. Six months after CBT/WL, patients were invited for the second assessment (T1). HC were recruited through advertisements and flyers. Eligible HC were also tested twice with 6 months in between, to control for test-retest effects.
CBT consisted of 12–14 individual sessions within ~6 months with a trained cognitive behavioral therapist and took place at the Expert Centre of Chronic Fatigue (ECCF) in Nijmegen, The Netherlands. CBT included goal setting, regulation of the sleep-wake cycle, regulation/grading of physical activities while challenging fatigue-related cognitions and behaviors, realization of the prior set goals, reappraisal of fatigue and relapse prevention (van Der Schaaf et al., Reference van Der Schaaf, Schmits, Roerink, Geurts, Toni, Roelofs and Knoop2015). Patients that were assigned to WL did not receive any treatment or control intervention and started CBT after the second assessment.
Clinical data
For clinical characterization fatigue severity (CIS-fatigue [Vercoulen et al., Reference Vercoulen, Swanink, Fennis, Galama, van der Meer and Bleijenberg1994; Worm-Smeitink et al., Reference Worm-Smeitink, Gielissen, Bloot, van Laarhoven, van Engelen, van Riel and Knoop2017]), daily functioning (SIP-total [only in ME/CFS] [Bergner et al., Reference Bergner, Bobbitt, Carter and Gilson1981]), depressive symptoms (Beck depression inventory primary care [BDI-PC]), disease duration, age and education level (Verhage, Reference Verhage1964) were assessed. Successful treatment was defined by a clinically significant improvement on fatigue severity, i.e. scoring lower than 35 and a reliable change index of >1.96 on the CIS-fatigue, as defined in our preregistration (van Der Schaaf et al., Reference van Der Schaaf, Schmits, Roerink, Geurts, Toni, Roelofs and Knoop2015).
To assess relationships with fatigue and pain, two retrospective and two momentary outcome measures were selected. Selection of the retrospective measures was based on its common use in the literature. Selection of the momentary measures was based on previous results that demonstrated significant associations with neural activity and neuroanatomy.
1) Fatigue severity over the past two weeks (CIS-fatigue) (Vercoulen et al., Reference Vercoulen, Swanink, Fennis, Galama, van der Meer and Bleijenberg1994; Worm-Smeitink et al., Reference Worm-Smeitink, Gielissen, Bloot, van Laarhoven, van Engelen, van Riel and Knoop2017). This measure is commonly used in fatigue populations, and measures retrospective self-reported fatigue over the past 2 weeks. It includes a cut-off score for severely fatigued ME/CFS patients, which was used for patient selection in this study (see above).
2) Pain-related disability (pain subscale of the RAND-36 [RAND-pain] [Aaronson et al., Reference Aaronson, Muller, Cohen, Essink-Bot, Fekkes, Sanderman and Verrips1998]). This measure is commonly used in pain populations and asks retrospectively about how much pain someone experienced in the past 4 weeks, and how much the pain interfered with daily activities.
3) Fatigue across the testing day (average of 3 measurements of the subscale fatigue of the profile of moods scale questionnaires (POMS-fatigue) (McNair, Lorr, & Doppleman, Reference McNair, Lorr and Doppleman1971; Shacham, Reference Shacham1983). This measure was associated with neural activity in van der Schaaf et al. (Reference van der Schaaf, Roelofs, de Lange, Geurts, van der Meer, Knoop and Toni2018). It has additional value over the CIS-fatigue as it was not used for patient selection, and it provides an overall level of fatigue during the testing day.
4) Pain-occurrence (diary scores). Participants indicated the presence (yes or no) of muscle pain, joint pain, and/or headaches on four time points of the day during 12 consecutive days. Presence of pain was calculated as the average percentage of all time points with pain. This measure associated with neuroanatomy of the DLPFC in van der Schaaf et al. (Reference van der Schaaf, De Lange, Schmits, Geurts, Roelofs, van der Meer and Knoop2017). It has additional value over the RAND-pain as it provides a more direct measure of the occurrence of pain symptoms based on momentary assessments, rather than retrospective measurements.
Neuroimaging data collection
A 5-min resting-state scan was assessed, using a multi echo T2*-weighted, gradient-echo planar imaging (EPI) sequence (TR = 2000 ms, TE = 9.0/19.28/29.56/39.84 ms, flip angle = 90°, voxel size = 3.3 × 3.3 × 3.3 mm, slice thickness: 3.0 mm, 150 scans). During the scan, the room was dark and subjects were asked to lie still with their eyes open to avoid falling asleep. The resting-state scan was assessed at the end of a larger imaging protocol of which the results are published elsewhere (van der Schaaf et al., Reference van der Schaaf, De Lange, Schmits, Geurts, Roelofs, van der Meer and Knoop2017; van der Schaaf et al., Reference van der Schaaf, Roelofs, de Lange, Geurts, van der Meer, Knoop and Toni2018). Resting-state was preceded by approximately 1.5 h of functional and anatomical imaging and a 15 min break after the first 45 min (see [van Der Schaaf et al., Reference van Der Schaaf, Schmits, Roerink, Geurts, Toni, Roelofs and Knoop2015]). Anatomical images were obtained at the start of the protocol, for spatial normalization purposes using a T1-weighted magnetization-prepared rapid gradient-echo (MP-RAGE) sequence (TR\TE: 2300\3.03 ms, flip angle = 8°, 192 sagittal slices, FoV: 256 × 256 mm, voxel size: 1 mm3, slice thickness: 1 mm).
Statistical analysis
Clinical characterization of the patient population
Clinical and demographic data were compared between the ME/CFS and HC groups at baseline using two sample t tests (except for education, which was analyzed with a Mann–Whitney-U test) in SPSS (version 27). Clinical changes were compared between CBT and WL (including all participants who completed the study), using repeated measures ANOVA with time (T0, T1) as a within-subjects factor and randomization (CBT, WL) as between-subjects factors, and with age and education as covariates of no interest. A p value of <0.05 was considered significant. Pearson correlation between clinical outcome variables is reported to test for multicollinearity, which is relevant for interpreting the specificity of brain-symptoms relationships for either pain or fatigue.
Neuroimaging analysis
Images were pre-processed and analyzed using SPM12 (Wellcome Department of Cognitive Neurology, London), FSL (FMRIB's Software Library, Version 5.0.9, www.fmrib.ox.ac.uk/fsl) and in-house matlab codes (see online Supplement). A network-based analysis, using four major networks (see below), was done to compare ME/CFS and HC at baseline, and to assess relationships between connectivity and the clinical measures within the ME/CFS group. This was followed by a comparison of changes in network-connectivity between CBT, WL and HC groups, and its relationships with clinical change within the CBT group. Post-hoc seed-based analyses were used to investigate the robustness of the network-based results and to examine the anatomical specificity of the effects. If the network-level effects can also be observed in the seed-level analysis, this shows that they are robust to the exact ROI definition. It also allowed us to investigate if specific components of each network were driving the observed associations.
The network analysis was based on the MIST atlas (Urchs et al., Reference Urchs, Armoza, Benhajali, St-Aubin, Orban and Bellec2017) (https://simexp.github.io/multiscale_dashboard/index.html). The hierarchical structure of this atlas allows for investigation of the data at different resolutions, and its independence from the test data avoids biases given differences in the groups size. We considered four networks derived from previous work showing the involvement of regions within those networks in ME/CFS: (1) the fronto-parietal task control network (FPN, corresponding to the DLPFC seed-region reported in [van der Schaaf et al., Reference van der Schaaf, De Lange, Schmits, Geurts, Roelofs, van der Meer and Knoop2017]; 8 regions at the s36 level). (2) the somatomotor network (SMN, corresponding to the S1M1 seed-region reported in (van der Schaaf et al., Reference van der Schaaf, Roelofs, de Lange, Geurts, van der Meer, Knoop and Toni2018), 7 regions at the s7 level). (3) the premotor and supplementary motor network (PMN, corresponding to the SMA seed-region reported in (van der Schaaf et al., Reference van der Schaaf, Roelofs, de Lange, Geurts, van der Meer, Knoop and Toni2018), 4 regions at the s36 level) and (4) the default mode network (DMN, 22 regions). The latter was included because the DMN is one of the most reported networks of which connectivity with other brain regions is altered in both fatigue and pain conditions (Fallon et al., Reference Fallon, Chiu, Nurmikko and Stancak2016; Kim et al., Reference Kim, Namkoong, Kim, Lee, Yoon, Choi and Jung2015a, Reference Kim, Loggia, Cahalan, Harris, Beissner, Garcia and Napadow2015b; Kong et al., Reference Kong, Spaeth, Wey, Cheetham, Cook, Jensen and Gollub2013; Maksoud et al., Reference Maksoud, du Preez, Eaton-Fitch, Thapaliya, Barnden, Cabanas and Marshall-Gradisnik2020; Shan et al., Reference Shan, Finegan, Bhuta, Ireland, Staines, Marshall-Gradisnik and Barnden2018, Reference Shan, Barnden, Kwiatek, Bhuta, Hermens and Lagopoulos2020). fMRI signals were extracted from 41 regions (online Supplementary Table S1 and Fig. 1a). We implemented post-hoc connectivity analyses on the three seed-regions identified by our previous work (van der Schaaf et al., Reference van der Schaaf, De Lange, Schmits, Geurts, Roelofs, van der Meer and Knoop2017; van der Schaaf et al., Reference van der Schaaf, Roelofs, de Lange, Geurts, van der Meer, Knoop and Toni2018), defined as 8 mm spheres located in (1) the dorsolateral prefrontal gyrus (DLPFC; xyz = −342 631), (2) the supplementary motor area (PMN-seed; xyz = −5,−10,67) and (3) the somatomotor region (SMN-seed; xyz = −30,−32,50).
Clinical outcome measures. Change between T1 and baseline (left) and score per day for (a) CIS fatigue, (b) Pain severity as measured with the RAND-36, (c) Fatigue across the testing day as measured with the POMS-fatigue and (d) pain occurrence as measured with diary-scores. CIS, Checklist Individual Strength; POMS, Profile of Moods State; ns, not significant, * = p < 0.05, ** = p < 0.001.

A general linear model (GLM) was applied on the time courses of each voxel within each network-region or seed (Geerligs, Cam, & Campbell, Reference Geerligs, Cam and Campbell2018; Geerligs, Tsvetanov, Cam, & Henson, Reference Geerligs, Tsvetanov, Cam and Henson2017) and included 32 confound and noise regressors including six head-motion parameters, their first-order temporal, squares and squared derivatives, and average signals in the WM and CSF (Satterthwaite et al., Reference Satterthwaite, Elliott, Gerraty, Ruparel, Loughead, Calkins and Wolf2013). Data and model regressors were band-pass filtered (0.008–0.1 Hz), by including a discrete cosine transform set in the GLM, ensuring that nuisance regression and filtering were performed simultaneously. Data were pre-whitened by inverting an autocorrelation model (Friston et al., Reference Friston, Glaser, Henson, Kiebel, Phillips and Ashburner2002). (see online Supplement).
For the network-analysis, Pearson's correlation between all 41 regions was estimated from the whitened residuals of first level model (Geerligs, Cam, & Henson, Reference Geerligs, Cam and Henson2016). The correlation matrices were Fisher z-transformed and reduced by averaging the values across all regions within the four major networks. This resulted in a correlation matrix with 4 within and 6 between network correlations (10 in total). These correlation matrices were compared between groups using regression analysis in matlab. Differences in network connectivity between the ME/CFS and HC groups were assessed at baseline/T0. To assess treatment effects on network connectivity, difference-matrices were calculated (T1−T0) and compared between CBT and WL and HC groups. To assess relationships between network-connectivity and (changes in) fatigue and pain, regression analyses were done within the ME/CFS group for each clinical variable separately (i.e. CIS-fatigue, POMS-fatigue, RAND-pain and pain occurrence). When significant, it was tested whether the relationship remained significant when including all four clinical variables into the model. p values were adjusted by false discovery rate (FDR), correcting for 10 comparisons and considered significant when <0.05.
When the network analysis revealed significant results, seed-based connectivity of the corresponding seed was assessed for the same contrast/relationship. For this, contrasts capturing cerebral activity associated with the seeds time series were taken to the second level in SPM. Statistical inferences for these analyses are based on cluster-level statistics familywise error (FWE) correction for multiple comparisons, with cluster-forming threshold of p = 0.001 [p wb_cluster], either at the whole brain (p wb_fwe_cluster) or, when whole brain analysis was not significant, small-volume corrected for the voxels within the network with which where associations were shown in the network-level analysis (p sv_fwe_cluster). Beta-values were extracted from significant clusters for visualization and post-hoc group comparisons and to assess relationships with (change in) fatigue and pain. Exploratory seed-based analysis of remaining seeds is reported in the online Supplement. For all second-level analyses age and education were included as covariates of no interest.
Results
Participants
Resting-state data was not collected in all participants. See the study flowchart in the online Supplement for excluded and missing data. Baseline resting state scans were available for 72 ME/CFS patients and 29 controls. Follow-up resting state scans were available of 51 ME/CFS patients (33 CBT, 18 WL) and 25 controls. Diary-scores and BDI were missing for 8 participants (See Tables 1 and 2) but this did not affect the N for our main analysis.
Clinical symptoms for ME/CFS and HC at baseline

CIS, checklist individual strength; ME/CFS, myalgic encephalomyelitis/Chronic fatigue syndrome; HC, healthy controls; SIP, sickness impact profile; BDI-PC, Beck depression inventory-primary care.
All outcome measures are compared using independent t tests, except for education, for which a Mann–Whitney U test was done. CIS-fatigue measures fatigue severity of the past 2 weeks. POMS-fatigue measures fatigue across the testing day, RAND-pain measures a combination of pain severity and disability. Note that higher levels are less pain. Pain occurrence measures the % of time one experienced pain-symptoms during the past 2 weeks using diary scores, Daily functioning was measured with the Sickness Impact Profile. Depression was measured with the Beck depression inventory-primary care.
Clinical symptoms for CBT and WL groups at T0, T1, and its difference (T1 − T0)
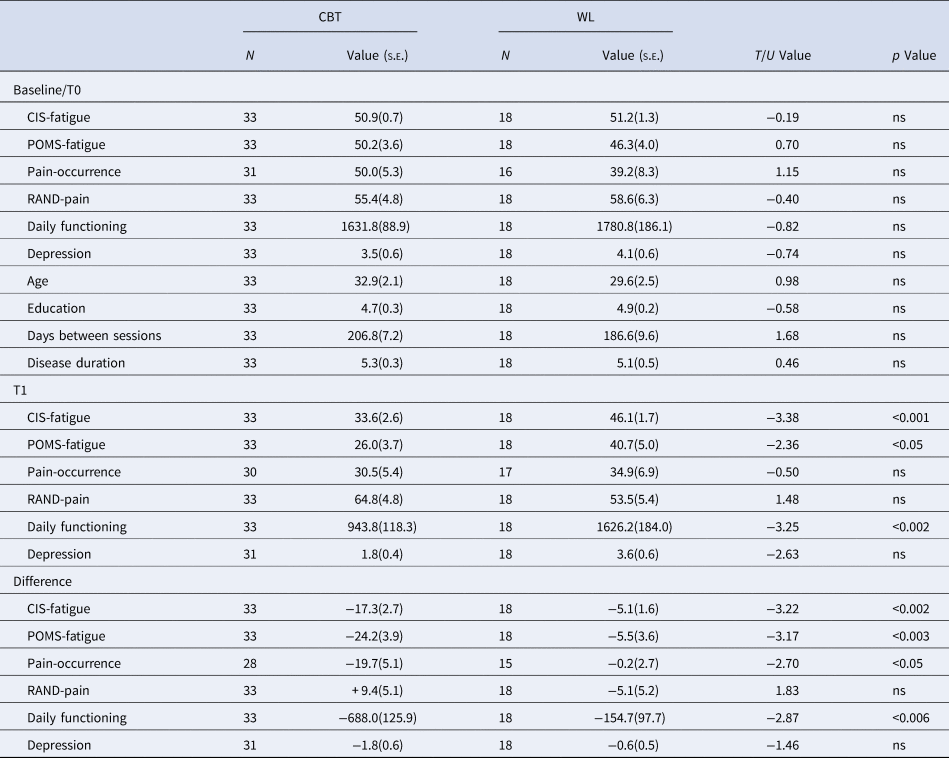
CBT, cognitive behavioral therapy; WL, waiting list; CIS, checklist individual strength; SIP, sickness impact profile; BDI-PC, Beck depression inventory-primary care.
CIS-fatigue measures fatigue severity of the past 2 weeks. POMS-fatigue measures fatigue across the testing day, RAND-pain measures a combination of pain severity and disability. Note that higher scores represent lower pain severity and disability. Pain occurrence measures the % of time one experienced pain-symptoms during the past 2 weeks using diary scores, Daily functioning was measured with the sickness impact profile, Depression was measured with the Beck depression inventory-primary care.
Clinical outcome measures
ME/CFS patients and HC were matched on sex (all female), age, and education (all p > 0.05). Following inclusion criteria, ME/CFS patients scored higher than HC on the CIS-fatigue questionnaire. Patients with ME/CFS also reported higher POMS-fatigue, higher pain-occurrence, higher RAND-pain, and more depressive symptoms (Table 1).
CBT significantly reduced all clinical symptoms compared to WL (all p < 0.05) except for depressive symptoms and RAND-pain (Table 2). Out of the 33 patients that received CBT and completed both test days, 18 (55%) were successfully treated according to our predefined criteria (van Der Schaaf et al., Reference van Der Schaaf, Schmits, Roerink, Geurts, Toni, Roelofs and Knoop2015). The CBT and WL groups did not differ on age, education, disease duration or time between assessments. For HC no significant changes were observed on CIS-fatigue (T 21 = −5.818, p = 0.062), POMS-fatigue (T 23 = 0.597, p = 0.555), RAND-pain (T 21 = 0.0350, p = 0.972) or BDI (T 21 = 1.250, p = 0.225).
Pearson correlations within the CBT group revealed that CIS-fatigue and POMS-fatigue were not correlated on T0 (N = 72, r = 0.145, p = 0.224). Pain-occurrence and RAND-pain were significantly correlated on T0 (N = 67, r = −0.643, p = <0.001). There were also correlations between CIS-fatigue and pain-occurrence (r = 0.24, p = 0.048) and between POMS-fatigue and RAND-pain(r = 0.28, p = 0.018). The change in CIS-fatigue, POMS-fatigue, RAND-pain and Pain occurrence between T1 and T0 were all significantly correlated (p < 0.03, all r between 0.27 and 0.69).
Baseline
No significant group differences were observed between the connectivity matrices of ME/CFS patients and HC at baseline (Fig. 2a, Table 3). However, regression analysis within the ME/CFS group revealed significant correlations between network connectivity and fatigue/pain symptoms (Fig. 2b). Higher POMS-fatigue was associated with reduced connectivity between the SMN and DMN (T = −2.980, p fdr = 0.021) as well as with increased connectivity within the PMN (T = 2.835, p fdr = 0.021) and between the SMN and PMN (T = 2.823, p fdr = 0.021; Fig. 2b). These effects were specific to POMS-fatigue as they remained significant when including CIS-fatigue, pain occurrence and RAND-pain as covariates (SMN-DMN: T = −2.897, p unc = 0.005; PMN-PMN: T = −2.805, p unc = 0.006; SMN-PMN: T = −2.584, p unc = 0.012). The relationship between fatigue and SMN-PMN connectivity was further specified by the seed-based analysis. POMS-fatigue symptoms were positively associated with connectivity between the SMN-seed and the SMA (T = 3.51, xyz = 14 270, p sv_fwe_cluster = 0.045; Fig. 2d). Note that this effect was only significant when correcting for the PMN small volume.
Baseline results on connectivity measures. (a) Visualization of the four networks that were included in the matrix analysis (all left). Connectivity matrices are shown for the ME/CFS group (left), HC (middle) and the difference between ME/CFS and HC at baseline (right). The lower triangle shows correlations for all regions, the upper triangle shows the reduced matrix with the averaged correlations per network connection. No significant group differences were observed. (b) Beta-values from the regression analysis with state fatigue across the testing day, as measured with the profile of moods state questionnaire, corrected for age and education (upper) and visualization of the correlation between state fatigue across the testing day and SMN-DMN connectivity (lower). (c) Beta-values from the regression analysis with pain severity corrected for age and education (upper) and visualization of the correlation between pain severity and the PMN-DMN network. (d) Results from the seed-based analysis showing regions of which connectivity with the SMN-seed was positively correlated with state fatigue across the testing day (T = 3.51, xyz = 14 270, p fwe_cluster = 0.045, small volume corrected for the PMN). This result replicates one of the findings shown in b. (e) Results from the seed-based analysis showing regions of which connectivity with the PMN-seed was positively correlated with pain severity (T = 6.16, p wb_fwe_cluster < 0.001, xyz = −401 632, no small volume correction). This result complements the trend shown in c. Clusters are shown with p < 0.001 uncorrected. ME/CFS, myalgic encephalomyelitis/chronic fatigue syndrome; HC, healthy controls; SMN, Somato motor network; PMN, Premotor network; DMN, Default mode network; FPN, Fronto parietal network. ** p < 0.05 fdr-corrected for multiple comparisons, * p < 0.05 uncorrected. Abbreviations of the individual regions in the matrix can be found in online Supplementary Table S1.

Pearson correlations (s.e.m.) within and between the four networks for ME/CFS and HC at baseline

SMN, somato-motor network; DMN, default mode network; FPN, fronto-parietal network; PMN, premotor network; ME/CFS, myalgic encephalomyelitis/chronic fatigue syndrome; HC, healthy controls.
None of the group comparisons were significant.
Higher RAND-pain was associated with reduced connectivity between PMN and DMN (T = −3062, p fdr = 0.031). This relationship between pain and PMN-DMN connectivity was not supported by seed-based analysis from the PMN-seed. There was also a non-significant trend for an association between RAND-pain and connectivity between the PMN and FPN (T = 2.525, p fdr = 0.069) (Fig. 2c). Both remained when including CIS-fatigue, POMS-fatigue and pain occurrence as covariates (PMN-DMN: T = 2.717, p unc = 0.009; PMN-FPN: T = 2.484, p unc = 0.016). Exploratory seed-based analysis supported this trend for PMN-FPN connectivity. Higher levels of both RAND-pain and pain occurrence were associated with lower functional connectivity between the PMN-seed and the left dorsolateral prefrontal cortex (severity: T = 6.16, p wb_fwe_cluster <0.001, xyz = −401 632; occurrence: T = 4.53, p wb_fwe_cluster < 0.002, xyz = −381 432; Fig. 2e). Note that the p values survived our correction for exploratory whole-brain analyses. The clusters were located within the FPN, but did not overlap with our DLPFC-seed, which was located more anteriorly.
No significant correlations were found between the networks and CIS-fatigue and pain occurrence (Table 4).
Beta values of the relationships between connectivity (z scored Pearson correlation) and the four covariates of interest within the ME/CFS group at baseline

SMN, somato-motor network; DMN, default mode network; FPN, fronto-parietal network; PMN, premotor network. Fatigue on testing day was measured using the Profile of Mood State questionnaire (POMS)
Age and education were included as covariates of no interest. ** p < 0.05 fdr corrected for multiple comparison, * p < 0.05 uncorrected.
Treatment
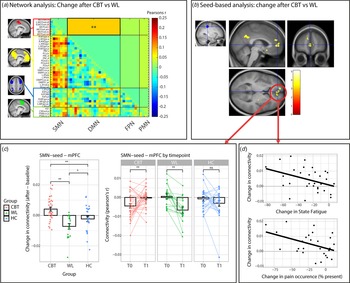
CBT increased SMN-DMN connectivity compared to the WL (T = −3.045, beta = −0.084, p fdr = 0.038) (Fig. 3a). Connectivity was increased after CBT (T = 2.106, beta = 0.116, p unc = 0.039), decreased after the WL (T = −2.527, beta = −0.130, p unc = 0.017) and did not change in the HC group (T = −0.976, beta = −0.040, p unc = 0.334). Further post hoc analysis revealed that the CBT and WL group did not differ at baseline/T0 (all p unc > 0.2), but SMN-DMN was higher in the CBT compared to the WL group on T1 (T = −2.697, beta = −0.062, p unc = 0.010) (Table 5). These treatment-group effects were extended by the seed-based analysis (Fig. 3b). Compared to the WL, CBT increased connectivity between SMN-seed and the medial prefrontal cortex (mPFC: T = 4.28, p wb_cluster < 0.001, xyz = −14 584) and precuneus (T = 4.90, p wb_cluster < 0.001, xyz = 4,−50,30). Seed-based connectivity was increased after CBT (mPFC: T 32 = 3.168, p = 0.003; precuneus: T32 = 2.844, p = 0.008), decreased after WL (mPFC; T 17 = −4.001, p = 0.001; precuneus: T 17 = −3.753, p = 0.002) and did not change in the HC group (mPFC; T 23 = −1.280, p = 0.21; precuneus: T 23 = 0.625, p = 0.54). Moreover, direct comparisons with the HC group (group by time interactions) revealed that the increase in SMNseed-mPFC connectivity was driven by the CBT group (CBT v. HC: F 53,1 = 7.535, p = 0.008; WL v. HC: F 38,1 = 4178, p = 0.048), while the change in SMN-seed-precuneus connectivity was driven by the WL group (WL v. HC: F 38,1 = 6.428, p = 0.015; CBT v. HC: F 53,1 = 1.399, p = 0.24).
Treatment effects (T1 minus T0) on connectivity measures. (a) Visualization of the four networks that were included in the matrix analysis (all left). Change in connectivity (T1 minus T0) is shown for CBT v. WL. The lower triangle shows correlations for all regions, the upper triangle shows the reduced matrix with the averaged correlations per network connection. CBT significantly increased connectivity between SMN and DMN compared to WL (T = −3.045, beta = −0.084, p fdr = 0.038). ** p < 0.05 fdr-corrected for multiple comparisons. (b) Confirmation of the network analysis by the seed-based analysis using the SMN-seed (left). CBT increased connectivity in the mPFC and Precuneus compared to WL. (c) Visualization of the change in SMNseed-mPFC connectivity in the CBT, WL, and HC groups. An increase in SMNseed-mPFC connectivity was driven by the CBT group (CBT v. HC: F 53,1 = 7.535, p = 0.008), while a smaller decrease was observed for the WL group (WL v. HC: F 38,1 = 4178, p = 0.048). * = p < 0.05, ** = p < 0.01, ns, not significant. (d) Correlations between SMNseed-mPFC connectivity and the clinical measures state fatigue across the testing day (beta = −0.42, p = 0.023) and pain occurrence (beta = −0.47, p = 0.029) within the CBT group. CBT, cognitive behavioral therapy; WL, waiting list; SMN, somato motor network; PMN, premotor network; DMN, default mode network; FPN, fronto parietal network; mPFC, medial prefrontal cortex. ** p < 0.05 fdr-corrected for multiple comparisons, * p < 0.05 uncorrected. Abbreviations of the individual regions in the matrix can be found in online Supplementary Table S1.

Change in Fisher's z transformed correlations (s.e.m.) within and between the four networks for CBT, WL, and HC.

SMN, somato-motor network; DMN, default mode network; FPN, fronto-parietal network; PMN, premotor network; ME/CFS, myalgic encephalomyelitis/chronic fatigue syndrome; HC, healthy controls.
** p < 0.05 fdr corrected for multiple comparisons. * p < 0.05 uncorrected.
Regression analysis within the CBT group on extracted data from these mPFC and precuneus clusters revealed that reductions in fatigue and pain were only associated with increased SMN-seed-mPFC connectivity (ΔCIS-fatigue: R 2 = 0.20, beta = −0.46, T 3,29 = −2.651, p = 0.013; ΔState-fatigue: R 2 = 0.17, beta = −0.42, T 3,29 = −2.407, p = 0.023; Δpain-Occurrence: R 2 = 0.20, beta = −0.47, T 3,24 = −2.328, p = 0.029; but not ΔRand-pain: R 2 = 0.053, beta = 0.24, T 3,29 = 1.253, p = 0.220) (Fig. 3d) and not with changes in SMN-seed-precuneus connectivity (all p > 0.05). These changes were not specific to either pain or fatigue: none of the covariates remained significant when all 4 variables were included into one model (all p > 0.05). Regression analysis within the CBT group on data from the network analysis did not yeald any signifIcant relationships with symptom measures (Table 6).
Beta values of the relationships between the change in connectivity (z scored Pearsons correlation) and the change in the four covariates of interest within the CBT group

SMN, somato-motor network; DMN, default mode network; FPN, fronto-parietal network; PMN, premotor network. Fatigue on testing day was measured using the Profile of Mood State questionnaire (POMS)
Age and education were included as covariates of no interest. ** p < 0.05 fdr corrected for multiple comparisons, * p < 0.05 uncorrected.
Discussion
This study aimed to dissociate neural networks associated with pain and fatigue symptoms in in ME/CFS. Results revealed partly dissociable networks, with modality specific involvement of sensory-motor networks in fatigue (SMN-DMN) and premotor networks in pain (PMN-DMN), and common involvement of the DMN. CBT led to improvements in both fatigue and pain, compared to WL, which were associated with increased prefrontal (i.e. mPFC within the DMN) modulation of the fatigue-related SMN, but not of the pain-related PMN. These results progress the ME/CFS field in several ways. First, they highlight the need for better understanding of the differential role of these networks in the etiology of fatigue and pain symptoms in ME/CFS, in order to better tailor treatments to these symptoms. Second, they provide insight on the mechanisms of change in CBT-responsive patients, but also provide new leads toward improving and individualizing existing treatments or develop new (non-behavioral) treatments.
Results showed that communication of the SMN with the PMN and DMN was specifically associated with between-participants variance in fatigue across the testing day, over and above the contribution of variance related to pain occurrence, pain disability and CIS-fatigue. This is in line with our hypothesis and previous reports on sensorimotor involvement in fatigue in multiple sclerosis (MS) (Hidalgo de la Cruz et al., Reference Hidalgo de la Cruz, d'Ambrosio, Valsasina, Pagani, Colombo, Rodegher and Rocca2018), stroke (De Doncker, Dantzer, Ormstad, & Kuppuswamy, Reference De Doncker, Dantzer, Ormstad and Kuppuswamy2018; Kuppuswamy, Rothwell, & Ward, Reference Kuppuswamy, Rothwell and Ward2015), perinatal stroke (Wrightson, Zewdie, Kuo, Millet, & Kirton, Reference Wrightson, Zewdie, Kuo, Millet and Kirton2020) and ankylosing spondylitis (Liu et al., Reference Liu, Liao, Zhang, Lin, He, Fang and Gu2020) and generalize our previously reported task-related effects of fatigue (van der Schaaf et al., Reference van der Schaaf, Roelofs, de Lange, Geurts, van der Meer, Knoop and Toni2018) to resting-state connectivity. The lack of relationship with CIS-fatigue may relate to the low variability in CIS-fatigue scores as patients were selected to be severely fatigued on this score. It may also suggest that SMN-PMN connectivity more likely reflects the daily fatigue, rather than overall fatigue measured retrospectively across 2 weeks. Daily fatigue was measured as the average score on the POMS-subscale fatigue across three measurements during the test day. It was higher and more variable in ME/CFS patients compared to HC and reduced after CBT compared to WL. Accordingly this measure of overall fatigue during the testing day likely also captures clinical aspects of fatigue that was independent from patient selection.
Alterations in sensorimotor function have been linked physiological fatigue after 40 min on a bicycle ergometer (Hu et al., Reference Hu, Casamento-Moran, Galaro, Chan, Edden, Puts and Chib2022) and effort-perception (Zenon, Sidibe, & Olivier, Reference Zenon, Sidibe and Olivier2015). Specifically, current neurobiological accounts state that fatigue and high effort perception arise when sensory consequences of actions (processed in sensorimotor regions) do not match the proprioceptive prediction (i.e. the efference copy signaled by the SMA) (Greenhouse-Tucknott et al., Reference Greenhouse-Tucknott, Butterworth, Wrightson, Smeeton, Critchley, Dekerle and Harrison2022; Kuppuswamy, Reference Kuppuswamy2021; Stephan et al., Reference Stephan, Manjaly, Mathys, Weber, Paliwal, Gard and Petzschner2016). Thus, when muscle performance reduces after prolonged activity, compared to the initially planned or desired performance, a prediction error occurs, signaling fatigue. The observed increase in connectivity between premotor and sensorimotor networks may therefore reflect altered communication between the SMA that signals intended actions plans and the SMN that signals the actual sensory consequence of those actions. It might be possible that the resulting prediction errors arise quicker in ME/CFS patients, or are not adequately resolved by rest. This could explain the elevated sense of effort and prolonged recovery time after exercise in ME/CFS patients (Barhorst et al., Reference Barhorst, Andrae, Rayne, Falvo, Cook and Lindheimer2020). To further investigate this, future research could assess sensorimotor functioning during and after physical exertions tasks.
In line with our hypotheses and a previous study linking DLPFC gray matter volume in ME/CFS to pain rather than fatigue (van der Schaaf et al., Reference van der Schaaf, De Lange, Schmits, Geurts, Roelofs, van der Meer and Knoop2017), the current study also suggests modality specific involvement of DLPFC connectivity in pain. There was a non-significant trend for a relationship between pain and PMN-FPN connectivity, and seed-based analysis further specified that SMA-DLPFC connectivity was driven by RAND-pain and pain-occurrence and not by CIS-fatigue or POMS-fatigue. DLPFC's connection with premotor regions has recently been associated with movement-evoked pain in chronic low back pain patients (Wang et al., Reference Wang, Ho, Gatto, van der Veen, Underation, Thomas and Coombes2021). Moreover, a meta-analysis linked SMA and premotor regions to pain-related motor function, while its connection with the DLPFC is important for selecting appropriate responses to pain (de la Vega, Chang, Banich, Wager, & Yarkoni, Reference de la Vega, Chang, Banich, Wager and Yarkoni2016). Accordingly, this connection potentially relates to the motor consequences of pain symptoms, which is consistent with the RAND-pain measure which not only assesses pain severity, but also its impact on daily activities.
Lower connectivity of the DMN with the SMN and PMN were associated with more fatigue and pain symptoms, respectively. This is in line with reports of decreased DMN connectivity with non-DMN networks in both pain and fatigue pathologies (Davis & Moayedi, Reference Davis and Moayedi2013; Farmer et al., Reference Farmer, Baliki and Apkarian2012; Maksoud et al., Reference Maksoud, du Preez, Eaton-Fitch, Thapaliya, Barnden, Cabanas and Marshall-Gradisnik2020). We hypothesized that CBT would also differentially modulate fatigue and pain related connections (i.e. DMN-SMN and DMN-PMN, respectively), but this is not what we observed. Instead, we observed that CBT-induced clinical improvements in both fatigue and pain (i.e. CIS-fatigue, POMS-fatigue, and pain occurrence) were related to increased connectivity between the frontal DMN and the fatigue-related SMN. Direct comparison with HC revealed that these changes of frontal DMN connectivity (i.e. mPFC) occurred in the CBT and not the WL group. Together, this suggests successful CBT involves frontal DMN modulation of modality specific fatigue-related cortical networks
The DMN and vmPFC have been associated with the evaluation of current and future bodily states (Gottfried, O'Doherty, & Dolan, Reference Gottfried, O'Doherty and Dolan2003; Hare, O'Doherty, Camerer, Schultz, & Rangel, Reference Hare, O'Doherty, Camerer, Schultz and Rangel2008; Robinson & Berridge, Reference Robinson and Berridge2013; Wagner, Rutgen, Hummer, Windischberger, & Lamm, Reference Wagner, Rutgen, Hummer, Windischberger and Lamm2020) which modulates sensory perception and motivated behavior, through their connections with sensorimotor and premotor regions (Adams, Shipp, & Friston, Reference Adams, Shipp and Friston2013; Ashar, Chang, & Wager, Reference Ashar, Chang and Wager2017; Bar, Reference Bar2007; Dohmatob, Dumas, & Bzdok, Reference Dohmatob, Dumas and Bzdok2020; Geuter, Koban, & Wager, Reference Geuter, Koban and Wager2017). This makes it a central network that is particularly important for allostasis i.e. the ability to control behavior (including autonomic responses) in anticipation of homeostatic disturbances (Ashar et al., Reference Ashar, Chang and Wager2017; Geuter et al., Reference Geuter, Koban and Wager2017; Stephan et al., Reference Stephan, Manjaly, Mathys, Weber, Paliwal, Gard and Petzschner2016). The observed reduced connectivity of the DMN with PMN and SMN in patients with more pain and fatigue may therefore point toward suboptimal integration of anticipated consequences of actions on bodily states and current sensory/introspective processing and motor planning. At a behavioral level, this may result in biased action-selections that depend on anticipated effort-costs or pain, including avoidance of activities that are expected to cause (too much) fatigue or pain (Becker, Gandhi, & Schweinhardt, Reference Becker, Gandhi and Schweinhardt2012; Hogan, Chen, Teh, & Chib, Reference Hogan, Chen, Teh and Chib2020; Iodice et al., Reference Iodice, Ferrante, Brunetti, Cabib, Protasi, Walton and Pezzulo2017; Kuppuswamy, Reference Kuppuswamy2021; Lacourt et al., Reference Lacourt, Vichaya, Escalante, Manzullo, Gunn, Hess and Dantzer2018a; Muller, Klein-Flugge, Manohar, Husain, & Apps, Reference Muller, Klein-Flugge, Manohar, Husain and Apps2021; van der Schaaf et al., Reference van der Schaaf, Roelofs, de Lange, Geurts, van der Meer, Knoop and Toni2018). CBT may be effective (at least in a subset of patients) by regaining the modulatory role of the vmPFC on sensory-motor regions, thereby reducing discrepancies between anticipated and actual sensory consequences of actions. Indeed, CBT for ME/CFS aims to reduce fatigue by changing cognitions and expectations about fatigue-related activities, to ultimately reduce fatigue and improve self-efficacy to control fatigue. As CBT was focused on fatigue, rather than pain, it may have more strongly affected the fatigue related SMN network. Alternatively, SMN modulation may have simultaneously reduced pain by altering sensory processing of pain. Unfortunately, as changes in fatigue and pain were highly correlated, we cannot state whether the change in SMN-DMN connectivity reflects the change in both symptoms or in fatigue only. Additionally, as CBT was compared to a WL condition, it remains to be determined whether these effects are specific to CBT or whether other (behavioral) treatments may have similar effects.
Some limitations of the current study need to be addressed. First, limiting analysis to a selection of a priori defined networks (van der Schaaf et al., Reference van der Schaaf, De Lange, Schmits, Geurts, Roelofs, van der Meer and Knoop2017; van der Schaaf et al., Reference van der Schaaf, Roelofs, de Lange, Geurts, van der Meer, Knoop and Toni2018), may have excluded some pain- or fatigue-related regions. However, exploratory uncorrected whole brain analyses (online Supplementary Results and Figs S3–S6) confirmed our main results and point toward potential involvement of cerebellar, basal ganglia and mesolimbic networks which require further confirmation in new independent samples.
Second, in contrast to our expectations, there were no baseline differences between ME/CFS patients and healthy controls. One possibility is that only a subset of ME/CFS patients shows reduced connectivity at baseline, and that this did not surface in a group comparison. This may limit conclusions about a clear disease-related pathology. Another reason for a lack of difference is that ME/CFS is a heterogeneous condition and involves various symptoms that contribute with varying extend to the clinical presentation of ME/CFS. The substantial individual variability in symptom profiles may result in variable changes across brain networks that may not surface in a group comparison (van der Schaaf et al., Reference van der Schaaf, De Lange, Schmits, Geurts, Roelofs, van der Meer and Knoop2017).
The main aim of this study was to gain insight into symptom specific pathology in ME/CFS and to identify partly dissociable patterns of neural connectivity for pain and fatigue symptoms. This requires assessment of the relationships between (changes in) symptoms and (changes in) connectivity measures within the patient group itself (Kuppuswamy, Reference Kuppuswamy2023), rather than a group comparison with healthy controls. The lack of group differences and presence of symptom specific associations further highlights the need for a multidimensional approach to ME/CFS, where various combinations of symptoms expressions may relate to different underlying (neuro)biological pathologies.
Although the current study used the U.S. Centers for Disease Control (CDC)-criteria for ME/CFS (revised in 2003) (Fukuda et al., Reference Fukuda, Straus, Hickie, Sharpe, Dobbins and Komaroff1994; Reeves et al., Reference Reeves, Lloyd and Vernon2003), as preregistered (van Der Schaaf et al., Reference van Der Schaaf, Schmits, Roerink, Geurts, Toni, Roelofs and Knoop2015), there was considerable overlap with the Canadian and Institute of Medicine criteria (see the online Supplement of van der Schaaf et al. (Reference van der Schaaf, De Lange, Schmits, Geurts, Roelofs, van der Meer and Knoop2017). Accordingly, similar variability in symptoms is expected from alternative ME/CFS criteria.
Third, CBT was only effective in a subset of patients and only affected some neural networks, highlighting the need to further investigate why some patients benefit from CBT and others do not. In addition, as baseline results were correlational no causality can be inferred. It remains unclear whether altered connectivity reflected a ‘central’ or cognitive problem, or whether it results from persistent peripheral abnormalities. Studies assessing in whom and to what extend neural networks and symptoms are affected by central and peripheral causes are therefore warranted. While the former could be effectively treated by CBT or non-invasive brain-stimulation of sensorimotor regions (Ashrafi, Mohseni-Bandpei, & Seydi, Reference Ashrafi, Mohseni-Bandpei and Seydi2020; Cancelli et al., Reference Cancelli, Cottone, Giordani, Migliore, Lupoi, Porcaro and Tecchio2018; Porcaro et al., Reference Porcaro, Cottone, Cancelli, Rossini, Zito and Tecchio2019; Zenon et al., Reference Zenon, Sidibe and Olivier2015), the latter would require a better understanding of potential biological factors that may underlie ME/CFS (Proal & VanElzakker, Reference Proal and VanElzakker2021), including altered immune function (Raijmakers et al., Reference Raijmakers, Jansen, Keijmel, Ter Horst, Roerink, Novakovic and Bleeker-Rovers2019a; Raijmakers et al., Reference Raijmakers, Koeken, Jansen, Keijmel, Roerink, Joosten and Bleeker-Rovers2019b; Raijmakers et al., Reference Raijmakers, Roerink, Jansen, Keijmel, Gacesa, Li and Xu2020; VanElzakker, Brumfield, & Lara Mejia, Reference VanElzakker, Brumfield and Lara Mejia2018), altered expression of the tryptophan-catabolizing enzyme indoleamine 2,3-dioxygenase-2 (IDO2) (Guo et al., Reference Guo, Appelman, Mooij-Kalverda, Houtkooper, van Weeghel and Vaz2023), changes in energy metabolism (Lacourt, Vichaya, Chiu, Dantzer, & Heijnen, Reference Lacourt, Vichaya, Chiu, Dantzer and Heijnen2018b), muscle function (Soares et al., Reference Soares, Eggelbusch, Naddaf, Gerrits, van der Schaaf, van den Borst and Wust2022) and/or (neuro) inflammation (Albrecht et al., Reference Albrecht, Forsberg, Sandstrom, Bergan, Kadetoff, Protsenko and Loggia2019; Nakatomi et al., Reference Nakatomi, Mizuno, Ishii, Wada, Tanaka, Tazawa and Watanabe2014; Nieuwland et al., Reference Nieuwland, Nutma, Philippens, Boszormenyi, Remarque, Bakker and Middeldorp2023) (but see (Raijmakers et al., Reference Raijmakers, Roerink, Keijmel, Joosten, Netea, van der Meer and Doorduin2022). Together, this could ultimately improve and individualize both existing treatments, while also providing insights for new treatment-targets.
Using the largest sample of ME/CFS patients to date, this study highlights specific roles for SMN and DLPFC connectivity in fatigue and pain symptoms, respectively, that are commonly modulated by the DMN. CBT may reduce symptoms in CBT-responsive patients by altering DMN modulation of modality specific networks. Further investigation of the specific roles of these networks in fatigue and pain symptoms and how they are affected by cognitive and/or biological factors are warranted to better individualize existing and new treatments for ME/CFS.
Supplementary material
The supplementary material for this article can be found at https://doi.org/10.1017/S0033291723003690
Acknowledgements
This work was supported by an EFIC-GRUNENTHAL Grant (EGG ID 357575252) granted to J Oosterman, and by a private foundation that wishes to stay anonymous, granted to H. Knoop. The identity of the latter foundation was disclosed to the editors and does not constitute, to the Journal's understanding, a conflict of interest. The funder had no role in the study design, data collection, data analysis, decision to publish, or preparation of the manuscript. All listed authors concur in submission and the final manuscript has been approved by all. Experimental procedures have been conducted in conformance with the policies and principles contained in the Federal Policy for the Protection of Human Subjects and in the Declaration of Helsinki. We would like to thank Iris Schmits for her assistance in data collection and trial coordination and all the therapists of the Dutch Expertise Centre for Chronic Fatigue for their co-operation and help during this trial.
Competing interests
Hans Knoop receives royalties for a published manual of CBT for CFS. All other authors report no biomedical financial interests or potential conflicts of interest.


 Open access