


Significant Outcomes
-
• Baseline metabolic differences related to mitochondrial and neurotransmitter function observed in the FSL better describes the role of bioenergetic systems in this genetic model of depression.
-
• That metabolic changes are seemingly marginally more pronounced in the FRL rats after environmental stress was applied, suggests that the differential susceptibility paradigm might apply to the FSL and FRL genetic model of depression.
-
• The metabolic alterations observed in the stressed and non-stressed FSL/FRL rats expand our mechanistic understanding related the use of this model as a model for childhood depression.
Limitations
Although useful, the untargeted screening tool used in this study, must be confirmed with in-depth analysis of specific markers or pathways highlighted here. Secondly, although valuable, these findings generalise metabolic differences and require brain region-specific confirmation. Lastly, a longitudinal approach in the study design would further elucidate the metabolic changes of each group over time, especially when combined with behavioural analyses.
Introduction
The adult FSL rat is a validated model of depression (Overstreet & Wegener, Reference Overstreet and Wegener2013), yet their juvenile counterparts remain comparatively underexplored. Limited data regarding its depressive-like phenotype (Malkesman et al., Reference Malkesman, Braw, Zagoory-Sharon, Golan, Lavi-Avnon, Schroeder and Weller2005) does however support its value as a model for childhood depression as well. Specifically, reports of hypocortisolism (Malkesman et al., Reference Malkesman, Braw, Maayan, Weizman, Overstreet, Shabat-Simon and Weller2006), monoaminergic deficiencies (Malkesman et al., Reference Malkesman, Braw, Ram, Maayan, Weizman, Kinor and Weller2008), and compromised hippocampal redox status (Whitney et al., Reference Whitney, Lindeque, Kruger and Steyn2024) have been documented, together with increased behavioural despair, psychomotor agitation (Whitney et al., Reference Whitney, Lindeque, Kruger and Steyn2024), altered social behaviour (Malkesman et al., Reference Malkesman, Braw, Maayan, Weizman, Overstreet, Shabat-Simon and Weller2006), and altered brain (Whitney et al., Reference Whitney, Lindeque, Kruger and Steyn2024) and body (Malkesman et al., Reference Malkesman, Braw, Maayan, Weizman, Overstreet, Shabat-Simon and Weller2006) weight. Age-dependent differences in the clinical presentation of depression, may be associated with age-variable brain metabolism (Konarski et al., Reference Konarski, Kennedy, McIntyre, Rafi-Tari, Soczynska and Mayberg2007). Nevertheless, there is limited understanding of how changes in bioenergetic pathways contribute to the depressive-like phenotype of the FSL rat and how these effects are further modulated by stress. The few studies that have however studied the bioenergetic system of the FSL strain, highlight mechanistic deviances that point towards mitochondrial dysfunction as a contributing construct in the pathophysiology of their depressive-like phenotype (Steyn, Reference Steyn2025), supporting the literature of the human condition (Allen et al., Reference Allen, Romay-Tallon, Brymer, Caruncho and Kalynchuk2018). Therefore, investigating early-life adversity in the form of MSEW in juvenile FSL rats (and their age-matched FRL controls), together with untargeted metabolomic profiling may provide unique insight into these underlying mechanisms.
Materials and methods
Experimental layout
Brain tissue was collected in a previous study (Roets et al., Reference Roets, Brand and Steyn2023), where postpartum dams (FRL, n = 15; FSL, n = 20) and their pups were either separated daily from PND02 to 16 for 3h (MSEW), or not. Pups in the MSEW groups were then also weaned earlier than those in the control groups. All pups were euthanized via decapitation on PND25, when whole brains were removed, snap frozen in liquid nitrogen and stored at −80°C for biochemical analyses. As summarised in Figure 1, a total of 50 offspring samples (FRL, n = 24; FSL, n = 26) were used.
Schematic study layout male (blue) and female (pink) Flinders line offspring were either subjected to MSEW, or not. Animals in the MSEW groups (groups 2 and 4) were weaned on PND17, whereas the control groups (groups 1 and 3) were only weaned on PND21. Following weaning, animals were group housed, according to sex and left undisturbed until study endpoint (PND25). EW: Early weaning; FRL: Flinders resistant line; FSL: Flinders sensitive line; MS: Maternal separation; PND: Postnatal day.

Tissue collection, storage, and analysis
Animals were bred, supplied by and housed at the PCDDP Vivarium (SAVC reg: FR15/13458; SANAS GLP compliance: G0019; AAALAC accreditation file: #1717) of the NWU. Adult female rats were individually housed with their litter until PND17 (MSEW) or PND21 (control; CRL), whereafter the dams performed a number of behavioural tests before being euthanized (together with the pups on PND25) (Roets et al., Reference Roets, Brand and Steyn2023). Consequently, no behavioural analyses were performed in the pups. During this time, corncob bedding was changed weekly, and environmental temperatures maintained at 22 ± 2°C in a relative humidity of 55 ± 15%. A 12h light/dark cycle was also followed with food and water provided ad libitum. An even distribution of male and female samples was allocated to each experimental group.
As previously described (Lindeque et al., Reference Lindeque, Hidalgo, Louw and van der Westhuizen2013), untargeted gas chromatography time-of-flight mass spectrometry (GC-TOF-MS) was performed on the whole brain tissue of Flinders line rats. Metabolites were extracted from tissue samples with a modified Bligh-Dyer extraction method (Wu et al., Reference Wu, Southam, Hines and Viant2008). Extracts were dried under nitrogen and stored at −80°C until day of analysis, when they were derivatized (Lindeque et al., Reference Lindeque, Hidalgo, Louw and van der Westhuizen2013) before undergoing untargeted analysis.
Power and statistical analyses
Statistical analyses were performed in IBM® SPSS® Statistics, GraphPad Prism® and MetaboAnalyst®, with the initial power analysis performed in G*Power®. An a priori test, set at a large effect size, 0.05 α error probability, and 80% power, and followed up with a Sensitivity analysis, justified the group sizes. To identify any statistically significant metabolomic parameters, the entire data set was first screened with MetaboAnalyst®, using an ordinary two-way ANOVA, a p-value of 0.10, and a False discovery rate multiple comparison method. Following identification of significant parameters, necessary data sets were then screened for statistical outliers. Because of the general lack of normal distribution, all data sets were log transformed prior to follow-up ANOVA analyses, with any identified outliers, removed. Due to the pre-pubertal age of these animals, sex was not considered to be a significant influencing factor. Still, following initial analysis, a three-way ANOVA was run to test this hypothesis. Based on these confirmatory results, only the strain*challenge interaction was used to evaluate the ten identified metabolomic parameters. In all instances, statistical significance was set at a p-value ≤ 0.05. All post hoc analyses are reported as Bonferroni-adjusted values and elaborated on with effect magnitude calculations (partial eta squared (η p 2 ) and unbiased Cohen’s d (d unb )). Detail regarding the statistical analyses are available as supplementary data.
Results
Sex had no statistically significant influence on any of the identified parameters (p > 0.05), with the overall effect of sex on the identified parameters, considered small (mean η p 2 = 0.03 [0.01; 0.05]). Consequently, all identified metabolomic parameters were analysed, independent of sex, with statistical findings and details reported below and summarised in Figure 2.
Heat map summary of untargeted metabolomic results. The mean log-transformed metabolomic values of each experimental group is presented as a single square, with the shading of the colour, positively correlating with lower whole-brain concentrations. Colours must be compared and interpreted horizontally. CRL: control; FRL: Flinders resistant line; FSL: Flinders sensitive line; MSEW: maternal separation with early weaning.

Statistically significant strain*ELA interactions were only observed for 2-aminopentanoic acid (F 1,40 = 8.01, p = 0.01, η p 2 = 0.17), glutamine (F 1,39 = 6.90, p = 0.01, η p 2 = 0.15), lactate (F 1,41 = 6.96, p = 0.05, η p 2 = 0.09) and valine (F 1,40 = 7.13, p = 0.01, η p 2 = 0.15). Compared to FRLCRL rats, FSLCRL counterparts had lower whole-brain 2-aminopentanoic acid (p = 0.004, d unb = 1.2 [0.3; 2.2]), glutamine (p = 0.002, d unb = 1.2 [0.2; 2.1]), lactate (p = 0.02, d unb = 1.2 [0.4; 2.2]) and valine (p = 0.006, d unb = 1.2 [0.3; 2.1]) values. Similarly, MSEW-exposure in FRL (p 2-aminopentanoic acid < 0.001, d unb = 1.7 [0.7; 2.8]; p glutamine < 0.001, d unb = 1.4 [0.5; 2.4]; p lactate = 0.003, d unb = 0.8 [−0.1; 1.7]; p valine < 0.001, d unb = 1.7 [0.8; 2.8]) but not FSL (p 2-aminopentanoic acid = 0.95, d unb = 0.2 [−1.0; 0.6]; p glutamine = 0.63, d unb = 0.1 [−0.9; 0.7]; p lactate = 0.65, d unb = 0.1 [−0.8; 0.7]; p valine = 0.97, d unb = 0.2 [−0.9; 0.6];) rats lead to decreased values, relative to strain matched controls.
Despite the absence of a statistically significant interaction between the influencing factors, the main effect of ELA influenced whole-brain 2-keto-3-methylbutyric acid (F 1,41 = 8.35, p = 0.006, η p 2 = 0.17), GABA (F 1,41 = 14.97, p < 0.001, η p 2 = 0.27), glutamate (F 1,41 = 11.91, p = 0.001, η p 2 = 0.23), glycerophosphate (F 1,41 = 13.91, p < 0.001, η p 2 = 0.25), phenylalanine (F 1,39 = 13.21, p < 0.001, η p 2 = 0.25), and urea (F 1,39 = 33.60, p < 0.001, η p 2 = 0.46) values. In line with this effect, MSEW animals (irrespective of strain) had higher 2-keto-3-methylbutyric acid, glycerophosphate and urea values, together with lower GABA, glutamate and phenylalanine values, relative to non-MSEW controls.
Finally, the main effect of strain reached statistically significance for whole-brain urea concentrations (F 1,39 = 6.58, p = 0.01, η p 2 = 0.14), with FSL rats (irrespective of ELA) presenting with higher values than their FRL controls.
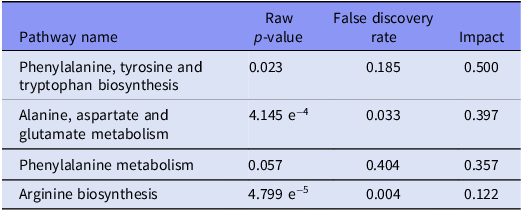
As summarised in Figure 3 and Table 1, phenylalanine biosynthesis and metabolism, alanine, aspartate and glutamate metabolism, and arginine biosynthesis were the pathways most impacted.
Pathway analyses. The pathways with −log10(p)-values (enrichment; y-axis) ≥ 3 and/or impact value (x-axis) ≥ 0.3 are labelled in the figure. Larger size bubbles and darker colours are representative of greater enrichment and impact significance.

Top four metabolic pathways altered. The listed pathways were most significantly influenced (i.e., largest impact) by the investigated factors (i.e., strain and MSEW). The pathways are listed in descending order of impact, as indicated by the pathway analyses, performed in MetaboAnalyst®

Discussion
Insight into the bioenergetic profile of juvenile FSL rat, remains underexplored. Therefore, an untargeted metabolomic profile of the juvenile Flinders line strain was performed to improve our mechanistic understanding of this model and elucidate bioenergetic constructs that may relate to its depressive-like phenotype.
It is significant that several strain differences, independent of early-life adversity, between juvenile FRL and FSL pups were detected in PND25 whole-brain samples. FSL pups had lower 2-aminopentoic acid (norvaline), glutamine and valine, together with increased urea concentrations. Valine, a proteinogenic, branched chain amino acid obtained from the diet, is responsible for the synthesis of succinyl-CoA that enters into the tricarboxylic acid cycle (Zhang et al., Reference Zhang, Zeng, Ren, Mao and Qiao2017). Importantly, valine supplementation can enhance bioenergetic function via various mechanisms, including increasing the NAD/NADH ratio, which in turn enhances oxidative phosphorylation activity and ATP production (Sharma et al., Reference Sharma, Zhang, Azhar, Patyal, Verma, Kc and Wei2024). Decreased levels could therefore point towards decreased energy production. On the other hand, norvaline, the unbranched, non-proteinogenic isomer of valine, has antioxidant properties via its arginase inhibiting properties. This is noteworthy, as whole-brain samples of FSL pups contained decreased norvaline concentrations, which could therefore contribute to the compromised antioxidant profile, noted in adult FSL rats (Steyn, Reference Steyn2025). Moreover, that the arginine biosynthesis pathway (Figure 3) displays a strong enrichment signal, potentially links the decreased norvaline and increased urea levels observed in the FSL pup samples. The absence of norvaline’s inhibitory activity in the arginine pathway may account for the elevated urea levels, which has notable pathological metabolic implications, currently investigated in neurodegenerative research (Polis & Samson, Reference Polis and Samson2019). The final significant strain marker identified was reduced whole-brain glutamine levels in FSL pups. Glutamine, although an important precursor for the synthesis of various peptides, proteins and amino acids, primarily produces glutamate (Newsholme et al., Reference Newsholme, Procopio, Lima, Pithon-Curi and Curi2003). Glutamine is therefore not only associated with metabolic function and efficacy, but its decrease may also highlight other neurotransmitter dysfunctions implicated in major depressive disorder. Overall, untargeted whole-brain metabolomic analyses highlighted small strain differences (mean η p 2 = 0.05 [0.02; 0.09]) that point towards divergent bioenergetic pathways between juvenile FSL and FRL rats that may influence energy production and/or neurotransmission and even be sensitive to early-life stress.
The effect of maternal separation with early weaning
Together with the previously mentioned strain differences, all MSEW-exposed rats exhibited reduced GABA, glutamate and phenylalanine. In addition, 2-keto-3-methylbutyric acid, glycerophosphate and urea were increased in whole-brain samples of MSEW-exposed animals, irrespective of strain. The effect of MSEW on these parameters (mean η p 2 = 0.23 [0.17; 0.30]) was also larger than that of strain and aligns with an earlier reported ELA-induced proteomic profile in this strain (Piubelli et al., Reference Piubelli, Carboni, Becchi, Mathe and Domenici2011).
Phenylalanine directly effects metabolism and energy related systems (Piubelli et al., Reference Piubelli, Carboni, Becchi, Mathe and Domenici2011; Wu et al., Reference Wu, Ma, Li, Li, Zhang, Zhang and Bai2024). This is of special importance, as this pathway was not only greatly impacted (Figure 3) but that depletion of phenylalanine may exaggerate the effect of stressful stimuli (Leyton et al., Reference Leyton, Young, Pihl, Etezadi, Lauze, Blier and Benkelfat2000; Ruhé et al., Reference Ruhé, Mason and Schene2007). Secondly, that urea transporter B knockout animals display increased depressive-like behaviour (Li et al., Reference Li, Ran, Zhou, Lei, Zhou, Han and Yang2012), supports our findings of increased whole-brain concentrations in FSL rats (irrespective of ELA), which was also increased by MSEW. A potential mechanism through which urea concentrations could influence depressive symptoms might be via the urea-arginase pathway. It is further interesting, yet unexpected, that our analyses of whole-brain samples suggest MSEW-exposed animals (irrespective of strain) to have decreased lactate concentrations, relative to non-MSEW controls. Considered in conjunction with the elevated glycerophosphates associated with the glycerol-3-phosphate shuttle – an important energy-regulating system (Dhoundiyal et al., Reference Dhoundiyal, Goeschl, Boehm, Kubista and Hotka2022) – suggests that ELA may affect neuronal energy generation. Still, that depression is best known for its neurotransmitter dysfunction, it is significant that MSEW decreased whole-brain GABA and glutamate concentrations in whole-brain tissue of pre-pubertal Flinders line rats.
Despite only a small number of metabolites influenced by the strain*MSEW interaction, the effect could be considered moderate (mean η p 2 = 0.07 [0.03; 0.12]). In these instances, statistical differences were only evident within the FRL strain, where ELA decreased 2-aminopentanoic acid, glutamine, lactate and valine whole-brain concentrations. Moreover, these values were comparable to those of FSLMSEW counterparts and could be an indicator of the depressogenic effect of MSEW. Moreover, these differences could hint to different metabolic and mitochondrial sensitivity between FSL and FRL pups.
Conclusion
The above-mentioned strain differences suggests that juvenile FSL rats may have altered baseline metabolic deviances that are associated with energy metabolism and neurotransmitter activity. These metabolic differences must be interpreted alongside previously reported behavioural strain differences, observed at a similar age (Malkesman et al., Reference Malkesman, Braw, Zagoory-Sharon, Golan, Lavi-Avnon, Schroeder and Weller2005; Malkesman et al., Reference Malkesman, Braw, Maayan, Weizman, Overstreet, Shabat-Simon and Weller2006; Whitney et al., Reference Whitney, Lindeque, Kruger and Steyn2024; Kai et al., Reference Kai, Iglesias, Kõiv, Harro and Wegener2025). Consequently, these strain differences could contextualise the maturation of the juvenile FSL pup into the robust depressive-like phenotype, often described in adult rats. Secondly, ELA (in the form of MSEW), influenced metabolic processes, specifically energy regulation and excitatory/inhibitory neurotransmitter-related pathways in both strains. These effects confirm that environmental, or social stressors, can modulate metabolic function, irrespective of genetic predisposition. Interestingly, the effect of these stressors may be more significant in FRL rats, which represent a healthy population. In this case, that the applied stressor altered the metabolic signals of the FRL to match that of the FSLCRL rat, suggests that the FSL strain, at baseline, has a metabolic profile comparable to that of a stressed healthy individual. Taken together, the current findings support the value of further investigation into the bioenergetic constructs underpinning the juvenile and adult rodent models of depression.
Supplementary material
The supplementary material for this article can be found at https://doi.org/10.1017/neu.2026.10066.
Author contributions
DJvR: Data curation; Investigation; Methodology; Project administration; Validation; Visualisation; Writing (original draft, review and editing). AJW: Data curation; Investigation; Methodology; Project administration; Validation; Visualisation; Writing (review and editing). ZL: Data curation; Formal analysis; Investigation; Methodology; Resources; Validation; Visualisation; Writing (review and editing). SFS: Conceptualisation; Data curation; Formal analysis; Funding acquisition; Investigation; Methodology; Validation; Visualisation; Writing (original draft, review and editing).
Funding statement
This work was funded by internal NWU research funds, awarded to SFS.
Competing interests
The authors declare none.
Ethical standards
The authors assert that all procedures contributing to this work comply with the ethical standards of the relevant national and institutional guides on the care and use of laboratory animals. All animal procedures were approved by the Animal Care, Health and Safety Research Ethics Committee (NWU-AnimCareREC; ethics approval numbers: NWU-00763-24-A5 and NWU-00435-21-A5).


 Open access