


Introduction
One of the key functions of elections is that voters can influence the future direction of policy (Enelow & Hinich, Reference Enelow and Hinich1984). However, research suggests that voters often have limited knowledge of the policy positions of political elites (Bartels, Reference Bartels1996; Delli Carpini & Keeter, Reference Delli Carpini and Keeter1996; Grand & Tiemann, Reference Grand and Tiemann2013). As a result, voters often cast votes that do not match their policy preferences – a finding that applies across electoral contexts (Lau et al., Reference Lau, Patel, Fahmy and Kaufman2014), but especially in candidate‐based elections (Bovitz & Carson, Reference Bovitz and Carson2006; Hanretty et al., Reference Hanretty, Mellon and English2021; Highton, Reference Highton2019; Rogers, Reference Rogers2017; Vivyan & Wagner, Reference Vivyan and Wagner2012; von Schoultz & Papageorgiou, Reference Schoultz and Papageorgiou2021; Wheatley & Germann, Reference Wheatley and Germann2024). Recent decades have seen an increasing trend towards the personalization of electoral systems and an increasing number of democracies now allow voters to express preferences not just for parties, but also for individual candidates (Renwick & Pilet, Reference Renwick and Pilet2016). Common examples of such candidate‐based electoral systems include first‐past‐the‐post elections, open‐list proportional representation, mixed‐member systems and single transferable vote. Yet, while providing voters with more choice, candidate‐based elections also increase informational complexity.
Voters' choices in candidate‐based elections have been shown to be significantly influenced by the policy platforms of the parties with which candidates are affiliated (Rahn, Reference Rahn1993). In addition, voters are known to consider several readily observable characteristics of individual candidates, such as their incumbency status, roots in the local community, gender, race or celebrity status (Arter, Reference Arter2014; Fisher et al., Reference Fisher, Heath, Sanders and Sobolewska2015; Gelman & King, Reference Gelman and King1990; McElroy & Marsh, Reference McElroy and Marsh2010; Shugart et al., Reference Shugart, Valdini and Suominen2005). Finally, some voters also consider candidates' policy stances; however, the effects of candidates' policy positions on vote choice are often small and limited to voters with high political interest (Hanretty et al., Reference Hanretty, Mellon and English2021; Rogers, Reference Rogers2017; Wheatley & Germann, Reference Wheatley and Germann2024). At least in part, this is likely because candidate‐based elections create significant additional informational complexity. Individual candidates can and do adopt policy positions that differ from those of their party (Carey, Reference Carey2007; Isotalo et al., Reference Isotalo, Mattila and Schoultz2020; von Schoultz & Papageorgiou, Reference Schoultz and Papageorgiou2021). Therefore, voters need not just learn about the platforms of parties as a whole (which tend to be covered comparatively well by the media) but also individual candidates (which often are not). Against this background, it is then maybe not surprising that the policy positions of individual candidates often play a relatively limited role in candidate‐based elections.
In this article, we consider a digital democratic innovation that could help to improve the correspondence between voters' issue preferences and their choices in candidate‐based elections: candidate‐level voting advice applications (VAAs). VAAs are online voter information tools that are typically launched in the run‐up to elections and have become increasingly popular in recent years (Germann & Gemenis, Reference Germann and Gemenis2019). Upon accessing a VAA, users are prompted to indicate their preferences on a series of policy issues. The application then compares users' stated policy preferences with those of parties or candidates and returns a visual output indicating the extent of issue congruence between a user and the various election contenders (Garzia & Marschall, Reference Garzia, Marschall and Thompson2019). Most prominent VAAs are entirely party‐based, that is, match voters exclusively to parties (e.g., the German Wahl‐o‐Mat or the Dutch Stemwijzer). However, some VAAs also, or even exclusively, match users to individual candidates. Well‐known examples include the Swiss smartvote (Pianzola, Reference Pianzola2014), the Irish WhichCandidate (Costello et al., Reference Costello, Toshkov, Bos and Krouwel2021), and the Finnish Vaalikon (Kauppinen, Reference Kauppinen, Suojanen and Talponen2007).
Both candidate‐ and party‐level VAAs provide voters with easily accessible, personalized information on issue congruence, and therefore have the potential to improve issue representation (Pianzola et al., Reference Pianzola, Trechsel, Vassil, Schwerdt and Alvarez2019; Walgrave et al., Reference Walgrave, Aelst and Nuytemans2008). However, candidate‐level VAAs offer more precise voting advice in elections where voters (also) cast votes for individual candidates as they provide issue congruence estimates specific to candidates. Unlike party‐level VAAs, candidate‐level VAAs therefore capture deviations of candidates from the party line and should, at least in theory, have greater capacity to enhance issue representation in candidate‐based elections compared to purely party‐based VAAs.Footnote 1 However, to what extent this theoretical advantage is realized in practice remains uncertain.
To address this gap, we evaluate the relative effects of candidate‐ and party‐level VAA advice on voters' candidate preferences in the 2021 elections to the Welsh Senedd (i.e., the Welsh Parliament). We do so by integrating a randomized experiment into a real‐world VAA whereby Welsh VAA users were exposed either to candidate‐level VAA advice or to more standard party‐level VAA advice. Our design allows us to, for the first time, test the following hypothesis:
H: Exposure to candidate‐level VAA advice increases the congruence between the policy positions of electoral candidates and voters' candidate preferences compared to party‐level VAA advice.
Our hypothesis and experimental design provide a critical test of the value of candidate‐level VAAs. There is growing observational (Alvarez et al., Reference Alvarez, Levin, Mair and Trechsel2014; Kleinnijenhuis et al., Reference Kleinnijenhuis, Pol, Hoof and Krouwel2019; Walgrave et al., Reference Walgrave, Aelst and Nuytemans2008) and experimental (Germann et al., Reference Germann, Cioroianu, Mendez and Djouvas2025; Garry et al., Reference Garry, Tilley, Matthews, Mendez and Wheatley2019; Germann et al., Reference Germann, Mendez and Gemenis2023) evidence suggesting that party‐level VAAs affect their users' party preferences. The evidence regarding candidate‐level VAAs is more limited, but points in the same direction: voters tend to update their candidate preferences after usage of a candidate‐level VAA (Benesch et al., Reference Benesch, Heim, Schelker and Schmid2023; Tromborg & Albertsen, Reference Tromborg and Albertsen2023). However, while providing useful insights about the effects of VAA usage compared to non‐usage, this literature cannot tell us how the effects of candidate‐level VAAs compare to those of party‐level VAAs. We argue that this question is key for evaluations of the value of candidate‐level VAAs since (1) candidate‐level VAAs tend to be more complex to set up and (2) the advice provided in candidate‐ and party‐level VAAs tends to be highly correlated.
Candidate‐level VAAs tend to be more complex to set up than party‐level VAAs because they multiply the logistical effort in terms of measurement, information retrieval and programming. VAAs are typically deployed before legislative elections, which often feature hundreds or even thousands of candidates. As a result, the set‐up of a candidate‐level VAA tends to require the measurement of the policy positions of many more political actors compared to party‐level VAAs. To manage the resulting logistical effort, the developers of candidate‐level VAAs often resort to candidate surveys, which are more easily scalable compared to their main alternative: expert coding based on publicly available materials such as manifestos or speeches (Gemenis, Reference Gemenis2013). Still, candidate surveys make it necessary to locate contact information for large numbers of candidates, inviting them to participate in the survey, sending reminders, and not uncommonly engaging with candidates on an individual basis to address questions and clarify details. As a result, the measurement process tends to be more labour‐intensive and time‐consuming in candidate‐level VAAs. What is more, candidate‐level VAAs often also require the collection of several pieces of supplementary information that are not needed in party‐level VAAs, such as candidate photos, statements and bios. Finally, programming costs are likely to be higher as candidate‐level VAAs frequently need to generate advice tailored to specific electoral districts (since candidates differ between electoral districts). By contrast, in party‐level VAAs it is generally sufficient to provide a single country‐ or region‐wide policy match, rendering them less complex to set up.
The higher costs associated with candidate‐level VAAs would be worth it if they provided significant additional value. However, it is not clear that this is the case. While candidate‐level VAAs provide more precise advice, the substantive differences to party‐level VAA advice are often relatively minor. Candidates sometimes deviate from their parties, including on highly consequential issues. However, most candidates align with their parties on the majority of issues (Hanretty et al., Reference Hanretty, Mellon and English2021; Vivyan & Wagner, Reference Vivyan and Wagner2012). As a result, the voting advice in candidate and party VAAs is likely to be highly correlated. When considering that the effects of VAA usage observed in previous studies tend to be relatively small to begin with, this raises the question whether the differences between candidate and party VAAs are substantial enough to meaningfully change their users' voting preferences. If yes, then this would mean that candidate VAAs are able to deliver on their promise of enhancing issue representation. But if the answer were no, then this would suggest that the more standard party‐level VAAs provide similar value at lower cost.
Experimental design
To assess the relative performance of candidate‐level VAAs, we integrated a randomized experiment into a real‐world VAA called MyVoteChoice. MyVoteChoice was deployed in Wales on 16 April 2021 and remained freely available until the Welsh Senedd election on 6 May 2021. The basic design of MyVoteChoice was analogous to other VAAs (Garzia & Marschall, Reference Garzia, Marschall and Thompson2019). First, users were asked to answer a few general questions about themselves (e.g., their sex, age and level of education) and then to indicate their opinions on 28 policy statements (e.g., ‘There should be no private sector involvement in the NHS in Wales'). The 28 statements were carefully selected by an expert panel to reflect the most salient policy issues at stake in the election (see Online Appendix Section 1 for the complete list). Users were asked to provide their answers on 5‐point Likert scales ranging from ‘completely disagree’ to ‘completely agree’. Users also had a ‘no opinion’ option. Subsequently, users were exposed to estimates of issue congruence (the ‘voting advice') based on their answers to the 28 policy statements. However, MyVoteChoice differed from many other VAAs in that it not only offered users personalized information on what parties are closest to them on policy issues, but also on which individual candidates are closest to them.
Wales offers an ideal context for our experiment due to the electoral system in place for the 2021 Senedd elections. Specifically, the Senedd was elected using a mixed‐member system, broadly similar to that of Germany or New Zealand. This meant that voters cast two votes: the first was to elect a single representative for each of 40 territorial constituencies and used the Westminster (first‐past‐the‐post) system; the second was to elect 20 additional members based on a proportional top‐up system in which voters vote for regional (closed) party lists. Expressed differently, the first vote was for a single candidate; and the second effectively for a party (Jones & Scully, Reference Jones and Scully2006; Larner et al., Reference Larner, Wyn Jones, Poole, Surridge and Wincott2022). As a result, both the candidate‐ and the party‐level VAA advice were meaningful to Welsh voters. The candidate‐level advice, which featured constituency candidates but not additional candidates from the closed party lists, was most directly relevant for the constituency elections. The party‐level advice, on the other hand, was most directly relevant for the second, proportional vote. However, most candidates belong to parties, so the party‐level advice also had some relevance for the constituency elections.
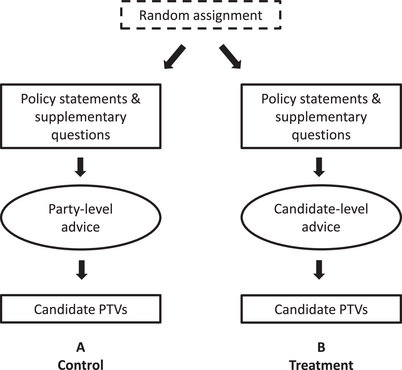
The experimental manipulation consisted of whether users were first exposed to the candidate‐ or the party‐level advice (see Figure 1). By randomizing which type of advice users saw first, we are able to test whether the candidate‐level advice increases the match between users’ voting preferences in the constituency elections and candidates’ policy preferences. To implement this test, users were asked about their vote intentions in the constituency elections immediately after seeing either the candidate‐ or the party‐level advice on the next screen. Specifically, voters were presented with four ‘propensity to vote’ (PTV) questions asking how likely it is that they would vote for the constituency candidates from the four major parties in Wales (Labour, Conservatives, Plaid Cymru and Liberal Democrats) on a scale from 0 to 10. In combination, candidates from those four parties garnered 91.1 per cent of the constituency votes and they were the only parties to gain representation in the Senedd. Finally, users could proceed to the full set of VAA results including both party‐ and candidate‐level bar charts. Online Appendix Section 2 contains screenshots of an example run through the VAA.
Experimental design.

Both the candidate‐ and the party‐level VAA advice took the form of a bar chart which, respectively, ranked the candidates or parties according to the degree of issue congruence. The underlying issue congruence scores were designed with a theoretical range from ‐100 (complete disagreement) to +100 (complete agreement). In practice, congruence scores below −70 or above 80 were rarely achieved. The party‐level advice featured the name of the parties and party logos, while the candidate‐level advice featured candidate names and photos. Issue congruence was calculated using a standard algorithm, which takes into account proximity on issues, preference intensity and the number of ‘no opinions’ (Mendez, Reference Mendez2012).
To identify the policy positions of political parties and constituency candidates, we independently contacted (1) party headquarters and (2) constituency candidates and invited them to provide their positions on each of the 28 issue statements. Candidates and party headquarters were informed that their answers would only be considered if they answered all 28 policy statements and, unlike application users, did not have a ‘no opinion’ option. All four major parties participated in the survey as did another four smaller parties (Greens, UKIP, Abolish the Welsh Assembly, and GWLAD). We manually coded the positions of a ninth party (Reform UK) based on the party's manifesto and leaders' speeches. At the same time, 85 of 309 constituency candidates participated in the candidate survey (28 per cent). Among the major party candidates we study below, the response rate was somewhat better (37 per cent). While a higher response rate would have been desirable, response rates between 20 per cent and 50 per cent are relatively standard in candidate surveys (CCS, 2016, 2022). Users assigned to the control group were shown a ranking of all nine parties while users assigned to the treatment group saw a ranking of 4–10 candidates, depending on the number of candidates in a user's constituency. A majority of users (70 per cent) saw between five and seven candidates. Importantly, if a candidate did not participate in the survey, the ranking was based on the positions of their party. Independent candidates and candidates from tiny parties not included in the party survey were dropped entirely if they did not participate in the candidate survey.
MyVoteChoice was broadly advertised on Welsh news websites and promoted through paid advertisements on Google, Facebook and Instagram. Around 18,000 voters ended up using the application, approximately 10,000 of whom were exposed to the experimental manipulation described above. A little over 6500 users answered at least one PTV question and are, therefore, included in the analyses reported below. We exclude suspected repeated attempts by the same individuals and other invalid entries from all analyses (see Online Appendix Section 3).
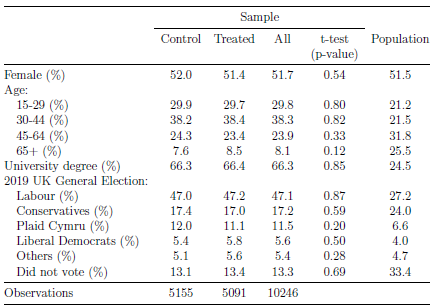
VAA samples tend not to be representative of the broader voter population (Marschall & Schmidt, Reference Marschall, Schmidt, Farrell and Schmitt‐Beck2008; Van de Pol et al., Reference Van de Pol, Holleman, Kamoen, Krouwel and De Vreese2014). Our sample is no exception in this regard and, in particular, overrepresents younger and more highly educated voters (see Table 1). Sampling biases such as these are quite typical of VAAs, which should improve confidence that our results can be generalized to VAA user populations in other contexts. Finally, Table 1 shows that there are no statistically significant differences between the treatment and the control groups in terms of key demographics, as we would expect under random assignment.
Sample descriptives including population reference figures

Note: Population figures are drawn from the 2021 census and official voting records.
Results
As a preliminary step, we begin by briefly exploring differences between the positions of candidates and their parties, and what they mean for the voting advice that is, respectively, provided by the candidate and party VAAs. We only summarize our findings here; see Online Appendix Sections 4 and 5 for the full discussion. In short, we find that Welsh constituency candidates (unsurprisingly) often follow the party line. Still, Welsh parties are not monolithic blocks. The average correlation between the positions of constituency candidates and their parties across all 28 issues included in the VAA is around 0.60 – a high value, but a significant step away from full intra‐party consensus. Candidates were particularly likely to deviate from the party line on selected issues, such as the centralization of emergency services in large hospitals or whether Wales should exercise its power to set income tax rates.
Given the strong correlations between candidate and party positions, it should not come as a surprise that the party‐ and candidate‐level VAAs often suggested similar conclusions. At r = 0.90, the ranking of candidates in the candidate‐level VAA is very highly correlated with the ranking of parties in the party‐level VAA. The correlation decreases somewhat, but remains strong, when restricting the sample to candidates who participated in the candidate survey, and for whom the policy positions were therefore potentially different from their party's (r = 0.73). The underlying continuous advice scores are even more strongly correlated.
Still, despite these high correlations, the candidate‐ and the party‐level VAAs provided substantially different advice to some VAA users. Most notably, we observe significant differences when it comes to the most important element of a VAA: who comes first in the ranking. Specifically, we find that the top‐ranked choice was different for 30 per cent of users. In other words, for about every third user, the candidate‐level VAA recommended candidate A from party B as the closest policy match while the party‐level VAA recommended party C. This share increases in districts where more candidates participated in the candidate survey.
Are those differences substantial enough to alter users' candidate preferences? We begin to test the effect of exposure to candidate‐level versus party‐level VAA advice by running a linear regression explaining VAA users' propensity to vote for a candidate. Since users were presented with four PTV questions, we stack our data in this and all other analyses reported below such that there are four observations per user: one each for the candidate from Labour, the Conservatives, Plaid Cymru and the Liberal Democrats. The unit of analysis is therefore always the user  candidate combination.
We establish the relative effect of exposure to candidate‐level VAA advice by interacting our treatment group indicator with the level of issue congruence between a user and a candidate. The treatment group indicator is coded 1 if a user was exposed to candidate‐level VAA advice and 0 if a user was exposed to party‐level VAA advice. We measure candidate‐level issue congruence using the ranking of candidates in the candidate‐level VAA. We use factorized ranks (i.e., introduce separate binary variables for the closest, second‐closest, third‐closest, etc. candidate) so as to flexibly estimate treatment effects across different levels of issue congruence. Since only the treatment group actually saw the candidate ranking while the control group saw a party ranking, the interactions between treatment status and the factorized ranks reflect the relative effect of exposure to candidate‐level VAA advice. Measuring candidate‐level issue congruence using the continuous −100 to +100 congruence scores instead of factorized ranks leads to substantively similar results (see Online Appendix Section 6). To improve precision, we include candidate fixed effects as well as several covariates, including users' gender, age, educational attainment, interest in the election and past vote choice (see Online Appendix Section 7 for details on measurement). All covariates were measured pre‐treatment (i.e., before exposure to any VAA advice). We cluster standard errors at the user level to account for intra‐user dependencies and use listwise deletion to deal with missing values.
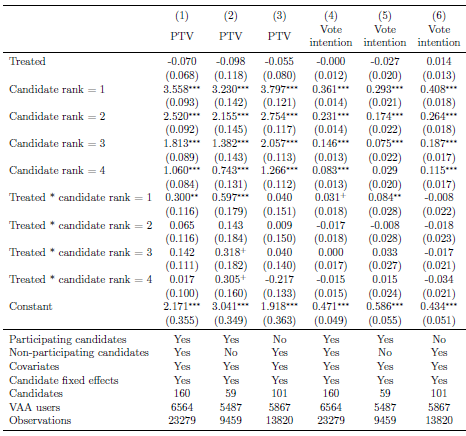
Model 1 in Table 2 shows the regression results while Figure 2 visualizes the implied marginal effects. We find that being exposed to candidate‐ instead of party‐level VAA advice has an effect on users' candidate evaluations. Specifically, we find that exposure to the information that a candidate is one's closest match increases a user's propensity to vote for that candidate by 0.25 points on a 0–10 scale ( ) relative to users of the party‐level VAA (see the blue estimates in the left panel of Figure 2). We also observe some differences for lower‐ranked candidates; however, those differences are smaller and lack statistical significance.
Regression models estimating the effects of exposure to candidate‐level VAA advice versus exposure to party‐level VAA advice on candidate preferences

Note: The table shows linear regression coefficients with standard errors clustered by VAA user in parentheses. PTV = propensity to vote for a candidate; Vote intention = intention to vote for a candidate.

 ,
, 
 ,
, 
 ,
, 
 .
.
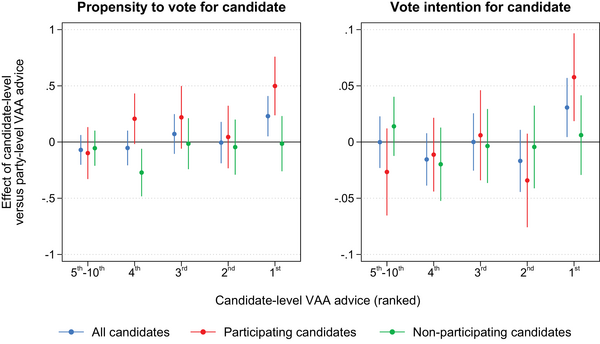
Marginal effects of candidate‐level versus party‐level VAA advice on candidate preferences.
Note: The figure shows the implied marginal effects of exposure to candidate‐level versus party‐level VAA advice in models 1–3 in Table 2 (left panel) and models 4–6 in Table 2 (right panel). The spikes represent 95 per cent confidence intervals.

Our findings suggest that candidate‐level VAA advice increases the match between a user's policy and candidate preferences. Next, we ask what causal mechanism(s) are driving this result. As noted in the introduction, candidate‐level VAAs could improve issue representation because they show substantively different information (i.e., different issue congruence estimates and rankings). However, it is also possible that voters are more likely to follow candidate‐level VAA advice simply due to presentational differences: candidate‐level VAAs show candidate names and photos instead of party names and logos, which voters may see as more relevant when evaluating candidates. Our set‐up allows us to test the relative importance of these two potential mechanisms by subsetting the sample. First, in Model 2 in Table 2 we restrict the sample to candidates who participated in the candidate survey. For these candidates, the policy positions potentially differed from those of their party, and the candidate‐ and party‐level VAA advice therefore also potentially differed. Second, in Model 3 we restrict the sample to candidates who did not participate in the candidate survey. For those candidates, the policy positions were the same as those of their party and the rankings therefore much more similar. However, the presentation was still different.
The results point to the importance of substantive differences in the policy positions of candidates and their parties. When only those candidates are included who participated in the candidate survey, the effect of learning that a candidate constitutes one's best policy match doubles in size to +0.5 points (see the red estimates in Figure 2, left panel). This represents an increase of approximately 15 per cent of a standard deviation – a substantial effect size, especially when considering that previous studies comparing the effects of party‐level VAA advice versus no exposure to VAA advice at all have found effects in the same range (Garry et al., Reference Garry, Tilley, Matthews, Mendez and Wheatley2019; Germann et al., Reference Germann, Mendez and Gemenis2023). Meanwhile, the effects for lower‐ranked candidates also increase in size, but remain statistically insignificant. By contrast, when only candidates who did not participate in the candidate survey are included, most effects decrease in size and the effect of learning that a candidate constitutes one's best policy match can no longer be statistically distinguished from zero (see the estimates in green). These results suggest that it is the differences in policy positions that are driving the relative effect of candidate‐level versus party‐level VAA advice and not the different display format.
So far, we have considered the effects of different types of VAA advice on users' propensity to vote for different candidates and, therefore, their full set of candidate preferences. However, voters ultimately cast a vote for a single candidate in Welsh constituency elections. Arguably, what matters most is therefore whether exposure to candidate‐level VAA advice affects what users consider to be their most‐preferred candidate. In Models 4–6 in Table 2, we therefore repeat the above analysis but estimate the effects on users' binary vote intention. We code the vote intention variable with 1 for the candidate a user assigned the highest propensity to vote for, and 0 for all other candidates.
The results suggest that exposure to candidate‐level VAA advice significantly increases the intention to vote for the candidate that is closest in policy terms. Specifically, when considering all candidates (including those that did not participate in our candidate survey), we find that exposure to candidate‐level VAA advice increases the intention to vote for the top‐ranked candidate from around 60 per cent in the control condition to around 63 per cent in the treatment condition, a difference of about 3 percentage points ( ). This effect increases to +6 percentage points (
 ) when only considering candidates who participated in the candidate survey and for whom the policy positions therefore potentially differed from those of their party (see the right panel in Figure 2). This suggests that exposure to candidate‐level instead of party‐level VAA advice increases voters' probability of voting for the candidate that is closest to them in policy terms by about 10 per cent. Meanwhile, learning that a candidate constitutes the second‐ or third‐best match does not significantly alter users' vote intention. Finally, we again do not find any significant effects when looking at candidates who did not participate in the candidate survey.
We report several additional robustness checks in Online Appendix Section 6 (besides the above‐mentioned check of using continuous instead of ranked congruence scores). First, for better visibility, the above analysis combined candidates ranked 5th to 10th. As a robustness check, we re‐estimate all models with lower‐ranked candidates separately included. Second, we re‐estimate all models while not including any covariates. Third, we drop speeders, defined as users who completed the VAA in less than half of the average completion time. Fourth, we re‐estimate the vote intention models using logistic instead of linear regression. Finally, we re‐estimate the vote intention models while dropping users with tied vote intentions. The results are always substantively similar.
Conclusion
This study assessed the value of candidate‐level VAAs. Contrary to previous studies, we did not estimate the effect of using a candidate‐level VAA relative to non‐usage, but compared the effects of receiving candidate‐level VAA advice with the effects of receiving party‐level VAA advice. We argued that this represents a critical test of the value of candidate‐level VAAs since they tend to be significantly more labour‐intensive to produce than party‐level VAAs, but often suggest qualitatively similar voting advice. This was borne out in our analysis, where we observed high correlations between party‐ and candidate‐level VAA advice. Still, for a significant minority of users, the advice provided was substantively different, and our experimental findings suggest that these differences were sufficient to cause substantially sized changes in VAA users' candidate evaluations.
Our results point to the value of candidate‐level VAAs as a mechanism to strengthen issue representation in candidate‐based elections. Elections in which voters can express preferences not just for political parties but also for individual candidates have become increasingly common in recent decades (Renwick & Pilet, Reference Renwick and Pilet2016). However, a consistent finding from previous research is that issue representation is particularly low in candidate‐based elections. One likely explanation is that information about candidates' issue stances can be hard to find. Candidate‐level VAAs significantly reduce the cost to voters of acquiring information about candidates' issue stances, and the results of this study suggest that exposure to this kind of information can significantly increase issue representation. The provision of candidate‐level VAA advice instead of, or in addition to, party‐level VAA advice, helps voters avoid voting for ideologically more distant candidates, if they so wish.
Our results are based on a randomized experiment (thus strengthening internal validity) which we integrated into a real‐world VAA (thus strengthening external validity) and draw on a large sample (thus mitigating concerns related to statistical power). That said, an important limitation of our experimental design is that we can only measure short‐term effects. Ultimately, all participants are exposed to both party‐ and candidate‐level VAA advice in our set‐up, preventing us from establishing longer term effects. Therefore, future research should explore the durability of the effects we report. There are, however, grounds for optimism. Existing studies of the effects of VAA usage relative to non‐usage suggest that voters remember VAA advice several weeks after usage and that it affects their behaviour at the ballot box (Germann et al., Reference Germann, Cioroianu, Mendez and Djouvas2025; Kleinnijenhuis et al., Reference Kleinnijenhuis, Pol, Hoof and Krouwel2019). Analogously, it seems likely that the relative effects of candidate‐level VAA advice are at least somewhat durable.
Our evidence also pertains to a specific electoral context: Wales. While additional studies are necessary to establish the generalizability of our result, we would argue that it is unlikely that Wales represents a singular case. Welsh voters may have a limited understanding of the policy positions of individual candidates (Wheatley & Germann, Reference Wheatley and Germann2024). But Wales hardly represents an outlier in that regard (Hanretty et al., Reference Hanretty, Mellon and English2021; Rogers, Reference Rogers2017; von Schoultz & Papageorgiou, Reference Schoultz and Papageorgiou2021). If candidate‐level VAAs improve issue representation in Wales, they should therefore principally be able to do the same elsewhere. In particular, candidate‐level VAAs may have advantages in electoral contexts where many candidates compete for the same seats and informational complexity is therefore high. Furthermore, the advantages of candidate‐level VAAs are likely to be pronounced in electoral systems where candidates from the same parties are in competition with each other and, therefore, have incentives to develop a distinct policy profile. Prominent examples of this include open‐list proportional representation (e.g., Finland) or the single transferable vote (e.g., Ireland).
Finally, a key challenge suggested by our study is the achievement of a high response rate in candidate surveys. Despite our best efforts, we ‘only’ achieved a response rate of 28 per cent. While consistent with response rates in other candidate surveys, a higher response rate would clearly be desirable. Fortunately, cross‐country evidence suggests that significantly higher response rates are possible. A striking example is the Swiss VAA smartvote, which regularly achieves response rates of 75–85 per cent in candidate surveys. A key difference between our VAA and smartvote is the lack of precedent in our case while smartvote has been continuously available before major Swiss elections since 2003. Furthermore, smartvote is used by a larger portion of the electorate, providing candidates with stronger incentives to participate in the candidate survey. This suggests that candidate‐level VAAs are best approached with continuity in mind rather than as one‐off projects.
Acknowledgements
For their helpful contributions to the development and dissemination of the MyVoteChoice application, we would like to thank Roger Awan‐Scully, Jonathan Bradbury, Anwen Elias, Jac Larner, Huw Lewis and Laura McAllister. Thank you also to Wales Online for sharing MyVoteChoice on their website and Llyr ab Einion for translating the content of the platform into Welsh. We are indebted to Louis Bromfield for excellent research assistance. An earlier version of this paper was presented at a workshop at the University of Konstanz. Thank you to all participants for their valuable comments and suggestions. We gratefully acknowledge funding from the British Academy (SRG20\200273) and the UK Economic and Social Research Council (ES/W000598/1).
Conflicts of interest statement
We do not have any conflict of interest.
Data availability statement
All data and statistical code necessary for replicating the analyses reported in this paper can be accessed in the Harvard Dataverse at https://doi.org/10.7910/DVN/47XXEN.
Ethics statement
This study was approved by Oxford Brookes University's Research Ethics Committee (L19183).
Table A1: MyVoteChoice issue statements
Figure A1: Example Screenshots
Table A2: Data cleaning
Figure A2: Level of agreement between candidates and their parties on 28 policy issues
Figure A3: Heat maps comparing party‐ and candidate‐ level VAA advices cores
Figure A4: Non‐linear interactions
Table A3: No rank cap
Figure A5: Marginal effects (no rank cap)
Table A4: Models without covariates
Figure A6: Marginal effects (no covariates)
Table A5: Models without speeders
Figure A7: Marginal effects (no speeders)
Table A6: Logistic regressions
Figure A8: Marginal effects (logistic regressions)
Table A7: Removing tied vote intentions
Figure A9: Marginal effects (PTV ties removed)


 Open access